Synergistic Exploitation of Hyper- and Multi-Spectral Precursor Sentinel Measurements to Determine Phytoplankton Functional Types (SynSenPFT)
 Svetlana N. Losa1*
  Mariana A. Soppa1 Tilman Dinter1,2
  Aleksandra Wolanin2
  Robert J. W. Brewin3,4
  Annick Bricaud5,6
  Julia Oelker2
  Ilka Peeken1 Bernard Gentili5,6 Vladimir Rozanov2
  Astrid Bracher1,2
- 1Alfred Wegener Institute, Helmholtz Centre for Polar and Marine Research, Bremerhaven, Germany
- 2Institute of Environmental Physics, University of Bremen, Bremen, Germany
- 3Plymouth Marine Laboratory, Plymouth, United Kingdom
- 4Plymouth Marine Laboratory, National Centre for Earth Observation, Plymouth, United Kingdom
- 5Sorbonne Universités, UPMC-Université Paris-VI, UMR 7093, Laboratoire d'Océanographie de Villefranche, Observatoire Océanologique, Villefranche-sur-Mer, France
- 6Centre National de la Recherche Scientifique, UMR 7093, LOV, Observatoire océanologique, Villefranche-sur-Mer, France
We derive the chlorophyll a concentration (Chla) for three main phytoplankton functional types (PFTs) – diatoms, coccolithophores and cyanobacteria – by combining satellite multispectral-based information, being of a high spatial and temporal resolution, with retrievals based on high resolution of PFT absorption properties derived from hyperspectral satellite measurements. The multispectral-based PFT Chla retrievals are based on a revised version of the empirical OC-PFT algorithm applied to the Ocean Color Climate Change Initiative (OC-CCI) total Chla product. The PhytoDOAS analytical algorithm is used with some modifications to derive PFT Chla from SCIAMACHY hyperspectral measurements. To combine synergistically these two PFT products (OC-PFT and PhytoDOAS), an optimal interpolation is performed for each PFT in every OC-PFT sub-pixel within a PhytoDOAS pixel, given its Chla and its a priori error statistics. The synergistic product (SynSenPFT) is presented for the period of August 2002 March 2012 and evaluated against PFT Chla data obtained from in situ marker pigment data and the NASA Ocean Biogeochemical Model simulations and satellite information on phytoplankton size. The most challenging aspects of the SynSenPFT algorithm implementation are discussed. Perspectives on SynSenPFT product improvements and prolongation of the time series over the next decades by adaptation to Sentinel multi- and hyperspectral instruments are highlighted.
1. Introduction
Phytoplankton supplies over 90% of the nutrition consumed by the higher trophic levels of the marine ecosystem and contributes to 50% of the global primary production (Field et al., 1998). Therefore, it is very important for global biogeochemical fluxes (e.g., carbon) since it fixes atmospheric carbon, CO2, and produces organic carbon compounds. In combination with physical factors, this process helps to determine which part of the ocean is a sink or source of CO2 (Laufkötter et al., 2016). Furthermore, global biogeochemical fluxes can be impacted by the size and composition of phytoplankton, in addition to the structure of the trophic community. Ocean color remote sensing has revolutionized our understanding of these processes in the past decades by providing globally continuous data on surface chlorophyll a concentration (Chla, mg m−3). Chla, however, is an index of total phytoplankton biomass within which each phytoplankton group has a specific morphology and photophysiology and plays a particular role in biogeochemical cycling. For instance, diatoms are the phytoplankton silicifiers, which contribute to most of the primary production and biomass during the spring bloom in temperate and polar regions (Buesseler, 1998). Their importance is related to the efficiency of carbon export through the direct sinking of single cells, key grazing pathways and through mass sedimentation events at the end of the spring blooms when nutrients are depleted (Le Qur et al., 2005). Coccolithophores are the main planktonic calcifiers in the ocean: through building and releasing calcium carbonate plates, coccoliths, coccolithophores make a major contribution to the total content of particulate inorganic carbon in the open oceans (Milliman, 1993; Ackleson et al., 1988). Cyanobacteria regenerate nutrients and, therefore, influence the marine recycled production (Waterbury et al., 1986; Morán et al., 2004).
The ability to observe the phenology and variability of different phytoplankton groups simultaneously is “a scientific priority for understanding the marine food web, and ultimately predicting the oceans role in regulating climate and responding to climate change on various time scales” (Bracher et al., 2017b). Highly resolved information about phytoplankton diversity is also essentially required for a variety of socio-economic applications dealing with predicting harmful algal blooms, eutrophication, hypoxia and other events affecting water quality (see IOCCG 2009). Nearly all global ocean color products presently available are retrieved from multispectral ocean color sensors (IOCCG, 2014; Mouw et al., 2017) providing information on water leaving radiance at number of spectral bands (up to 5 used for ocean color) with the bands width varying from 7.5 nm to 20 nm. Compared to available sensors allowing for more detailed spectral information (hyperspectral), multi-spectral sensors provide data with relatively high spatial (~1 to 4.6 km) resolution and temporal (within a few days) coverage. This spatial and temporal resolution as well as the legacy of the data make them especially attractive for exploiting in phytoplankton diversity and phenology.
Some of the well-known multispectral-based algorithms differentiating phytoplankton groups (IOCCG 2014) are applied to the total Chla (TChla) product that due to strong absorption of Chla (a pigment produced by all phytoplankton species) at 443 nm can be retrieved quite accurately given the spectral resolution and radiometric sensitivity of the ocean color sensors (Mouw et al., 2017). To derive either the fraction or Chla of phytoplankton size classes (PSC) (Uitz et al., 2006; Brewin et al., 2010, 2015; Hirata et al., 2011) or phytoplankton functional types (PFT) (Hirata et al., 2011), these so-called abundance-based approaches use empirical relationships between TChla and in situ marker pigments determined using high precision liquid chromatography (HPLC). The HPLC method itself is based on spectral absorption properties of the specific phytoplankton marker pigments, which allows to identify particular phytoplankton groups. However, the empirical nature of their relation to TChla (usually estimated in a global context) leads to some limitations of the abundance-based approaches: they cannot predict atypical associations, the relationships derived may differ regionally (Soppa et al., 2014), may vary with environmental conditions and thus the model parameters may change in a future ocean state (Brewin et al., 2010; Ward, 2015; Brewin et al., 2017) or if shifts in phytoplankton composition occur without any change in TChla. For instance, the shift from diatom-dominated composition to haptophyte-dominated, as observed in the Arctic Ocean under resent warming conditions and indicated by (Nöthig et al., 2015).
Other so-called spectral-based approaches, besides being different in underlying physical principles and input information (radiance, absorption, backscattering), rely explicitly on spectral signatures of specific PFT or PSC retrieved directly from the input information (or satellite radiometric measurements) (for a comprehensive overview see Mouw et al. 2017) and, therefore, have the potential to discriminate blooms of phytoplankton groups which are not correlated with TChla. These methods also use to some extent empirical relationships by parameterizing their spectral models based on, for example, choosing certain (mean) phytoplankton absorption spectra measured in the field as representative of specific PSC or PFT. Current discretization of multispectral-based inputs (up to five wavebands) limits the ability to differentiate among the optical imprints of different water constituents. Although phytoplankton types have different marker pigments, the differences in the spectral absorption structures can be small, since they also have many pigments in common. The small number of wavelength bands and the broadband resolution of multispectral sensors provide only limited information on the difference of the phytoplankton absorption structures (Bricaud et al., 2004; Organelli et al., 2011). In the study by Organelli et al. (2013) it was highlighted that the use of hyperspectral data (radiometric information with a spectral resolution higher than those coming from the current ocean color sensors) would allow to improve the accuracy of spectral-based phytoplankton composition retrievals. This was also supported by Wolanin et al. (2016b) who applied PFT retrievals to a large synthetically simulated data set testing different band settings for multispectral data and various resolutions of hyperspectral information. The authors showed that hyperspectral data are the most beneficial for various PFT retrievals.
Former and current satellite instruments with a very high spectral resolution (1 nm and higher) provide the opportunity for distinguishing more accurately multiple PFTs using spectral approaches. The capability to retrieve quantitatively major PFTs (even several PFTs simultaneously) based on their absorption properties has been demonstrated with the Phytoplankton Differential Optical Absorption Spectroscopy (PhytoDOAS) method (Bracher et al., 2009; Sadeghi et al., 2012) in the open ocean using hyperspectral satellite data from the sensor “SCanning Imaging Absorption Spectrometer for Atmospheric CHartographY" (SCIAMACHY). Being originally developed for atmospheric applications, hyperspectral sensors like SCIAMACHY do not provide operational water-leaving radiance products as do ocean color sensors. Hence, the PhytoDOAS algorithm was designed to retrieve three PFTs directly from top-of-atmosphere radiances, which requires handling properly strong atmospheric absorbers. Due to the high spectral resolution of SCIAMACHY (<0.5 nm) it is possible to separate high frequency absorptions features of each particular PFT from optical signature of the relevant atmospheric absorbers (broad band effects are accounted for by a low order polynomial). However, the global exploitation of hyperspectral satellite data for ocean color applications has been so far very limited, since the pixel size of these data is very large (30 km by 60 km per pixel) and global coverage by these measurements is reached only within six days. This circumstance constrains any assessment of the retrievals accuracy with in situ point measurements. It also limits the application of hyperspectral-based PFT data products.
The aim of this study was to overcome the aforementioned short-comings of current multispectral PFT products (supplying either dominant groups only, Bracher et al. 2017a, or data products with strong linkage to a priori information) and of current PhytoDOAS-data products (low temporal and spatial coverage). This was done based on the synergistic use of low spatial resolution hyperspectral data with higher spatial and temporal resolution multispectral data. In this study a quantitative estimation of the abundance (given as Chla in mg/m3) of the same (diatoms and cyanobacteria/i.e., prokaryotic phytoplankton) or similar (coccolithophores vs. haptophytes) PFTs are obtained by the PhytoDOAS (Bracher et al., 2009; Sadeghi et al., 2012) and by the abundance-based OC-PFT algorithm (Hirata et al., 2011). Comparison to other satellite products bears the limitation that different aspects of diversity of phytoplankton groupings are compared (see also Bracher et al. 2017a for mismatch between satellite products). Figure 1 summarizes the different classifications of phytoplankton used as PFTs within the study (PhytoDOAS: Bracher et al. 2009, OC-PFT: Hirata et al. 2011). Note that OC-PFT retrieves haptophytes while PhytoDOAS coccolithophores, a sub-group of haptophytes (often dominating). Figure 1 also illustrates how the considered PFTs relate to main PSCs (Brewin et al., 2010, 2015) and size factor (Sf, Ciotti and Bricaud 2006).
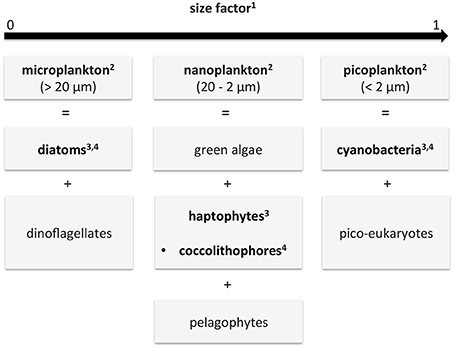
Figure 1. Diagram describing the different phytoplankton classifications given by the different data products of this study and how they relate to each other: functional types (PFTs), size classes (PSCs) and size factor (Sf). In bold are the data used in this study: in the SynSenPFT algorithm (PFTs) and for validation (PSC and Sf). The numbers in the boxes indicate the corresponding references of the products used in this study: 1Ciotti and Bricaud (2006), 2Brewin et al. (2010, 2015), 3Hirata et al. (2011), 4Bracher et al. (2009) and Sadeghi et al. (2012). Note that different PFTs can vary among size classes, e.g., diatoms also can spread into the nanoplankton fraction.
This paper highlights the first development of a synergistic algorithm (SynSenPFT) and shows its potential via evaluation against in situ PFT data (derived from HPLC) and intercomparison with the satellite phytoplankton composition products focusing on the variation in phytoplankton size (Ciotti and Bricaud, 2006; Brewin et al., 2010, 2015) and the PFT products from the NASA ocean biogeochemical model (NOBM, Gregg and Casey 2007). Given the evaluation results, we discuss the potential of this method for future applications to other recent and upcoming sensors data, such as the Ocean Land Color Instrument (OLCI) on Sentinel-3 (in operation since 2016), the hyperspectral sensor Ozone Monitoring Instrument (OMI) on Aura (in operation since 2004) and the TROPOspheric Monitoring Instrument (TROPOMI) on Sentinel-5P to be launched in 2017. Such a synergistic approach shall enable a PFT time series from 2002 onwards which can then be extended by exploiting the data of the hyperspectral global Ocean Color Instrument (OCI) planned by NASA for launching within the “Plankton, Aerosol, Cloud, ocean Ecosystem” (PACE) mission in the early 2020 (see Gregg and Rousseaux 2017).
The structure of the paper is as follows. Section 2 introduces the materials and methods used: the input PhytoDOAS and OC-PFT products with the theoretical description and updates to the algorithms provided; the independent PFT in situ observations and satellite retrievals; a method to evaluate the initial products; details on the synergistic algorithm SynSenPFT and its implementation using the OC-PFT and PhytoDOAS data products. Section 3 provides results and discussions on intercomparison of the initial OC-PFT and PhytoDOAS Chla products, introduces an example of the SynSenPFT product and discusses the SynSenPFT product evaluation. Summary and Outlook are presented in Section 4.
2. Materials and Methods
2.1. Initial PFT Products
2.1.1. Multispectral Retrieval: OC-PFT
The OC-PFT, an abundance based approach developed by Hirata et al. (2011), was applied to multispectral-based satellite-derived TChla (OC-CCI version 2, https://rsg.pml.ac.uk/thredds/catalog-cci.html, OC-CCI 2015) with revised empirical relationships between TChla and PFTs or PSCs to retrieve diatom, haptophyte and prokaryotic phytoplankton Chla. Being an empirical approach, the OC-PFT requires refinement when additional data become available to improve the retrievals for both global and under-sampled oceans, as shown by Soppa et al. (2014). Thus, the OC-PFT algorithm of Hirata et al. (2011) was revised using a larger and more evenly spatially distributed data set of in situ phytoplankton pigment data (Section 2.2.1) compared to Hirata et al. (2011).
Following Hirata et al. (2011) the Diagnostic Pigment Analysis (DPA) developed by Vidussi et al. (2001) and modified by Uitz et al. (2006) was used to derive PFTs and PSCs (microplankton, nanoplankton and picoplankton) from a large global in situ HPLC phytoplankton pigment data set (Table 1 in 2.2.1, detailed description is provided in Supplementary Section 1). Based on the fractions of PFTs (f-PFT) and TChla in each in situ sample, a statistical model of the relationship between TChla and f-PFT was built. Such a statistical model when applied to satellite TChla data allows to retrieve the f-PFT on a global scale. The revised statistical models and the new ones proposed were found to represent well the relationship between the f-PFTs (diatom, haptophyte and prokaryote, in particular) and TChla (see Supplementary Section 2). Based on the results, the model of Soppa et al. (2014) for f-Diatoms with here revised parameters and the new models for f-Haptophytes and f-Prokaryotes based on Hirata et al. (2011), also with revised parameters, were chosen to retrieve the f-PFTs.
Table 1. List of databases, two French campaigns (Atalante-3, KEOPS, and Bonus Good Hope) and German research vessels (RV) Maria S. Merian, Meteor, Polarstern, Poseidon and Sonne.
Given the models, their statistical parameters and OC-CCI TChla, the diatom, haptophyte and cyanobacteria were derived in a fractional form (f-PFT) and then in terms of abundance (mgChla/m3). To retrieve the PFT abundance, the f-PFT is multiplied by the TChla value of each sample/pixel. This OC-PFT Chla data product is provided globally over the ocean with the ~4 km (sinusoidal) spatial resolution over the period of August 2002–March 2012 on a daily time scale.
2.1.2. Hyperspectral-Based Retrieval: PhytoDOAS
The other PFT Chla data products considered in this study are based on the Differential Optical Absorption Spectroscopy (DOAS) method (Perner and Platt, 1979) exploited with respect to phytoplankton absorption properties (PhytoDOAS), as introduced by Bracher et al. (2009). The current PhytoDOAS PFT retrieval of Chla for cyanobacteria (that includes all prokaryotic phytoplankton), diatoms and coccolithophores was obtained with the algorithm PhytoDOAS version 3.3 applied to SCIAMACHY hyperspectral measurements of the radiance at the top of atmosphere (TOA) for the sensor's operation period of August 2002–March 2012. The cyanobacteria and diatom PhytoDOAS retrievals are based on the algorithm by Bracher et al. (2009). For coccolithophores the algorithm by Sadeghi et al. (2012) has been used. Both algorithms, however, have been slightly modified to obtain optimal results for the whole time series. In particular, the changes include the following:
- Data aquired during SCIAMACHY instrument decontamination are excluded in the analysis.
- SCIAMACHY level-1b input data for PhytoDOAS are now version 7.04 data instead of version 6.0.
- The wavelength window for all three PFTs fit factor starts at 427.5 nm instead of 429 nm.
- Coccolithophores fit factors are obtained when fitting simultaneously only diatoms and coccolithophores instead of a triple fit as in Sadeghi et al. (2012) where dinoflagellates were additionally fitted.
- Vibrational Raman Scattering (VRS) is now fitted directly in the blue spectrum following Dinter et al. (2015), instead of in the UV-A region as in Vountas et al. (2007). However, here a shortened wavelength window is used: 450–495 nm instead of 450–521 nm as in Dinter et al. (2015). Moreover, the correction for some instrumental effects varying over time is done with a VRS pseudo absorption spectrum calculated following Vountas et al. (2007) based on a daily solar background spectrum measured by SCIAMACHY instead of using a radiative transfer model (RTM) simulated background spectrum as done in Dinter et al. (2015).
- The PFT Chla are derived from the ratio of the PFT fit factor to the VRS fit factor applying a LUT (Look Up Table) approach. The LUT is derived from the SCIATRAN RTM simulations (Rozanov et al., 2014) and accounts also for changes in solar zenith angle (SZA).
Within the current study we used seven days composites of the PhytoDOAS PFT Chla retrievals interpolated onto a 0.5° × 0.5° grid covering the global ocean on a daily basis. Data are available at http://doi.pangea.de/10.1594/PANGAEA.870486 (Bracher et al., 2017b).
2.2. Independent PFT Estimates Used for Evaluation
2.2.1. In situ Observations
The in situ data set used for the SynSenPFT satellite validation and improvement of OC-PFT approach was built with HPLC pigment data compiled from several databases and individual cruises (Table 1). The spatial distribution of the in situ data set is depicted in Figure S5 (Supplementary Section 3). Chla of PFTs from in situ phytoplankton pigment data was derived using the Diagnostic Pigment Analysis of Vidussi et al. (2001) and Uitz et al. (2006) modified as in Hirata et al. (2011) and Brewin et al. (2015). The weights were revised in accordance to this enlarged in situ pigment data set (Table 1). We refer the reader to the Supplementary Material (Section 1) for more details. The final version of the global data set is available at https://doi.pangaea.de/10.1594/PANGAEA.875879 (Soppa et al., 2017).
2.2.2. Size Factor
The estimate of the dimensionless size factor (Sf), following Ciotti et al. (2002) and Ciotti and Bricaud (2006), is based on the fact that the shape of the phytoplankton absorption spectrum flattens with increasing cell size (“packaging effect”). Sf varies between 0 and 1, which represent the extreme situations (100 % microphytoplankton and 100 % picophytoplankton, respectively). The Sf value thus provides information on the dominant size of the population: values close to 0 (1) indicate dominance of microplankton (picoplankton). Note that the contribution of nanophytoplankton is not explicitly taken into account. Also, for a given population, the shape of the absorption spectrum (and therefore the Sf value) can be affected by photoacclimation to ambient light. On the other hand, as the method is spectral-based, Sf variations are not constrained by Chla variations. The Sf maps have been derived from remote sensing reflectances data from daily OC-CCI (version 2) products covering the same time period as the OC-PFT data set. First, the total absorption coefficients were computed using the Quasi-Analytical Algorithm (QAA) (Lee et al., 2002) version 6. This step was followed by an optimization procedure (revised from Bricaud et al. 2012) which retrieves three independent variables: Sf and two parameters related to Colored Detrital Matter absorption properties. The Sf data were obtained at daily temporal resolution binned globally on a 4 km sinusoidal grid.
2.2.3. Phytoplankton Size Classes
The model of Brewin et al. (2010), using global parameters from Brewin et al. (2015), was used to compute the fractions of total chlorophyll for three PSC (pico- < 2 μm, nano- 2-20 μm and micro-phytoplankton > 20 μm). The model is designed to estimate the fractions of the three phytoplankton size classes as a continuous function of TChla. Based on the work of Sathyendranath et al. (2001), the model assumes small cells are incapable of growing beyond a particular Chla, with an upper limit imposed possibly from a combination of bottom-up (e.g., nutrient control) and top-down (e.g., grazing) processes, and that, beyond this value, chlorophyll is added to a system solely by the addition of larger size classes of phytoplankton (see Raimbault et al. 1988; Chisholm 1992). For further details on the model, the reader is referred to Brewin et al. (2010, 2015). The model was applied to the same daily OC-CCI TChla data set as used for the OC-PFT product, for the period of August 2002 – March 2012, producing global data on the fractions of the three size classes. The PSC data (f-micro, f-nano and f-pico) and TChla were obtained with the same spatial and temporal resolution as used for OC-PFT and Sf. TChla data where then multiplied by f-PSC to obtain the respective Chla of PSC (c-PSC).
2.2.4. Phytoplankton Functional Types from the NASA Ocean Biogeochemical Model
The NOBM (Gregg and Casey, 2007) is a global biogeochemical model with coupled circulation and radiative models (Gregg, 2002). NOBM simulations combine assimilated global SeaWiFS and MODIS Chla data with global data sets on nutrient distributions, sea surface temperature and current conditions to calculate four PFTs: diatoms, coccolithophores, cyanobacteria (as defined in PhytoDOAS) and chlorophytes. NOBM PFT data span from 84° S to 72° N on a 1.25° by 2/3° of longitude/latitude grid. Data were obtained at daily and monthly temporal resolution at http://giovanni.gsfc.nasa.gov/giovanni/ for the same time period as other aforementioned products.
2.3. Initial (Input) Product Evaluation
Given the PFT Chla information based on two distinct algorithms, different not only with respect to temporal and spatial resolution but also with respect to underlying physical and/or statistical principles, it is essential to compare these OC-PFT and PhytoDOAS PFT data against each other to evaluate whether/where and to what extent one could expect the retrieval algorithms to provide similar (different) results. For this purpose, we consider the triple collocation (TC) analysis (Stoffelen, 1998) known as a powerful tool for global scale product evaluation and intercomparisons (Gruber et al., 2016).
The triple collocation method requires analysing three independent products (but, following Zwieback et al. 2012, can be extended to a larger amount of products) describing exactly the same variable state: Chla of PFT in our case. To complete the required triplet, the PFT Chla estimates of the NOBM (Gregg and Casey, 2007) were considered in addition to those of PhytoDOAS and OC-PFT products. Opposed to the PSC and Sf algorithms, the NOBM provides estimations of diatom, coccolithophores and cyanobacteria abundance in terms of Chla as the PhytoDOAS and OC-PFT do (except that OC-PFT provides haptophytes Chla instead of coccolithophores Chla). The TC method is briefly described in the following subsection.
2.3.1. Triple Collocation Analysis
The TC allows to estimate the absolute error variances (), or the root-mean-square deviation (RMSD, σεi) of three collocated data sets (i = {1, 2, 3}, in our case i = {PhytoDOAS, OC-PFT, NOBM}) with unknown uncertainties and assuming uncorrelated errors. Among other assumptions underlying the method are the linearity, stationarity of the signal and errors, and independence of the error from the variability of the measured signal itself (orthogonality). Under the aforementioned assumptions, the σεi can be estimated from the unique terms covariance matrix (McColl et al., 2014) (Q11, Q12, Q13, Q22, Q23, Q33):
It is worth mentioning that the TC analysis is usually used for calibration purposes (Stoffelen, 1998; Vogelzang et al., 2011). The estimates provided by the analysis are normally so-called “unscaled” and include also any biases, if available, of the particular data product with respect to the “truth". The “truth” is determined by the “joint covariance” observed by all three analyzed data products. Here we consider the “unscaled” uncertainties σεi as a merit of difference between the distinct features of PFT Chla temporal variability observed and described by the satellite retrievals (PhytoDOAS and OC-PFT) and NOBM numerical model over a particular time period.
2.4. Synergistic Product
The synergistic (SynSenPFT) product is obtained as Chla for diatoms, coccolithophores and cyanobacteria presented globally on a 4 km sinusoidal grid on a daily basis over the period of August 2002 – March 2012.
2.4.1. SynSenPFT Algorithm
The SynSenPFT combines OC-PFT and PhytoDOAS level-3 Chla products with an optimal interpolation (OI, Gandin and Hardin, 1965). In a generalized form, the OI method is formulated as following:
xa denotes state analysis, in our case SynSenPFT product; xb is a background, for the particular application it is the OC-PFT product. y refers to observations – PhytoDOAS. H is the observation operator projecting OC-PFT into PhytoDOAS space. W is a weight matrix reflecting data error statistics.
In terms of Kalman-type filtering, the synergistic estimates of x or so called state vector analysis xa is expressed as:
where and denote the analysis (SynSenPFT) and OC-PFT, respectively, at certain time tn and OC-PFT grid points, yn is the PhytoDOAS observations available at tn, and K is the so-called Kalman gain:
Here and R are the OC-PFT and PhytoDOAS error covariance matrices, respectively.
As seen, the SynSenPFT is an update of OC-PFT with PhytoDOAS values weighted in accordance to our degree of belief to both initial-input data products. Note that within the current version of SynSenPFT algorithm the update is done for every subpixel of OC-PFT within a PhytoDOAS pixel (Figure 2). Thus, SynSenPFT in every OC-PFT sub-pixel on average is nudged toward PhytoDOAS values as close as allowed by the prescribed R matrix (considered diagonal for simplicity). The SynSenPFT spatial distribution within the PhytoDOAS pixel is based on the information carried by that reflects OC-PFT spatial structure if the matrix is estimated based on the OC-PFTs covariances within the PhytoDOAS grid cell.
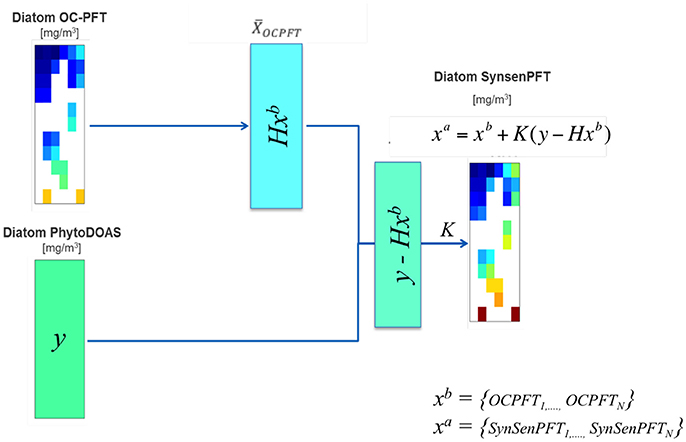
Figure 2. Diagram exemplifying the SynSenPFT algorithm (Equations 2–4) that updates the PFT information from each OC-PFT sub-pixel (xb) within a PhytoDOAS pixel given the PhytoDOAS Chla (y) and a priori error statistics introduced in K, which results in SynSenPFT Chla (xa) at each OC-PFT sub-pixel.
As an illustration, Figure 3 shows examples of SynSenPFT diatom Chla (on the OC-PFT sub-grid) within three different PhytoDOAS pixels. As seen, on average within a PhytoDOAS pixel, SynSenPFT Chla is closer to PhytoDOAS retrievals, subject to assumed PhytoDOAS error statistics (an absolute error value of 0.4 mgChla m−3, given on Figures 3a–c, or the relative error of 40% (0.15 mgChla m−3), given on Figure 3d. Comparing Figure 3c and Figure 3d one can conclude about the sensitivity of SynSenPFT product to the assumed PhytoDOAS errors: the more accurate PhytoDOAS PFT product is assumed, the more it influences the SynSenPFT Chla estimates. In comparison with OC-PFT, the spatial variability of the SynSenPFT Chla will be smoother, however. In this study as absolute PhytoDOAS errors approximating the R matrix, we assume 0.4, 0.3, and 0.1 mgChla m−3 for diatom, coccolithophores and cyanobacteria, respectively.
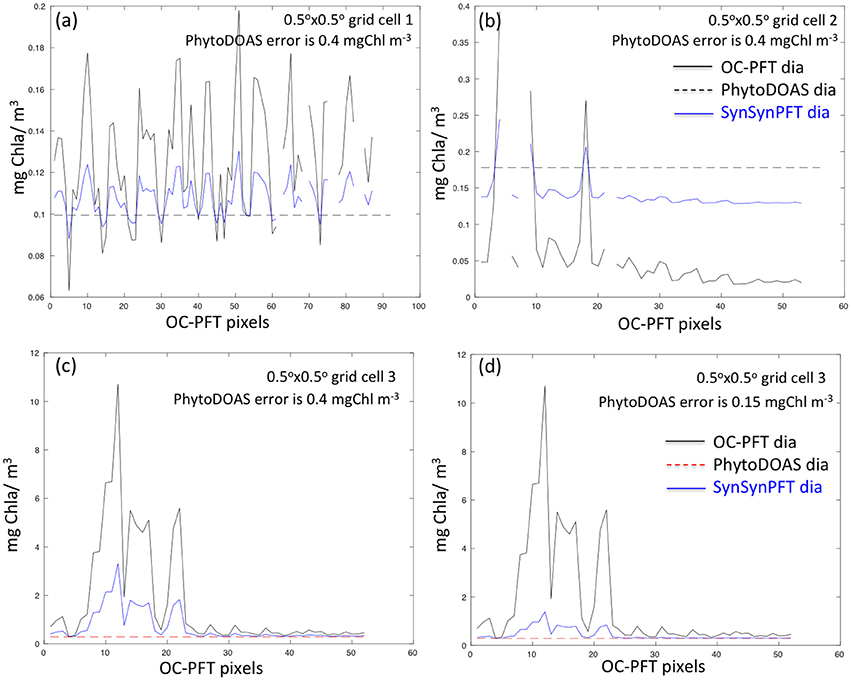
Figure 3. Examples illustrating variability of OC-PFT and updated (nudged toward PhytoDOAS) SynSenPFT diatom Chla within three PhytoDOAS pixels with different OC-PFT Chla variability, PhytoDOAS Chla on average either lower (a,c) or higher (b) than OC-PFT Chla and given PhytoDOAS error statistics (0.4 mgChla m−3 for a–c). (c,d) depict SynSenPFT diatom Chla obtained for the same PhytoDOAS grid cell but assuming different PhytoDOAS errors: 0.4 mgChla m−3 (c) and 0.15 mgChla m−3 (d). Thus, lower panels illustrate the sensitivity of SynSenPFT diatom Chla product to the assumed PhytoDOAS error statistics.
3. Results and Discussions
3.1. Initial Product TC Analysis
Here we present the results of the TC analysis carried out with respect to OC-PFT, PhytoDOAS, and NOBM PFT data products. Figure 4 shows an example of the spatial distribution of PhytoDOAS, OC-PFT, and NOBM unscaled uncertainties for diatom, coccolithophore (haptophytes for OC-PFT) and cyanobacteria Chla, calculated with the TC analysis for each 0.5° by 0.5° box based on PhytoDOAS, OC-PFT and NOBM PFT information over the period of 2003–2009. When comparing σε of PhytoDOAS diatom (Figure 4A) against those of OC-PFT (Figure 4B) and NOBM (Figure 4C) one can notice much higher PhytoDOAS diatom Chla temporal variability all over the World Ocean, except for Northern Hemisphere mid- and high latitudes and a tiny belt around the Antarctica, while the OC-PFT diatom Chla product reveals higher σε in the upwelling regions and in the Arabian Sea (Figure 4B). The σε of PhytoDOAS coccolithophores Chla (Figure 4D) also exceeds similar statistical estimates of NOBM coccolithophores (Figure 4F) and OC-PFT haptophytes products (Figure 4E), now even also in the high Northern latitudes, and the OC-PFT shows higher haptophytes Chla ranges in the Arabian Sea and upwelling regions (Figure 4E). However, NOBM has very low coccolithophores Chla σε (also compared to NOBM diatom Chla σε) all over low- and mid latitudes. The spatial distribution of cyanobacteria σεi is depicted on Figures 4G–I. Opposed to OC-PFT, NOBM, and PhytoDOAS show larger cyanobacteria Chla deviation in the oligotrophic and equatorial regions with higher σε values in the PhytoDOAS data product (Figure 4G). These are the regions where we can expect most of the differences between the OC-PFT and synergistic cyanobacteria Chla.
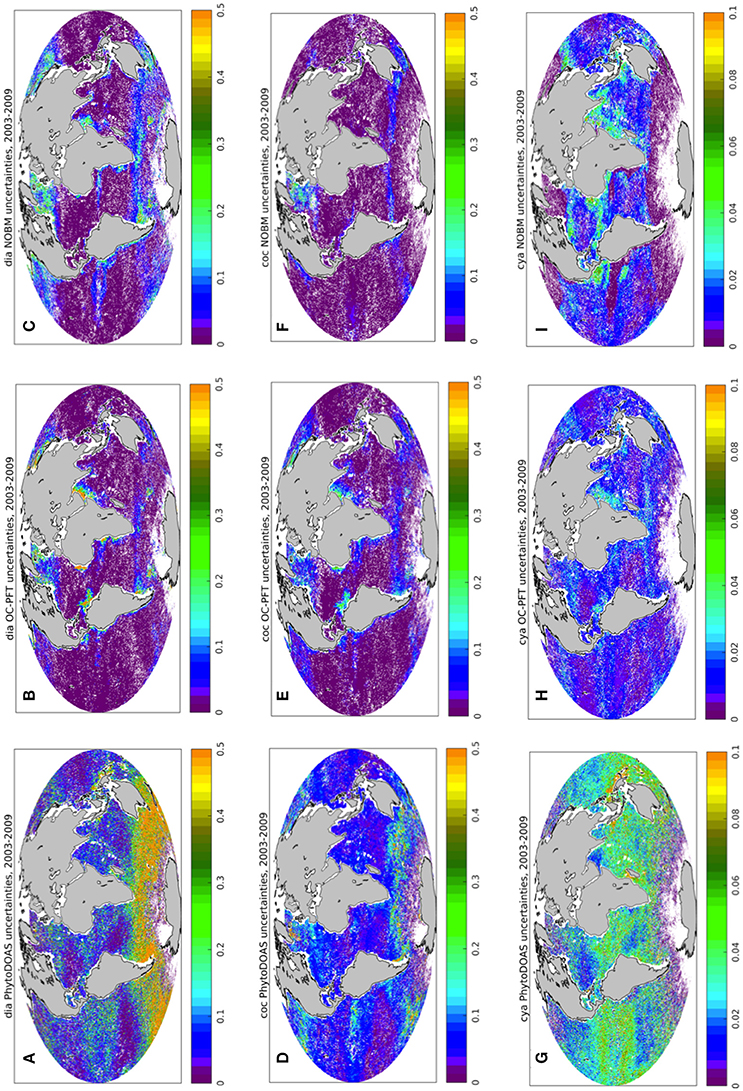
Figure 4. Triple collocation analysis: spatial distribution of PhytoDOAS (A,D,G), OC-PFT (B,E,H), and NOBM (C,F,I) unscaled uncertainties σε (mg m−3) for diatom Chla (A–C), coccolithophore Chla (D–F), and cyanobacteria Chla (G–I) based on the time period of 2003–2009. White dots are the grid points with negative and/or with no satellite information available.
3.1.1. Approximation of Prior Error Statistics
As concluded from subsection 2.3.1, the performance of the SynSenPFT strongly depends on the plausibility of the assumed quality of the input data products approximated by the R and matrices. As mentioned above, matrix can be (was) presented by the OC-PFT Chla covariances within a PhytoDOAS pixel. However, per se, we can say little about the quantitative estimates of PhytoDOAS errors to properly approximate the R matrix. The following is dedicated to the opportunity and challenges of the R matrix specification.
The PhytoDOAS error covariance matrix can be provided by using the TC analysis (Crow and van den Berg, 2010), since the TC analysis in general provides quantitative information about quality of the data product considered (Stoffelen, 1998; Gruber et al., 2016). Nevertheless, the estimates presented in Figure 4 and discussed in 2.3.1 can be considered only as the merit of differences between the collocated products unless the quality of at least one data product is well-known. Not as an attempt to find a possible scaling for our TC estimates, but rather for an additional evaluation of our TC analysis, the OC-PFT TC unscaled uncertainties were compared against statistics of the OC-PFT match-up with in situ observations. Figure 5 illustrates the mean absolute error (MAE) of OC-PFT diatom (Figure 5A), haptophytes (Figure 5C), and cyanobacteria (Figure 5E) Chla relative to in situ Chla calculated for the biomes determined following Hardman-Mountford et al. (2008). In addition, it presents the ratio of the MAE to the OC-PFT TC-based uncertainties (Figures 5B,D,F). The ratio values less than 1 indicate that the uncertainties obtained with the TC overestimate the product error statistics while the values larger than 1 would correspond to the situation with the TC uncertainties being underestimated. For instance, the TC-based OC-PFT unscaled uncertainties for diatoms (haptophytes) are overestimated (underestimated) in the “high Chla” biome (Hardman-Mountford et al., 2008) covering, for instance, southwest mid-to-high northern latitudes, southwest Southern Ocean, the edge of equatorial upwelling regions, the Arabian Sea and the shelf seas of South-East Asia (Figure 5). In the “low-intermediate Chla” biome, the TC σε for diatoms and haptophytes are in agreement with the MAE estimates. The MAE of OC-PFT diatom Chla is higher than TC σε in the “high-intermediate Chla” biome (for example, in equatorial areas outside the upwelling regions and in the Pacific, easten Atlantic and Indian Ocean sectors of the Southern Ocean). As seen from Figure 5F, the TC estimates for OC-PFT cyanobacteria are highly underestimated all over the ocean. That might indicate that PhytoDOAS overestimates cyanobacteria Chla. Following (Gruber et al., 2016) an additional evaluation of the TC estimates was done (not shown) with the fractional mean-squared-error (fMSEi) that can be also calculated within the frame of the triple collocation analysis. The fMSEi criterion explains the existence of white dots in Figure 4, correspondent to negative , by too low values of the product noise to the true signal ratio, which shows that the joint variability of all three products does not always exist (Supplementary Section 4, Figure S6). Or due to underestimation of the variability of one collocated triple or because of some violations of the assumptions essential for TC, the joint variability might not represent the truth. Before treating the TC estimates as product uncertainties, a more detailed evaluation of the plausibility of our TC-based PFTs uncertainties as well as the product evaluation with respect to violating the assumptions underlying the method might be needed. For instance, errors of NOBM PFT estimates and OC-PFT can be correlated since both are based on multispectral satellite data from the SeaWiFS and MODIS sensors: OC-PFT algorithm input OC-CCI Chla product includes in addition to MERIS, also SeaWiFS and MODIS information; NOBM assimilates SeaWiFS and MODIS TChla.
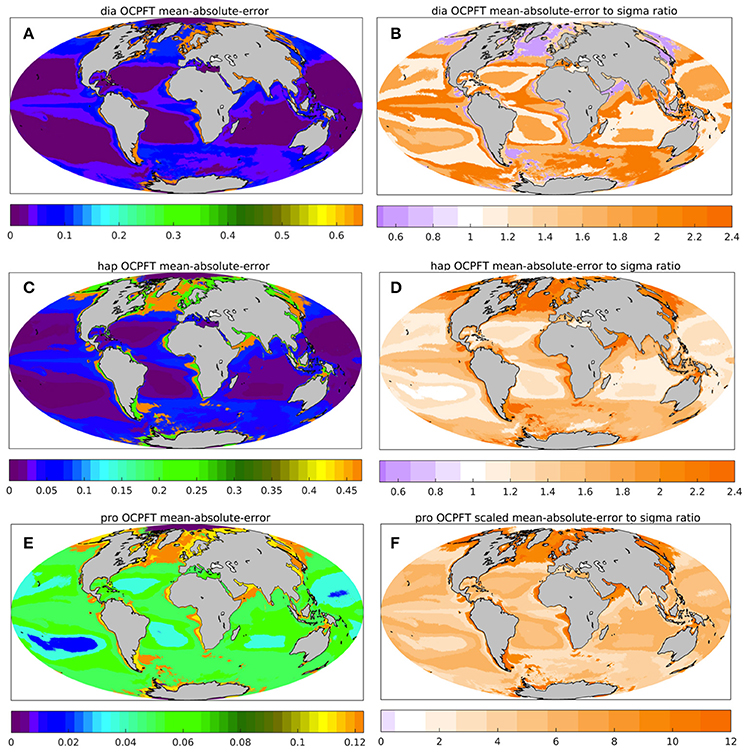
Figure 5. Additional statistics assessing OC-PFT against in situ on the biomes grid by Hardman-Mountford et al. (2008): the mean-absolute-error (MAE, mgChla m−3, A,C,E) and the ratio of MAE to the OC-PFT unscaled uncertainties obtained based on the TC analysis (B,D,F) for for diatom (A,B), haptophytes (C,D) and prokaryotes (E,F).
The more detailed assessment of the TC analysis of SynSenPFT initial input product would allow in future to use the TC estimates for approximating R matrix. In this study, the values of the R diagonal are assumed constant and partly based on the current TC results. It is worth commenting on representation/representativeness errors due to ‘physical’ mismatch between the initial algorithms (Bracher et al., 2017a), and up-(down-)scaling the products when regridding. These errors also impact the TC estimates. In data assimilation applications (Losa et al., 2012, 2014; Yang et al., 2016) to account for such representation errors as well as for any possible errors in the approximation, the assumed σεi is normally enlarged. So did we in our study: the assumed errors exceed the PhytoDOAS unscaled uncertainties discussed in 2.3.1.
3.2. Example of SynSenPFT Product
Figure 6 illustrates the monthly mean SynSenPFT Chla product for diatom, coccolithophores and cyanobacteria in September 2006. Figure 7 depicts absolute differences between SynSenPFT and OC-PFT averaged over the September 2006 and shows where the synergistically combined PFT information are influenced by PhytoDOAS product and over which regions OC-PFT dominates. For instance, by directly comparing Figures 6A,C, 7A,C one can conclude that at high latitudes SynSenPFT diatom and cyanobacteria estimates contain mostly the OC-PFT signal (because of low dia-(cya-)PhytoDOAS coverage in these regions). Note that the spatial distribution of the mean absolute differences (MAD) between SynSenPFT and OC-PFT Chla corresponds to either PhytoDOAS or OC-PFT TC uncertainties patterns (Figure 4). We remind that the TC uncertainties are considered as a merit of differences between OC-PFT and PhytoDOAS (and NOBM) products, therefore they indicate per se the areas where the largest updates of OC-PFT Chla by values of PhytoDOAS are expected. Consequently, the dia-SySenPFT Chla differ from OC-PFT estimates most of all in the Southern Ocean (except for the very high latitudes), in the Arabian Sea and north of Australia. The mean differences reach 0.5 mgChla m−3. The differences between coc-PhytoDOAS and OC-PFT haptophytes Chla are also in agreement with the TC estimates, but hardly exceed 0.2 mgChla m−3, and are most apparent in the Equatorial Pacific, southwest of Africa, in the Arabian Sea and north as well as southeast of Australia. For the considered time period of September 2006 relatively high MAD values for cyanobacteria are distributed over the tropical areas with a maximum of 0.05 mgChla m−3 in the equatorial upwelling systems, in the northwest part of the Indian Ocean and north of Australia.
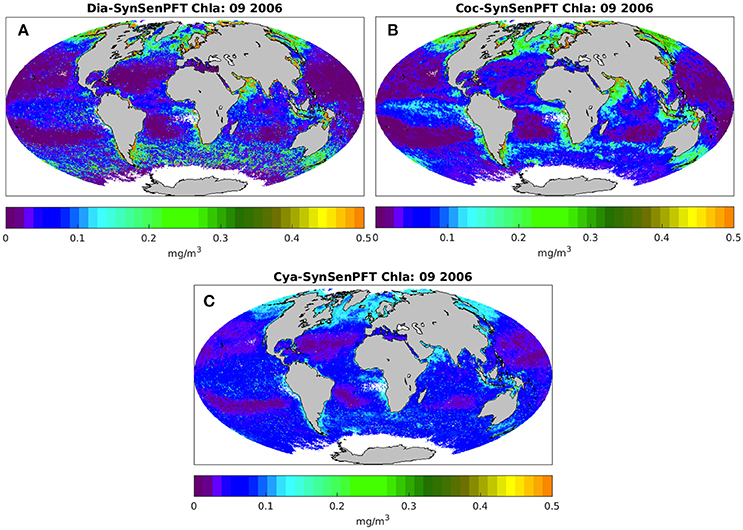
Figure 6. Monthly mean SynSenPFT Chla product of diatoms (A), coccolithophores (B), and cyanobacteria (C) for September 2006.
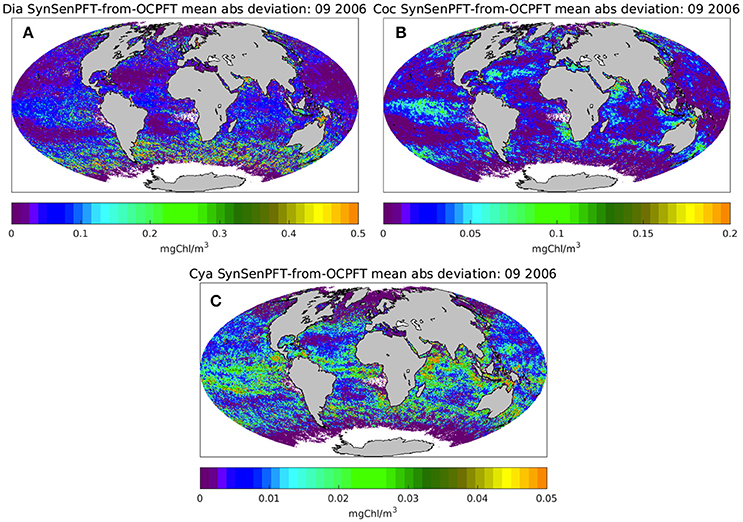
Figure 7. Monthly mean absolute deviation of SynSenPFT Chla from OC-PFT Chla for diatoms (A), coccolithophores (B), and cyanobacteria (C) in September 2006.
3.3. SynSenPFT Product Evaluation
The SynSenPFT Chla products were evaluated by comparison with in situ observations, other satellite PFT/PSC products and the NOBM model simulations over the period of August 2002–March 2012.
3.3.1. Match-Ups with In situ Observations
Daily SynSenPFT products at ~4 km spatial resolution were matched with samples from the global in situ validation dataset. The in situ dataset was matched with satellite data from OC-CCI Chla product (but restricted to the life time of SCIAMACHY) at daily temporal resolution and satellite values were retained when located at the same date within a distance of 4 km from the in situ measurement. Note: for OC-PFT model development the in situ pigment data not matching the OC-CCI TChla were used, such that the validation data are independent of the data used to train the model. In the case of more than one in situ sample within one satellite pixel, respective match-ups were treated independently. To finally derive high quality match-ups, those were considered valid where the coefficient of variation of the 3 x 3 pixels of satellite TChla (OC-CCI) around each in situ was lower than 0.15. This is a similar quality control as applied by Werdell et al. (2007), but here we applied it to TChla instead of Rrs data. In addition, only match-ups above a threshold of 0.01 mgChla m−3 were selected. The rationale for this threshold is that the surface Chla values encountered in the clearest ocean waters (south Pacific gyre) were found to be in the range 0.01–0.02 mg m−3 (Morel et al., 2007). Therefore, values below 0.01 mg m−3 may be considered as questionable.
To compare the satellite SynSenPFT products and in situ Chla of the PFTs the mean absolute error (MAE), root mean squared difference (RMSD), un-biased RMSD and bias (as formulated in Sá et al. 2015) were used. The determination coefficient, slope and intercept (type II regression based on log10 data) were also computed. Figure 8 and Table 2 present the results of the validation of SynSenPFT Chla against in situ PFT Chla considering the data all over the global ocean. High R-square values around 0.5 were achieved for coc-SynSenPFT and dia-SynSenPFT with a slightly better slope, intercept, MAE, and RMSD for coc-SynSenPFT, but lower bias for dia-SynSenPFT. The dia-SynSenPFT RMSD and bias are comparable to the statistics presented by Brewin et al. (2017) for different optical water types in the North Atlantic (RMSD varying from 0.29 to 0.60, bias varying from −0.30 to 0.23). For all three PFTs, the estimated SynSenPFT bias is less than reported in the study by Gregg and Rousseaux (2017).
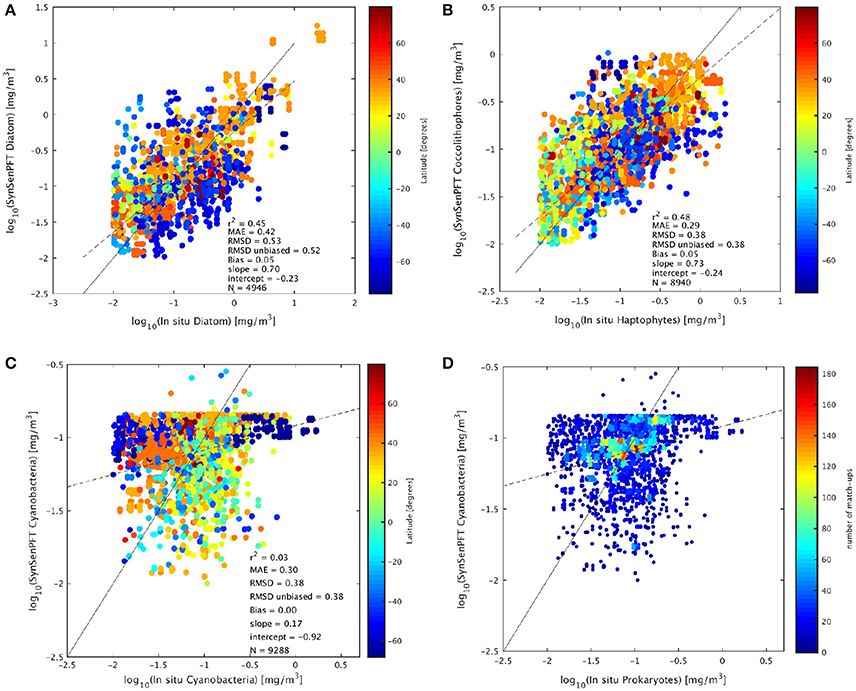
Figure 8. Comparison of in situ Chla and SynSenPFT Chla for diatom (A), haptophytes against coccolithophores (B), and prokaryotes vs. cyanobacteria (C). The continuous line represents the 1:1 line and the dashed line the type II linear regression. (D) Depicts the same as (C), but colored in accordance with the matchups density. The statistical analysis was performed in log10 space.
Table 2. SynSenPFT match-ups statistics.
Looking at the grouping of diatom match-ups according to latitude (Figure 8A), we can note the underestimation of diatom Chla at high southern latitudes, which could be related to the general underestimation of TChla when applying standard algorithms to Southern polar areas (Johnson et al., 2013). It is worth keeping in mind that south of 65° most of the dia-SynSenPFT values are derived from OC-PFT since PhytoDOAS pixel based information was sparse at these latitudes and low SZA.
Figure 8C shows that correlation is not significant for cya-SynSenPFT to in situ PFT data which may be due to the limited spread of the in situ PFT as compared to the two other PFT products evaluated. Cya-SynSenPFT Chla reaches a maximum concentration at −0.8 log10Chla (0.18 mg Chla/m3). This fact implies a high weighting toward OC-PFT, since this feature is an artifact of the OC-PFT approach. Nevertheless, the amount of in situ cya Chla exceeding 0.18 mg Chla/m3 is quite small (see Supplementary, Figure S7). Figure 8D depicts the same as Figure 8C but with the density of cya-SynSenPFT match-ups as a background. From this figure panel one can see that the most frequent or dense match-ups are located close to the 1:1 curve. As a result, the MAE and RMSD are lower for cya-SynSenPFT than for dia-SynSenPFT.
3.3.2. Comparison Against Satellite Sf and PSC and Model PFT
The comparison with other satellite-derived products and model simulations was performed by investigating time-latitude Hovmöller diagrams (longitudinal averaged from 180°W to 180°E). All analyses were based on monthly averages. Monthly averages of SynSenPFT were calculated from daily binned data averaged in log10 space as Chla data are typically log-normally distributed (Campbell, 1995). Monthly averages of Sf and c-PSC were calculated from daily data onto a 0.25° spatial grid. Monthly NOBM PFT Chla were resampled to 0.25° spatial grid in log10 space. Those intercomparison data representing Chla concentration, as the NOBM PFT and c-PSC products, were averaged in log10 space, while Sf were averaged in linear space.
The Hovmöller diagrams are presented in Figures 9–12, on the left, together with the climatological annual cycle, on the right. Generally the NOBM model results data are available year round at every latitude between 72°N to 80°S as opposed to the satellite products (SynSenPFT Chla, c-PSC, and Sf) which are limited by light availability and cloud-, ice-, glint, foam free conditions. While NOBM and SynSenPFT provide Chla for exactly the same PFT, c-PSC shows the Chla of the respective size class (micro, nano, pico), and Sf and 1-Sf show the contribution of pico- and microplankton, respectively, to total Chla.
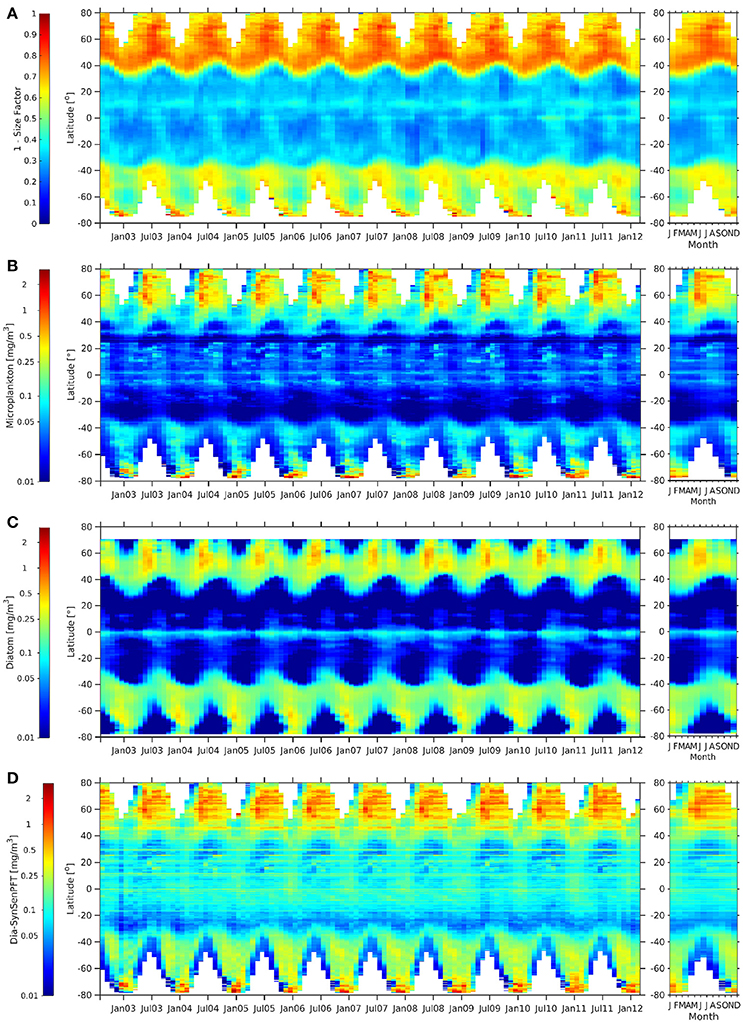
Figure 9. Hovmöller diagrams of 1-Sf (Ciotti and Bricaud, 2006) (A), c-micro [mg m −3] (B), dia-NOBM [mg m −3] (C), and dia-SynSenPFT [mg m −3] (D) from August 2002 to March 2012 (left panel) together with the corresponding climatological annual cycle (right panels).
When comparing c-micro and dia-NOBM (Figures 9B,C) directly, c-micro has in general higher Chla between 80°N and 40°S as expected since c-micro include not only diatoms but also dinoflagellates. However, south of 45°S dia-NOBM is higher than c-micro. Dia-SynSenPFT (Figure 9D) follow rather strictly the patterns of c-micro but values are higher in low and mid latitudes and the gyres are not as pronounced as for the c-micro and dia-NOBM. At the polar regions c-micro and dia-SynSenPFT show similar ranges. However, in the Arctic Ocean dia-SynSenPFT spread for longer in the year (Apr-Oct), while higher values are rather limited to Apr-Jun for c-micro. In the Southern Ocean dia-SynSenPFT and dia-NOBM have consistently higher Chla than c-micro. The 1-Sf (Figure 9A) shows a weaker seasonality and indicates high contribution of microplankton throughout the observed seasons for the Arctic which seems to agree more with the dia-SynSenPFT results than the c-micro. For the Southen Ocean region 1-Sf shows rather an inverse seasonality as opposed to Chla given by the other three products. The former peaks at 40°S to 60°S in late winter to spring (Aug to Oct), while the others show highest Chla in summer (Dec-Feb) which is, e.g., in agreement with the diatom phenology studied by Soppa et al. (2016). It is recalled here that (1-Sf) represents a relative contribution of microplankton to total biomass, therefore its seasonality can be different from that observed for the other products which consider the magnitude of biomass in terms of Chla.
Similar distributions can be found between coc-SynSenPFT and c-nano (Figure 10). Values are lower in most parts for coc-SynSenPFT, which is probably related to the fact that coccolithophores are only part of c-nano. C-nano might also include green algae, Phaeocystis sp. and small diatoms for instance. However, coc-SynSenPFT values are a bit higher at 20°N to 40°N. Opposed to that, large differences are observed between c-nano and coc-SynSenPFT when compared with coc-NOBM (Figure 10). Especially south of 45°S coc-NOBM shows absents of coccolithophores which is in disagreement not only to coc-SynsenPFT, but also to findings by O'Brien et al. (2013). They show that coccolithophores have been sampled during many research campaigns up to 80°S. While coc-SynSenPFT and c-nano show elevated values at equator with similar seasonality, coc-NOBM is low, but enhanced north and south of the equator as opposed to the two other products. However, it is worth pointing out that the NOBM is the product that is not purely satellite-based (though it assimilates some satellite data) so it may not be surprising that it shows the most different patterns. All three products (c-nano, coc-SynSenPFT and coc-NOBM) show similar seasonal cycles at around 60°N.
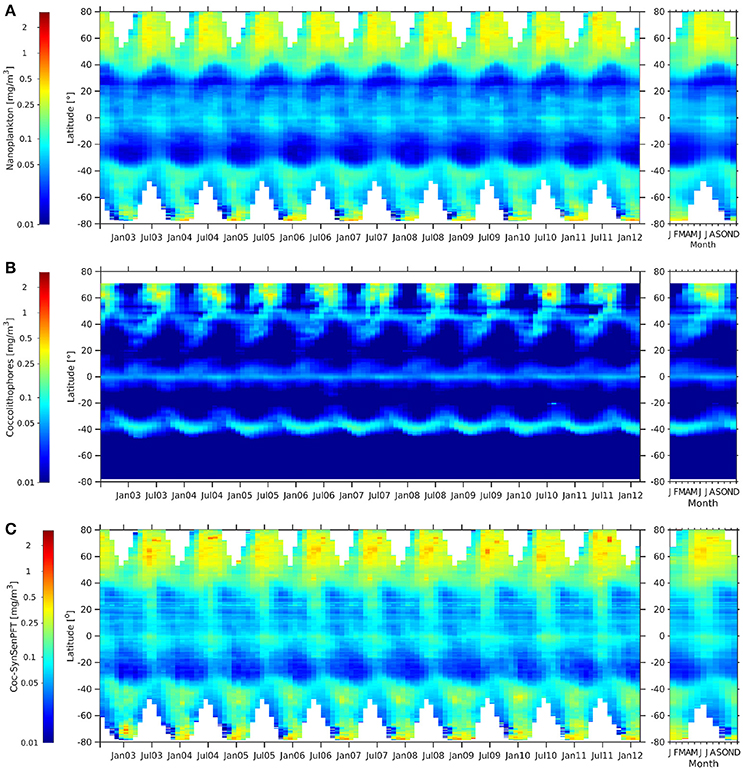
Figure 10. Hovmöller diagrams of c-nano [mg m −3] (A), coc-NOBM [mg m −3] (B), and coc-SynSenPFT [mg m −3] (C) from Aug. 2002 to Mar. 2012 (left panel) together with the corresponding climatological annual cycle (right panels).
Generally c-pico and cya-SynSenPFT (Figure 11) show very similar patterns and a low chl-a conc. range. Both products show clear maxima in the Arctic and nearly as high values in the Southern Ocean and at the equator, while values in the subtropics are low, especially in the gyres. They show a similar seasonality at the mid- and high latitudes as for the c-nano and coc-SynSenPFT products. Opposed to that, the cya-NOBM shows quite different patterns: values are very low at latitudes higher than the subtropics and show also a minimum at the equator. Oligothrophic areas at around 20° to 35° are seen by low values in all three products. However, there, cya-NOBM Chla increases from January till May, while for c-pico and cya-SynSenPFT an increase in Chla is observed from June till September (Figure 11, right panels). Again, concentrations of PSC, in this case c-pico are higher than cya-NOBM, mainly north of 40°S, south of 40°S and just south of 0° (Figure 11). Between 0° and 40°N and 5°S and 40°S, cya-NOBM has larger concentrations. Cya-NOBM is nearly absent in latitudes higher than 40° as a result of the used cyanobacteria growth parametrisation with the growth rate decreased in cold waters (Gregg and Casey, 2007).
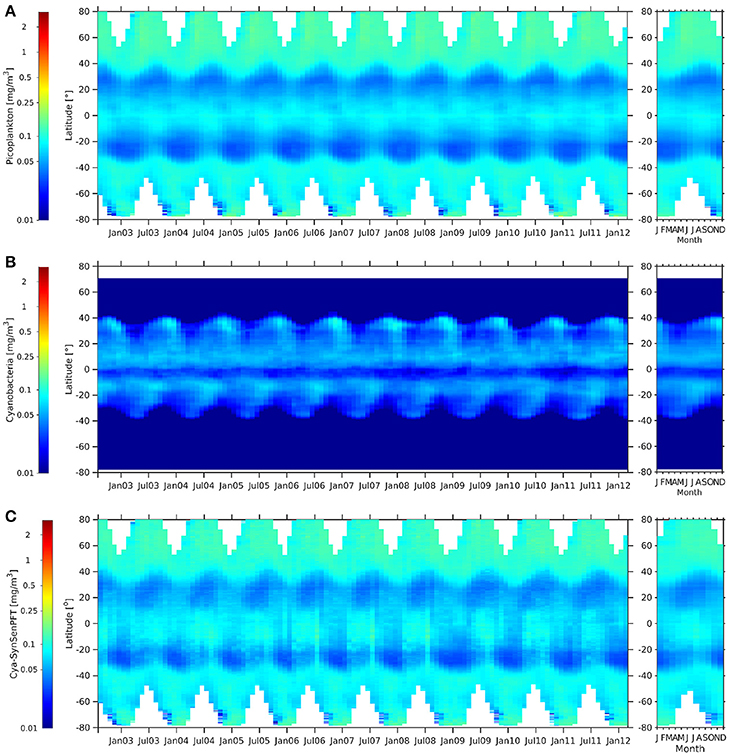
Figure 11. Hovmöller diagrams of c-pico [mg m −3] (A), cya-NOBM [mg m −3] (B), and cya-SynSenPFT [mg m −3] (C) from August 2002 to March 2012 (left panel) together with the corresponding climatological annual cycle (right panels).
Sf (Figure 12) indicates clearly the dominance of picoplankton for the tropical waters which is reflecting what can be concluded from comparing globally the three c-PSC and the three SynSenPFT products among each other. The Hovmöller diagram for Sf (Figure 12A) also shows that phytopicoplankton contribution is higher (especially during summer) in the Antarctic than in the Arctic. Similar could be concluded by looking at the Hovmöller plots of f-Cya-SynSenPFT (Figure 12B) calculated as a ratio of cya-SynSenPFT product to the OC-CCI TChla. Though, for SynSenPFT it should be noted that the product is designed to identify three different PFTs which are only part of the whole phytoplankton community. Although cyanobacteria make up the largest fraction in the tropics, high diversity of cyanobacteria and other phytopicoplankton has been reported also in the Atlantic Arctic region (e.g., Fram Strait and the Greenland Sea, Díez et al. 2012).
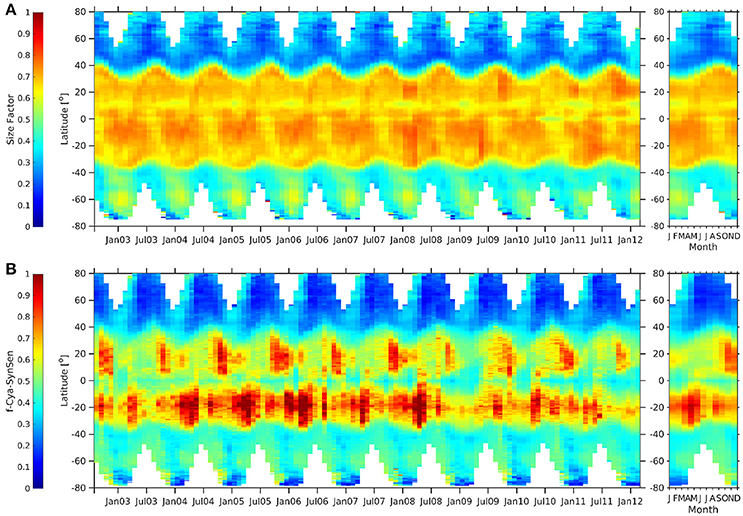
Figure 12. Hovmöller diagrams of Sf (Ciotti and Bricaud, 2006) (A), fraction of cya-SynSenPFT (B) with respect to OC-PFT TChla for the period of August 2002–March 2012 (left panel) together with the corresponding climatological annual cycle (right panel).
When comparing f-Cya-SynSenPFT against Sf, we see that the observed dominance of the cyanobacteria in north tropical regions is weaker (not in Autumn however) and reveals more pronounced seasonality for the SynSenPFT product. The f-Cya-SynSenPFT is lower than Sf also in the equatorial region, while f-Cya-SynSenPFT estimates exceed Sf in southern tropical areas. One can also notice differences in temporal variability of pico-plankton dominance in the Southern Ocean. It is worth, however, emphasizing one more time that SynSenPFTs represent only a part of the whole pico-phytoplankton community.
Overall, all three SynSenPFT global products seem to reproduce the seasonality in their respective dominant phytoplankton size class (the c-PSC products), except that dia-SynSenPFT seems to be generally higher. Patterns of 1-Sf and Sf indicating the contribution of pico- and microplankton to the phytoplankton community seem also in agreement with the two former products, in terms of the spatial distribution. The temporal pattern is often different which may be due to differences between contribution of a size class and abundance. However, NOBM products, which identify the same PFTs as SynSenPFT, show for most regions quite different patterns and Chla ranges in the distibution of cyanobacteria and coccolithophores, while diatom results are closer to dia-SynSenPFT (and to c-micro). The model has parametrizations limiting the latitudinal extension of the two former groups (Gregg and Casey, 2007). Distribution of global HPLC marker pigments for PFTs (Peloquin et al., 2013), PFT abundance based on HPLC pigment data sets (Swan et al., 2016) and coccolithophore counts (O'Brien et al., 2013) clearly show presence of cyanobacteria and coccolithophores also in temperate and high latitudes. In this respect, these studies as well as the satellite-based study by Alvain et al. (2008) support the global patterns of the SynSenPFT, Sf and PSC.
4. Summary and Outlook
A first version of a synergetic hyper- and multispectral-based satellite product for diatom, coccolithophore, and cyanobacteria (i.e., prokaryotic phytoplankton) Chla was developed globally (being binned at 4 × 4 km resolution) on a daily basis from August 2002 to April 2012. As input data OC-PFT Chla level-3 at the same resolution and daily 7-days composites of PhytoDOAS PFT Chla on a 0.5° by 0.5° resolution grid were used.
The SynSenPFT products were evaluated globally through validation against in situ PFT Chla data and intercomparison with satellite retrievals of Phytoplankton Size Classes Chla (c-PSC) of Brewin et al. (2015), Size Factor (Sf) of Ciotti and Bricaud (2006) and PFT Chla from the NASA Ocean Biogeochemical Model (NOBM) of Gregg and Casey (2007). When compared to in situ PFT data, good performance of SynSenPFT was achieved for all three products. Although cya-SynSenPFT does not correlate with global in situ match-ups (maybe due to the limited Chla range), nevertheless its RMSD and MAE were lower than for dia-SynSenPFT in the in situ validation. Also cya-SynSenPFT shows reasonable spatial and temporal patterns as detected by the other satellite-derived (especially c-pico) estimates and with results shown in literature based on in situ measurements.
Overall we can conclude that this first version of SynSenPFT products compare reasonably well with in situ data and also with other satellite products. Nevertheless, the current version of the synergistic cya-SynSenPFT as well as dia-SynSenPFT in the higher than 65° regions is mostly influenced by OC-PFT data because of large gaps in the PhytoDOAS version 3.3 diatoms and cyanobacteria products at high latitudes.
It is worth emphasizing that we do not introduce the SynSenPFT only as a PFT product, but also as an established dynamic system (see Figure 13) including several components within a network allowing the system to further educate and develop. Any possible future improvements of the SynSenPFT system's components would lead to improved quality of the synergistic PFT product. In the following we consider each (1–4) component in a perspective of the future development.
(1) Input initial product. To reduce the deficiencies of the PhytoDOAS diatom Chla product, the PhytoDOAS algorithm may be optimized by including the packaging effect when converting its DOAS fit factor to its Chla via extending the LUT. Accounting for the packaging effect is probably not appropriate for the coc-SynSenPFT and cya-SynSenPFT products, since a very low pigment packaging effect in coccolithophores and if any in cyanobacteria is expected. This may reduce the observed overestimation of dia-SynSenPFT as compared to other products.
The input OC-PFT and PhytoDOAS algorithms can be applied to various similar multi- and hyperspectral-based information from other satellite missions. For instance, OC-PFT is worth applying to OLCI (Sentinel-3), while PhytoDOAS product might be based on the information from OMI (Aura) or TROPOMI- and UVN-instruments onboard Sentinel-5P and Sentinel-4 and -5. Respectively, OMI products, and especially the hyperspectral Sentinel-PFT information might allow PhytoDOAS global coverage to be improved by a factor of 2-3 temporally with spatial resolution also being improved by a factor of 4 for OMI and 40 for the upcoming hyperspectral Sentinel instruments.
PhytoDOAS is currently sensitive to the number of retrieved PFTs as shown by the PhytoDOAS sensitivity study using radiative transfer simulations with SCIATRAN (Wolanin et al., 2016a) and the model study assessing the potential of the retrievals on remote sensing reflectance data (Wolanin et al., 2016b). The SCIAMACHY retrievals were limited to channel 3 cluster 15 of the sensor which represents the wavelength range from 425 to 529 nm. Above and below this range the pixel resolution is worse (240 by 30 km). The OMI and TROPOMI sensors allow for a continuous exploitation from the UV to 500 nm. Therefore, the algorithms may be further revised and extended to enable accurate estimates of enlarged number of PFTs simultaneously retrieved.
(2) In situ and independent information. Continuous enlargement of the in situ pigment data set would enable OC-PFT algorithm and product to be revised, evaluation of the satellite retrievals and model estimates to be more accurate, and the error statistics to be more precise.
(3) Metrics. A more detailed TC-based analysis is desired to prescribe a priori error statistics spatially variable. Accounting for a seasonal variability of the used error statistics approximation would be also preferable in the context of stationarity (one of the assumptions underlying the TC).
More precise information on data quality – measurement errors traced through particular retrieval algorithms as well as estimates of the any possible representation errors – would allow for better SynSenPFT algorithm performance due to more plausible approximation of the input product a priori error statistics.
There is also a need in additional metrics for a posteriori assessment of the SynSenPFT product as well as for initial input products evaluation: the PFT/PSC/Sf phenology intercomparison on a weekly basis (for example) for various biogeochemical provinces (e.g., according to Longhurst 1998).
(4) SynSenPFT algorithm. The synergistic algorithm is to be further explored to include the PhytoDOAS level-2 information within a certain time window. The level-2 information can then be weighted relatively to the time interval between the date of the analysis and the date of the PhytoDOAS information used. A similar approach can be used to introduce a spatial radius of data influence. That would, however, require a calibration of the algorithm, since such a radius is spatially variable being dependent on the system dynamics which vary a lot between different regions.
The synergistic algorithm can be extended with respect to augmenting input products (including, for instance, biogeochemical modeling). Details of the implementation and the algorithm design will depend on the model resolution, the output, nevertheless, could even represent a vertical structure of PFTs and cover the areas and time periods where (when) no satellite data are available.
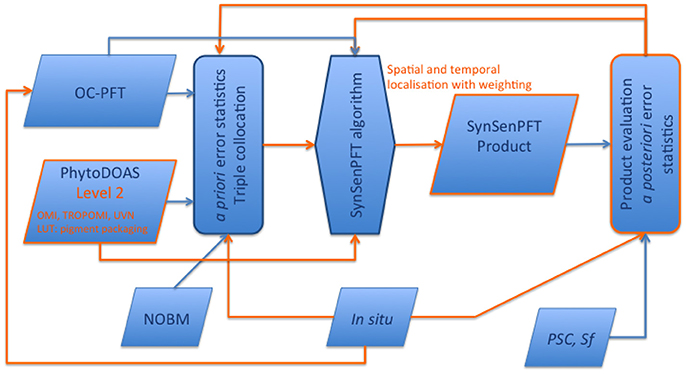
Figure 13. Schematic presentation of the SynSenPFT system and development flowchart. In orange color possibilities for further improvements and/or augments are emphasized.
Author Contributions
ABra is the initiator and leader of the SynSenPFT project, she contributed significantly to the writing process. SL implemented the SynSenPFT algorithm, compiled the first draft and updated the manuscript according the revisions by all the co-authors: ABra, MS, RB, ABri, TD, AW, JO, VR, and IP. MS produced the OC-PFT PFT, suggested the intercomparison design and wrote the most of the Supplementary Material. TD, AW, JO, VR, BG, and ABra were involved in the PhytoDOAS version 3.3 development. ABri and BG contributed with the Sf data product, and RB provided PSC data. ABri and RB as well as IP substantially participated in the PFT products intercomparison and discussion.
Funding
This work was supported by the ESA SEOM SY-4Sci Synergy project (No 400112410/14/I-NB_SEOM_SY-4SciSynergy). Funding to SL was also supported by the SFB/TR 172 (AC)3 “Arctic Amplification” subproject C03; DFG-Priority Program SPP 1158 “Antarktis” PhySyn BU2913/3-1, and by the Helmholtz Climate Initiative REKLIM (Regional Climate Change), a joint research project of the Helmholtz Association of German Research Centres (HGF).
Conflict of Interest Statement
The authors declare that the research was conducted in the absence of any commercial or financial relationships that could be construed as a potential conflict of interest.
Acknowledgments
We are thankful to Steven Delwart (ESA-ESRIN) for valuable and inspiring discussion throughout the SynSenPFT project. We thank the reviewers and Editor for their nice comments and constructive suggestions leading to the improved manuscript. We thank ESA for OC-CCI data, MERIS and SCIAMACHY data; NASA Global Modeling and Assimilation Office (GMAO) for NOBM PFT output, NASA Goddard Space Flight Center's Ocean Data Processing System (ODPS) for the MODIS and SeaWiFs data. We thank Dr. Rajdeep Roy (CSIR National Institute of Oceanography (NIO), Goa, India) and all the scientists and crews involved in HPLC data collection and analyses for providing their pigment data. PFT Chla data sets used and produced within our SynSenPFT study are available at https://doi.org/10.1594/PANGAEA.873210.
Supplementary Material
The Supplementary Material for this article can be found online at: https://www.frontiersin.org/article/10.3389/fmars.2017.00203/full#supplementary-material
Abbreviations
AWI, Alfred Wegener Institute; Chla, chlorophyll “a” concentration; c-micro, microphytoplankton Chla; CNRS, Centre National de la Recherche Scientifique; c-nano, nanophytoplankton Chla; c-pico, picophytoplankton Chla; coc, coccolithophores Chla; cya, cyanobacteria Chla; dia, diatom Chla; DOAS, Differential Optical Absorption Spectroscopy; DPA, Diagnostic Pigment Analysis; ESA, European Space Agency; f-micro, fraction of microplankton Chla to total Chla; f-nano, fraction of nanoplankton Chla to TChla; f-pico, fraction of picoplankton Chla to TChla; f-PSC, fraction of phytoplankton size class Chla to TChla; IOCCG, International Ocean-Color Coordinating Group; IOP, Inherent Optical Properties; IUP, Institute of Environmental Physics; LOV, Laboratoire d'Oceanographie de Villefranche; LUT, Look Up Table; MAE, Mean Absolute Error; MAD, Mean Absolute Differences; micro, microplankton; nano, nanoplankton; NASA, National Aeronautics and Space Administration; NOBM, NASA Ocean Biogeochemical Model; OCI, Ocean Color Instrument; OC-PFT, Algorithm of Hirata et al. (2011) to retrieve phytoplankton functional types; OC-CCI, Ocean Color Climate Change Initiative; OI, Optimal Interpolation; OLCI, Ocean Land Color Instrument; OMI, Ozone Monitoring Instrument; PACE, Plankton, Aerosol, Cloud, ocean Ecosystem; PCA, Principal Component Analysis; PFT, Phytoplankton Functional Type; PhytoDOAS, DOAS applied for retrieval of phytoplankton and PFT biomass; pico, picoplankton; PSC, Phytoplankton Size Class; PML, Plymouth Marine Laboratory; PVR, product validation report; QAA Quasi-Analytical Algorithm; RMSD, root mean square difference; Rrs, Rotational Raman Scattering; RTM, Radiative Transfer Model; SCIAMACHY, Scanning Imaging Absorption Spectrometers for Atmospheric Chartography; SCIATRAN, Radiative Transfer Model and Retrieval Algorithm; SEOM, Scientific Exploitation of Operational Missions; Sf, phytoplankton size factor; SynSenPFT, Synergistic hyper- and multispectral satellite PFT product; SZA, Solar zenith angle; TChla, total chlorophyll “a” concentration; TC, Triple collocation; TOA, Top of Atmosphere; TROPOMI, TROPOspheric Monitoring Instrument; UV-A, Ultraviolet A; VRS, Vibrational Raman Scattering; WF, Weighting-function.
References
Ackleson, S., Balch, W., and Holligan, P. (1988). White waters of the gulf of maine. Oceanography 1, 18–22.
Alvain, S., Moulin, C., Dandonneau, Y., and Loisel, H. (2008). Seasonal distribution and succession of dominant phytoplankton groups in the global ocean: a satellite view. Global Biogeochem. Cycles 22:GB3001. doi: 10.1029/2007GB003154
Bracher, A. (2014a). Phytoplankton Pigment Concentrations during POLARSTERN Cruise ANT-XXVIII/3. Alfred Wegener Institute, Helmholtz Center for Polar and Marine Research, Bremerhaven. doi: 10.1594/PANGAEA.848588
Bracher, A. (2014b). Phytoplankton Pigments Measured on Water Bottle Samples during SONNE Cruise SO218. Alfred Wegener Institute, Helmholtz Center for Polar and Marine Research, Bremerhaven. doi: 10.1594/PANGAEA.848589
Bracher, A. (2015a). Phytoplakton Pigment Concentrations during Maria S. Merian Cruise MSM18/3. Alfred Wegener Institute, Helmholtz Center for Polar and Marine Research, Bremerhaven. doi: 10.1594/PANGAEA.848586
Bracher, A. (2015b). Phytoplakton Pigment Concentrations during POLARSTERN Cruise ANT-XXIV/1. Alfred Wegener Institute, Helmholtz Center for Polar and Marine Research, Bremerhaven. doi: 10.1594/PANGAEA.848583
Bracher, A. (2015c). Phytoplakton Pigment Concentrations during POLARSTERN Cruise ANT-XXIV/4. Alfred Wegener Institute, Helmholtz Center for Polar and Marine Research, Bremerhaven. doi: 10.1594/PANGAEA.848584
Bracher, A. (2015d). Phytoplakton Pigment Concentrations during POLARSTERN Cruise ANT-XXVI/4. Alfred Wegener Institute, Helmholtz Center for Polar and Marine Research, Bremerhaven. doi: 10.1594/PANGAEA.848585
Bracher, A. (2015e). Phytoplankton Pigment Concentrations during POLARSTERN Cruise ANT-XXVII/2. Alfred Wegener Institute, Helmholtz Center for Polar and Marine Research, Bremerhaven. doi: 10.1594/PANGAEA.848590
Bracher, A., Bouman, H., Brewin, R., Bricaud, A., Brotas, V., Ciotti, A., et al. (2017a). Obtaining phytoplankton diversity from ocean color: A scientific roadmap for future development. Front. Mar. Sci. 4:55. doi: 10.3389/fmars.2017.00055
Bracher, A., Dinter, T., Wolanin, A., Rozanov, V. V., Losa, S., and Soppa, M. A. (2017b). Global Monthly Mean Chlorophyll a Surface Concentrations from August 2002 to April 2012 for Diatoms, Coccolithophores and Cyanobacteria from PhytoDOAS Algorithm Version 3.3 Applied to SCIAMACHY Data, Link to NetCDF Files in ZIP Archive. PANGAEA. doi: 10.1594/PANGAEA.870486
Bracher, A., and Taylor, B. B. (2017). Phytoplankton Pigment Concentrations Measured by HPLC during Maria S. Merian cruise MSM9/1. Alfred Wegener Institute, Helmholtz Center for Polar and Marine Research, Bremerhaven. doi: 10.1594/PANGAEA.873070
Bracher, A., Taylor, M., Taylor, B., Dinter, T., Roettgers, R., and Steinmetz, F. (2015a). Using empirical orthogonal functions derived from remote sensing reflectance for the prediction of phytoplankton pigments concentrations. Ocean Sci. 11, 139–158. doi: 10.5194/os-11-139-2015
Bracher, A., Taylor, M. H., Taylor, B. B., Dinter, T., Röttgers, R., and Steinmetz, F. (2015b). Phytoplakton Pigment Concentrations during POLARSTERN Cruise ANT-XXIII/1. Bremerhaven: PANGEA. doi: 10.1594/PANGAEA.871713
Bracher, A., Vountas, M., Dinter, T., Burrows, J. P., Röttgers, R., and Peeken, I. (2009). Quantitative observation of cyanobacteria and diatoms from space using PhytoDOAS on SCIAMACHY data. Biogeosciences 6, 751–764. doi: 10.5194/bg-6-751-2009
Brewin, R., Ciavatta, S., Sathyendranath, S., Jackson, T., Tilstone, G., Curran, K., et al. (2017). Uncertainty in ocean-color estimates of chlorophyll for phytoplankton groups. Front. Mar. Sci. 4:104. doi: 10.3389/fmars.2017.00104
Brewin, R. J., Sathyendranath, S., Hirata, T., Lavender, S. J., Barciela, R. M., and Hardman-Mountford, N. J. (2010). A three-component model of phytoplankton size class for the atlantic ocean. Ecol. Model. 221, 1472–1483. doi: 10.1016/j.ecolmodel.2010.02.014
Brewin, R. J., Sathyendranath, S., Jackson, T., Barlow, R., Brotas, V., Airs, R., et al. (2015). Influence of light in the mixed-layer on the parameters of a three-component model of phytoplankton size class. Remote Sensing Environ. 168, 437–450. doi: 10.1016/j.rse.2015.07.004
Bricaud, A., Ciotti, A., and Gentili, B. (2012). Spatial-temporal variations in phytoplankton size and colored detrital matter absorption at global and regional scales, as derived from twelve years of seawifs data (1998–2009). Global Biogeochem. Cycles 26:GB1010. doi: 10.1029/2010GB003952
Bricaud, A., Claustre, H., Ras, J., and Oubelkheir, K. (2004). Natural variability of phytoplanktonic absorption in oceanic waters: Influence of the size structure of algal populations. J. Geophys. Res. Oceans 109:C11010. doi: 10.1029/2004jc002419
Buesseler, K. O. (1998). The decoupling of production and particulate export in the surface ocean. Global Biogeochem. Cy. 12, 297–310. doi: 10.1029/97GB03366
Campbell, J. W. (1995). The lognormal distribution as a model for bio-optical variability in the sea. J. Geophys. Res. Oceans 100, 13237–13254. doi: 10.1029/95JC00458
Cheah, W., Taylor, B. B., Wiegmann, S., Raimund, S., Krahmann, G., Quack, B., et al. (2013). Photophysiological state of natural phytoplankton communities in the south china sea and sulu sea. Biogeosci. Discuss. 10, 12115–12153. doi: 10.5194/bgd-10-12115-2013
Chisholm, S. W. (1992). “Phytoplankton size,” in Primary Productivity and Biogeochemical Cycles in the Sea (Springer), 213–237.
Ciotti, A. M., and Bricaud, A. (2006). Retrievals of a size parameter for phytoplankton and spectral light absorption by colored detrital matter from water-leaving radiances at seawifs channels in a continental shelf region off brazil. Limnol. Oceanogr. Methods 4, 237–253. doi: 10.4319/lom.2006.4.237
Ciotti, A. M., Lewis, M. R., and Cullen, J. J. (2002). Assessment of the relationships between dominant cell size in natural phytoplankton communities and the spectral shape of the absorption coefficient. Limnol. Oceanogr. 47, 404–417. doi: 10.4319/lo.2002.47.2.0404
Crow, W. T., and van den Berg, M. J. (2010). An improved approach for estimating observation and model error parameters in soil moisture data assimilation. Water Res. Res. 46:W12519. doi: 10.1029/2010WR009402
Díez, B., Bergman, B., Pedrós-Alió, C., Antó, M., and Snoeijs, P. (2012). High cyanobacterial nifh gene diversity in arctic seawater and sea ice brine. Environ. Microbiol. Reports 4, 360–366. doi: 10.1111/j.1758-2229.2012.00343.x
Dinter, T., Rozanov, V., Burrows, J., and Bracher, A. (2015). Retrieval of light availability in ocean waters utilizing signatures of vibrational raman scattering in hyper-spectral satellite measurements. Ocean Sci. 11, 373–389. doi: 10.5194/os-11-373-2015
Field, C. B., Behrenfeld, M. J., Randerson, J. T., and Falkowski, P. (1998). Primary production of the biosphere: Integrating terrestrial and oceanic components. Science 281, 237–240. doi: 10.1126/science.281.5374.237
Franklin, D. J., Poulton, A. J., Steinke, M., Young, J., Peeken, I., and Malin, G. (2009). Dimethylsulphide, dmsp-lyase activity and microplankton community structure inside and outside of the mauritanian upwelling. Progr. Oceanogr. 83, 134–142. doi: 10.1016/j.pocean.2009.07.011
Gandin, L. S., and Hardin, R. (1965). Objective Analysis of Meteorological Fields, Vol. 242. Jerusalem: Israel Program for Scientific Translations Jerusalem.
Gregg, W. W. (2002). “A coupled ocean-atmosphere radiative model for global ocean biogeochemical models,” in NASA Global Modeling and Assimilation Series, Vol. 22, ed M. Suarez (Greenbelt, MD: NASA Technical Memorandum 2002-104606), 33.
Gregg, W. W., and Casey, N. W. (2007). Modeling coccolithophores in the global oceans. Deep Sea Research II: Topical Studies in Oceanography, 54, 447–477. doi: 10.1016/j.dsr2.2006.12.007
Gregg, W. W., and Rousseaux, C. S. (2017). Simulating pace global ocean radiances. Front. Marine Sci. 4:60. doi: 10.3389/fmars.2017.00060
Gruber, A., Su, C.-H., Zwieback, S., Crow, W., Dorigo, W., and Wagner, W. (2016). Recent advances in (soil moisture) triple collocation analysis. Int. J. Appl. Earth Observ. Geoinform. 45 (Pt B), 200–211. doi: 10.1016/j.jag.2015.09.002
Hardman-Mountford, N. J., Hirata, T., Richardson, K. A., and Aiken, J. (2008). An objective methodology for the classification of ecological pattern into biomes and provinces for the pelagic ocean. Remote Sensing Environ. 112, 3341–3352. doi: 10.1016/j.rse.2008.02.016
Hirata, T., Hardman-Mountford, N., Brewin, R., Aiken, J., Barlow, R., Suzuki, K., et al. (2011). Synoptic relationships between surface chlorophyll-a and diagnostic pigments specific to phytoplankton functional types. Biogeosciences 8, 311–327. doi: 10.5194/bg-8-311-2011
IOCCG (2009). “Remote sensing fisheries and aquaculture: the societal benefits,” in in Reports of the International Ocean Color Coordinating Group No. 8, eds M.-H. Forget, V. Stuart, and T. Platt (Dartmouth, NS: IOCCG).
IOCCG (2014). “Phytoplankton functional types from space,” in in Reports of the International Ocean Color Coordinating Group No. 15, eds S. Sathyendranath and V. Stuart (Dartmouth, NS: IOCCG).
Johnson, R., Strutton, P. G., Wright, S. W., McMinn, A., and Meiners, K. M. (2013). Three improved satellite chlorophyll algorithms for the southern ocean. J. Geophys. Res. Oceans 118, 3694–3703. doi: 10.1002/jgrc.20270
Laufkötter, C., Vogt, M., Gruber, N., Aumont, O., Bopp, L., and Doney, S. C. (2016). Projected decreases in future marine export production: the role of the carbon flux through the upper ocean ecosystem. Biogeosciences 13, 4023–4047. doi: 10.5194/bg-13-4023-2016
Lee, Z., Carder, K. L., and Arnone, R. A. (2002). Deriving inherent optical properties from water color: a multiband quasi-analytical algorithm for optically deep waters. Appl. Opt. 41, 5755–5772. doi: 10.1364/AO.41.005755
Le Qur, C., Harrison, S. P., Colin Prentice, I., Buitenhuis, E. T., Aumont, O., Bopp, L., et al. (2005). Ecosystem dynamics based on plankton functional types for global ocean biogeochemistry models. Global Change Biol. 11, 2016–2040. doi: 10.1111/j.1365-2486.2005.1004.x
Losa, S. N., Danilov, S., Schröter, J., Janjić, T., Nerger, L., and Janssen, F. (2014). Assimilating NOAA SST data into BSH operational circulation model for the north and baltic seas: part 2. sensitivity of the forecast's skill to the prior model error statistics. J. Marine Sys. 129, 259–270. doi: 10.1016/j.jmarsys.2013.06.011
Losa, S. N., Danilov, S., Schröter, J., Nerger, L., Maßmann, S., and Janssen, F. (2012). Assimilating NOAA SST data into the BSH operational circulation model for the north and baltic seas: Inference about the data. J. Marine Sys. 105–108, 152–162. doi: 10.1016/j.jmarsys.2012.07.008
McColl, K. A., Vogelzang, J., Konings, A. G., Entekhabi, D., Piles, M., and Stoffelen, A. (2014). Extended triple collocation: Estimating errors and correlation coefficients with respect to an unknown target. Geophys. Res. Lett. 41, 6229–6236. doi: 10.1002/2014GL061322
Milliman, J. D. (1993). Production and accumulation of calcium carbonate in the ocean: Budget of a nonsteady state. Global Biogeochem. Cycles 7, 927–957. doi: 10.1029/93GB02524
Morán, X. A. G., Fernández, E., and Pérez, V. (2004). Size-fractionated primary production, bacterial production and net community production in subtropical and tropical domains of the oligotrophic ne atlantic in autumn. Marine Ecol. Progr. Ser. 274, 17–29. doi: 10.3354/meps274017
Morel, A., Gentili, B., Claustre, H., Babin, M., Bricaud, A., Ras, J., et al. (2007). Optical properties of the “clearest” natural waters. Limnol. Oceanogr. 52, 217–229. doi: 10.4319/lo.2007.52.1.0217
Mouw, C. B., Hardman-Mountford, N. J., Alvain, S., Bracher, A., Brewin, R. J. W., Bricaud, A., et al. (2017). A consumer's guide to satellite remote sensing of multiple phytoplankton groups in the global ocean. Front. Marine Sci. 4:41. doi: 10.3389/fmars.2017.00041
Nöthig, E.-M., Bracher, A., Engel, A., Metfies, K., Niehoff, B., Peeken, I., et al. (2015). Summertime plankton ecology in the Fram Sztrait: a compilation of short- and long-term observations. Polar Res. 34:23349. doi: 10.3402/polar.v34.23349
O'Brien, C., Peloquin, J., Vogt, M., Heinle, M., Gruber, N., et al. (2013). Global plankton functional type biomass distributions: Coccolithophores. Earth Sys. Sci. Data 5, 259–276. doi: 10.5194/essd-5-259-2013
OC-CCI (2015). Ocean Color Climate Change Initiative Product User Guide Version 2. Plymouth: Plymouth Marine Laboratory.
Organelli, E., Bricaud, A., Antoine, D., and Uitz, J. (2013). Multivariate approach for the retrieval of phytoplankton size structure from measured light absorption spectra in the mediterranean sea (boussole site). Appl. Opt. 52, 2257–2273. doi: 10.1364/AO.52.002257
Organelli, E., Nuccio, C., Melillo, C., and Massi, L. (2011). Relationships between phytoplankton light absorption, pigment composition and size structure in offshore areas of the mediterranean sea. Adv. Oceanogr. Limnol. 2, 107–123. doi: 10.4081/aiol.2011.5320
Peeken, I., Bluhm, K., and Zöllner, E. (2017a). Phytoplankton pigments measured from underway and water bottle samples during Marion Dufresne cruise MD158 (OOMPH MD07 leg 1). PANGAEA. doi: 10.1594/PANGAEA.873203
Peeken, I., Bluhm, K., and Zo¨llner, E. (2017b). Phytoplankton Pigments Measured from Underway and Water Bottle Samples during Marion Dufresne Cruise MD160 (OOMPH MD07 leg 2). PANGAEA. doi: 10.1594/PANGAEA.873208
Peeken, I., Bracher, A., and Murawski, S. (2017c). Phytoplankton Pigments Measured on Water Bottle Samples during POLARSTERN Cruise ANT-XXIV/2. PANGAEA. doi: 10.1594/PANGAEA.873199
Peeken, I., and Hoffmann, L. (2014a). Phytoplankton Pigments and Nutrients Measured on Water Bottle Samples during METEOR Cruise M55. PANGAEA. doi: 10.1594/PANGAEA.869828
Peeken, I., and Hoffmann, L. (2014b). Phytoplankton pigments in Surface Water during POLARSTERN Cruise ANT-XXI/3 (EIFEX). PANGAEA. doi: 10.1594/PANGAEA.869825
Peeken, I., and Hoffmann, L. (2014c). Phytoplankton Pigments Measured on Water Bottle Samples during POLARSTERN Cruise ANT-XXI/3 (EIFEX). PANGAEA. doi: 10.1594/PANGAEA.869824
Peeken, I., and Nachtigall, K. (2014a). Phytoplankton Pigments Measured on Water Bottle Samples during POLARSTERN Cruise ANT-XVIII/2 (EisenEx). PANGAEA. doi: 10.1594/PANGAEA.869823
Peeken, I., and Nachtigall, K. (2014b). Pigments in Surface Water during POLARSTERN Cruise ANT-XXVI/3. PANGAEA. doi: 10.1594/PANGAEA.869827
Peeken, I., and Nachtigall, K. (2014c). Pigments Measured on Water Bottle Samples during METEOR Cruise M60. PANGAEA. doi: 10.1594/PANGAEA.869830
Peeken, I., and Quack, B. (2017). Phytoplankton Pigments Measured on Underway and Water Bottle Samples during POSEIDON Cruise POS320. PANGAEA. doi: 10.1594/PANGAEA.873198
Peeken, I., and Walter, S. (2017). Phytoplankton Pigments Measured from Underway and Water Bottle Samples during POSEIDON Cruise POS348. PANGAEA. doi: 10.1594/PANGAEA.873200
Peeken, I., Wilken, S., Bremer, K., and Schnack-Schiel, S. B. (2017d). Phytoplankton Pigments Measured from Seawater Samples from the Spermonde Archipelago in Southwest Sulawesi, Indonesia. Alfred Wegener Institute, Helmholtz Center for Polar and Marine Research, Bremerhaven. doi: 10.1594/PANGAEA.873209
Peloquin, J., Swan, C., Gruber, N., Vogt, M., Claustre, H., Ras, J., et al. (2013). The maredat global database of high performance liquid chromatography marine pigment measurements. Earth Sys. Sci. Data 5, 109–123. doi: 10.5194/essd-5-109-2013
Perner, D., and Platt, U. (1979). Detection of nitrous acid in the atmosphere by differential optical absorption. Geophys. Res. Lett. 6, 917–920. doi: 10.1029/GL006i012p00917
Quack, B., Peeken, I., Petrick, G., and Nachtigall, K. (2007). Oceanic distribution and sources of bromoform and dibromomethane in the mauritanian upwelling. J. Geophys. Res. Oceans 112, 1–13. doi: 10.1029/2006jc003803
Raimbault, P., Rodier, M., and Taupier-Letage, I. (1988). Size fraction of phytoplankton in the ligurian sea and the algerian basin (mediterranean sea): size distribution versus total concentration. Marine Microb. Food Webs 3, 1–7.
Rozanov, V., Rozanov, A., Kokhanovsky, A., and Burrows, J. (2014). Radiative transfer through terrestrial atmosphere and ocean: Software package SCIATRAN. J. Quant. Spectr. Radiat. Transfer 133, 13–71. doi: 10.1016/j.jqsrt.2013.07.004
Sá, C., D'Alimonte, D., Brito, A., Kajiyama, T., Mendes, C., Vitorino, J., et al. (2015). Validation of standard and alternative satellite ocean-color chlorophyll products off western iberia. Remote Sensing Environ. 168, 403–419. doi: 10.1016/j.rse.2015.07.018
Sadeghi, A., Dinter, T., Vountas, M., Taylor, B., Altenburg-Soppa, M., and Bracher, A. (2012). Remote sensing of coccolithophore blooms in selected oceanic regions using the PhytoDOAS method applied to hyper-spectral satellite data. Biogeosciences 9, 2127–2143. doi: 10.5194/bg-9-2127-2012
Sathyendranath, S., Cota, G., Stuart, V., Maass, H., and Platt, T. (2001). Remote sensing of phytoplankton pigments: a comparison of empirical and theoretical approaches. Int. J. Remote Sensing 22, 249–273. doi: 10.1080/014311601449925
Sauzde, R., Claustre, H., Jamet, C., Uitz, J., Ras, J., Mignot, A., et al. (2015). Retrieving the vertical distribution of chlorophyll a concentration and phytoplankton community composition from in situ fluorescence profiles: a method based on a neural network with potential for global-scale applications. J. Geophys. Res. Oceans 120, 451–470. doi: 10.1002/2014JC010355
Soppa, M. A., Hirata, T., Silva, B., Dinter, T., Peeken, I., Wiegmann, S., et al. (2014). Global retrieval of diatom abundance based on phytoplankton pigments and satellite data. Remote Sensing 6, 10089–10106. doi: 10.3390/rs61010089
Soppa, M. A., Peeken, I., and Bracher, A. (2017). Global Chlorophyll “a” Concentrations for Diatoms, Haptophytes and Prokaryotes Obtained with the Diagnostic Pigment Analysis of HPLC Data Compiled from Several Databases and Individual Cruises. PANGAEA. doi: 10.1594/PANGAEA.875879
Soppa, M. A., Voelker, C., and Bracher, A. (2016). Diatom Phenology in the Southern Ocean: Mean Patterns, Trends and the Role of Climate Oscillations. Remote Sensing 8:420. doi: 10.3390/rs8050420
Stoffelen, A. (1998). Toward the true near-surface wind speed: error modeling and calibration using triple collocation. J. Geophys. Res. Oceans (1978–2012) 103, 7755–7766. doi: 10.1029/97JC03180
Swan, C., Vogt, M., Gruber, N., and Laufkötter, C. (2016). A global seasonal surface ocean climatology of phytoplankton types based on CHEMTAX analysis of HPLC pigments. Deep Sea Res. Part I 109, 137–156. doi: 10.1016/j.dsr.2015.12.002
Taylor, B. B., and Bracher, A. (2012). Pigment Concentrations Measured in Surface Water during SONNE Cruise SO202/2 (TRANSBROM). PANGAEA. doi: 10.1594/pangaea.804525
Taylor, B. B., Torrecilla, E., Bernhardt, A., Taylor, M. H., Peeken, I., Röttgers, R., et al. (2011a). Bio-optical provinces in the eastern atlantic ocean and their biogeographical relevance. Biogeosciences 8, 3609–3629. doi: 10.5194/bg-8-3609-2011
Taylor, B. B., Torrecilla, E., Bernhardt, A., Taylor, M. H., Peeken, I., Röttgers, R., et al. (2011b). Pigments of Phytoplankton during POLARSTERN Cruise ANT-XXV/1. Alfred Wegener Institute, Helmholtz Center for Polar and Marine Research, Bremerhaven. doi: 10.1594/PANGAEA.819070
Trimborn, S., Hoppe, C. J., Taylor, B. B., Bracher, A., and Hassler, C. (2015). Physiological characteristics of open ocean and coastal phytoplankton communities of western antarctic peninsula and drake passage waters. Deep Sea Res. I Oceanogr. Res. Papers 98, 115–124. doi: 10.1016/j.dsr.2014.12.010
Uitz, J., Claustre, H., Griffiths, F. B., Ras, J., Garcia, N., and Sandroni, V. (2009). A phytoplankton class-specific primary production model applied to the kerguelen islands region (southern ocean). Deep Sea Res. I Oceanogr. Res. Papers 56, 541–560. doi: 10.1016/j.dsr.2008.11.006
Uitz, J., Claustre, H., Morel, A., and Hooker, S. B. (2006). Vertical distribution of phytoplankton communities in open ocean: an assessment based on surface chlorophyll. J. Geophys. Res. 111:C08005. doi: 10.1029/2005jc003207
Vidussi, F., Claustre, H., Manca, B. B., Luchetta, A., and Marty, J.-C. (2001). Phytoplankton pigment distribution in relation to upper thermocline circulation in the eastern mediterranean sea during winter. J. Geophys. Res. Oceans (1978–2012) 106, 19939–19956. doi: 10.1029/1999JC000308
Vogelzang, J., Stoffelen, A., Verhoef, A., and Figa-Saldaa, J. (2011). On the quality of high-resolution scatterometer winds. J. Geophys. Res. Oceans 116:C10033. doi: 10.1029/2010jc006640
Vountas, M., Dinter, T., Bracher, A., Burrows, J. P., and Sierk, B. (2007). Spectral studies of ocean water with space-borne sensor SCIAMACHY using Differential Optical Absorption Spectroscopy (doas). Ocean Sci. 3, 429–440. doi: 10.5194/os-3-429-2007
Ward, B. A. (2015). Temperature-correlated changes in phytoplankton community structure are restricted to polar waters. PLoS ONE 10:e0135581. doi: 10.1371/journal.pone.0135581
Waterbury, J. B., Watson, S. W., Valois, F. W., and Franks, D. G. (1986). Biological and ecological characterization of the marine unicellular cyanobacterium synechococcus. Can. Bull. Fish Aquat. Sci. 214:120.
Werdell, P. J., Bailey, S., Fargion, G., Pietras, C., Knobelspiesse, K., Feldman, G., et al. (2003). Unique data repository facilitates ocean color satellite validation. EOS Trans. Am. Geophys. Union 84, 377–387. doi: 10.1029/2003EO380001
Werdell, P. J., Franz, B. A., Bailey, S. W., Harding, L. W. Jr., and Feldman, G. C. (2007). Approach for the long-term spatial and temporal evaluation of ocean color satellite data products in a coastal environment. Proc. SPIE 6680:66800G. doi: 10.1117/12.732489
Wolanin, A., Dinter, T., Soppa, M., and Bracher, A. (2016a). D2.1 Report on Using Radiative Transfer Modeling to Develop a Correction Scheme and Investigate the Sensitivity of the Improved Phytodoas (version3.0) Algorithm. SY-4Sci Synergy R and D Study 4: Phytoplankton Functional Types (SynSenPFT).
Wolanin, A., Soppa, M. A., and Bracher, A. (2016b). Investigation of spectral band requirements for improving retrievals of phytoplankton functional types. Remote Sensing Environ. 8:871. doi: 10.3390/rs8100871
Yang, Q., Losch, M., Losa, S. N., Jung, T., Nerger, L., and Lavergne, T. (2016). Brief communication: The challenge and benefit of using sea ice concentration satellite data products with uncertainty estimates in summer sea ice data assimilation. Cryosphere 10, 761–774. doi: 10.5194/tc-10-761-2016
Zindler, C., Bracher, A., Marandino, C. A., Taylor, B., Torrecilla, E., Kock, A., et al. (2012a). Sulphur compounds, methane, and phytoplankton: interactions along a north-south transit in the western Pacific Ocean. Biogeosci. Discuss. 9, 15011–15049. doi: 10.5194/bgd-9-15011-2012
Zindler, C., Peeken, I., Marandino, C., and Bange, H. W. (2012b). Environmental control on the variability of DMS and DMSP in the Mauritanian upwelling region. Biogeosciences 9, 1041–1051. doi: 10.5194/bg-9-1041-2012
Keywords: synergistic, Sentinel, satellite retrievals, phytoplankton functional type
Citation: Losa SN, Soppa MA, Dinter T, Wolanin A, Brewin RJW, Bricaud A, Oelker J, Peeken I, Gentili B, Rozanov V and Bracher A (2017) Synergistic Exploitation of Hyper- and Multi-Spectral Precursor Sentinel Measurements to Determine Phytoplankton Functional Types (SynSenPFT). Front. Mar. Sci. 4:203. doi: 10.3389/fmars.2017.00203
Received: 08 March 2017; Accepted: 13 June 2017;
Published: 05 July 2017.
Edited by:
Laura Lorenzoni, University of South Florida, United StatesReviewed by:
Lionel Arteaga, Princeton University, United StatesRaphael M. Kudela, University of California, Santa Cruz, United States
Cecile S. Rousseaux, USRA, United States
Copyright © 2017 Losa, Soppa, Dinter, Wolanin, Brewin, Bricaud, Oelker, Peeken, Gentili, Rozanov and Bracher. This is an open-access article distributed under the terms of the Creative Commons Attribution License (CC BY). The use, distribution or reproduction in other forums is permitted, provided the original author(s) or licensor are credited and that the original publication in this journal is cited, in accordance with accepted academic practice. No use, distribution or reproduction is permitted which does not comply with these terms.
*Correspondence: Svetlana N. Losa, svetlana.losa@AWI.de