 Marcio Luis Acencio1
 Marek Ostaszewski1,2*
 Alexander Mazein1
 Philip Rosenstiel3
 Konrad Aden3,4
 Neha Mishra3
 Vibeke Andersen5,6Prodromos Sidiropoulos7,8
 Aggelos Banos9
 Anastasia Filia9
 Souad Rahmouni10
 Axel Finckh11,12
 Wei Gu1,2
 Reinhard Schneider1,2
 Venkata Satagopam1,2
- 1Luxembourg Centre for Systems Biomedicine, University of Luxembourg, Esch-sur-Alzette, Luxembourg
- 2ELIXIR Luxembourg, Esch-sur-Alzette, Luxembourg
- 3Institute of Clinical Molecular Biology, Christian-Albrechts-University Kiel and University Medical Center Schleswig-Holstein, Kiel, Germany
- 4Department of Internal Medicine I, University Medical Center Schleswig-Holstein, Kiel, Germany
- 5Diagnostics and Clinical Research Unit, Institute of Regional Health Research, University Hospital of Southern Denmark, Aabenraa, Denmark
- 6Institute of Molecular Medicine, University of Southern Denmark, Odense, Denmark
- 7Rheumatology and Clinical Immunology, Medical School, University of Crete, Heraklion, Greece
- 8Laboratory of Rheumatology, Autoimmunity and Inflammation, Institute of Molecular Biology and Biotechnology, Foundation for Research and Technology (IMBB-FORTH), Heraklion, Greece
- 9Autoimmunity and Inflammation Laboratory, Biomedical Research Foundation of the Academy of Athens, Athens and Laboratory of Molecular Hematology, Democritus University of Thrace, University Hospital of Alexandroupolis, Alexandroupolis, Greece
- 10Unit of Animal Genomics, GIGA-Institute, University of Liège, Liège, Belgium
- 11Rheumatology Division, Geneva University Hospital (HUG), Geneva, Switzerland
- 12Geneva Center for Inflammation Research (GCIR), University of Geneva (UNIGE), Geneva, Switzerland
Chronic inflammatory diseases (CIDs), including inflammatory bowel disease (IBD), rheumatoid arthritis (RA) and systemic lupus erythematosus (SLE) are thought to emerge from an impaired complex network of inter- and intracellular biochemical interactions among several proteins and small chemical compounds under strong influence of genetic and environmental factors. CIDs are characterised by shared and disease-specific processes, which is reflected by partially overlapping genetic risk maps and pathogenic cells (e.g., T cells). Their pathogenesis involves a plethora of intracellular pathways. The translation of the research findings on CIDs molecular mechanisms into effective treatments is challenging and may explain the low remission rates despite modern targeted therapies. Modelling CID-related causal interactions as networks allows us to tackle the complexity at a systems level and improve our understanding of the interplay of key pathways. Here we report the construction, description, and initial applications of the SYSCID map (https://syscid.elixir-luxembourg.org/), a mechanistic causal interaction network covering the molecular crosstalk between IBD, RA and SLE. We demonstrate that the map serves as an interactive, graphical review of IBD, RA and SLE molecular mechanisms, and helps to understand the complexity of omics data. Examples of such application are illustrated using transcriptome data from time-series gene expression profiles following anti-TNF treatment and data from genome-wide associations studies that enable us to suggest potential effects to altered pathways and propose possible mechanistic biomarkers of treatment response.
1 Introduction
Chronic inflammatory diseases (CIDs) are a group of incurable immune system disorders of unclear aetiology characterised by a persistent inflammation that ultimately cause damage in target tissues and organs (1). Currently, there are no curative treatment options for CIDs. Available targeted treatments are only beneficial in a subset of patients. Despite this heterogeneity of response, currently no biomarkers are available, which would allow stratifying patients into different therapeutic modalities. Even the most advanced treatment options have one severe limitation: they only offer short drug-free remission periods and therefore have to be given lifelong (2). Regarding prevalence, CIDs, more specifically their subgroup of immune-mediated inflammatory diseases, are estimated to affect 5 to 7% of the Western population (3). Finally, CIDs can result in debilitating physical and psychosocial symptoms for patients and are a sizable burden to society through loss of education, absenteeism, and increasing health-care costs (4, 5).
Several molecular mechanisms underlying CIDs have been converted into clinical treatments (2, 6). For example, biologics, mainly monoclonal antibodies targeting specific cytokines, emerged as clinical treatment options; however, their therapeutic potential is not always achieved in clinical practice (7). This may be explained by a switch towards alternative molecular pathways that are insensitive to the mechanism of action of the biologic (8–11).
Finding such alternative molecular pathways is thus important for understanding the molecular mechanisms of the disease and for indicating new potential targets for complementary biologics to achieve better clinical responses. In this regard, the results of clinical trials of so-called dual targeted therapy for CIDs showed promising results (12, 13). As CIDs emerge from a complex network of causal interactions between proteins, small chemical compounds, environmental factors and different types of cells, the identification of such alternative pathways and their targets should be based on their role in the network to assure their downstream effects. Such exercise requires, however, the construction and the analysis of a network encompassing CID-related causal interactions – events in which a phenotype or state of one biomolecule is affected by another phenotype or biomolecule under the context of the CID of interest –, covering relevant mechanistic details.
In response to this demand, we present the SYSCID map (https://syscid.elixir-luxembourg.org/), a network of mechanistically resolved causal interactions related to three CIDs - inflammatory bowel disease (IBD), rheumatoid arthritis (RA) and systemic lupus erythematosus (SLE) (https://syscid.elixir-luxembourg.org). As these CIDs share a significant amount of genetic disease risk loci and immunological features as well as large data sets and clinically validated markers of individual disease phenotypes (1), we consider them an important starting point for systematic exploration of common and specific mechanisms involved in the pathophysiology of CIDs. The SYSCID map is constructed based on literature review and represents disease mechanisms as an interactive diagram following graphical systems biology standards. The SYSCID map is a standardised knowledge repository for the IBD, RA and SLE and a hypothesis-generating resource for new discoveries. Here, we demonstrate how the SYSCID map can be used for these purposes. First, we discuss the scope of the literature used to construct the map as an interactive, graphically guided review of IBD, RA and SLE molecular pathogenesis. We then demonstrate the process of omics data interpretation using the map to identify potential effects of altered pathways and propose mechanistic biomarkers (14).
2 Methods
2.1 Map construction and availability
Knowledge about IBD-, RA- and SLE-relevant causal interaction were captured from biomedical literature and then encoded into a diagrammatic visualisation format, i.e., the map, by using the CellDesigner tool (15) following the Systems Biology Graphical Notation (SBGN) standard (16; https://sbgn.github.io/learning); the only exception is the representation of drugs for which we used the CellDesigner own glyph. The SYSCID map was then uploaded into the MINERVA platform (17) (https://syscid.elixir-luxembourg.org/minerva/) for easy access and exploration (Figure 1). Details are found below.
Figure 1 Building the SYSCID map Domain experts from the SYSCID project selected and provided curators with the papers potentially reporting molecular processes related to inflammatory bowel diseases (IBD), rheumatoid arthritis (RA) and systemic lupus erythematosus (SLE). Curators then extracted relevant molecular processes from the selected papers and encoded the extracted knowledge into the CellDesigner format; in addition, curators manually defined pathways, i.e., subsets of molecular processes leading to a specific phenotype, covering specific regions of the map. The SYSCID map was uploaded to the MINERVA platform and then made publicly accessible so that SYSCID domains experts could review it. After some rounds of reviews and refinement, a final improved version of the map was uploaded to MINERVA.
2.2 Capturing IBD-, RA- and SLE-related causal interactions from literature
The SYSCID map was constructed by following most of the recommendations in the recently published guidelines for disease maps construction (18). At first, we manually curated reviews and original peer-reviewed research papers suggested by domain experts from the SYSCID consortium. These papers were published between 1989 and 2021, being most of them (~88%) published between 2010 and 2020 (see Table S10 for the list of Pubmed IDs of curated papers). While most of these domain expert-selected papers describe relevant experimentally proven causal interactions under the context of IBD, RA and SLE, some other papers describe experimentally proven general immune processes-related causal interactions that were added to the map to cover missing disease-specific information. Most of causal interactions were directly assigned to compartments (i.e., organs, tissues, cells and organelles) based on information present in the paper itself; in some cases, this assignment was inferred based on common knowledge about the most usual locations where a given causal interaction takes place. We also captured details concerning causal interactions (e.g., gene variant and phosphorylated or citrullinated residues) when they were available in the paper.
2.3 Encoding causal interactions into diagrams
The retrieved causal interactions were then encoded into a diagrammatic visualisation format using the CellDesigner tool (15) by adopting its own standard visual syntax, the CellDesigner’s Systems Biology Markup Language (SBML) extension. The encoding process was performed following the Systems Biology Graphical Notation (SBGN) standard (16; https://sbgn.github.io/learning). We used both SBGN Process Description (PD) and Activity Flow (AF) languages. In PD, a causal interaction is represented as a state transition of a biochemical entity (regulated entity) with biochemical details about the type of molecular transition and how it is modified by a regulator entity. In AF, a causal interaction is represented as a simple directed connection between two entities with information about the type of regulation, i.e., activation or inhibition.
2.4 Identification and annotation of the map elements
All entities (proteins, RNAs, genes, complexes, metabolites, drugs and phenotypes), compartments (organelles, cells, tissues and organs) and interactions in the map were properly annotated to ensure the map interoperability with systems biology tools and external databases. For this end, we followed the Minimal Information Requested In the Annotation of Models (MIRIAM) (19), a standard for annotating and curating computational models and maps. Proteins, RNAs and genes were identified by their corresponding HUGO Gene Nomenclature Committee (HGNC, https://www.genenames.org) official symbols so that the MINERVA platform, the tool used to for visualization and navigation through the map (see more details below), could automatically assign additional annotations (Ensembl, Entrez Gene, RefSeq and Uniprot identifiers [IDs]) to these entities; in case of symbols or terms not recognized by HGNC, these additional annotations were manually assigned. Complexes were identified by their Gene Ontology (GO) cellular component terms and corresponding IDs (20, 21). Metabolites were identified by their ChEBI names (22; https://www.ebi.ac.uk/chebi) and corresponding IDs. Drugs were identified by their Drugbank (23); https://go.drugbank.com/) generic names and corresponding IDs. Phenotypes were identified by their GO biological process terms and corresponding IDs (http://geneontology.org/docs/ontology-documentation) (20, 21) in case of phenotypes representing biological processes or Medical Subject Headings (MeSH) terms and corresponding IDs (https://www.ncbi.nlm.nih.gov/mesh) in case of phenotypes representing disease-related elements.
For annotations not automatically retrieved by MINERVA, we used the MIRIAM-dedicated section of CellDesigner to add annotations. For adding references to the interactions, i.e., Pubmed IDs of the papers from which the interactions were collected, we used the relation “bqbiol: isDescribedby”; for adding all other annotations, we used the relation “bqmodel:isEncodeby”.
2.5 Map availability and visualisation in the MINERVA platform
The SYSCID map is available as an online interactive map using the Molecular Interaction NEtwoRks VisuAlization (MINERVA) platform (17) (https://syscid.elixir-luxembourg.org/minerva/). MINERVA is a standalone web server for visual exploration, analysis and management of molecular networks encoded in systems biology formats, including CellDesigner, SBML and SBGN. MINERVA provides automated content annotation and verification and enables, among other features, the overlaying of experimental data (e.g., transcriptomics, gene variant data etc) on the visualised networks. For more details about the functionalities available in MINERVA, please consult the MINERVA documentation at https://minerva.pages.uni.lu/doc/.
2.6 Integration of omics data to the map
IBD-, RA- and SLE-associated variants extracted from the Gene Wide-Association Studies (GWAS) Catalogue (24) and SYSCID-derived transcriptome data were integrated to the SYSCID map by using the MINERVA platform as detailed described below and following the instructions provided in the MINERVA pages (https://minerva.pages.uni.lu/doc/user_manual/v16.0/index/#upload-of-user-provided-overlay-data).
2.6.1 Integration of GWAS catalogue data to the map
For the analysis of possible mechanistic effects of IBD, RA and SLE-associated gene variants on downstream molecular processes in SYSCID map, we first obtained relevant data from the Gene Wide-Association Studies (GWAS) catalogue (24). We collected data on 04.11.2022 by using the Experimental Factor Ontology (EFO) identifiers of IBD (EFO_0003767 for IBD, EFO_0000384 for Crohn’s disease and EFO_0000729 for ulcerative colitis), RA (EFO_0000685) and SLE (EFO_0002690).
We filtered each of the three datasets - IBD, RA and SLE - to exclude variants that are intergenic or fall into non-coding transcripts (mature miRNA, non-coding transcript exon, non-coding transcript intron and non-coding transcript splice region). We excluded intergenic variants as they do not seem to have a relationship with the closest genes as indicated in GWAS but, instead, they seem to impact more distant genes, even those located in different chromosomes (25). Variants in non-coding transcripts are irrelevant to the SYSCID map as virtually all causal interactions in the map take place between proteins or DNA binding transcription factors and their protein-coding target genes. Finally, we prepared a MINERVA-compatible file for the creation of a visual overlay of these variants in SYSCID map in the MINERVA platform (https://syscid.elixir-luxembourg.org/, “General Overlays” tab).
2.6.2 Integration of transcriptome data to the map
For the analysis of transcriptome data integration with the map, we used the transcriptome dataset published by Mishra et al. (26) concerning the detection of DEGs by comparing gene expression profiles of RNA extracted from whole blood of remitting and non-remitting IBD patients at six time points (4, 24 and 72 h and 2, 6 and 14 weeks) after infliximab exposure with gene expression profiles determined in baseline, i.e., before drug exposure. We focused specifically on DEGs determined at 4 h in remitting patients as, according to authors, the most profound alterations occurred at this time point. This dataset is available at the NCBI GEO website under the accession number GSE191328 (https://www.ncbi.nlm.nih.gov/geo/query/acc.cgi?acc=GSE191328 and via the Supplementary Information of the original paper.
We downloaded the dataset from the above-mentioned Supplementary Information and extracted the columns related to 4 h after drug exposure, i.e., LFC_4h and padj_4h, and the column containing DEG’s HGNC symbols. We removed DEGs with an adjusted p-value ≥ 0.05 (in column padj_4h) and then normalized the log2 fold change values (in column LFC_4h) of remaining DEGs to the [-1,1] range (Table S6). Finally, we prepared the file for the creation of a visual overlay of these DEGs in SYSCID map in the MINERVA platform (https://syscid.elixir-luxembourg.org, “General overlays” tab).
2.6.3 Selection of proteins matched against variants and DEGs for further analysis
After integrating variant data from the GWAS catalogue and selected DEGs from Mishra et al. (26) in SYSCID map, we shortlisted the proteins matched against variants and DEGs, i.e., possibly altered proteins, for potential further analyses. To this end, possibly altered proteins were eligible for potential further analyses if they were (1) activating, inhibiting or catalysing at least one downstream molecular process or (2) activating or inhibiting a downstream molecule. Among the eligible proteins, we prioritized pairs of possibly altered proteins directly linked by a molecular process.
2.6.4 Functional enrichment analysis in MINERVA
To check if some of the manually annotated pathways in the SYSCID map were enriched in IBD, RA or SLE-associated gene variants or DEGs, we used the MINERVA’s GSEA plugin (27) as described in detail here: https://minerva.pages.uni.lu/doc/plugins/gsea-plugin/. In brief, the MINERVA’s GSEA plugin considers as the background gene list all genes present in the map; as the pathway database source, the plugin considers the list of annotated pathways (Table S1) in the own map. The statistical test used is the hypergeometric test and the obtained p-values are adjusted for multiple comparisons by using the Bonferroni test. Enriched pathways were those with adjusted p-value < 0.05.
3 Results
3.1 Aim and structure of the SYSCID map
CIDs, such as IBD, RA and SLE, are characterised by a chronic inflammatory state that emerges from a complex network of inter- and intracellular biochemical interactions among several proteins and small chemical compounds under strong influence of genetic and environmental factors (1). The SYSCID map focuses on presenting this complex network as a diagrammatic visualisation using systems biology standards (Figure 2). By using the MINERVA Platform (17, 27), users can explore the map interactively, request specific knowledge and visualise omics data contextualising it to related disease mechanisms. Contents of the SYSCID Map are annotated using ontologies and controlled vocabularies, and available to connect to computational workflows via a programmatic endpoint. The SYSCID map can be freely accessible by accessing https://syscid.elixir-luxembourg.org.
Figure 2 General overview of the SYSCID map The upper panel shows a pictorial overview of the most relevant IBD, RA and SLE-related organs, tissues, phenotypes, cells and molecules; the lower panel shows the MINERVA network visualization of the SYSCID map (https://syscid.elixir-luxembourg.org) with all its molecular entities and causal interactions confined in different compartments, e.g., cells and organs. The disease-specific causal interactions tend to occur in certain niches in the map; for instance, while RA-related interactions tend to happen in synovial joint, lymphoid organs, blood vessel, gut lumen and oral cavity, SLE-related interactions tend to take place in lymphoid organs, blood vessel, kidney and skin; IBD-related interactions, in turn, tend to appear mainly in gut (lumen, epithelium and lamina propria) and blood vessels.
The SYSCID map contains 1494 causal interactions between 714 molecules (341 proteins, 173 mRNAs, 76 genes, 124 complexes, 31 metabolites and 20 drugs), 80 different cell types (taking into consideration general types and different states of the same cell type, e.g., leucocyte and mature and immature plasmacytoid dendritic cells) and 131 phenotypes (24 pathological and 107 non-pathological processes) that are distributed across compartments representing organs and tissues relevant for each disease: gut (lamina propria, epithelium and lumen), skin, oral cavity, adipose tissue, kidney, synovial joint, primary (thymus) and secondary (lymph node, spleen and bone marrow) lymphatic organs and peripheral blood (Figure 2). Molecular mechanisms of selected biologics used to treat CIDs are depicted in the submap “Anti-inflammatory mechanisms of selected biologics” embedded in the main map (Table S1). Additionally, to facilitate both exploration of molecular processes and visualisation of omics data, we manually annotated 66 pathways (Table S1) - subsets of molecular processes linked to a specific phenotype or biologic - covering most of the map. These pathways were grouped into eight major pathophysiological features of CIDs as shown in Figure 3 and Table S1.
Figure 3 Pathophysiological features of IBD, RA and SLE in SYSCID map The 66 pathways in the map can be grouped into eight major pathophysiological features - associated with adaptive, innate or mixed immune system - and are linked to each other via six bacterial or endogenous metabolites (ellipses), 17 cytokines and a cytokine-induced protein (TNFAIP6) (rectangles containing official gene symbols from the Human Gene Nomenclature Committee [HGNC]).
3.2 The SYSCID map contents: a graphical review of mechanisms at the crosstalk of IBD, RA and SLE
The SYSCID map was built based on the review of IBD-, RA- and SLE-relevant literature and, as such, the exploration of SYSCID map contents leads naturally to a graphical review of key molecular mechanisms of these diseases. In this section, we summarize the contents of the map and try to show that it can serve the purpose of a user-friendly graphical review. To this end, we grouped the above-mentioned 66 manually annotated pathways into eight main pathophysiological features of these CIDs - that were, in turn, grouped into three types of immune system responses - and briefly described some relevant aspects of each pathway (Figure 3 and Table S1).
3.2.1 Innate immune system
3.2.1.1 Non-immune cells-mediated regulation of inflammation
The immune system is regulated not only by immune cells, but also by non-immune cells, such as epithelial cells, epidermal keratinocytes and synoviocytes, that, beyond forming a physical barrier against external agents, also produce bioactive effectors and regulators of the immune response (28). Therefore, it is expected that abnormal activities of non-immune cells related to the immune system regulation may be involved in the pathogenesis of inflammatory diseases (28). The SYSCID map depicts some of the molecular processes involved in these abnormal activities regarding fibroblast-like synoviocytes (FLS), gut epithelial cells and epidermal keratinocytes (Figure 3). FLSs, the dominant non-immune cells of synovial tissues, contribute to joint inflammation and destruction in RA (29). The SYSCID map illustrates regulation of production of molecules promoting joint destruction by FLS, including alarmins (30) and adipokines. (31, 32). Alarmins (S100A8 and S100A9), stimulated by IL22, and MMP1, MMP3 and prostaglandin E2, induced by adipokine, are all associated to joint destruction (33–35). Another FLS-driven proinflammatory mechanism is production of CXCL2, CXCL8, IL6 and PTGS2, regulated by the RNA-binding protein ZFP36 (36) and the proinflammatory interleukin IL1B. In addition to IL1B, the FLS activity is also stimulated by TNF. The SYSCID map illustrates regulation of TNF-induced inflammatory programs by MTORC1 depending on the availability of amino acids glutamine, arginine and leucine (37). The presence of these amino acids favours the TNF induction of STAT1-dependent genes, such as CXCL11 and TNFSF13B, while their absence leads to TNF-induced expression of NFkB-dependent genes, such as IL6, CXCL8 and PTGS2 (37). As shown in the map, gut epithelial cells can also modulate the immune response via the production of proinflammatory proteins mediated by microbial tryptophan-derived metabolites (38), endoplasmic reticulum stress (39) and gasdermin-D (40).
3.2.1.2 Regulation of phagocytes activity
Macrophages and neutrophils are key regulators of inflammatory processes via the production of cytokines and chemokines, extracellular traps (ETs) or through the interaction with other immune cells (41, 42). Their activities are tightly regulated, and their dysfunction is associated with the three CIDs as illustrated in the SYSCID map (Figure 3). One of encoded mechanisms is CEBPD-mediated regulation of macrophage activity in RA (43), representing pro-inflammatory protein IL1B promoting the expression of the transcription factor CEBPD, which regulates several pro-inflammatory proteins. Another mechanism of regulation involves TLR3-induced PKM (44) linking glycolysis pathway and pro-inflammatory activity of macrophages in RA (Vander 45). Still, the SYSCID map encodes a novel function for pro-apoptotic protein BCL2L11 in SLE (46); this protein suppresses pro-inflammatory macrophage activity by inhibiting TBK1 kinase that, in turn, activates IRF3, a transcription factor that promotes the expression of several pro-inflammatory proteins (47). Finally, regarding regulation of neutrophils activity, the SYSCID map shows that ETs, which promote IBDs through the impairment of gut epithelial barrier (48), are generated by PADI4-catalyzed citrullination of H3 histones in neutrophils (49).
3.2.1.3 Regulation of the gut epithelial barrier
The intestinal epithelial barrier (IEB) is one of the largest interfaces between the external and body environments (50). The IEB is tightly regulated, and its pathology may contribute to the aetiology of IBD, but - via licensing of immune responses - also to other CIDs such as RA and SLE (51). Intercellular junction structures (52) and the activities of gut microbiota and intraepithelial lymphocytes (IELs) are pivotal regulators of IEB (53). Molecular mechanisms involved in these three types of IEB regulation are present in the SYSCID map. One of them is regulation of the stability of gut epithelial adherens junctions involving INAVA, E-cadherin and CYTH1-activated ARF6 (54, 55). The map shows how the absence of anti-inflammatory immune cells (e.g., CD4/CD8αα T cells) as well as the context-dependent pro- and anti-inflammatory effects of microbiota-derived tryptophan metabolites (e.g., indole, indole-3-acetate, tryptamine) and cytokines (e.g., IL22) are important for the IEB homeostasis. Concerning IL22, the SYSCID map illustrates pro- and anti-inflammatory outcomes regulated by this interleukin, and its regulation by the protein ATG16L1 in engaging the CGAS–STING pathway (56).
3.2.1.4 Microbiota dysbiosis
Microbiota dysbiosis is a disruption to the microbiota homeostasis in tissues in direct contact with the external environment caused especially in response to exposure to environmental chemicals and food components. Resulting changes in the microbiota composition are linked to IBD, RA and SLE (57–59). Microbiota-derived metabolites are particularly implicated in the pathogenesis of CIDs as they seem to be essential in maintaining immunological equilibrium (60). Moreover, microbial mimic peptides are increasingly associated with CIDs; in this case, similarities between foreign and self-peptides favour an activation of autoreactive immune cells (61). The SYSCID map shows which bacterial genera produce immunoregulatory small compounds in IBD, e.g., Roseburia and Faecalibacterium for butyrate and Bifidobacteirum for acetate, and mimic peptides in RA, i.e., Eggerthella, Clostridium, Bacteroides, Cryptobacterium, Actinomyces, Atopobium and Oribacterium for peptides like COL11A2 and HLA-DRB1*0401. Moreover, the SYSCID map also displays which metabolic processes are altered due to microbiota dysbiosis in the CIDs of interest, such as the glucuronate breakdown in IBD, and the heme metabolic process in RA.
3.2.2 Adaptive immune system
3.2.2.1 Generation, activation and direct effects of autoantibodies
Self-reactive cytotoxic and helper T cells and self-reactive B cells with their terminally differentiated counterparts, the antibody-secreting plasma cells, are hallmarks of SLE and RA. Due to the failure of the peripheral tolerance processes, self-reactive naive T and B cells are not eliminated and become activated instead (62). RA- and SLE-relevant mechanisms associated with differentiation of self-reactive B and plasma cells are represented in SYSCID map such as, for example, the mechanisms of B cells differentiation stimulated by IL10, secreted either by dendritic cells (63) or by Th1 cells (64). Dendritic cells also influence B cell differentiation via TLR-activated signalling protein MYD88 (65). Moreover, the SYSCID map illustrates B cell differentiation stimulated by IL4 produced by Tfh2 cells, and its modulation by transcription factor ETS1 (66). Finally, B cell differentiation can also take place outside germinal centres driven by TLR7 in an IL21-mediated fashion (67–69).
The abovementioned activation of self-reactive plasma cells drives the production and activation of autoantibodies, a hallmark of RA and SLE. In RA, the most common and specific autoantibodies are against citrullinated protein antigens (ACPAs), mostly derived from proteins that are highly expressed but not specific for synovial joints such as vimentin and fibrinogen (70, 71). The SYSCID map depicts the presence of some of these ACPAs (72, 73) in joint and secondary lymphoid organs, and their general (arthritis) and specific (osteoclastogenesis) effects. (72, 74–76). The SYSCID map also illustrates the association of glycosylation level of antibodies with their level of inflammatory activity (77), particularly the effect of the IL23A-Th17 cell-IL22 axis on the inhibition of the expression of the ST6GAL1 enzyme in plasmablasts, driving secretion of desialylated autoantibodies with a proinflammatory activity (78).
3.2.2.2 Regulation of effector T cells activity
Effector helper (CD4) and cytotoxic (CD8) T cells play a central role in regulation of the immune system, and their regulation is closely related to IBD (79–81), RA (82) and SLE (83, 84). While helper T cells produce and release cytokines to aid other immune cells, cytotoxic T cells directly kill cells expressing antigens on their surface. The SYSCID map contains several pathways describing the activity of effector T cells and how these cells are regulated at multiple levels. At the innate immune system level, the map shows that T cells are indirectly regulated by Toll-like receptors (TLRs) pathways in conventional dendritic cells via the adaptor protein MYD88 in SLE (65). At the adaptive immune system level, the SYSCID map shows that T cells can be regulated via the influence of the phosphatase PTPN2 on their intrinsic T-cell receptor (TCR) signalling (85) and by metabolites such as glucose, tryptophan and ATP. In particular, the SYSCID map illustrates pyroptosis of pathogenic follicular helper T cells in SLE, induced by ATP-stimulated purinergic receptor P2X7 (86).
3.2.2.3 Regulation of regulatory B and T cells
The main actors able to suppress the immune system are regulatory T cells (87) and regulatory B cells (88). In autoimmune diseases such as IBD, RA and SLE, multiple molecular mechanisms inhibit the suppressive function of the regulatory cells (89, 90). The SYSCID map illustrates pathways covering a range of molecular mechanisms underlying the suppression of regulatory cells function such as, for example, the activation of protein receptor TNFRSF4 (OX40) in OX40L/OX40-mediated Treg cells dysfunction (68) and the inhibition of Treg cells inhibitory function by TNF (91) and leptin (92). Additionally, three interleukins, namely IL9, IL21 and IL6, are also involved in Treg cells suppression. While IL9 negatively influences the ILC2-dependent Treg activation (93), IL21 suppresses the activation of follicular Treg cells (94–96). Regarding IL6, Svensson et al. (97) reported that this interleukin mediates the conversion of regulatory T cells into effector Th17 cells. Under IL6 influence, the fate of regulatory T cells depends on the decreased expression of the phosphatase PTPN2. When PTPN2 is expressed, the IL6-driven production of IL17A is inhibited and Treg cells keep their regulatory state. Otherwise, IL17A is produced, and T cells become Th17 cells (97).
3.2.3 Mixed innate and adaptive immune system
3.2.3.1 Effects of biologic drugs
Several biologic drugs used to treat IBD, RA and SLE, including abatacept, adalimumab, anifrolumab, anakinra, belimumab, canakinumab, certolizumab, etanercept, golimumab, infliximab, ixekizumab, risankizumab, rituximab, secukinumab, sarilumab, tocilizumab, vedolizumab and ustekinumab are represented in the SYSCID map, specifically in the submap “Anti-inflammatory mechanisms of selected biologics” (Table S1). This submap shows anti-inflammatory mechanisms of most of these biologics, excluding anakinra, canakinumab, ixekizumab, sarilumab, ustekinumab and anifrolumab, for which the map contains only direct targets. Among the biologic drugs present in the submap, vedolizumab seems to be the one that affects the greatest number of phenotypes. This drug is used to treat IBD by inhibition of the integrin α4β7 (heterodimer ITGA4-ITGB7). Through this inhibition, vedolizumab downregulates the expression of several proteins that favour disease progression and stimulates the conversion of pro-inflammatory M1 macrophages into anti-inflammatory M2 macrophage (98). Interestingly, as shown in the biologics submap, this conversion is also stimulated by adalimumab and infliximab by the mechanism of TNF receptor:Fc receptor co-stimulation. Still regarding infliximab, the submap shows this biologic restores monocytes apoptosis sensitivity via downregulation of miR-29b and consequent upregulation of the apoptosis-inducing protein HBP1, one of the miR-29b targets (99). Moreover, infliximab, as well as certolizumab pegol, favours CIDs remission through downregulation of the proinflammatory protein GDF1 via upregulation of TGFB1 in PBMCs (100). Finally, it is worth to mention that anti-TNF drugs, such as infliximab, have been demonstrated to cause clinical symptoms that mimic lupus in treated patients (101). Called anti-TNF-induced lupus (ATIL), this entity is characterized by the presence of many types of autoantibodies as represented in the map: antinuclear, anti-dsDNA, anti-histone, anti-Smith and anti-citrullinated protein antibodies (101).
3.3 Exploration of the SYSCID map
The SYSCID map is a graphical review of the molecular mechanisms of IBD, RA and SLE which supports integrated visualisation of omics data. Below, we describe how the map combined with genome-wide association studies (GWAS) and transcriptome data highlights potential molecular mechanisms affected by gene variants or differentially expressed genes (DEGs). Such integration is useful to detect gaps between knowledge about mechanisms of diseases and omics-derived observations. Moreover, it can lead to the discovery of potential mechanistic biomarkers, i.e., activation of cellular pathways (102) that are specific to the mechanisms underlying a given disease (14).
3.3.1 Suggesting mechanistic consequences of gene variants
We collected genes harbouring variants, i.e., single nucleotide polymorphisms (SNPs), associated with IBD, RA and SLE from the GWAS catalogue (24) (see “Material and Methods”; Tables S2 to S5). These genes, hereafter called disease-associated genes (DAGs), were integrated with the SYSCID map as a publicly available dataset. As a result, out of the 897 DAGs in total (Table S2), i) 45 matched the contents of the map for IBD (Table S3), ii) 53 for RA (Table S4), and iii) 35 for SLE (Table S5). For these DAGs, we performed a SYSCID map-based pathway enrichment analysis (as described in “Methods”), separately for each disease. One pathway was enriched for RA DAGs and three for IBD and SLE DAGs, as shown in Table 1. The single enriched pathway in RA DAGs is the “Regulation of IL10 production in Th1 cells” (adjusted p = 0.0095). Interestingly, this pathway was also enriched in IBD (adjusted p = 0.00125) and SLE DAGs (adjusted p = 0.0003) and is the top enriched pathway in all three CIDs.
Table 1 Annotated pathways significantly enriched (adjusted p < 0.05) in DAGs matching their corresponding proteins in SYSCID map.
By integrating the GWAS catalogue data to the SYSCID map, we could indicate a specific immunological feature potentially common to these three CIDs, namely, the regulation of IL10 production in Th1 cells. The production of IL10 in IBD, RA and SLE dictates their course: while in SLE patients IL10 favours B cell differentiation and autoantibody production as shown in the SYSCID map (see pathway “IL10-mediated B cell differentiation”), a dysfunction of IL10 production makes mice prone to spontaneous colitis (103, 104). Still regarding IBD, the SYSCID map indicates that deficiency of IL10 induces chronic endoplasmic reticulum stress in the gut and promotes IBD-like disease in mice (103). Finally, in RA, unlike SLE and similar to IBD, IL10 has been linked to reduced expression of proinflammatory proteins and consequent alleviation of joint inflammation (105).
We extended the pathway enrichment analysis performed after the integration of DAGs to the SYSCID map to investigate their influence at the mechanistic level. To this end, we manually inspected the pathways of the SYSCID map for proteins encoded by the matched DAGs that directly influence other proteins.
In this regard, the pathway “Regulation of the stability of gut epithelial adherens junctions” is an interesting case. As already described in the previous section, the protein encoded by a mutated version of INAVA (rs41313912, missense variant, Tyr333Phe), which is associated with increased risk of IBD (54), is not able to impede the ARF6-mediated internalisation of CDH1 and the consequent destabilisation of the adherens junctions (55). This happens because this mutated version of INAVA is more prone to ubiquitination than its wild-type version. If INAVA is degraded by proteasome, then CYTH1 is stabilised and directly promotes the ARF6-mediated internalisation of CDH1 (55). Although this missense variant is not present in the GWAS catalogue as this study is not eligible for inclusion in the GWAS Catalogue (https://www.ebi.ac.uk/gwas/docs/methods), it is still an interesting example of mechanistic downstream consequences of a gene variant. Importantly, INAVA also has IBD-related variants according to the GWAS catalogue, namely rs12131796, rs35730213, rs55838263, rs7554511 and rs905634, and the genes CYTH1 and CDH1, coding for proteins downstream to INAVA, also have IBD-related variants according to the GWAS catalogue: rs17736589 for CYTH1, and rs16958356 and rs16958356 for CDH1. Therefore, gut epithelial adherens junctions seem to be heavily affected by genetic variation.
Another example of mechanistic interpretation of GWAS data is protein encoded by a PADI2 gene bearing two intron RA-associated variants (rs2235909 and rs761426) in pathway “Induction of osteoclastogenesis by autoantibodies against citrullinated proteins”. This enzyme citrullinates other proteins. In RA, PADI2 citrullinates, among others, the protein vimentin, a potential target of the anti–citrullinated protein auto-antibodies (ACPAs) (71). Therefore, given the intronic location of variations, the mechanistic link between PADI2 variants and the development of RA could be an increased amount of citrullinated vimentin in synovial joint due either to a potential alternative spliced form of PADI2 encoding for a more enzymatically active PADI2 or to an upregulation of this enzyme. There is evidence for the latter case: the RA risk T allele of rs761426 significantly increases expression levels of PADI2 in whole blood (106).
The above examples show that, through the integration of GWAS data with SYSCID map, we could identify pathways that are likely to be common to the three CIDs of interest and formulate some hypotheses about how IBD and RA can be affected by altered proteins encoded by, respectively, IBD- and RA-associated genetic variants.
3.3.2 Analysis and interpretation of altered gene expression
We integrated transcriptome data with the SYSCID map to demonstrate possible mechanistic consequences related to differentially expressed genes (DEGs). To this end, we used the dataset from the study of therapy response in IBD patients treated with anti-TNF therapy, i.e., infliximab (26). We selected this study because it tries to address one of the most CIDs-related clinically relevant challenges: the low remission rates of the current treatment options for these diseases.
In this study, DEGs were calculated by comparing gene expression profiles of RNA extracted from whole blood of remitting and non-remitting IBD patients at six time points (4, 24 and 72 h and 2, 6 and 14 weeks) after infliximab exposure with gene expression profiles determined in baseline, i.e., before drug exposure. We focused specifically on DEGs determined at 4 h in remitting patients as, according to the authors, the most significant alterations occurred at this time point. Of the 2722 DEGs at 4 h (compared with baseline; Table S6), 79 could be matched to their corresponding proteins in the SYSCID map (Table S7). Among them, 29 (highlighted in Table S7) were considered eligible, i.e., they are modifiers of downstream molecular processes or molecules (more details in “Methods”), for the mechanistic interpretation of their alterations and possible consequences linked to the induction of remission in IBD patients after anti-TNF therapy exposure. We here selected specifically the protein TBK1 for further analysis as it is the only eligible protein that is mechanistically and directly linked to another possible altered protein, the transcription factor IRF3.
TBK1 is a serine/threonine-protein kinase involved in multiple signalling pathways, including the TLR-triggered activation of IRF3, a sequence-specific DNA binding transcription factor (dbTF) that activates the transcription of type I interferon (IFN) genes and some IFN-stimulated genes (ISG), among other target genes (47). TBK1 directly phosphorylates IRF3 and, as a result, this protein migrates to the nucleus to initiate the transcription of their target genes (47).
IRF3 is upregulated at 4h after infliximab exposure compared to baseline only in patients that attain remission at week 14. At first sight, it is surprising to find this gene upregulated after anti-TNF therapy as we would expect an equally upregulation of IRF3’s target type I IFN genes and ISGs that, in turn, are associated with a poor clinical response to infliximab treatment (107). However, when we check which known IRF3’s target genes - according to the Dorothea gene regulatory network, https://saezlab.github.io/dorothea/ (Table S8) - are upregulated among the DEGs at 4h, we find no type I IFN genes and ISGs, except for CCL5, among the list of 14 DEGs (Table S9); therefore, most of the type I IFN genes and ISGs were not affected in infliximab-treated remitting patients, which is in agreement with the above-mentioned study by van Baarsen. These 14 IRF3’s target DEGs, which are not present in SYSCID map and are not currently associated with IBD, are known to be involved in antiviral defence, regulation of cell cycle transition and immune cell migration according to annotations from the Gene Ontology (GO) database (20, 21).
Interestingly, while IRF3 is upregulated 4h post-exposure to infliximab, compared to baseline, TBK1 is downregulated (Figure 4). As shown above, it seems that IRF3 potentially activates only the transcription of a selected set of non-type I IFN genes and non-ISGs at 4h after infliximab exposure. We therefore hypothesize that, due to lower amounts of TBK1, hypophosphorylated forms of IRF3 would be generated and such forms would be able to transcribe only these non-type I IFN genes and non-ISGs. This hypothesis relies on the experimental observation that incremental IRF3 phosphorylation progressively changes the IRF3 conformation in a way that it becomes competent for the induction of IFNB (108).
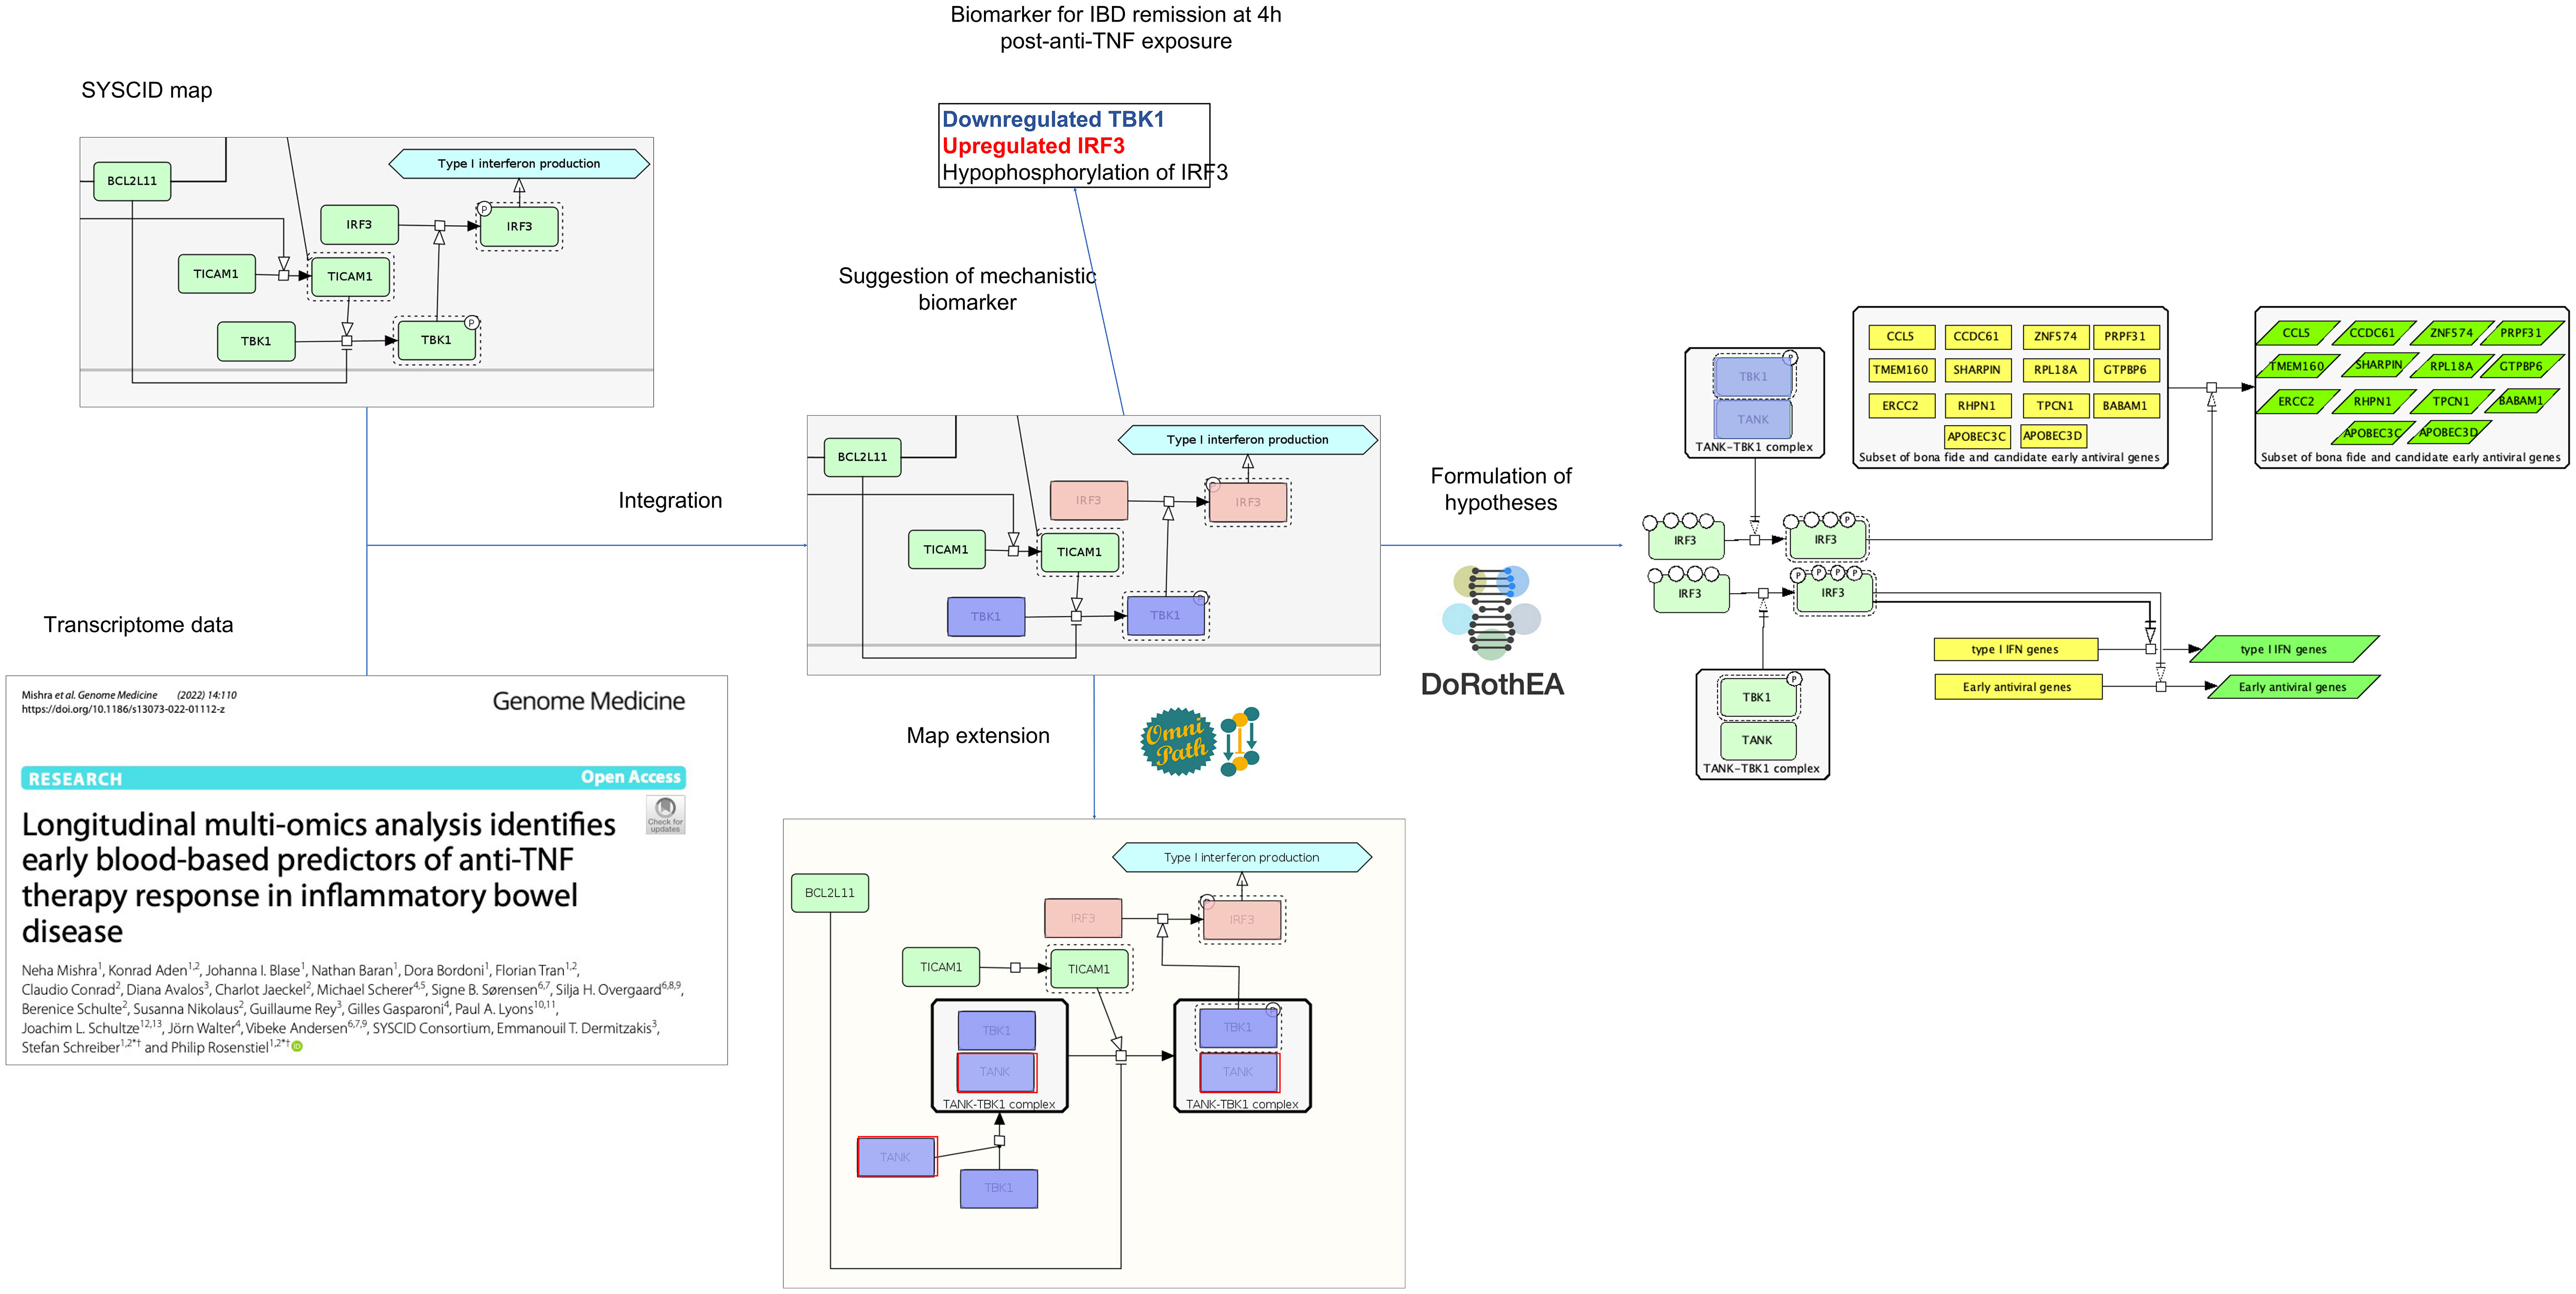
Figure 4 Possible outcomes after the integration of omics data within the SYSCID map Testable hypotheses can be formulated, such as that the differential transcription of IRF3 target genes is modulated by differential IRF3 phosphorylation states (right) and that TBK1 capacity to phosphorylate IRF3 is impaired by low amounts of TANK (below). TANK, in fact, was not originally present in the map; however, by checking an external signalling pathways database - in this case, Omnipath (https://omnipathdb.org/) -, this protein could be added to the map to clearly show the TANK-TBK1 interaction. Finally, potential mechanistic molecular biomarkers can be suggested; in this case, the combination of underexpressed TBK1, upregulated IRF3 and hypophosphorylated IRF3 is suggested as biomarker for remission. Light green, pink and blue-purple rectangles are, respectively, unaltered, upregulated and downregulated proteins; yellow rectangles represent genes and dark green parallelograms represent mRNAs. All proteins, mRNAs and genes are identified by HGNC symbols.
To phosphorylate and activate IRF3, TBK1 per se should physically interact with the scaffold protein TANK. Although this protein is not present in SYSCID map, it may also be involved in infliximab-lead remission in IBD patients since its encoding gene, TANK, is downregulated 4h after inflixumab exposure in comparison to baseline. So, we can hypothesize that low amounts of TANK would impair the TBK1’s capacity to phosphorylate IRF3. As TBK1 itself is also downregulated, then IRF3 phosphorylation would be greatly reduced. This fact warrants the addition of TANK to the SYSCID map and suggests that the combination of downregulated TANK and TBK1 and IRF3 hypo-phosphorylation could be a potential mechanistic molecular biomarker for remission in IBD patients.
The above example shows that, through the integration of omics data within SYSCID map, we could formulate two related and testable hypotheses - (1) differential transcription of IRF3 target genes is modulated by differential IRF3 phosphorylation states and (2) TBK1 capacity to phosphorylate IRF3 is impaired by low amounts of TANK - and suggest an expansion of SYSCID map via the addition of the TANK-TBK1 interaction. Moreover, we also could suggest a potential mechanistic molecular biomarker for remission, i.e., low TANK, low TBK1 and IRF3 hypo-phosphorylation (Figure 4). Finally, although not directed related to the content of the map but triggered by the integration of omics data within SYSCID map, we were also able to detect a new set of genes that should be investigated due to their potential involvement in the infliximab-lead remission in IBD patients.
4 Discussion
Representing molecular processes underlying a disease in the form of networks has become increasingly popular in systems biomedicine. Undoubtedly, the analysis and exploration of these networks have led to valuable insights into how diseases may emerge from the complex interactions between numerous biological components. Additionally, the analysis of these disease networks can also be useful for suggesting biomarkers and drug targets. However, these networks are generic, implying that interactions among their elements do not necessarily reflect true interactions under the context of a specific disease. Moreover, generic networks lack cell specificity and usually do not have proper annotations.
When building a disease map, we aim to move from the generic characterization of a disease to a more disease-specific molecular mechanistic network considering different cell types, tissues, organs and disease states (109). Based on this disease specificity, we assume that such a type of network can provide more insights into mechanisms of the disease of interest than the generic one. Although such assumption lacks formal demonstration, an increasing number of studies reporting methods to enhance generic networks specifically for a disease (110–112) indicates that scientific community has recognized how critical is a disease-specific network to better prioritize drug targets and biomarkers candidates for a disease of interest.
Based on the above-mentioned considerations and the successful applications of previous disease-specific molecular mechanistic networks, the disease maps (113–115), we opted for the construction of the network representing the IBD, RA and SLE-specific molecular mechanisms in a disease map format, i.e., the SYSCID map. We could demonstrate that this map can be useful as an interactive, graphical review of IBD, RA and SLE molecular mechanisms and, when integrated with transcriptome and GWAS data, the map can be used to indicate potential effects on altered pathways and propose possible mechanistic biomarkers.
4.1 Limitations of the study
It is important to emphasize that SYSCID map, as for other disease maps, does not cover all knowledge encompassing IBD, RA and SLE-specific molecular mechanisms. As this map was constructed via manual biocuration of domain experts-suggested biomedical literature on these CIDs, the molecular mechanisms present in the map reflect the coverage limitation intrinsic to the laborious and time-demanding biocuration process. Nonetheless, the SYSCID map seems to cover key mechanisms for the CIDs of interest as shown in Figure 2 and Table S1. To expand the map and keep it as updated as possible, periodic revisions are planned. Finally, the long-term sustainability of the SYSCID map will be guaranteed by the ELIXIR Luxembourg’s “Disease Map” service (https://elixir-luxembourg.org/services/catalog/minerva/).
Data availability statement
The original contributions presented in the study are included in the article/Supplementary Material. Further inquiries can be directed to the corresponding author.
Author contributions
MA: Data curation, Formal Analysis, Writing – original draft, Writing – review & editing. MO: Conceptualization, Data curation, Supervision, Writing – review & editing. AM: Visualization, Writing – review & editing. PR: Funding acquisition, Project administration, Writing – review & editing. KA: Writing – review & editing. NM: Writing – review & editing. VA: Writing – review & editing. PS: Writing – review & editing. AB: Writing – review & editing. AnF: Writing – review & editing. SR: Writing – review & editing. AxF: Writing – review & editing. WG: Project administration, Writing – review & editing. RS: Project administration, Writing – review & editing. VS: Project administration, Supervision, Writing – review & editing.
Funding
The author(s) declare financial support was received for the research, authorship, and/or publication of this article. This project received funding from the European Union’s Horizon 2020 research and innovation programme under grant agreement No 733100.
Conflict of interest
The authors declare that the research was conducted in the absence of any commercial or financial relationships that could be construed as a potential conflict of interest.
The author(s) declared that they were an editorial board member of Frontiers, at the time of submission. This had no impact on the peer review process and the final decision.
Publisher’s note
All claims expressed in this article are solely those of the authors and do not necessarily represent those of their affiliated organizations, or those of the publisher, the editors and the reviewers. Any product that may be evaluated in this article, or claim that may be made by its manufacturer, is not guaranteed or endorsed by the publisher.
Supplementary material
The Supplementary Material for this article can be found online at: https://www.frontiersin.org/articles/10.3389/fimmu.2023.1257321/full#supplementary-material
Supplementary Table 1 | Pathophysiological features and related pathways present in SYSCID map.
Supplementary Table 2 | IBD-, RA- and SLE-associated genes extracted from GWAS Catalog on 04.11.2022.
Supplementary Table 3 | IBD-associated genes extracted from GWAS Catalog on 04.11.2022 that could be integrated into the map.
Supplementary Table 4 | RA-associated genes extracted from GWAS Catalog on 04.11.2022 that could be integrated into the map.
Supplementary Table 5 | SLE-associated genes extracted from GWAS Catalog on 04.11.2022 that could be integrated into the map.
Supplementary Table 6 | Differentially expressed genes (DEGs) from GSE191328 dataset (t = 4h vs baseline).
Supplementary Table 7 | DEGs (t = 4h after treatment vs baseline) from GSE191328 dataset that could be integrated into the map.
Supplementary Table 8 | IRF3 Target genes (according to Dorothea’s TF-TG network, confidence A to C).
Supplementary Table 9 | IRF3 target genes (according to Dorothea’s TF-TG network; confidence A to C) in DEGs (t = 4h after treatment vs baseline) from the GSE191328 dataset.
Supplementary Table 10 | Publications used for manual curation and construction of the SYSCID map.
References
1. Schultze JL, Rosenstiel P. Systems medicine in chronic inflammatory diseases. Immunity (2018) 48(4):608–135. doi: 10.1016/j.immuni.2018.03.022
2. McInnes IB, Gravallese EM. Immune-Mediated inflammatory disease therapeutics: past, present and future. Nat Rev Immunol (2021) 21(10):680–865. doi: 10.1038/s41577-021-00603-1
3. El-Gabalawy H, Guenther LC, Bernstein CN. Epidemiology of immune-mediated inflammatory diseases: incidence, prevalence, natural history, and comorbidities. J Rheumatol Suppl (2010) 85:2–10. doi: 10.3899/jrheum.091461
4. Jairath V, Feagan BG. Global burden of inflammatory bowel disease. Lancet Gastroenterol Hepatol (2020) 5(1):2–35. doi: 10.1016/S2468-1253(19)30358-9
5. Jacobs P, Bissonnette R, Guenther LC. Socioeconomic burden of immune-mediated inflammatory diseases–focusing on work productivity and disability. J Rheumatol Supplement (2011) 88(November):55–61. doi: 10.3899/jrheum.110901
6. Jung SM, Kim W-U. Targeted immunotherapy for autoimmune disease. Immune Network (2022) 22(1):e95. doi: 10.4110/in.2022.22.e9
7. Maniadakis N, Toth E, Schiff M, Wang X, Nassim M, Szegvari B, et al. A targeted literature review examining biologic therapy compliance and persistence in chronic inflammatory diseases to identify the associated unmet needs, driving factors, and consequences. Adv Ther (2018) 35(9):1333–555. doi: 10.1007/s12325-018-0759-0
8. Nikolaus S, Raedler A, Kühbacher T, Sfikas N, Fölsch UR, Schreiber S. Mechanisms in failure of infliximab for crohn’s disease. Lancet (2000) 356(9240):1475–79. doi: 10.1016/S0140-6736(00)02871-3
9. Ordás I, Feagan BG, Sandborn WJ. Therapeutic drug monitoring of tumor necrosis factor antagonists in inflammatory bowel disease. Clin Gastroenterol Hepatol (2012) 10(10):1079–875. doi: 10.1016/j.cgh.2012.06.032
10. D’Antiga L. Coronaviruses and immunosuppressed patients: The facts during the third epidemic. Liver Transpl (2020) 26(6):832–4. doi: 10.1002/lt.25756
11. Sim TM, Ong SJ, Mak A, Tay SH. Type I interferons in systemic lupus erythematosus: A journey from bench to bedside. Int J Mol Sci (2022) 23(5):25055. doi: 10.3390/ijms23052505
12. Yang B, Zhao M, Wu H, Lu Q. A comprehensive review of biological agents for lupus: beyond single target. Front Immunol (2020) 11:539797(October). doi: 10.3389/fimmu.2020.539797
13. Gold SL, Steinlauf AF. Efficacy and safety of dual biologic therapy in patients with inflammatory bowel disease: A review of the literature. Gastroenterol Hepatol (2021) 17(9):406–145.
14. Robinson WH, Lindstrom TM, Cheung RK, Sokolove J. Mechanistic biomarkers for clinical decision making in rheumatic diseases. Nat Rev Rheumatol (2013) 9(5):267–765. doi: 10.1038/nrrheum.2013.14
15. Funahashi A, Morohashi M, Kitano H, Tanimura N. CellDesigner: A process diagram editor for gene-regulatory and biochemical networks. BIOSILICO (2003) 1(5):159–625. doi: 10.1016/S1478-5382(03)02370-9
16. Le Novère N, Hucka M, Mi H, Moodie S, Schreiber F, Sorokin A, et al. The systems biology graphical notation. Nat Biotechnol (2009) 27(8):735–41. doi: 10.1038/nbt.1558
17. Gawron P, Ostaszewski M, Satagopam V, Gebel S, Mazein A, Kuzma M, et al. MINERVA—a platform for visualization and curation of molecular interaction networks. NPJ Syst Biol Appl (2016) 2(1):16020. doi: 10.1038/npjsba.2016.20
18. Mazein A, Acencio ML, Balaur I, Rougny A, Welter D, Niarakis A, et al. A guide for developing comprehensive systems biology maps of disease mechanisms: planning, construction and maintenance. Front Bioinform (2023) 3:1197310. doi: 10.3389/fbinf.2023.1197310
19. Novère NLe, Finney A, Hucka M, Bhalla US, Campagne F, Collado-Vides J, et al. Minimum information requested in the annotation of biochemical models (MIRIAM). Nat Biotechnol (2005) 23(12):1509–15. doi: 10.1038/nbt1156
20. Ashburner M, Ball CA, Blake JA, Botstein D, Butler H, Cherry JM, et al. Gene ontology: tool for the unification of biology. The gene ontology consortium. Nat Genet (2000) 25(1):25–9. doi: 10.1038/75556
21. Gene Ontology Consortium. The gene ontology resource: enriching a GOld mine. Nucleic Acids Res (2021) 49(D1):D325–34. doi: 10.1093/nar/gkaa1113
22. Hastings J, Owen G, Dekker A, Ennis M, Kale N, Muthukrishnan V, et al. ChEBI in 2016: improved services and an expanding collection of metabolites. Nucleic Acids Res (2016) 44(D1):D1214–9. doi: 10.1093/nar/gkv1031
23. Wishart DS, Feunang YD, Guo A, Lo EJ, Marcu A, Grant JR, et al. DrugBank 5.0: A major update to the drugBank database for 2018. Nucleic Acids Res (2018) 46(D1):D1074–82. doi: 10.1093/nar/gkx1037
24. Buniello A, MacArthur JAL, Cerezo M, Laura W, Hayhurst J, et al. The NHGRI-EBI GWAS catalog of published genome-wide association studies, targeted arrays and summary statistics 2019. Nucleic Acids Res (2019) 47(D1):D1005–12. doi: 10.1093/nar/gky1120
25. Dhamija S, Menon MB. Non-coding transcript variants of protein-coding genes - what are they good for? RNA Biol (2018) 15(8):1025–315. doi: 10.1080/15476286.2018.1511675
26. Mishra N, Aden K, Blase JI, Baran N, Bordoni D, Tran F, et al. Longitudinal multi-omics analysis identifies early blood-based predictors of anti-TNF therapy response in inflammatory bowel disease. Genome Med (2022) 14(1):110. doi: 10.1186/s13073-022-01112-z
27. Hoksza D, Gawron P, Ostaszewski M, Smula E, Schneider R. MINERVA API and plugins: opening molecular network analysis and visualization to the community. Bioinf (Oxford England) (2019) 35(21):4496–985. doi: 10.1093/bioinformatics/btz286
28. Dainichi T, Kabashima K, Ivanov II, Goto Y. Editorial: regulation of immunity by non-immune cells. Front Immunol (2021) 12:770847(September). doi: 10.3389/fimmu.2021.770847
29. Yoshitomi H. Regulation of immune responses and chronic inflammation by fibroblast-like synoviocytes. Front Immunol (2019) 10:1395. doi: 10.3389/fimmu.2019.01395
30. Carrión M, Juarranz Y, Martínez C, González-Álvaro I, Pablos JoséL, Gutiérrez-Cañas I, et al. IL-22/IL-22R1 axis and S100A8/A9 alarmins in human osteoarthritic and rheumatoid arthritis synovial fibroblasts. Rheumatol (Oxford England) (2013) 52(12):2177–865. doi: 10.1093/rheumatology/ket315
31. Brentano F, Schorr O, Ospelt C, Stanczyk J, Gay RE, Gay S, et al. Pre-B cell colony-Enhancing factor/Visfatin, a new marker of inflammation in rheumatoid arthritis with proinflammatory and matrix-Degrading activities. Arthritis Rheumatism (2007) 56(9):2829–395. doi: 10.1002/art.22833
32. Kusunoki N, Kitahara K, Kojima F, Tanaka N, Kaneko K, Endo H, et al. Adiponectin stimulates prostaglandin E(2) production in rheumatoid arthritis synovial fibroblasts. Arthritis Rheumatism (2010) 62(6):1641–495. doi: 10.1002/art.27450
33. Rengel Y, Ospelt C, Gay S. Proteinases in the joint: clinical relevance of proteinases in joint destruction. Arthritis Res Ther (2007) 9(5):2215. doi: 10.1186/ar2304
34. Geven EJW, Bosch MHJv, Ceglie IDi, Ascone G, Abdollahi-Roodsaz S, Sloetjes AW, et al. S100A8/A9, a potent serum and molecular imaging biomarker for synovial inflammation and joint destruction in seronegative experimental arthritis. Arthritis Res Ther (2016) 18(1):247. doi: 10.1186/s13075-016-1121-z
35. Ma Y, Hong F-F, Yang S-L. Role of prostaglandins in rheumatoid arthritis. Clin Exp Rheumatol (2021) 39(1):162–725. doi: 10.55563/clinexprheumatol/1jlh15
36. Angiolilli C, Kabala PA, Grabiec AM, Rossato M, Lai W, Fossati G, et al. Control of cytokine mRNA degradation by the histone deacetylase inhibitor ITF2357 in rheumatoid arthritis fibroblast-like synoviocytes: beyond transcriptional regulation. Arthritis Res Ther (2018) 20(1):148. doi: 10.1186/s13075-018-1638-4
37. Karonitsch T, Kandasamy RK, Kartnig F, Herdy B, Dalwigk K, Niederreiter B, et al. mTOR senses environmental cues to shape the fibroblast-like synoviocyte response to inflammation. Cell Rep (2018) 23(7):2157–67. doi: 10.1016/j.celrep.2018.04.044
38. Jin U-H, Lee S-O, Sridharan G, Lee K, Davidson LA, Jayaraman A, et al. Microbiome-derived tryptophan metabolites and their aryl hydrocarbon receptor-dependent agonist and antagonist activities. Mol Pharmacol (2014) 85(5):777–885. doi: 10.1124/mol.113.091165
39. Stengel ST, Fazio A, Lipinski S, Jahn MT, Aden K, Ito Go, et al. Activating transcription factor 6 mediates inflammatory signals in intestinal epithelial cells upon endoplasmic reticulum stress. Gastroenterology (2020) 159(4):1357–1374.e10. doi: 10.1053/j.gastro.2020.06.088
40. Bulek K, Zhao J, Liao Y, Rana N, Corridoni D, Antanaviciute A, et al. Epithelial-derived gasdermin D mediates nonlytic IL-1β Release during experimental colitis. J Clin Invest (2020) 130(8):4218–34. doi: 10.1172/JCI138103
41. Ushio A, Arakaki R, Yamada A, Saito M, Tsunematsu T, Kudo Y, et al. Crucial roles of macrophages in the pathogenesis of autoimmune disease. World J Immunol (2017) 7(1):15. doi: 10.5411/wji.v7.i1.1
42. Fu X, Liu H, Huang G, Dai S-S. The emerging role of neutrophils in autoimmune-associated disorders: effector, predictor, and therapeutic targets. MedComm (2021) 2(3):402–135. doi: 10.1002/mco2.69
43. Chang LH, Huang HS, Wu PT, Jou IM, Pan MH, Chang WC, et al. Role of macrophage CCAAT/enhancer binding protein delta in the pathogenesis of rheumatoid arthritis in collagen-induced arthritic mice. PloS One (2012) 7(9):e45378. doi: 10.1371/journal.pone.0045378
44. Xu J, Jiang C, Wang X, Geng M, Peng Y, Guo Y, et al. Upregulated PKM2 in macrophages exacerbates experimental arthritis via STAT1 signaling. J Immunol (2020) 205(1):181–92. doi: 10.4049/jimmunol.1901021
45. Heiden V, Matthew G, Locasale JW, Swanson KD, Sharfi H, Heffron GJ, et al. Evidence for an alternative glycolytic pathway in rapidly proliferating cells. Sci (New York N.Y.) (2010) 329(5998):1492–99. doi: 10.1126/science.1188015
46. Tsai F, Homan PJ, Agrawal H, Misharin AV, Abdala-Valencia H, Haines GK, et al. Bim suppresses the development of SLE by limiting myeloid inflammatory responses. J Exp Med (2017) 214(12):3753–73. doi: 10.1084/jem.20170479
47. Jefferies CA. Regulating IRFs in IFN driven disease. Front Immunol (2019) 10:325(March). doi: 10.3389/fimmu.2019.00325
48. Lin EY-H, Lai H-J, Cheng Y-K, Leong K-Q, Cheng L-C, Chou Y-C, et al. Neutrophil extracellular traps impair intestinal barrier function during experimental colitis. Biomedicines (2020) 8(8):2755. doi: 10.3390/biomedicines8080275
49. Zhang T, Mei Y, Dong W, Wang J, Huang F, Wu J. Evaluation of protein arginine deiminase-4 inhibitor in TNBS- induced colitis in mice. Int Immunopharmacol (2020) 84(July):106583. doi: 10.1016/j.intimp.2020.106583
50. Barbara G, Barbaro MR, Fuschi D, Palombo M, Falangone F, Cremon C, et al. Inflammatory and microbiota-related regulation of the intestinal epithelial barrier. Front Nutr (2021) 8:718356(September). doi: 10.3389/fnut.2021.718356
51. Akdis CA. Does the epithelial barrier hypothesis explain the increase in allergy, autoimmunity and other chronic conditions? Nat Rev Immunol (2021) 21(11):739–51. doi: 10.1038/s41577-021-00538-7
52. Suzuki T. Regulation of intestinal epithelial permeability by tight junctions. Cell Mol Life Sci (2013) 70(4):631–59. doi: 10.1007/s00018-012-1070-x
53. Olivares-Villagómez D, Kaer LV. Intestinal intraepithelial lymphocytes: sentinels of the mucosal barrier. Trends Immunol (2018) 39(4):264–755. doi: 10.1016/j.it.2017.11.003
54. Rivas MA, Beaudoin Mélissa, Gardet A, Stevens C, Sharma Y, Zhang CK, et al. Deep resequencing of GWAS loci identifies independent rare variants associated with inflammatory bowel disease. Nat Genet (2011) 43(11):1066–73. doi: 10.1038/ng.952
55. Mohanan V, Nakata T, Nicole Desch A, Lévesque Chloé, Boroughs A, Guzman G, et al. C1orf106 is a colitis risk gene that regulates stability of epithelial adherens junctions. Sci (New York N.Y.) (2018) 359(6380):1161–66. doi: 10.1126/science.aan0814
56. Aden K, Tran F, Ito G, Sheibani-Tezerji R, Lipinski S, Kuipe JW, et al. ATG16L1 orchestrates interleukin-22 signaling in the intestinal epithelium via cGAS-STING. J Exp Med (2018) 215(11):2868–86. doi: 10.1084/jem.20171029
57. Zhang X, Zhang D, Jia H, Feng Q, Wang D, Liang Di, et al. The oral and gut microbiomes are perturbed in rheumatoid arthritis and partly normalized after treatment. Nat Med (2015) 21(8):895–905. doi: 10.1038/nm.3914
58. Alshehri D, Saadah O, Mosli M, Edris S, Alhindi R, Bahieldin A. Dysbiosis of gut microbiota in inflammatory bowel disease: current therapies and potential for microbiota-Modulating therapeutic approaches. Bosnian J Basic Med Sci (2020) 21:270–83. doi: 10.17305/bjbms.2020.5016
59. Tomofuji Y, Maeda Y, Oguro-Igashira E, Kishikawa T, Yamamoto K, Sonehara K, et al. Metagenome-wide association study revealed disease-specific landscape of the gut microbiome of systemic lupus erythematosus in Japanese. Ann Rheumatic Dis (2021) 80(12):1575–83. doi: 10.1136/annrheumdis-2021-220687
60. Forbes JD, Domselaar GV, Bernstein CN. The gut microbiota in immune-mediated inflammatory diseases. Front Microbiol (2016) 7:1081(July). doi: 10.3389/fmicb.2016.01081
61. Rojas M, Restrepo-Jiménez P, Monsalve DM, Pacheco Y, Acosta-Ampudia Y, Ramírez-Santana C, et al. Molecular mimicry and autoimmunity. J Autoimmun (2018) 95(December):100–23. doi: 10.1016/j.jaut.2018.10.012
62. Zhang P, Lu Q. Genetic and epigenetic influences on the loss of tolerance in autoimmunity. Cell Mol Immunol (2018) 15(6):575–855. doi: 10.1038/cmi.2017.137
63. Joo H, Coquery C, Xue Y, Gayet I, Dillon SR, Punaro M, et al. Serum from patients with SLE instructs monocytes to promote igG and igA plasmablast differentiation. J Exp Med (2012) 209(7):1335–485. doi: 10.1084/jem.20111644
64. Caielli S, Veiga DT, Balasubramanian P, Athale S, Domic B, Murat E, et al. A CD4+ T cell population expanded in lupus blood provides B cell help through interleukin-10 and succinate. Nat Med (2019) 25(1):75–81. doi: 10.1038/s41591-018-0254-9
65. Teichmann LL, Schenten D, Medzhitov R, Kashgarian M, Shlomchik MJ. Signals via the adaptor myD88 in B cells and DCs make distinct and synergistic contributions to immune activation and tissue damage in lupus. Immunity (2013) 38(3):528–405. doi: 10.1016/j.immuni.2012.11.017
66. Kim CJ, Lee C-G, Jung J-Y, Ghosh A, Hasan SN, Hwang S-M, et al. The transcription factor ets1 suppresses T follicular helper type 2 cell differentiation to halt the onset of systemic lupus erythematosus. Immunity (2018) 49(6):1034–1048.e8. doi: 10.1016/j.immuni.2018.10.012
67. Klein U, Casola S, Cattoretti G, Shen Q, Lia M, Mo T, et al. Transcription factor IRF4 controls plasma cell differentiation and class-switch recombination. Nat Immunol (2006) 7(7):773–825. doi: 10.1038/ni1357
68. Jacquemin Clément, Augusto Jean-François, Scherlinger M, Gensous Noémie, Forcade E, Douchet I, et al. OX40L/OX40 axis impairs follicular and natural treg function in human SLE. JCI Insight (2018) 3(24):122167. doi: 10.1172/jci.insight.122167
69. Jenks SA, Cashman KS, Zumaquero E, Marigorta UM, Patel AV, Wang X, et al. Distinct effector B cells induced by unregulated toll-like receptor 7 contribute to pathogenic responses in systemic lupus erythematosus. Immunity (2018) 49(4):725–739.e6. doi: 10.1016/j.immuni.2018.08.015
70. Bennike TB, Ellingsen T, Glerup H, Bonderup OK, Carlsen TG, Meyer MK, et al. Proteome analysis of rheumatoid arthritis gut mucosa. J Proteome Res (2017) 16(1):346–54. doi: 10.1021/acs.jproteome.6b00598
71. Catrina A, Krishnamurthy A, Rethi B. Current view on the pathogenic role of anti-citrullinated protein antibodies in rheumatoid arthritis. RMD Open (2021) 7(1):e0012285. doi: 10.1136/rmdopen-2020-001228
72. Scally SW, Petersen J, Law SC, Dudek NL, Nel HJ, Loh KL, et al. A molecular basis for the association of the HLA-DRB1 locus, citrullination, and rheumatoid arthritis. J Exp Med (2013) 210(12):2569–82. doi: 10.1084/jem.20131241
73. Ito Y, Hashimoto M, Hirota K, Ohkura N, Morikawa H, Nishikawa H, et al. Detection of T cell responses to a ubiquitous cellular protein in autoimmune disease. Sci (New York N.Y.) (2014) 346(6207):363–68. doi: 10.1126/science.1259077
74. Kuhn KA, Kulik L, Tomooka B, Braschler KJ, Arend WP, Robinson WH, et al. Antibodies against citrullinated proteins enhance tissue injury in experimental autoimmune arthritis. J Clin Invest (2006) 116(4):961–735. doi: 10.1172/JCI25422
75. Hill JA, Bell DA, Brintnell W, Yue D, Wehrli B, Jevnikar AM, et al. Arthritis induced by posttranslationally modified (Citrullinated) fibrinogen in DR4-IE transgenic mice. J Exp Med (2008) 205(4):967–795. doi: 10.1084/jem.20072051
76. Harre U, Georgess D, Bang H, Bozec A, Axmann R, Ossipova E, et al. Induction of osteoclastogenesis and bone loss by human autoantibodies against citrullinated vimentin. J Clin Invest (2012) 122(5):1791–802. doi: 10.1172/JCI60975
77. Zhou X, Motta F, Selmi C, Ridgway WM, Gershwin ME, Zhang W. Antibody glycosylation in autoimmune diseases. Autoimmun Rev (2021) 20(5):1028045. doi: 10.1016/j.autrev.2021.102804
78. Pfeifle René, Rothe T, Ipseiz N, Scherer HU, Culemann S, Harre U, et al. Regulation of autoantibody activity by the IL-23-TH17 axis determines the onset of autoimmune disease. Nat Immunol (2017) 18(1):104–13. doi: 10.1038/ni.3579
79. Chen ML, Sundrud MS. Cytokine networks and T-cell subsets in inflammatory bowel diseases. Inflamm Bowel Dis (2016) 22(5):1157–675. doi: 10.1097/MIB.0000000000000714
80. Casalegno Garduño R, Däbritz J. New insights on CD8+ T cells in inflammatory bowel disease and therapeutic approaches. Front Immunol (2021) 12:738762(October). doi: 10.3389/fimmu.2021.738762
81. Gomez-Bris R, Saez A, Herrero-Fernandez B, Rius C, Sanchez-Martinez H, Gonzalez-Granado JM. CD4 T-cell subsets and the pathophysiology of inflammatory bowel disease. Int J Mol Sci (2023) 24(3):26965. doi: 10.3390/ijms24032696
82. Malmström V, Catrina AI, Klareskog L. The immunopathogenesis of seropositive rheumatoid arthritis: from triggering to targeting. Nat Rev Immunol (2017) 17(1):60–755. doi: 10.1038/nri.2016.124
83. Tenbrock K, Rauen T. T cell dysregulation in SLE. Clin Immunol (2022) 239(June):109031. doi: 10.1016/j.clim.2022.109031
84. Chen P-M, Tsokos GC. The role of CD8+ T-cell systemic lupus erythematosus pathogenesis: an update. Curr Opin Rheumatol (2021) 33(6):586–915. doi: 10.1097/BOR.0000000000000815
85. Wiede F, Shields BJ, Chew SH, Kyparissoudis K, Vliet Cv, Galic S, et al. T cell protein tyrosine phosphatase attenuates T cell signaling to maintain tolerance in mice. J Clin Invest (2011) 121(12):4758–745. doi: 10.1172/JCI59492
86. Faliti CE, Gualtierotti R, Rottoli E, Gerosa M, Perruzza L, Romagnani A, et al. P2X7 receptor restrains pathogenic tfh cell generation in systemic lupus erythematosus. J Exp Med (2019) 216(2):317–36. doi: 10.1084/jem.20171976
87. Sjaastad LE, Owen DL, Tracy SI, Farrar MA. Phenotypic and functional diversity in regulatory T cells. Front Cell Dev Biol (2021) 9:715901. doi: 10.3389/fcell.2021.715901
88. Catalán D, Mansilla MAndrés, Ferrier A, Soto L, Oleinika K, Aguillón JC, et al. Immunosuppressive mechanisms of regulatory B cells. Front Immunol (2021) 12:611795(April). doi: 10.3389/fimmu.2021.611795
89. Dasgupta S, Dasgupta S, Bandyopadhyay M. Regulatory B cells in infection, inflammation, and autoimmunity. Cell Immunol (2020) 352(June):104076. doi: 10.1016/j.cellimm.2020.104076
90. Sakaguchi S, Mikami N, Wing JB, Tanaka A, Ichiyama K, Ohkura N. Regulatory T cells and human disease. Annu Rev Immunol (2020) 38(1):541–665. doi: 10.1146/annurev-immunol-042718-041717
91. Nie H, Zheng Y, Li R, Guo TB, He D, Fang L, et al. Phosphorylation of FOXP3 controls regulatory T cell function and is inhibited by TNF-α in rheumatoid arthritis. Nat Med (2013) 19(3):322–28. doi: 10.1038/nm.3085
92. Singh UP, Singh NP, Guan H, Busbee B, Price RL, Taub DD, et al. Leptin antagonist ameliorates chronic colitis in IL-10–/– mice. Immunobiology (2013) 218(12):1439–515. doi: 10.1016/j.imbio.2013.04.020
93. Rauber S, Luber M, Weber S, Maul L, Soare A, Wohlfahrt T, et al. Resolution of inflammation by interleukin-9-producing type 2 innate lymphoid cells. Nat Med (2017) 23(8):938–44. doi: 10.1038/nm.4373
94. Ding Y, Li J, Yang P, Luo B, Wu Qi, Zajac AJ, et al. Interleukin-21 promotes germinal center reaction by skewing the follicular regulatory T cell to follicular helper T cell balance in autoimmune BXD2 mice. Arthritis Rheumatol (Hoboken N.J.) (2014) 66(9):2601–125. doi: 10.1002/art.38735
95. Wang CJ, Heuts F, Ovcinnikovs V, Wardzinski L, Bowers C, Schmidt EM, et al. CTLA-4 controls follicular helper T-cell differentiation by regulating the strength of CD28 engagement. Proc Natl Acad Sci USA (2015) 112(2):524–295. doi: 10.1073/pnas.1414576112
96. Jandl C, Liu SM, Cañete PF, Warren J, Hughes WE, Vogelzang A, et al. IL-21 restricts T follicular regulatory T cell proliferation through bcl-6 mediated inhibition of responsiveness to IL-2. Nat Commun (2017) 8(March):14647. doi: 10.1038/ncomms14647
97. Svensson MNd, Doody KM, Schmiedel BJ, Bhattacharyya S, Panwar B, Wiede F, et al. Reduced expression of phosphatase PTPN2 promotes pathogenic conversion of tregs in autoimmunity. J Clin Invest (2019) 129(3):1193–210. doi: 10.1172/JCI123267
98. Zeissig S, Rosati E, Marie Dowds C, Aden K, Bethge J, Schulte B, et al. Vedolizumab is associated with changes in innate rather than adaptive immunity in patients with inflammatory bowel disease. Gut (2019) 68(1):25–39. doi: 10.1136/gutjnl-2018-316023
99. Ren B, Liu J, Wu K, Zhang J, Lv Y, Wang S, et al. TNF-α-elicited miR-29b potentiates resistance to apoptosis in peripheral blood monocytes from patients with rheumatoid arthritis. Apoptosis (2019) 24(11-12):892–904. doi: 10.1007/s10495-019-01567-3
100. Derer S, Till A, Haesler R, Sina C, Grabe N, Jung S, et al. mTNF reverse signalling induced by TNFα Antagonists involves a GDF-1 dependent pathway: implications for crohn’s disease. Gut (2013) 62(3):376–86. doi: 10.1136/gutjnl-2011-300384
101. Picardo S, So K, Venugopal K. Anti-TNF-induced lupus in patients with inflammatory bowel disease. JGH Open (2019) 4(3):507–10. doi: 10.1002/jgh3.12291
102. Andres-Ejarque R, Ale HB, Grys K, Tosi I, Solanky S, Ainali C, et al. Enhanced NF-κB signaling in type-2 dendritic cells at baseline predicts non-response to adalimumab in psoriasis. Nat Commun (2021) 12(1):4741. doi: 10.1038/s41467-021-25066-9
103. Tréton X, Pedruzzi E, Guichard Cécile, Ladeiro Y, Sedghi S, Vallée Mélissa, et al. Combined NADPH oxidase 1 and interleukin 10 deficiency induces chronic endoplasmic reticulum stress and causes ulcerative colitis-like disease in mice. PloS One (2014) 9(7):e101669. doi: 10.1371/journal.pone.0101669
104. Xu Mo, Pokrovskii M, Ding Yi, Yi R, Au C, Harrison OJ, et al. C-MAF-dependent regulatory T cells mediate immunological tolerance to a gut pathobiont. Nature (2018) 554(7692):373–77. doi: 10.1038/nature25500
105. Ni S, Shan F, Geng J. Interleukin-10 family members: biology and role in the bone and joint diseases. Int Immunopharmacol (2022) 108(July):108881. doi: 10.1016/j.intimp.2022.108881
106. Okada Y, Muramatsu T, Suita N, Kanai M, Kawakami E, Iotchkova V, et al. Significant impact of miRNA–target gene networks on genetics of human complex traits. Sci Rep (2016) 6(1):222235. doi: 10.1038/srep22223
107. van Baarsen LGm, Wijbrandts CA, Rustenburg François, Cantaert T, Kraan TCvd, Baeten DL, et al. Regulation of IFN response gene activity during infliximab treatment in rheumatoid arthritis is associated with clinical response to treatment. Arthritis Res Ther (2010) 12(1):R11. doi: 10.1186/ar2912
108. Clément Jean-François, Bibeau-Poirier A, Gravel S-P, Grandvaux N, Bonneil Éric, Thibault P, et al. Phosphorylation of IRF-3 on ser 339 generates a hyperactive form of IRF-3 through regulation of dimerization and CBP association. J Virol (2008) 82(8):3984–965. doi: 10.1128/JVI.02526-07
109. Mazein A, Ostaszewski M, Kuperstein I, Watterson S, Novère NLe, Lefaudeux D, et al. Systems medicine disease maps: community-driven comprehensive representation of disease mechanisms. NPJ Syst Biol Appl (2018) 4:21. doi: 10.1038/s41540-018-0059-y
110. Nam Y, Jhee JHo, Cho J, Lee J-H, Shin H. Disease gene identification based on generic and disease-specific genome networks. Bioinformatics (2019) 35(11):1923–305. doi: 10.1093/bioinformatics/bty882
111. Zhang Q, Sun L, Zhang Q, Zhang W, Tian W, Liu M, et al. Construction of a disease-specific lncRNA-miRNA-mRNA regulatory network reveals potential regulatory axes and prognostic biomarkers for hepatocellular carcinoma. Cancer Med (2020) 9(24):9219–355. doi: 10.1002/cam4.3526
112. Ruan P, Wang S. DiSNEP: A disease-specific gene network enhancement to improve prioritizing candidate disease genes. Briefings Bioinf (2021) 22(4):bbaa241. doi: 10.1093/bib/bbaa241
113. Gomez M, Cristobal L, Kondratova M, Ravel J-M, Barillot E, Zinovyev A, et al. Application of atlas of cancer signalling network in preclinical studies. Briefings Bioinf (2019) 20(2):701–165. doi: 10.1093/bib/bby031
114. Miagoux Q, Singh V, Mézquita Dde, Chaudru V, Elati M, Petit-Teixeira E, et al. Inference of an integrative, executable network for rheumatoid arthritis combining data-Driven machine learning approaches and a state-of-the-Art mechanistic disease map. J Personalized Med (2021) 11(8):7855. doi: 10.3390/jpm11080785
Keywords: inflammatory bowel disease, rheumatoid arthritis, systemic lupus erythematosus, molecular mechanisms, curation, pathway biology, systems biology
Citation: Acencio ML, Ostaszewski M, Mazein A, Rosenstiel P, Aden K, Mishra N, Andersen V, Sidiropoulos P, Banos A, Filia A, Rahmouni S, Finckh A, Gu W, Schneider R and Satagopam V (2023) The SYSCID map: a graphical and computational resource of molecular mechanisms across rheumatoid arthritis, systemic lupus erythematosus and inflammatory bowel disease. Front. Immunol. 14:1257321. doi: 10.3389/fimmu.2023.1257321
Received: 12 July 2023; Accepted: 16 October 2023;
Published: 01 November 2023.
Edited by:
Haitao Wang, National Cancer Institute (NIH), United StatesReviewed by:
Qin Xu, National Institute of Allergy and Infectious Diseases (NIH), United StatesMin Wang, Peking University, China
Copyright © 2023 Acencio, Ostaszewski, Mazein, Rosenstiel, Aden, Mishra, Andersen, Sidiropoulos, Banos, Filia, Rahmouni, Finckh, Gu, Schneider and Satagopam. This is an open-access article distributed under the terms of the Creative Commons Attribution License (CC BY). The use, distribution or reproduction in other forums is permitted, provided the original author(s) and the copyright owner(s) are credited and that the original publication in this journal is cited, in accordance with accepted academic practice. No use, distribution or reproduction is permitted which does not comply with these terms.
*Correspondence: Marek Ostaszewski, marek.ostaszewski@uni.lu