 Nguyen Ky Phat1,2
 Nguyen Tran Nam Tien1,2
 Nguyen Ky Anh1,2
 Nguyen Thi Hai Yen1,2
 Yoon Ah Lee3
 Hoang Kim Tu Trinh4
 Kieu-Minh Le4Sangzin Ahn1,2
 Yong-Soon Cho1,2Seongoh Park3,5
 Dong Hyun Kim1
 Nguyen Phuoc Long1,2*
 Jae-Gook Shin1,2*
- 1Department of Pharmacology and PharmacoGenomics Research Center, Inje University College of Medicine, Busan, Republic of Korea
- 2Center for Personalized Precision Medicine of Tuberculosis, Inje University College of Medicine, Busan, Republic of Korea
- 3School of Mathematics, Statistics and Data Science, Sungshin Women’s University, Seoul, Republic of Korea
- 4Center for Molecular Biomedicine, University of Medicine and Pharmacy at Ho Chi Minh, Ho Chi Minh, Vietnam
- 5Data Science Center, Sungshin Women’s University, Seoul, Republic of Korea
Background: The optimal diagnosis and treatment of tuberculosis (TB) are challenging due to underdiagnosis and inadequate treatment monitoring. Lipid-related genes are crucial components of the host immune response in TB. However, their dynamic expression and potential usefulness for monitoring response to anti-TB treatment are unclear.
Methodology: In the present study, we used a targeted, knowledge-based approach to investigate the expression of lipid-related genes during anti-TB treatment and their potential use as biomarkers of treatment response.
Results and discussion: The expression levels of 10 genes (ARPC5, ACSL4, PLD4, LIPA, CHMP2B, RAB5A, GABARAPL2, PLA2G4A, MBOAT2, and MBOAT1) were significantly altered during standard anti-TB treatment. We evaluated the potential usefulness of this 10-lipid-gene signature for TB diagnosis and treatment monitoring in various clinical scenarios across multiple populations. We also compared this signature with other transcriptomic signatures. The 10-lipid-gene signature could distinguish patients with TB from those with latent tuberculosis infection and non-TB controls (area under the receiver operating characteristic curve > 0.7 for most cases); it could also be useful for monitoring response to anti-TB treatment. Although the performance of the new signature was not better than that of previous signatures (i.e., RISK6, Sambarey10, Long10), our results suggest the usefulness of metabolism-centric biomarkers
Conclusions: Lipid-related genes play significant roles in TB pathophysiology and host immune responses. Furthermore, transcriptomic signatures related to the immune response and lipid-related gene may be useful for TB diagnosis and treatment monitoring.
1 Introduction
Tuberculosis (TB) is a severe infectious disease that remains a global public health emergency. According to the World Health Organization (WHO), approximately 1.4 million people lost their lives due to TB in 2022 (1). Despite attempts to reduce the duration of TB treatment, the 6-month regimen is still widely used for drug-susceptible TB (2, 3). This prolonged duration can lead to poor treatment adherence (4, 5) and consequently lead to negative outcomes such as treatment failure, relapse, antibiotic resistance, and disease spread (6, 7). Furthermore, conventional TB diagnosis and treatment monitoring rely on sputum-based tests, which have low sensitivity and modest specificity. Additionally, the collection of sputum samples for assays is difficult (8, 9). Underdiagnosis and insufficient treatment monitoring hinder the timely and accurate treatment of TB, leading to poor outcomes. Over the past two decades, significant efforts have been made to develop novel non–sputum-based biomarkers that can be used to rapidly and accurately identify active TB infection and monitor the treatment response (10). Among these biomarkers, blood transcriptomic biosignatures, which reflect host immune responses during anti-TB treatment, are promising candidates (11).
Although multiple transcriptomic signatures for the diagnosis of TB have been proposed (12, 13), the dynamic responses of these biomarkers to TB treatment have not been the main focus in prior works. Only a few transcriptomic signatures have been evaluated for use in the monitoring of anti-TB treatment (9, 10, 14). These signatures have also been found to be useful for TB diagnosis, treatment monitoring, and risk prediction (9). A multi-national study validated the use of the six-gene RISK6 signature (TRMT2A, SDR39U1, TUBGCP6, SERPING1, GBP2, and FCGR1B) for TB diagnosis and treatment monitoring. This signature had a high performance for the differentiation of untreated patients with those who completed the intensive phase of treatment, at the end of treatment, and those who had completed treatment two months previously. Additionally, the RISK6 signature fulfills the WHO target product profile criteria for screening/triage tests for the diagnosis of TB (15). We previously developed the Long10 signature comprising 10 genes (CD274, KIF1B, IL15, TLR1, TLR5, FCGR1A, GBP1, NOD2, GBP2, EGF) that were consistently downregulated during TB treatment. The signature displayed comparable performance to other signatures for TB diagnosis, treatment monitoring, and risk assessment (16). The satisfactory performance of the RISK6 and Long10 signatures suggests that a combination of transcriptomic biosignatures can be useful for multiple aspects of TB management. Although the Sambarey10 signature (FCGR1A, HK3, RAB13, RBBP8, IFI44L, TIMM10, BCL6, SMARCD3, CYP4F3, SLPI) showed promising performance in TB diagnosis, it has not been evaluated for the monitoring of treatment responses (12, 13, 17). Furthermore, in an individual participant data meta-analysis, only the Sambarey10 and Sweeney3 signatures fulfilled the WHO target product profile criteria for TB triage tests, which requires 90% sensitivity and 70% specificity at the minimum (13, 18).
Despite significant advancements in recent decades, further efforts are needed to develop transcriptional biomarkers for use in TB management. In a prospective cohort study, none of the evaluated transcriptome-based biosignatures fulfilled the WHO target product profile criteria for blood-based confirmatory tests (9). The significant variations in host responses to TB among individuals, cohorts, and comorbidities make the development of a universal biosignature challenging (11). Additionally, the multi-step experimental process, statistical analysis pipelines for data with thousands of genes, and the nature of array- or next-generation sequencing-based technologies can lead to high false-positive rates (19–23). Thus, the reproducibility and robustness of biosignatures need to be improved.
Lipid signaling and immune responses are complex, interlinked processes. Lipoproteins, free fatty acids (FFAs), lipokines, interleukins, and other biological components modulate the complex interactions between these systems (24). In TB, proinflammatory lipid signaling cascades are associated with tricarboxylic acid cycle remodeling, increased interleukin-1β expression, and decreased granulocyte-macrophage colony-stimulating factor expression (25). Our previous study showed significant perturbations related to metabolism and immune response of the host signaling based on the alteration in plasma lipid profiles between TB patients and non-TB controls. Subsequently, dysregulated metabolic and signaling pathways were identified using gene enrichment analysis. Among the genes involved in these pathways, 162 non-overlapped lipid-related genes potentially associated with the pathophysiology of TB were extracted and validated in three datasets (26). Our other study of the plasma lipidome of patients with TB during the 6-month treatment regimen showed changes in pathways related to lipid metabolism and the host immune response (27). These findings suggest an association between systemic lipid alterations and TB disease status. Thus, changes in lipid-related genes may serve as indicators of the response to TB treatment.
In the present study, we used a targeted, knowledge-based approach to select the most significant TB biomarker candidates from the 162 lipid-related genes previously found. The study workflow is described in Figure 1. We evaluated the potential usefulness of these genes for pulmonary TB diagnosis and treatment monitoring in multiple cohorts. Additionally, we conducted a benchmark analysis to compare the performance of the candidate biomarkers with that of publicly available signatures. We found that the performance of the lipid-related genes was not better than that of certain other biosignatures. Our results demonstrate that lipid metabolism is involved in the host immune response during TB treatment. Importantly, we provide more evidence that lipid metabolism and signaling researches can contribute to improve the management of TB.
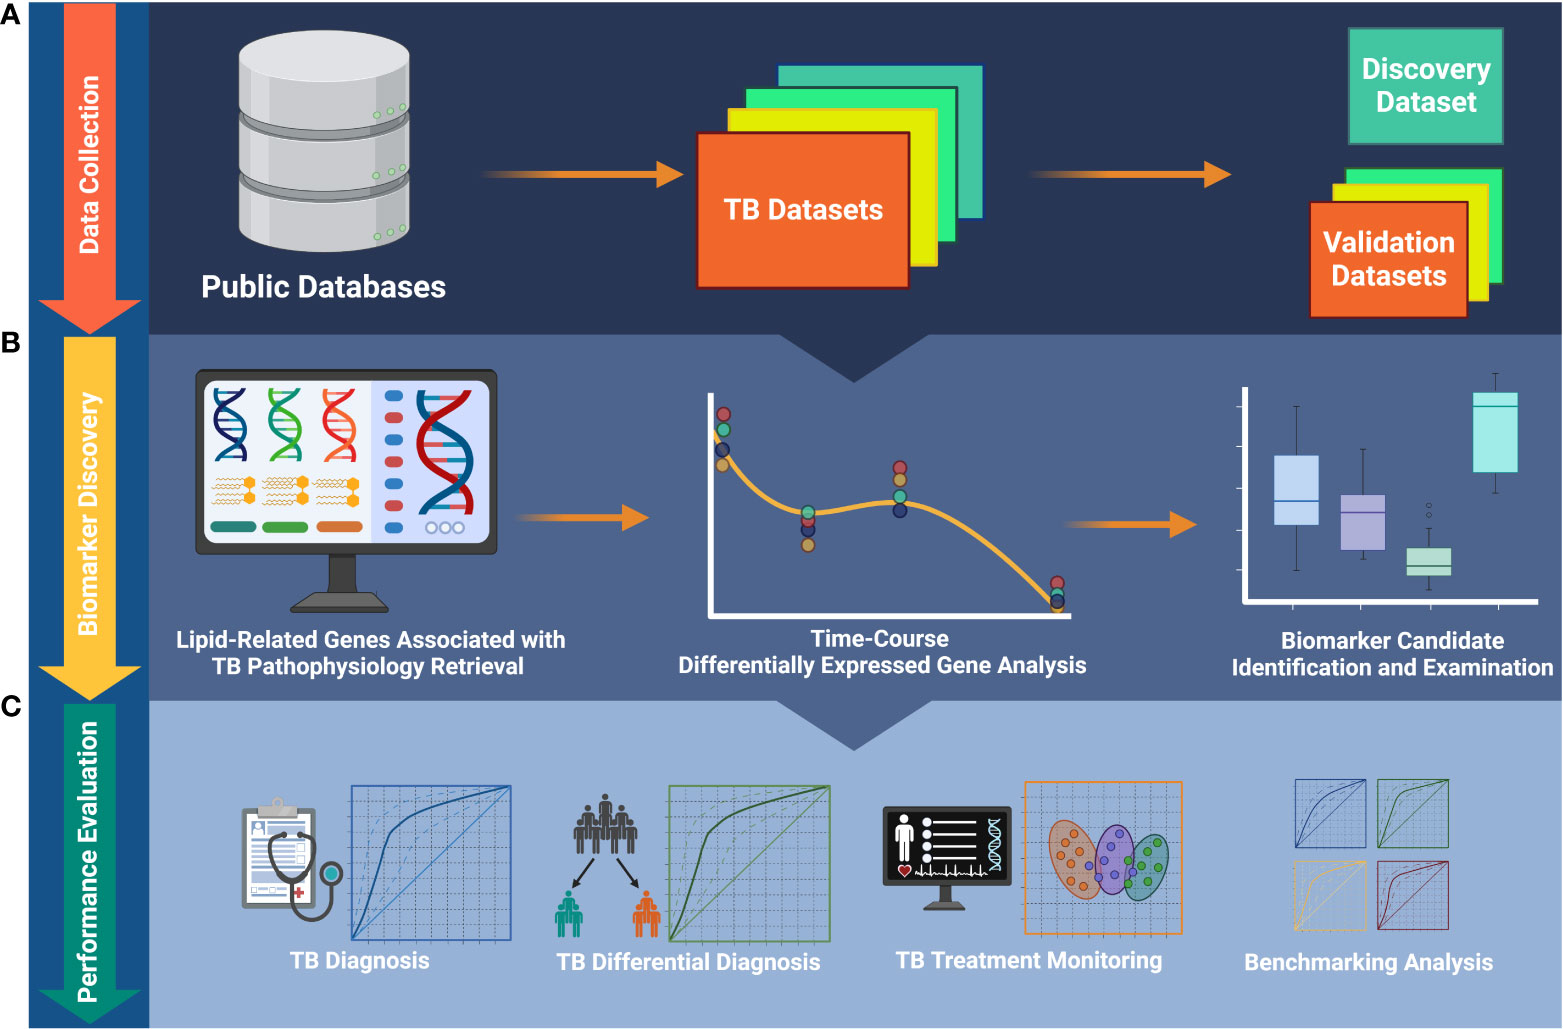
Figure 1 The workflow of the study. (A) Publicly available data collection. (B) Identification of biomarkers and foundation of biosignature. (C) Validation of the ability of the biosignature for TB diagnosis and treatment monitoring. TB, tuberculosis.
2 Materials and methods
2.1 Published transcriptomics data acquisition
Transcriptomic datasets of pulmonary TB were collected from the Gene Expression Omnibus (GEO) and ArrayExpress databases. The search term was built as previously described and restricted to Homo sapiens species (16). For longitudinal datasets, drug susceptibility (DS)-TB cases with no known severe comorbidities were selected. Additionally, patients with known failure treatment outcomes were excluded. Three representative datasets [GSE31348 (28), GSE89403 (29), and GSE181143 (30)] were included for subsequent analyses to demonstrate the dynamic response of lipid-related genes during the TB treatment time course. These three longitudinal TB datasets were obtained from patients who underwent the standard six-month anti-TB treatment. GSE31348 was used as the identification cohort, while GSE89403 and GSE181143 were utilized for validation. Additional datasets were collected to demonstrate the potential of lipid-related genes in TB diagnosis. They covered different medical conditions with or without human immunodeficiency virus (HIV), including TB, latent TB infection (LTBI), non-TB, and other diseases (OD). Of note, the OD groups from the GSE37250 dataset consist of patients with multiple diseases that are common in the African population (e.g., pneumonia (PNA)/lower respiratory tract infection/Pneumocystis jirovecii pneumonia; malignancy and other neoplasia other than Kaposi’s sarcoma; pelvic inflammatory disease/urinary tract infection; bacterial, viral meningitis, or meningitis of uncertain origin; and hepatobiliary disease). Detailed information is available in the original study of the dataset (31). The collected datasets were also comprised of healthy control, active sarcoidosis (SARC), non-active SARC, lung cancer, and pneumonia individuals. Eight chosen datasets were E-MTAB-8290 (non-TB-non-HIV, non-TB-HIV, TB, TB-HIV) (32), GSE37250 (OD, OD-HIV, LTBI, LTBI-HIV, TB, and TB-HIV) (31), GSE107991 (healthy control, TB, LTBI) (33), GSE107994 (healthy control, TB, LTBI) (33), GSE101705 (TB, LTBI) (34), and a combined dataset from GSE42825, GSE42826, and GSE42830 (healthy control, active SARC, non-active SARC, lung cancer, PNA) (35). The information of all datasets included in this study is summarized in Supplementary Table 1.
2.2 Targeted lipid-related genes list and other available signatures
A list of 162 lipid-related genes associated with the biological pathways underlying TB pathophysiology was retrieved from our previous study (Supplementary Table 2) (26). This list was extracted from significantly enriched pathways of our reported lipid biomarkers for TB and non-TB control differentiation. Of note, all of these 162 genes are host genes and not derived from Mycobacterium tuberculosis (Mtb).
For comparison purposes, three other signatures were created by directly extracting the component genes of publicly available signatures, i.e., RISK6 (36), Sambarey10 (17), and Long10 (16).
2.3 Data processing and normalization
Microarray data were normalized using affy (version 1.74.0, Affymetrix) (37) and lumi (version 2.48.0, Illumina) (38) packages, respectively. The batch effects of microarray datasets with multi-site cohorts was corrected by the Combat method (39) using sva package (version 3.44.0) (40) after being examined with the BatchQC package (version 1.24.0) (41). Regarding RNA-seq data, the batch effect of datasets was inspected by BatchQC and corrected using Combat-seq (42). RNA-seq data were normalized using the median of ratio method combined with regularized logarithmic transformation. The pipeline was conducted by the DESeq2 package (version 1.36.0) (43).
2.4 Single-sample scoring of gene signature
Gene set variation analysis (GSVA) was carried out using GSVA package (version 1.44.5) (44) to evaluate the treatment monitoring and diagnosis characteristics of gene signatures. GSVA transforms the transcriptome profile of an individual sample into a signature enrichment profile. The GSVA score of a signature characterizes the coordination in the regulation (either up or down) of its component genes and indicates its activity level.
2.5 Statistical analysis
The molecular profiles of the lipid-related genes of patients during TB treatment were examined using principal component analysis (PCA) and t-distributed stochastic neighbor embedding (t-SNE). The profiles were visualized using three-dimensional PCA and t-SNE score plots drawn by plotly package (version 4.10.1). ComplexHeatmap package (version 2.15.1) (45) was used to create heatmap visualization of GSVA score for obtained biosignature. A polynomial regression targeted to 162 lipid-relate genes was implemented by maSigPro package (version 1.68.0) (46) to identify differentially expressed genes (DEGs) during the TB treatment time course. In short, the algorithm built a profile model for time-course gene expression:
where yi is the expression level for a gene and is the error term. The model consists of two parts: (1) polynomial of degree d in the time variable and (2) the linear regression explained by p explanatory variables. This is assumed to be the full model, but due to model complexity, the package considers a reduced model, which uses fewer variables than the full model but still has enough predictive power. The selection procedure is either forward or backward step-wise selection where each variable is sequentially tested if the addition or elimination of the variable improves the model. In our case, we did not include any explanatory variable and set the polynomial degree as 2. For testing the overall significance of the regression model, F-test was performed for each gene. Lipid-related genes with a false discovery rate (FDR) < 0.05 were selected as DEGs. The R2 value was set to ≥ 0.3 for selecting the genes as biomarker candidates.
The Kruskal-Wallis test and the post hoc two-sided unpaired Wilcoxon rank sum test were performed for testing unpaired data. With paired data, the Friedman test followed by the post hoc paired Wilcoxon signed rank test was applied. For a single statistical testing, a raw P-value < 0.05 was considered statistically significant. For multiple comparisons, the FDR of 0.05 was established as the significant threshold. Statistical tests were conducted using rstatix package (version 0.7.1).
2.6 Gene signature performance evaluation
The potential of the signature to characterize different TB treatment states was evaluated by applying k-means clustering. In detail, the expression profile of each gene was considered a variable, and the sample at a specific time point was treated as an observation. The number of clusters was predetermined. As a result, the algorithm identified clusters of samples that exhibited similar expression profiles of the signature, regardless of their actual sampling time point. The data was Pareto scaled prior to the analysis. MetaboAnalyst 5.0 (47) was employed to conduct the classification model.
For TB diagnosis, the classification model was built using a logistic regression. Model validation was performed with a 10-fold nested cross-validation procedure where the outer loop is for splitting training and test data and the inner for searching the best tuning parameters. The caret package (version 6.0-93) (48) was used for model building and validation. Model performance was assessed by the area under the curve (AUC) value of the receiver operating characteristic (ROC) curve. All statistical analyses and presentations were implemented in R version 4.2.1. Besides the base R graphics, the ggplot2 (version 3.4.0) and its extension ggpubr (version 0.5.0) were used for visualization unless stated otherwise.
3 Results
3.1 The association of 162 lipid-related genes with different TB treatment states and various disease conditions
PCA was performed to investigate the dynamic responses of the expression profiles of 162 lipid-related genes during TB treatment. The PCA scores plots showed clear separations between the transcriptomes at baseline and at treatment completion, but not after one, two, four, or eight weeks of treatment, in all datasets except the Brazilian population subset of GSE181143 (no clear separation was observed for this subset) (Figure 2A). Interestingly, t-SNE displayed three clusters of lipid-related gene transcriptomes (i.e., baseline, mid-time points, and treatment completion) as observed with PCA, except GSE181143 cohort (Supplementary Figure 1). The lipid-related gene expression profiles generally formed three clusters corresponding to baseline, treatment completion, and other time points.
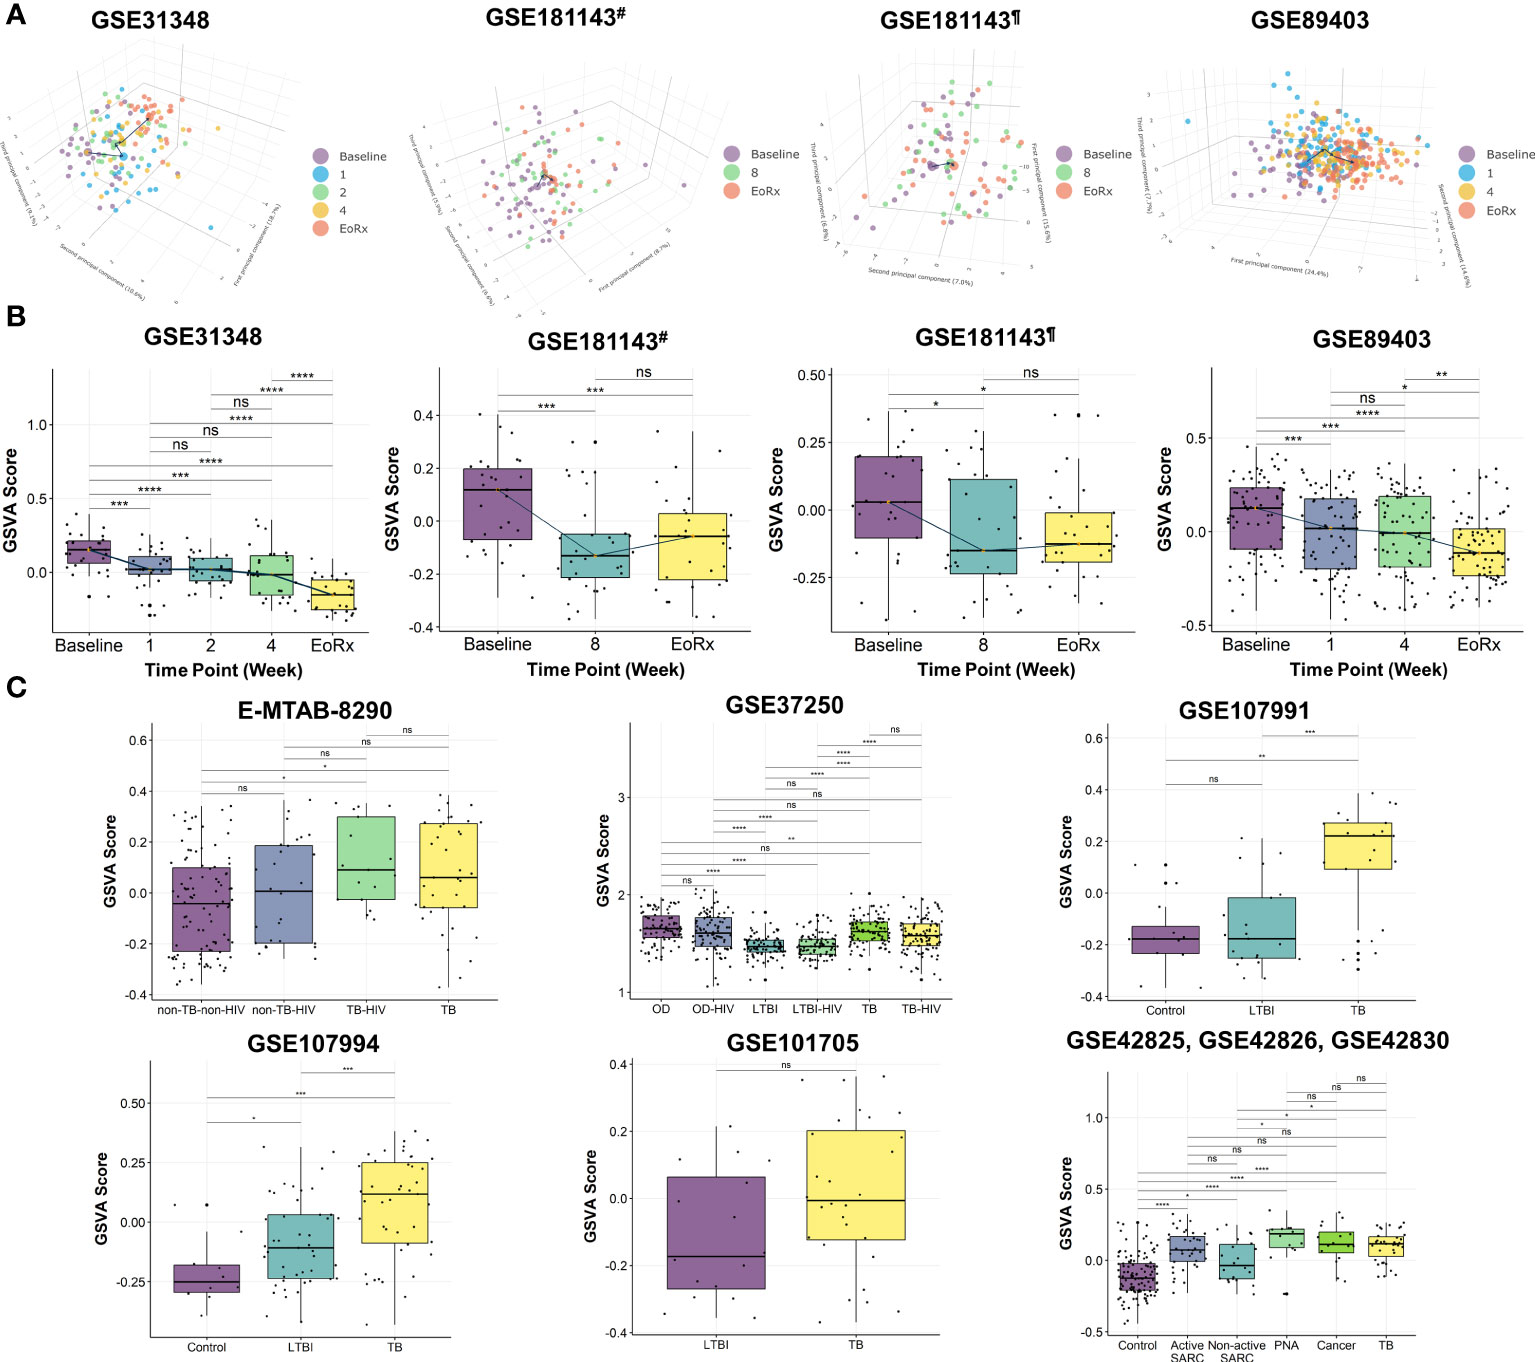
Figure 2 The potential of 162 lipid-related genes in TB treatment monitoring and diagnosis. (A) 3D principal component analysis scores plots represent the transcriptome profiles for 162 lipid-related genes during the TB treatment. (B) The GSVA score of 162 lipid-related genes across the TB treatment time course. The orange point represents the median GSVA score of the subject group and the box plot represent the correspondent interquartile range. (C) The GSVA score of 162 lipid-related genes in TB and its counterparts. GSVA, gene set variation analysis; 1, after one week; 2, after two weeks; 4, after four weeks; 8, after eight weeks; EoRx, treatment completion; TB, tuberculosis; LTBI, latent TB infection; OD, other diseases; HIV, human immunodeficiency virus; SARC, sarcoidosis; Cancer, lung cancer; PNA, pneumonia; #, subset from India of GSE181143 dataset; ¶, subset from Brazil of GSE181143 dataset; ns, not significant; *,<0.05; **,<0.01; ***,<0.001, ****,<0.0001; two-sided paired Wilcoxon signed rank test (B) and two-sided Wilcoxon rank sum test (C).
To further explore the associations between alterations in the gene expression of lipid-related genes and TB treatment states, we performed GSVA. The GSVA score declined significantly from baseline to treatment completion, reflecting that the lipid-related genes were less activated at the end of the treatment course (Figure 2B). Moreover, the Friedman test demonstrated significant differences in GSVA scores across various time points in GSE31348, GSE89403, and GSE181143 (Supplementary Table 3). Pairwise comparison showed that the GSVA score for the 162 lipid-related genes differed significantly between baseline, mid-treatment, and treatment completion, with no significant difference among mid-treatment time points. In GSE181143, no significant difference was observed between the mid-treatment (after eight weeks) time point and treatment completion. These findings were in line with the PCA results.
We also performed GSVA to investigate the association between the lipid-related genes and different disease conditions. The GSVA score was significantly higher for patients with TB than for those with other conditions (i.e., non-TB-non-HIV, LTBI, LTBI-HIV, healthy control, non-active SARC) (Figure 2C) and differed significantly across patient groups. However, no significant differences were found between the TB group with OD, active SARC, lung cancer, and PNA groups (Figure 2C, Supplementary Table 4). Additionally, the GSVA score of the LTBI group differed significantly from those of other groups (GSE37250 and GSE107994). Notably, the GSVA score did not differ significantly between patients with and without HIV infection in the non-TB (E-MTAB-8290), OD, LTBI, or TB groups (GSE37250). Taken collectively, these results indicated the association between 162 lipid-related genes and TB treatment states. This suggested further investigation into the ability of 162 lipid-related genes for TB treatment monitoring and diagnosis.
3.2 The foundation of 10-lipid-gene transcriptional signature
To develop a clinically applicable biosignature, 162 genes were screened to identify the most promising candidate biomarkers. A time-course regression analysis targeted to 162 lipid-related genes was conducted on 135 samples with 5 different time points (GSE31348) to identify DEGs throughout TB treatment. The analysis identified 80 lipid-related genes that are differentially expressed during TB treatment, with most changes in the expression levels of these genes were subtle. Ten DEGs with R2 > 0.3 were identified as the most potential biomarker candidates (Table 1). The ten lipid-related genes together formed the so-called “10-lipid-gene” signature.
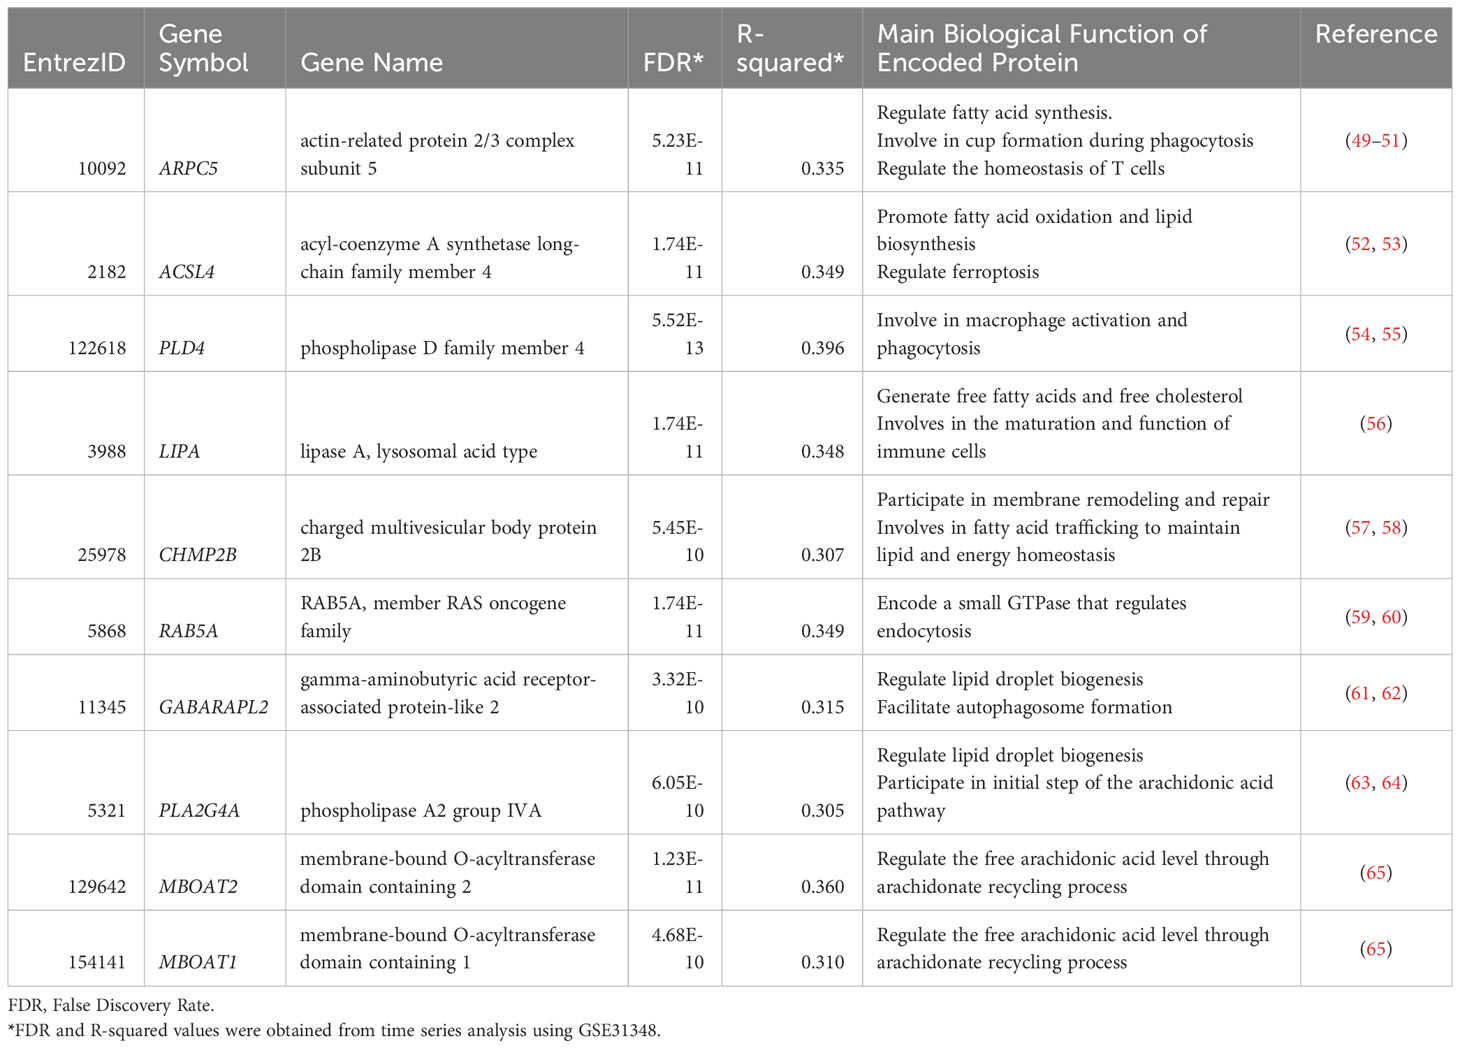
Table 1 List of the most potential lipid-related gene candidates.
GSVA was performed on the discovery dataset (i.e., GSE31348) to demonstrate the dynamic response of the 10-lipid-gene signature. Overall, the GSVA scores for the signature showed similar changes during treatment as did those for the 162 lipid-related genes (Figures 2B, 3A, Supplementary Table 5). GSVA scores for all 27 patients of the discovery dataset were visualized using heatmaps to examine the interindividual response variability in the 10-lipid-gene signature. Although some patients showed unusual patterns of change during the initial four weeks of treatment, most cases showed a significant reduction in the GSVA score at treatment completion (Figure 3B). The changes in individual gene expression of all 27 patients in the GSE31348 dataset were analyzed to determine the gene-specific variability. Two main trends were observed during TB treatment: chronological down-regulation and up-regulation (Figure 3C). In particular, the expression of nine genes (ARPC5, ACSL4, LIPA, CHMP2B, RAB5A, GABARAPL2, PLA2G4A, MBOAT2, and MBOAT1) was altered only slightly during the initial four weeks of treatment, but was down-regulated significantly at treatment completion. In contrast, the expression of PLD4 increased during treatment.
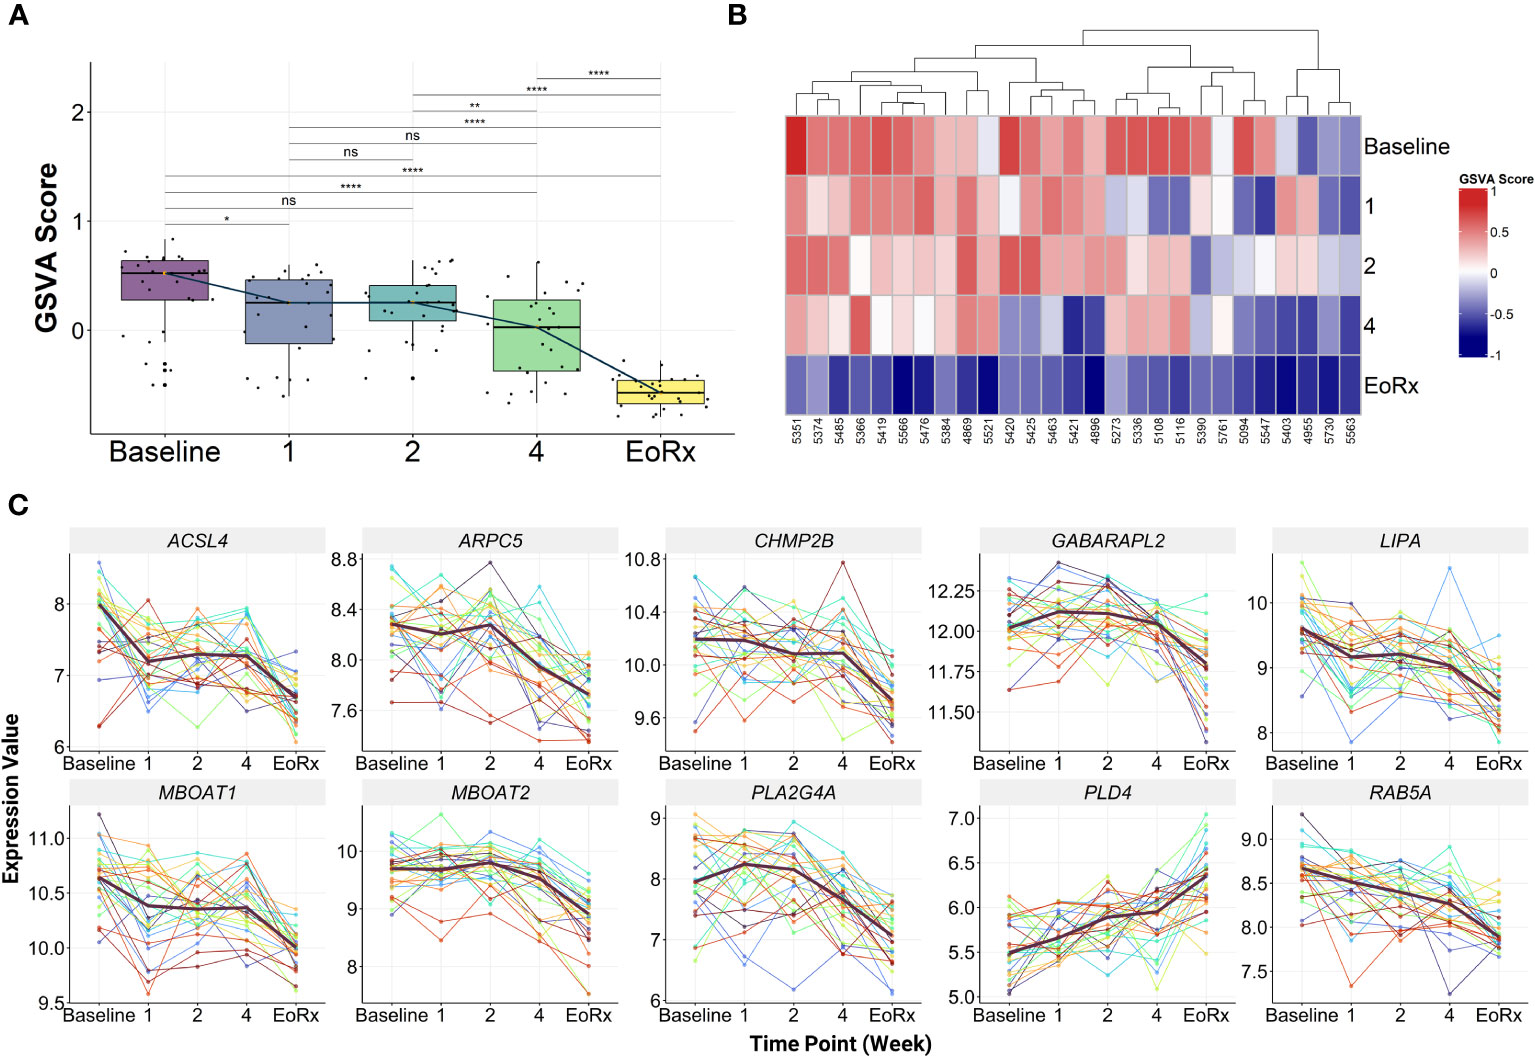
Figure 3 The characteristics of 10-lipid-gene biosignature. (A) The GSVA score of 10-lipid-gene signature during TB treatment (N = 27). The orange point represents the median GSVA score of the subject group and the box plot represent the correspondent interquartile range. (B) Heatmap represents the signature enrichment profiles of individual patients for 10-lipid-gene signature during TB treatment (N = 27). (C) The expression level of individual gene component of the signature across the TB treatment time course (N = 27). The dark mauve line indicates the median gene expression level. GSVA, gene set variation analysis; 1, after one week; 2, after two weeks; 4, after four weeks; EoRx, treatment completion; ns, not significant; *,<0.05; **,<0.01; ****,<0.0001; two-sided paired Wilcoxon signed rank test.
3.3 The ability of 10-lipid-gene transcriptional biosignature to reflect different TB treatment states
External validation was performed to evaluate the dynamic response of the 10-lipid-gene biosignature during TB treatment (Figure 4A). To enhance the reliability of the assessment, we also compared it with other priory-established signatures (i.e., Long10, RISK6, and Sambarey10). In the two subsets of GSE181143, the 10-lipid-gene signature was down-regulated from baseline to after eight weeks and remained stable until treatment completion (Supplementary Table 6). However, the GSVA scores for the other three signatures decreased consistently during the treatment course; this reduction was subtle for the RISK6 signature and significant at all-time points for the Long10 and Sambarey10 signatures (Figure 4A, Supplementary Table 6). In the Catalysis treatment response cohort (CTRC) (i.e., GSE89403), the GSVA scores for the 10-lipid-gene and RISK6 signatures decreased from baseline to after one week, remained stable after four weeks, and thereafter continued to decrease until treatment completion. Figure 4A shows the significant reduction of the GSVA scores for the Long10 and Sambarey10 signatures during treatment in the CTRC cohort. Notably, only the score for the Sambarey10 signature differed significantly between after one week and after four weeks of treatment.
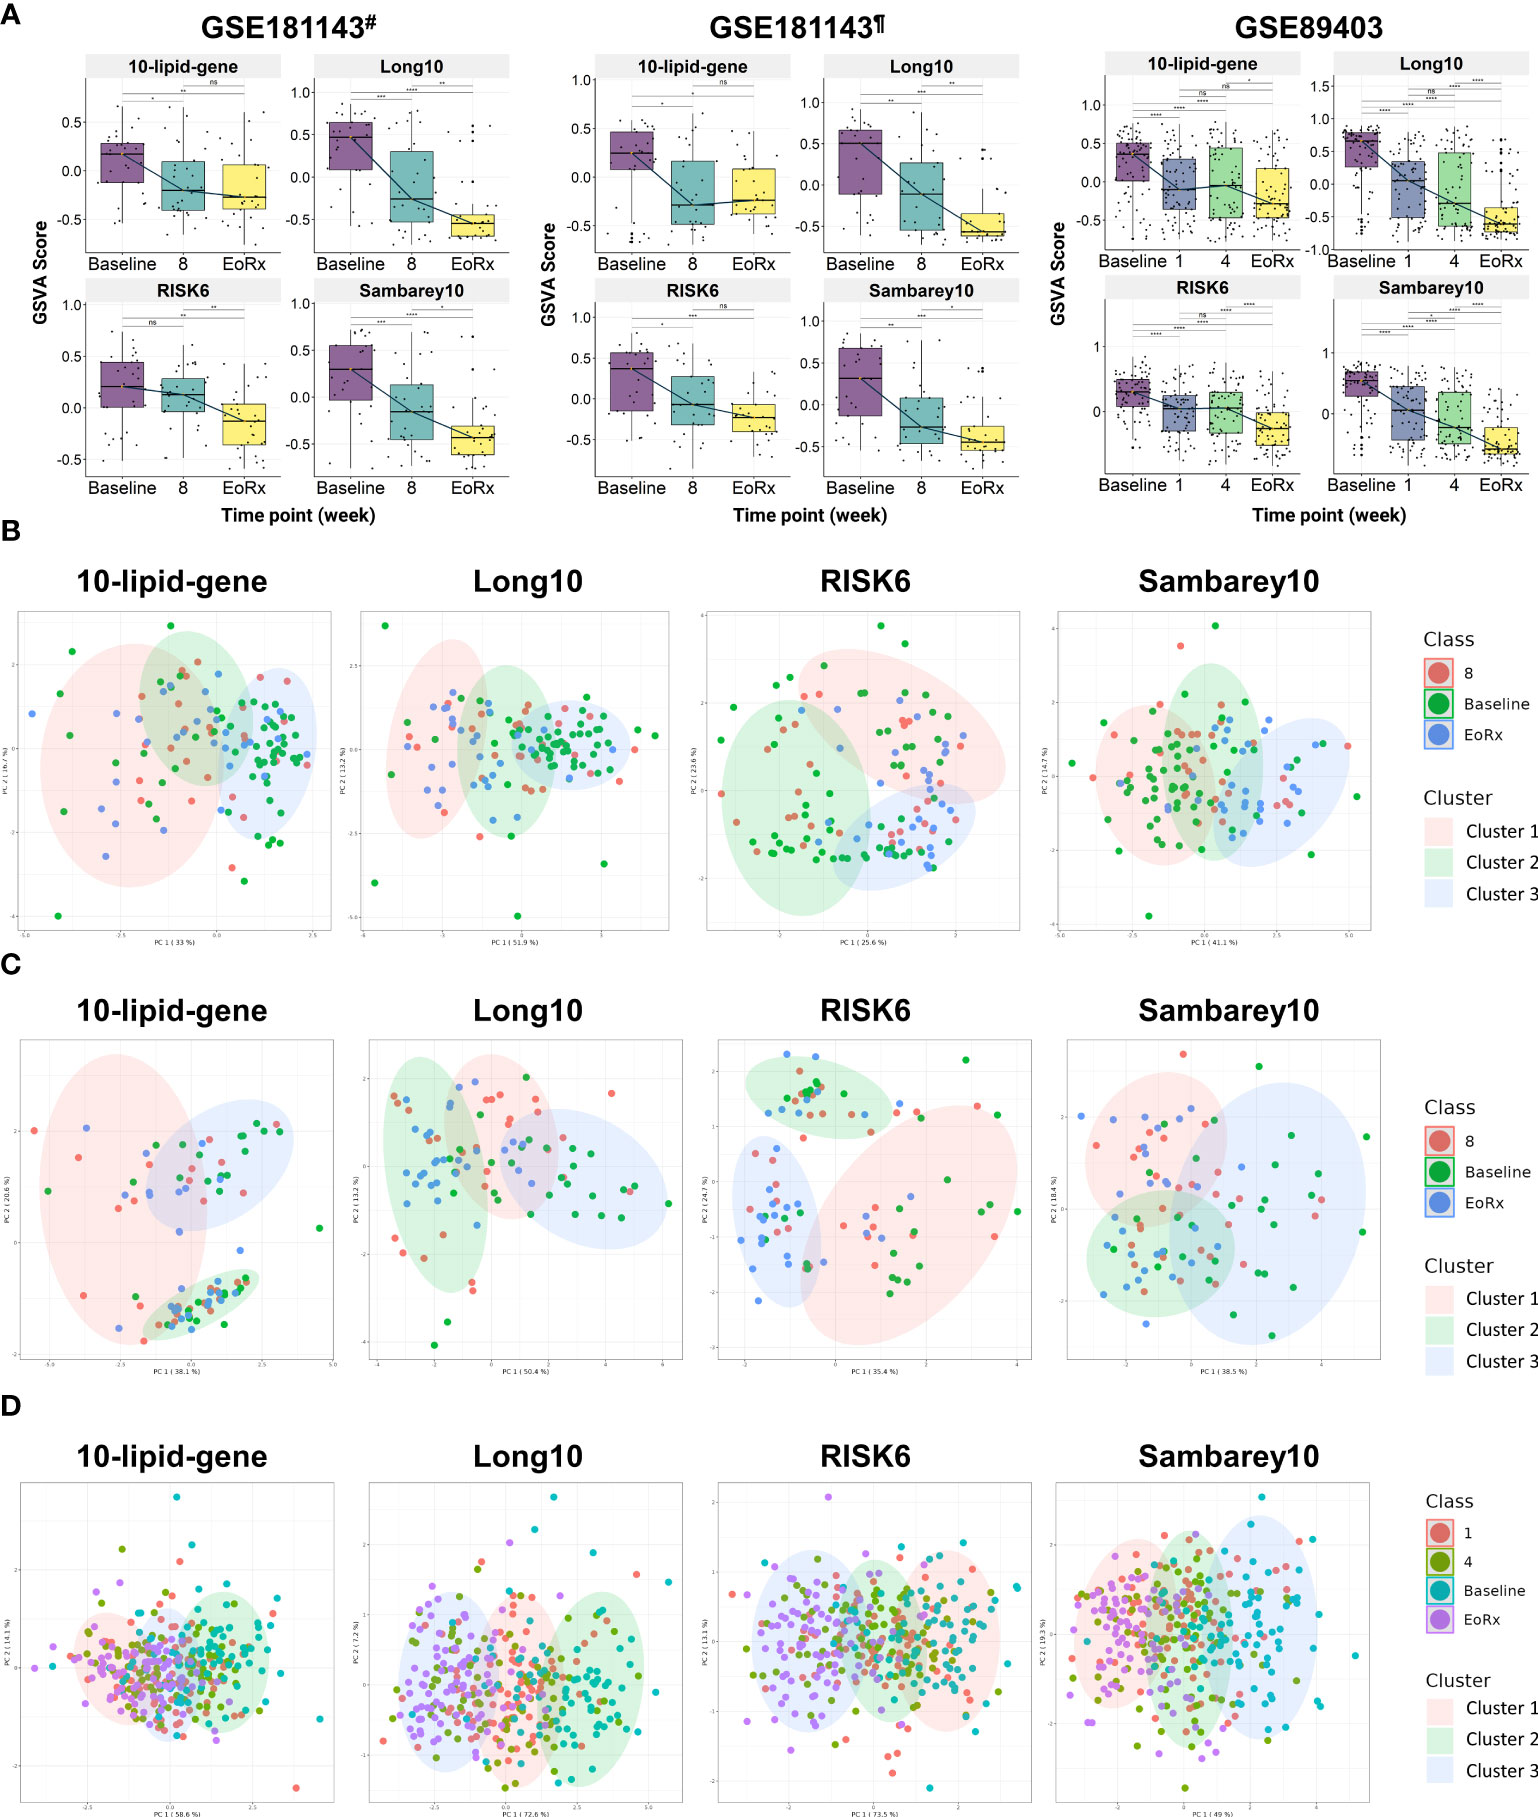
Figure 4 The potential 10-lipid-gene biosignature in TB treatment monitoring. (A) The GSVA score of 10-lipid-gene, Long10, RISK6, and Samberey10 biosignatures during the TB treatment time course. The orange point represents the median GSVA score of the subject group and the box plot represent the correspondent interquartile range (B) Classification of different TB treatment states based on the 10-lipid-gene signature for subset from India of the GSE181143 dataset. (C) Classification of different TB treatment states based on the 10-lipid-gene signature for subset from Brazil of the GSE181143 dataset. (D) Classification of different TB treatment states based on the 10-lipid-gene signature for the GSE89403 dataset. GSVA, gene set variation analysis; 1, after one week; 2, after two weeks; 4, after four weeks; 8, after eight weeks; EoRx, treatment completion; #, the subset of Indian samples from GSE181143 dataset; ¶, the subset of Brazilian samples from GSE181143 dataset. ns, not significant; *,<0.05; **,<0.01; ***,<0.001; ****,<0.0001; two-sided paired Wilcoxon signed rank test.
We evaluated the ability of the 10-lipid-gene signature to differentiate among TB treatment states using k-means clustering. Three clusters were pre-determined to correspond to the distinct states of TB treatment (baseline, mid-time points, and treatment completion) that were previously observed. Overall, the three clusters showed a high degree of overlap in all datasets. In the subset from India of GSE181143, the 10-lipid-gene signature exhibited weak performance, with a cluster corresponding to the baseline but none corresponding to the other time points; the performance of 10-lipid-gene signature was not superior to other signatures (Figure 4B). In the cohort from Brazil of GSE181143, the grouping based on 10-lipid-gene signature was not in concordance with TB treatment states (Figure 4C). The RISK6 signature could cluster the samples at treatment completion and the Sambarey10 signature could cluster samples at baseline, although the tendency is unclear. Remarkably, the Long10 signature exhibited good concordance with the original labels in clustering the samples at baseline and at the end of treatment. In the CTRC cohort, the clusters based on the 10-lipid-gene signature and the treatment states were not concordant (Figure 4D). The other three signatures surpassed the 10-lipid-gene signature in clustering the samples into different TB treatment states, illustrated by better concordance between the original labels and pre-determined clusters. These findings are in line with the observation of subtle changes in the 10-lipid-gene signature during TB treatment. Collectively, the 10-lipid-gene biosignature exhibited weak clustering ability and only partially reflected the TB treatment states.
3.4 The ability of 10-lipid-gene transcriptional biosignature for TB diagnosis and TB differential diagnosis
We investigated the relationships between the 10-lipid-gene signature and multiple subject groups in various clinical situations. Notably, GSVA scores for this signature were higher for patients with TB than for most other groups, irrespective of the HIV status, except in the GSE37250 and the combined GSE42825/GSE42826/GSE42830 dataset (Figures 5A–F, Supplementary Table 7). The GSVA score differed significantly across subject groups. In particular, the GSVA score for the 10-lipid-gene signature differed significantly between the TB groups and the other groups (excluding the OD groups in GSE37250 as well as cancer and PNA in GSE42825, GSE42826, and GSE42830) (Figures 5A–F). These findings are in line with those observed for the 162 lipid-related genes (Figures 2B, C). Interestingly, the simplified signature showed a better ability than the 162-gene set to differentiate between TB and non-TB-HIV, TB and active SARC, and TB-HIV and non-TB-HIV groups based on the GSVA score (Figures 2B, C, 5A, F). The GSVA score patterns for three other signatures were similar to that for the 10-lipid-gene signature in most datasets, except in the GSE37250 and the combined GSE42825/GSE42826/GSE42830 dataset. However, based on the GSVA scores, the other signatures showed comparable or better distinction among subject groups than the 10-lipid-gene signature. None of the tested signatures had a GSVA score that differed significantly between the TB and TB-HIV groups.
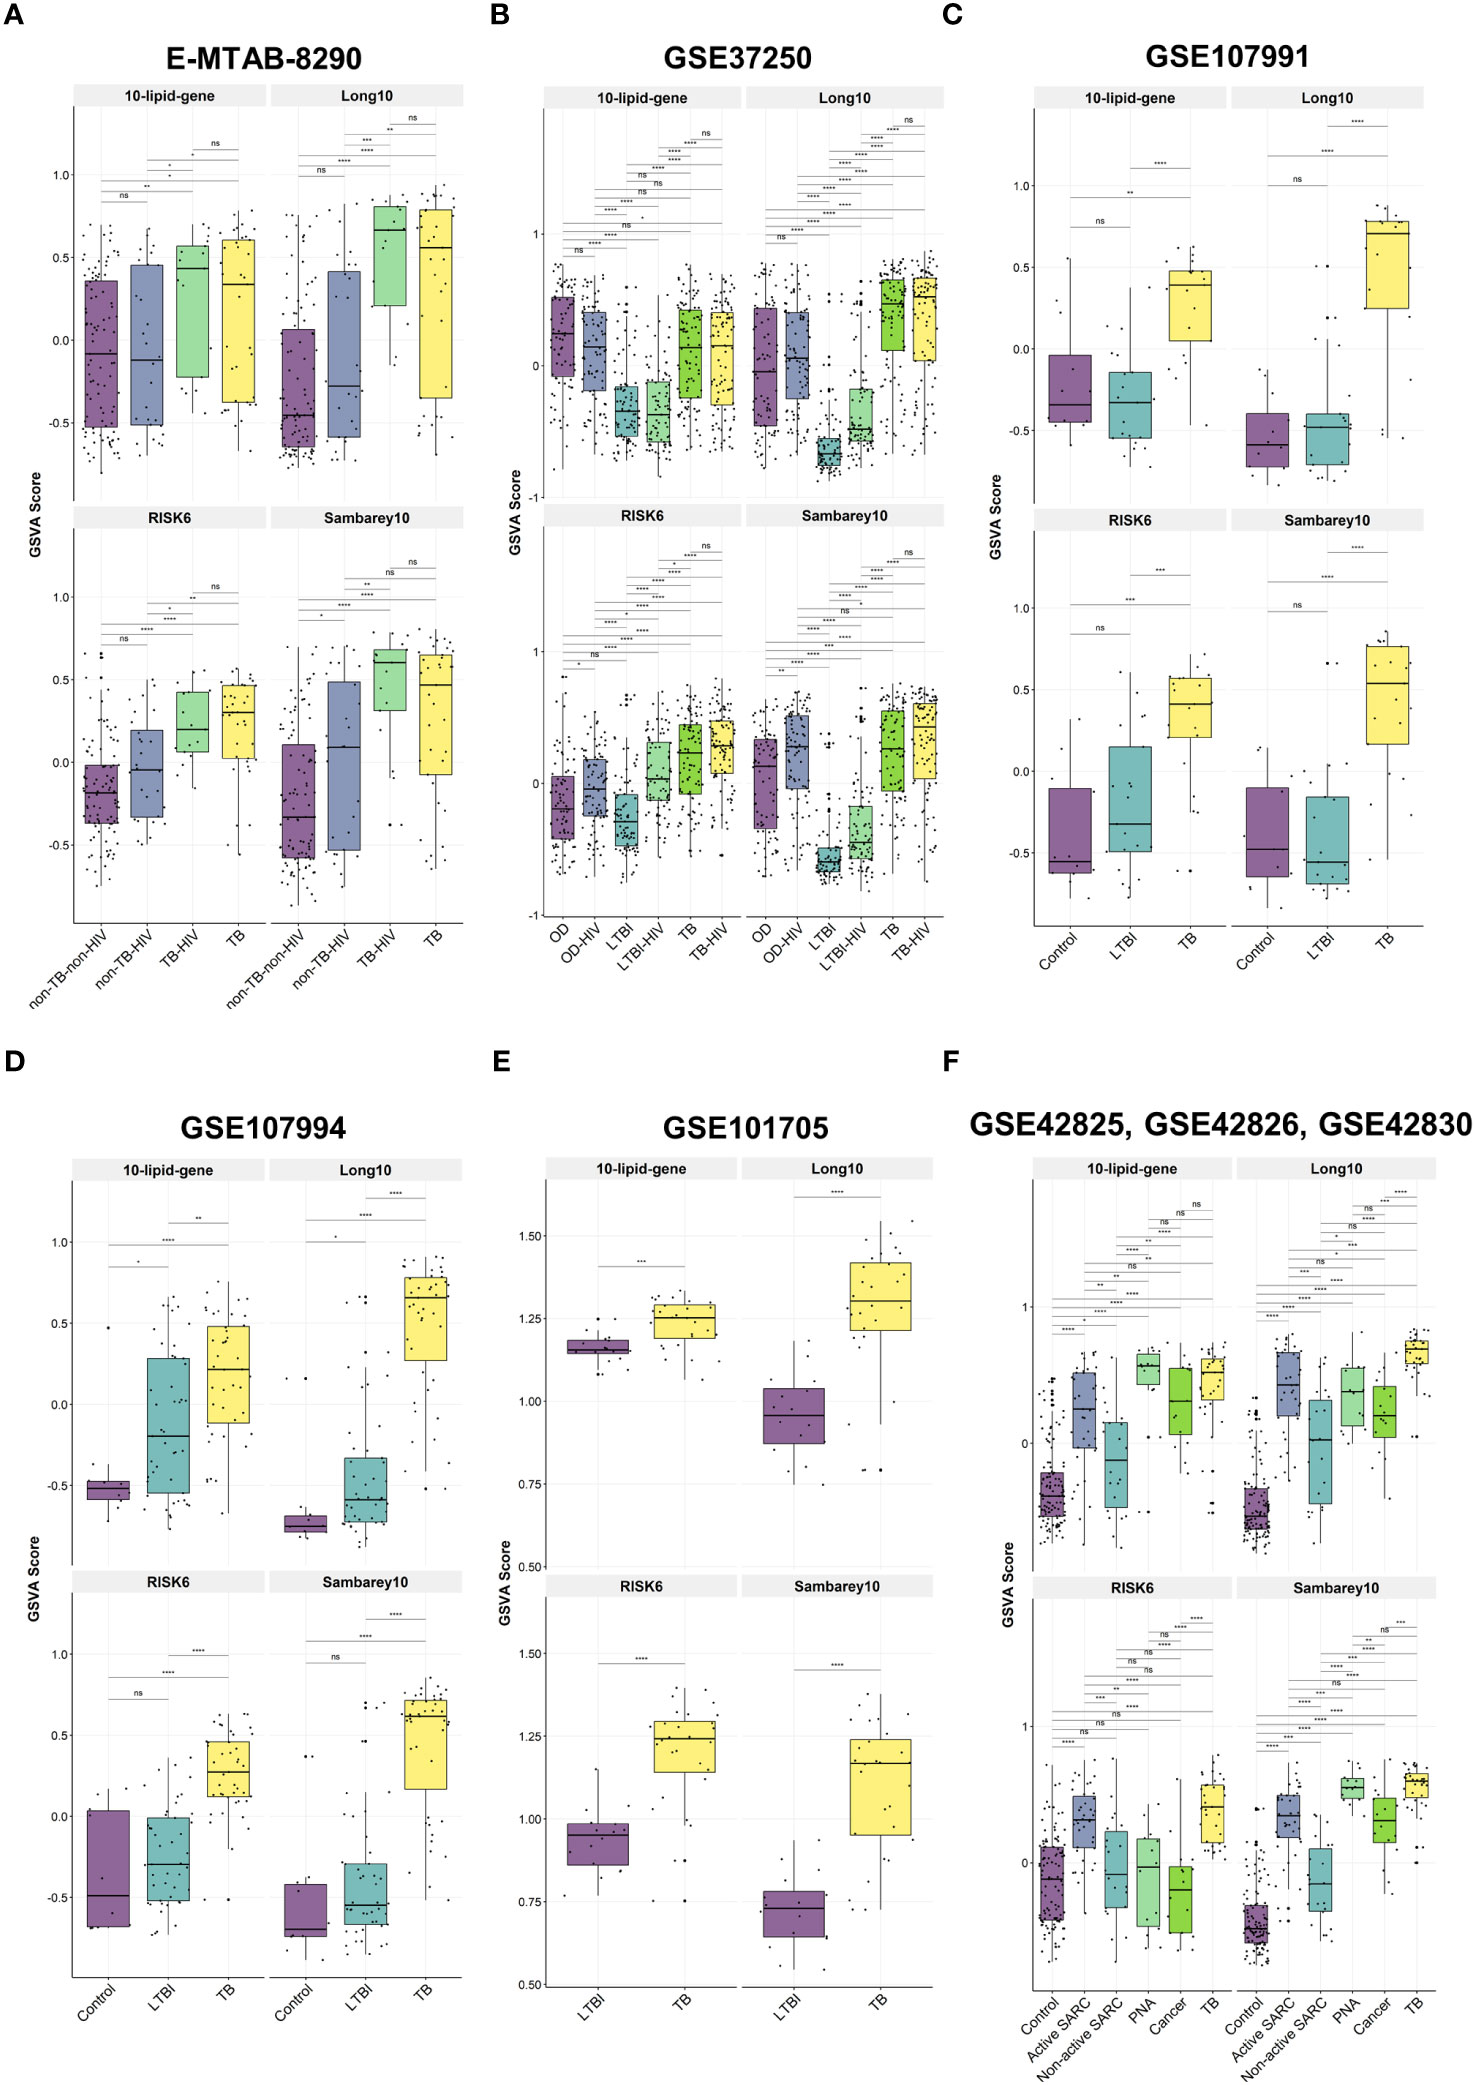
Figure 5 The GSVA score of 10-lipid-gene, Long10, RISK6, and Samberey10 biosignatures in TB and its counterparts. (A) E-MTAB-8290. The box plot represents the median and the interquartile range of the GSVA score for each subject group (B) GSE37250. (C) GSE107991. (D) GSE107994. (E) GSE101705. (F) GSE4285, GSE42826, GSE42830. GSVA, gene set variation analysis; TB, tuberculosis; LTBI, latent TB infection; OD, other diseases; HIV, human immunodeficiency virus; SARC, sarcoidosis; Cancer, lung cancer; PNA, pneumonia; ns: not significant; *,<0.05; **,<0.01; ***,<0.001; ****,<0.0001; two-sided Wilcoxon rank sum test.
The differential diagnosis performance of the 10-lipid-signature was evaluated in multiple clinical cohorts (Figure 6, Table 2). A logistic regression classifier based on the 10-lipid-gene signature exhibited good performance when distinguishing TB-only patients from non-TB controls without HIV (AUC of ROC curve and standard deviation from the 10-fold nested cross-validation = 0.766 ± 0.046) (Figure 6A). When differentiating between the TB-only group and non-TB controls with HIV, the classifier was not robustly against a random guess (the ROC crossed the diagonal line) (Figure 6B). The model showed an acceptable ability to differentiate the TB-only group from the OD (AUC = 0.679 ± 0.069) and OD-HIV (AUC = 0.690 ± 0.061) (Figures 6C, D). Additionally, the 10-lipid-gene signature showed excellent and good results in differentiating patients with TB from those with LTBI in GSE37250 (AUC = 0.832 ± 0.042) and in GSE107994 (AUC = 0.792 ± 0.067), respectively (Figure 6E, Table 2). Similarly, the 10-lipid-gene classifier distinguished the TB and LTBI-HIV groups with excellent performance (AUC = 0.871 ± 0.039) (Figure 6F). In the combined GSE42825/GSE42826/GSE42830 dataset, the 10-lipid-gene signature exhibited its best performance when distinguishing between patients with TB and healthy controls (AUC = 0.961 ± 0.027) (Figure 6G). Also, in this dataset, the 10-lipid-gene signature showed acceptable performance in distinguishing between TB and active SARC (AUC = 0.680 ± 0.079) and excellent performance in distinguishing between TB and non-active SARC (AUC = 0.877 ± 0.064) (Figures 6H, I). Other comparisons yielded acceptable accuracy (TB versus Cancer, AUC = 0.693 ± 0.076) or insignificant classification with a high variability (TB versus PNA, AUC = 0.760 ± 0.139) (Figures 6J, K).
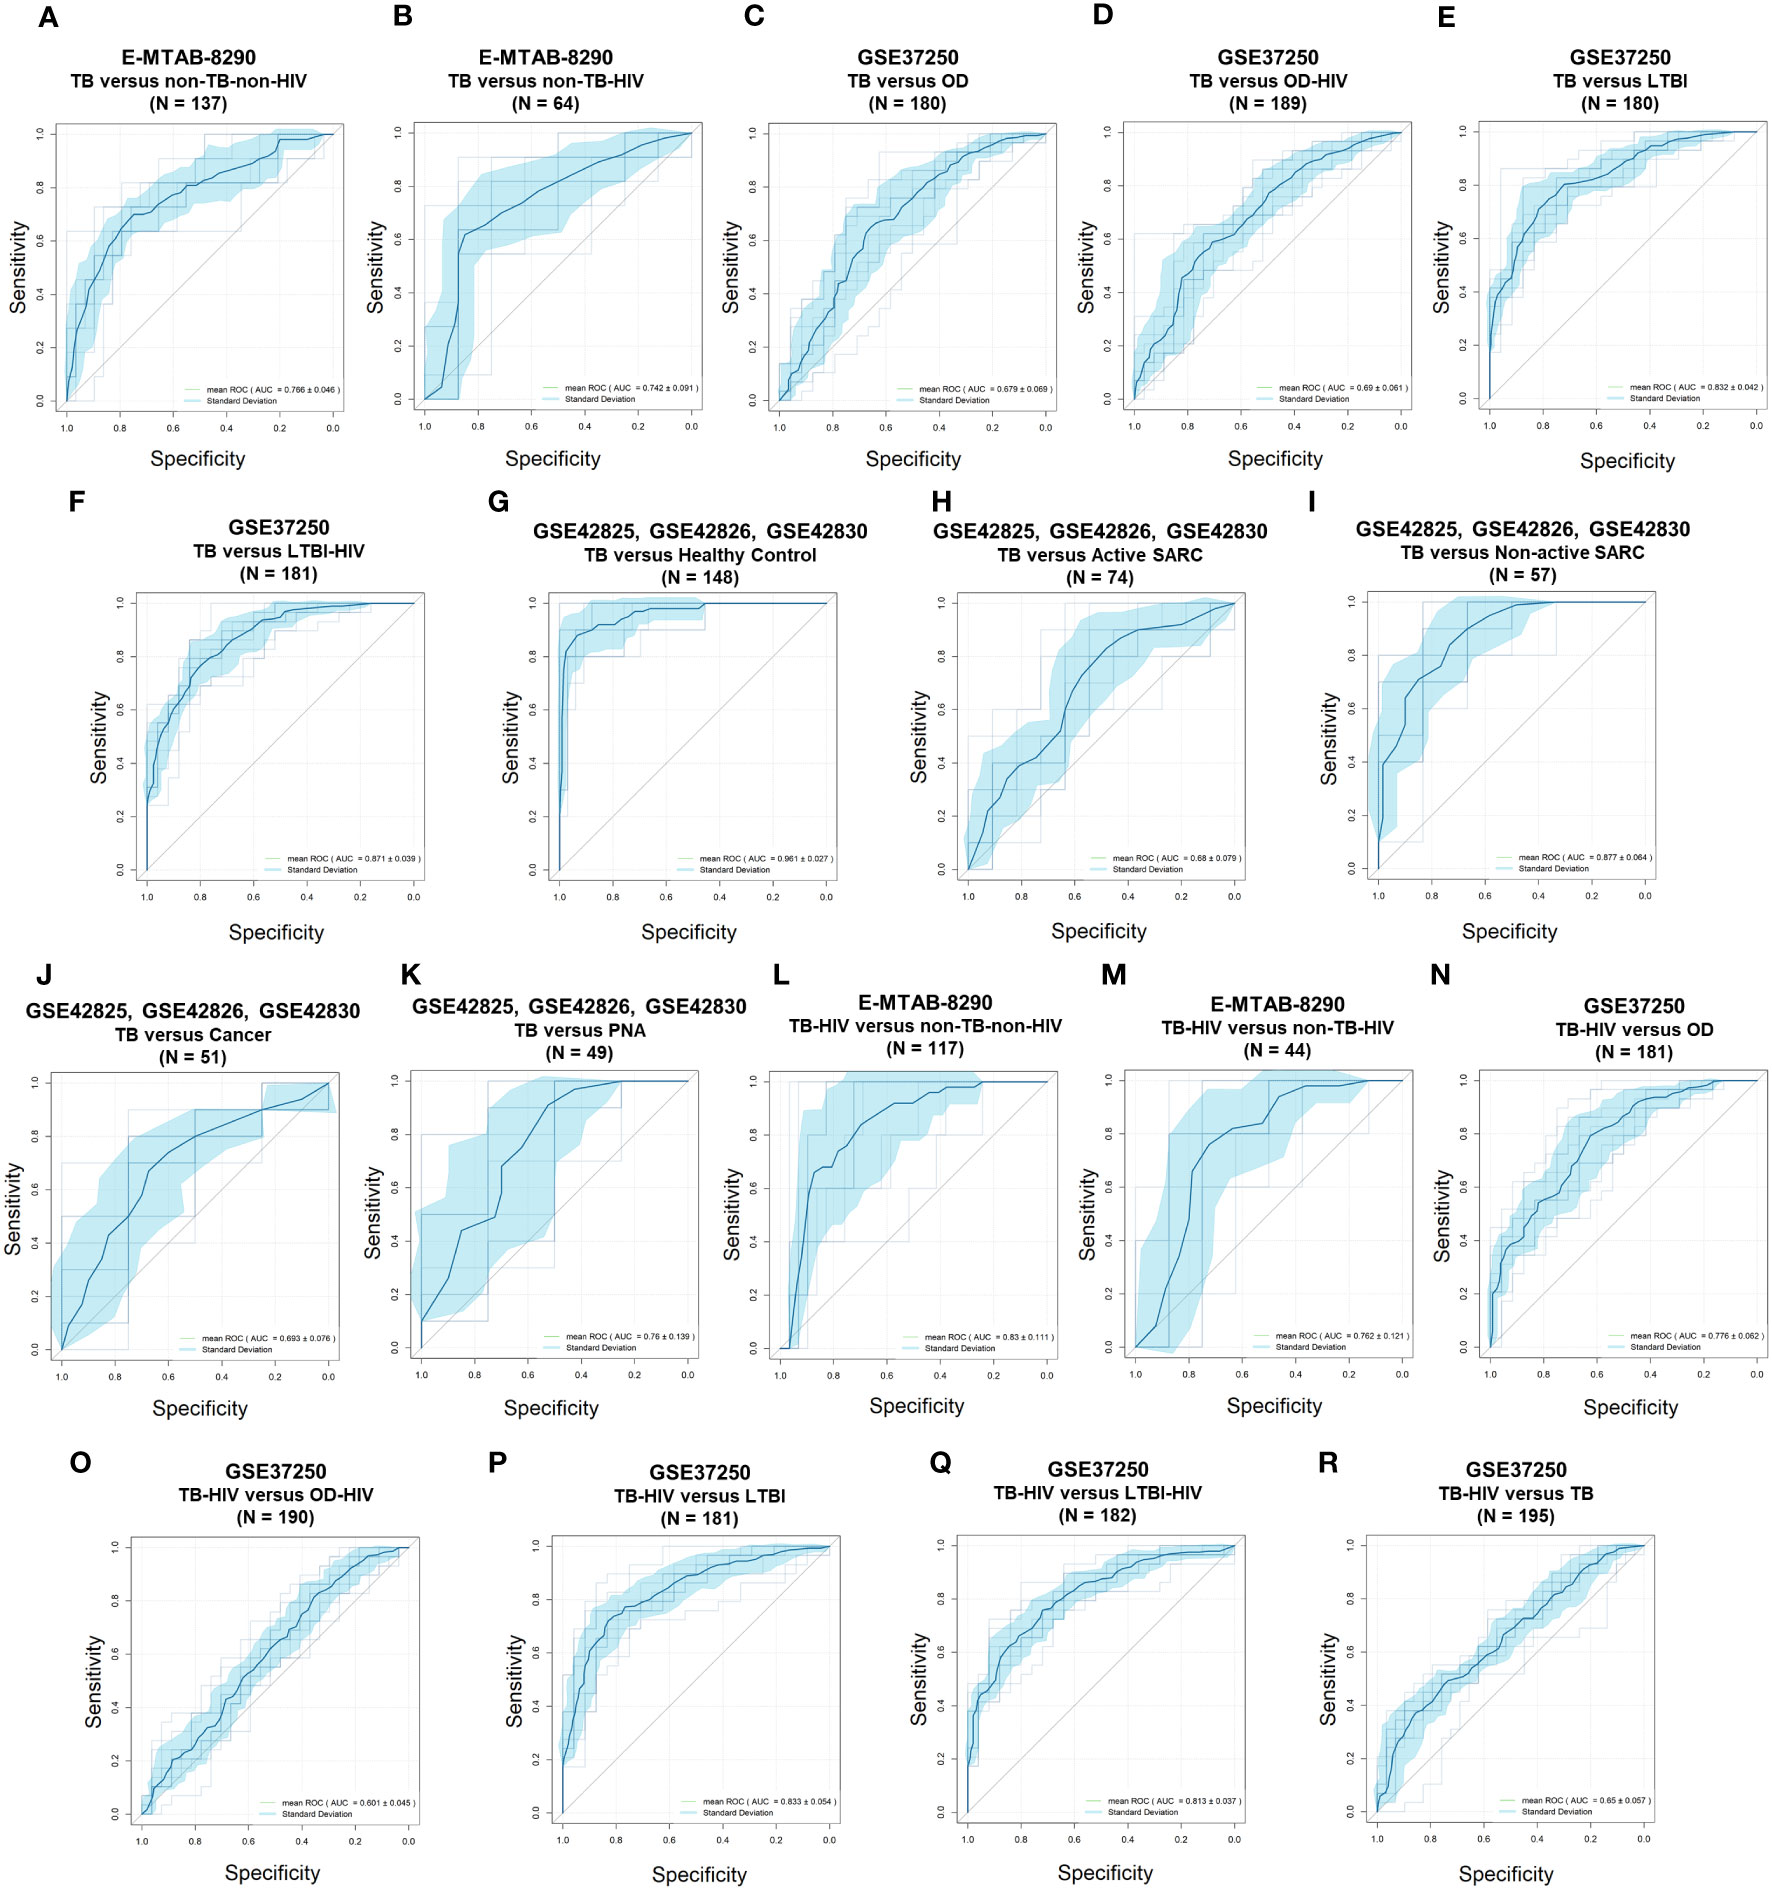
Figure 6 Receiver operating characteristic curves of the 10-lipid-gene signatures in TB diagnosis. (A) E-MTAB-8290, TB versus non-TB-non-HIV. (B) E-MTAB-8290, TB versus non-TB-HIV. (C) GSE37250, TB versus OD. (D) GSE37250, TB versus OD-HIV. (E) GSE37250, TB versus LTBI. (F) GSE37250, TB versus LTBI-HIV. (G) GSE42825; GSE42826; GSE42830, TB versus healthy control. (H) GSE42825; GSE42826; GSE42830, TB versus active SARC. (I) GSE42825; GSE42826; GSE42830; TB versus non-active SARC. (J) GSE42825; GSE42826; GSE42830, TB versus Cancer. (K) GSE42825; GSE42826; GSE42830, TB versus PNA, (L) E-MTAB-8290, TB-HIV versus non-TB-non-HIV. (M) E-MTAB-8290, TB-HIV versus non-TB-HIV. (N) GSE37250, TB-HIV versus OD. (O) GSE37250, TB-HIV versus OD-HIV. (P), GSE37250, TB-HIV versus LTBI. (Q) GSE37250, TB-HIV versus LTBI-HIV. (R) GSE37250, TB-HIV versus TB. TB, tuberculosis; LTBI, latent TB infection; OD, other diseases; HIV, human immunodeficiency virus; SARC, sarcoidosis; Cancer, lung cancer; PNA, pneumonia.
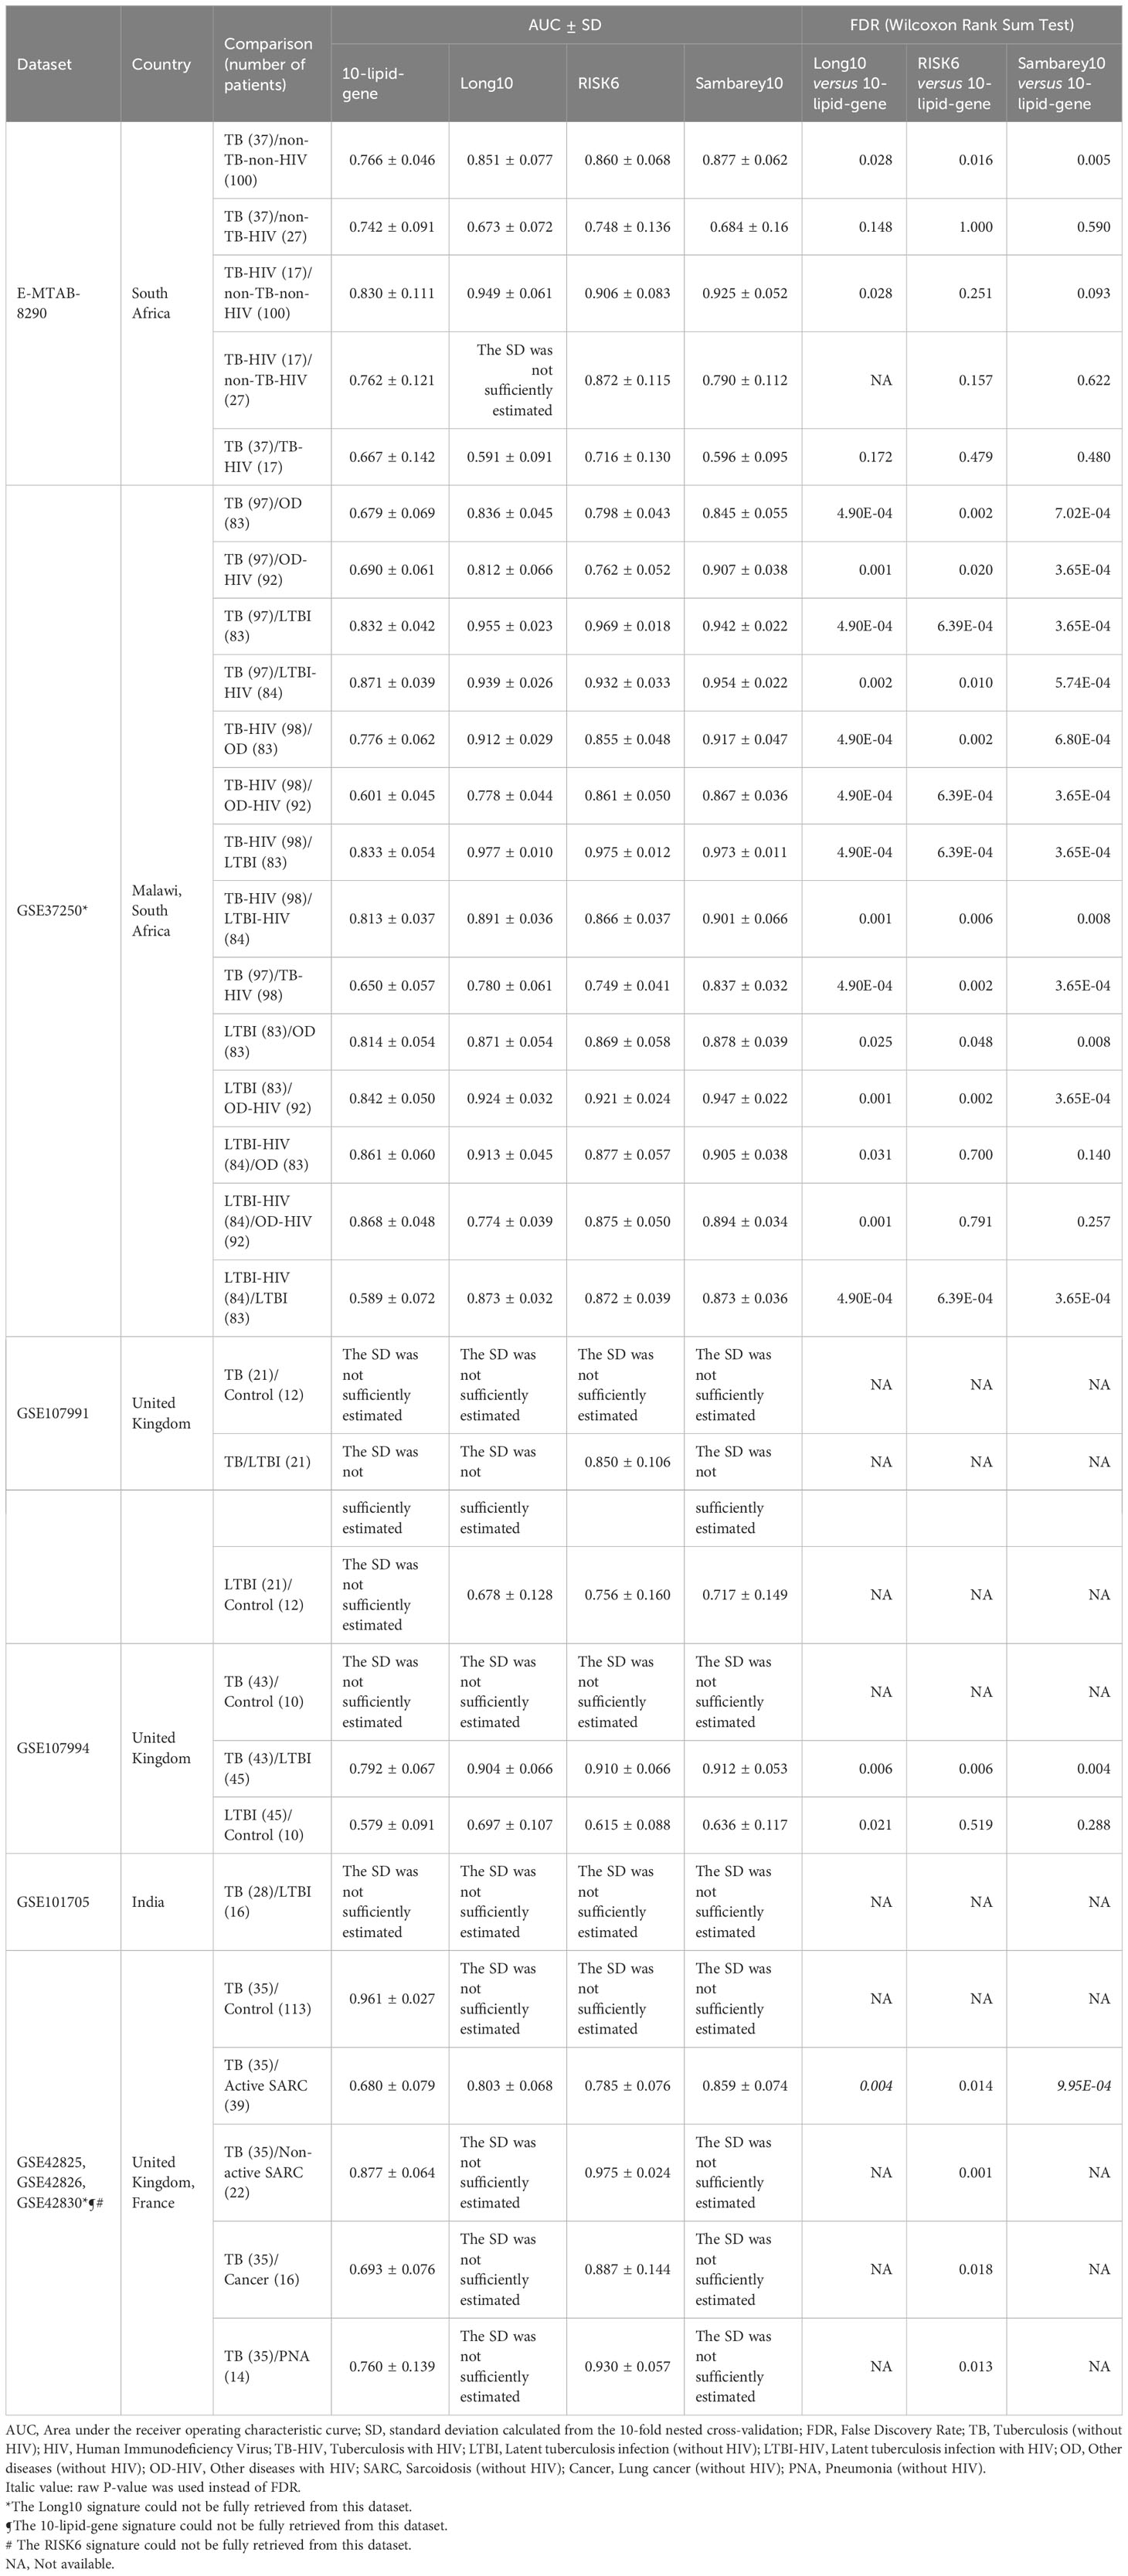
Table 2 The performance of 10-lipid-gene signature for TB diagnosis in comparison with Long10, RISK6, and Sambarey10 signatures.
The results from the comparison between TB-HIV and non-TB–non-HIV groups did not show strong evidence against a random guess (the ROC crossed the diagonal line) (Figure 6L). In contrast, the logistic regression classifier differentiated TB-HIV from non-TB-HIV with good accuracy (AUC = 0.762 ± 0.121) (Figure 6M). The performance of classifier in comparing the TB-HIV group with the OD (AUC = 0.776 ± 0.062), OD-HIV (AUC = 0.601 ± 0.045), LTBI (AUC = 0.833 ± 0.054), and LTBI-HIV (AUC = 0.813 ± 0.037) was comparable to that for the comparison of the TB-only group with these groups (Figures 6N–Q). Noticeably, the model could distinguish between TB and TB-HIV in GSE37250 with acceptable performance (AUC = 0.650 ± 0.057) (Figure 6R). Nevertheless, the results from the same comparison in E-MTAB-8290 were insignificant with a high variability (AUC = 0.667 ± 0.142) (Table 2). Additionally, the 10-lipid-gene signature exhibited an excellent ability to differentiate LTBI with OD (AUC = 0.814 ± 0.054) and OD-HIV (AUC = 0.842 ± 0.050) in the GSE37250 cohort (Table 2). Similar results were observed for the comparisons of LTBI-HIV with OD (AUC = 0.861 ± 0.060) and OD-HIV (AUC = 0.868 ± 0.048) (Table 2). The classifications between LTBI and healthy control (AUC = 0.579 ± 0.091) as well as LTBI-HIV and LTBI (AUC = 0.589 ± 0.072) were insignificant due to their high variability.
Where applicable, the diagnostic performance of the 10-lipid-gene signature was compared with that of other signatures (Table 2). In brief, the performance of the 10-lipid-gene signature was significantly poorer than that of the other signatures in most datasets. Nevertheless, the performance of the 10-lipid-gene signature was comparable to that of the RISK6 and Sambery10 signatures for certain comparisons in E-MTAB-8290, GSE37250, and GSE107994. They were TB with or without HIV versus non-TB-HIV in E-MTAB-8290, LTBI-HIV versus OD with or without HIV in GSE37250, and LTBI versus healthy control in GSE107994. Taken together, our results demonstrate the potential usefulness of the 10-lipid-gene signature for TB diagnosis in certain scenarios.
4 Discussion
The implementation of the WHO End TB strategy requires concerted efforts from the global scientific community to end the TB epidemic. A key focus area is the development of new tools for TB diagnosis, treatment monitoring, vaccine development, and therapeutic discovery. In recent years, host-based transcriptomic biosignature for TB diagnosis and treatment monitoring has been endorsed by scientific communities (13, 32, 36, 66–68). TB entails a spectrum of pathophysiological processes from the infection to the treatment completion stage (36), including inflammatory, interferon, immune, and T- and B-cell pathways (28, 69, 70). These pathophysiological events and molecular abnormalities can be evaluated by transcriptomics (70). Furthermore, although the interindividual variability of host responses is high, transcriptome-based signatures may display stable patterns during TB treatment, making them potential for treatment monitoring (71). Focusing on genes with clear patterns of changes during anti-TB treatment would help to discover relevant biomarkers, which together may form a robust predictive signature (72). In the present study, we evaluated lipid-related genes because previous studies have demonstrated the host immunological responses and lipidome alterations in TB and during anti-TB treatment (26, 27). Additionally, a knowledge-based and targeted approach derived from functional interpretation and mechanistic understanding may overcome the challenges of an entirely data-driven approach (16). These challenges include limited sample sizes, differences in the design of available data sets, the high-dimensional nature of transcriptomics data, and the lack of validation of particular signatures (9).
We employed a workflow that combined data-driven and knowledge-based approaches to investigate the expression of lipid-related genes during anti-TB treatment and its potential application for TB diagnosis in diverse clinical settings. A 10-lipid-gene signature showing clear changes during anti-TB treatment was established using time-course regression analysis. The potential usefulness of this signature for treatment monitoring was compared with that of three other signatures (i.e., RISK6, Sambarey10, and our previously reported Long10 signature) in three cohorts using GSVA. GSVA provides a direct way for a head-to-head comparison between different signatures. Wang et al. found that scores for signatures obtained with gene set enrichment methods could differentiate between active TB and other clinical conditions with equivalent or better accuracy than could conventional methods (73). The GSVA scores for all four signatures differed significantly in investigated cohorts, perhaps because of the inclusion of genes playing a critical role in TB immune-signaling pathways. The 10-lipid-gene signature generally showed poor results when classifying different TB treatment states. However, its performance was not far behind RISK6 and Sambarey10 signatures. Only the Long10 signature exhibited acceptable performance in all investigated datasets. It is worth noting that, among all longitudinal validating datasets, the shortest time point was after one week of treatment (GSE89403), and the minimum sample size was 29 TB patients with samples collected from three time points for each patient (GSE181143 – subset from Brazil). Among 10-lipid-gene signature, some genes are found on immune cells, such as monocytes (e.g., ARPC5), neutrophils (e.g., MBOAT1, MBOAT2), lymphocytes (e.g., ARPC5), dendritic cells (e.g., PLD4) (65, 74–77). The expression level of these genes on immune cells as well as the frequency of cell source population could lead to difference of performance between the investigated datasets. Overall, the benchmark analysis results highlighted the role of lipid-related genes in TB pathophysiology. Nevertheless, the 10-lipid-gene signature has certain limitations and may not be the optimal choice for accurate monitoring of the anti-TB treatment response. Our results reinforced the usefulness of gene signatures related to the immune response for anti-TB treatment monitoring.
The usefulness of the 10-lipid-gene signature for the differentiation of active TB and non-TB counterparts was investigated in multiple clinical cohorts. In multiple comparisons, GSVA scores for the 10-lipid-gene signature were higher in the TB group than in other groups, with a remarkable ability to differentiate the TB and LTBI groups in all tested cohorts. These also indicated the association between the activation of lipid-related genes with TB disease. However, the performance of the 10-lipid-gene signature was generally not as excellent as other signatures because the expression of lipid-related genes changed only subtly. The caution should also be made since the OD group consisted of multiple respiratory diseases, which might introduce bias into the analysis (31). Consistent with the GSVA scores, the logistic regression classifier based on the 10-lipid-gene signature performed well in differentiating patients with TB from non-TB controls and those with LTBI (with or without HIV), and non-active SARC. The 10-lipid-gene signature had the best results for distinguishing TB from healthy controls. Noticeably, the good performance of the 10-lipid-gene signature in differentiating between TB and non-TB controls, healthy controls, LTBI, non-active SARC but not between TB and OD, active SARC, lung cancer, PNA indicates its limited capacity for TB differential diagnosis. The results are consistent with our previous investigations of lipid and lipid-related genes to diagnose active TB disease (26). Host lipids play a vital role in the immune response to TB infection. Our findings further confirm the role of lipid-related genes in the dysregulated host metabolism and immune signaling during TB activation relative to LTBI. Of note, the TB and TB-HIV groups could not be classified significantly across all cohorts, possibly due to heterogeneity among cohorts and relatively small sample sizes in the tested datasets. For instance, the status of antiretroviral therapy, which can alter the transcriptome of HIV patients (78), differs across cohorts and may partially contribute to variations in the performance of the signatures. Besides, similar shortcomings associated with small sample sizes for biomarker validation have been reported in other biomarker studies, such as RISK4 and RISK6 (36, 79). The 10-lipid-gene signature displayed unsatisfactory performance in differentiating patients with LTBI from healthy controls, concordant with the fact that metabolomes and lipidomes are similar between these groups (80). Overall, the 10-lipid-gene signature exhibited the potential to be used for further optimization of TB diagnosis.
At the current setup of biosignature, metabolism-centric biomarkers may not outperform other leading signatures. However, individual biomarkers reported in our work could be strong candidates to be considered when establishing a biosignature that takes into account the metabolic alterations during TB treatment. We provided proof-of-concept results regarding the potential of lipid biomarkers (27). These findings collectively demonstrate that metabolism-centric biomarkers could be a significant aspect to be explored further in addition to approaches targeting immunological processes.
The biological relevance of derived biosignature must be examined thoroughly due to its significance. The products encoded by the 10 candidate genes are involved in multiple immune processes (Table 1). For instance, subunit 5 of actin-related protein 2/3 complex, encoded by ARPC5, involves in the entry of Mtb into lung epithelial cells (81) as well as lymphocyte activation, adhesion, and migration, which are hallmarks of the TB pathophysiology (82–84). ACSL4 regulates ferroptosis by modulating the cellular lipidome (52). Furthermore, ACSL4 was found to be overexpressed in anti-TB drug-induced liver injury, indicating ferroptosis induction during anti-TB treatment (85). PLD4 is differentially expressed in patients with TB (27). Phospholipase D activation is associated closely with Mtb phagocytosis by macrophages (86). During the early stages of TB infection, Mtb inhibits phagosome maturation and acidification by various bacterial factors (87, 88). As the treatment progression with Mtb elimination, this inhibition is reduced. Additionally, the increase in the interferon-γ level during anti-TB treatment induces phagosome maturation in macrophages (89). The rise of phagocytosis could be associated with the elevation of PLD4 gene expression during the TB treatment time course. Lysosomal acid lipase, encoded by LIPA, is involved in the maturation and function of immune cells via the regulation of FC and FFA levels (56). Interestingly, the rs1051338 and rs7922269 single-nucleotide polymorphisms of LIPA are associated with individual susceptibility to pulmonary TB (90). The CHMP2B protein is a subunit of the endosomal sorting complex required for transport III (ESCRT-III) (57). ESCRT-III is recruited and engaged with Mtb phagosomes, preventing Mtb release into the cytosol (91). RAB5A encodes a crucial small GTPase that regulates the fusion between bacteria-containing phagosomes (including Mtb) and cytoplasmic organelles (59), thereby influencing the ability of neutrophils to restrict pathogen spread (59, 60). Moreover, RAB5A is tightly involved in TB immune infiltration (92). The GABARAPL2 protein participates in the autophagy pathway an essential biological process that defends against intracellular microbes, including Mtb (61, 93). Mtb-dependent macrophage apoptosis requires phospholipase A2 group IVA, encoded by PLA2G4A (94). Phospholipase A2 group IVA is also responsible for the initial step in the arachidonic acid (AA) pathway, which involves the cleavage of AA from the sn-2 position of phospholipids in cell membranes (63). AA promotes the formation of eicosanoids, crucial inflammatory mediators (95). Interestingly, the two last components of our signature, MBOAT1 and MBOAT2, also regulate the free AA level through the arachidonate recycling process and relate to eicosanoids production (65, 95). AA-derived eicosanoids, including prostaglandins, leukotrienes, and lipoxins, can modulate the host response to Mtb infection (96, 97). Previous studies demonstrated the altered levels of eicosanoids in TB, TB with comorbid diabetes, and after TB treatment (98, 99). In general, the ten genes can be roughly categorized into three groups based on their associated immunological pathways. They are genes involved in apoptosis/phagocytosis/autophagy pathways (CHMP2B, RAB5A, GABARAPL2, PLA2G4A, PLD4), genes involved in AA/FFAs pathways (PLA2G4A, MBOAT1, MBOAT2, LIPA, ACSL4), and gene involves in lymphocyte migration (ARPC5). These findings suggest the existence of associations between lipid signaling and immune pathways.
This study has several limitations which should be assessed. Firstly, the biosignature was derived from a time-series analysis on a single cohort, which may limit the generalizability of the biosignature on diverse populations with heterogeneous backgrounds. We addressed the limitation by validating our signature in a cross-platform, multi-ethnic, multi-cohort scenario to demonstrate its applicability across diverse populations and settings. We further expanded the scope of our investigation beyond TB treatment monitoring to also include TB diagnostics, showcasing the flexibility of our signature. Furthermore, we conducted a head-to-head benchmarking analysis with other publicly available signatures to demonstrate the capacity of our signature. The second shortcoming is that we did not account for confounding factors during the time series analysis, which could potentially lead to false-positive signals. However, we mitigated this issue by adopting a targeted approach based on prior knowledge to minimize the number of false-positive findings. Thirdly, focusing on lipid-related genes, which exhibited subtle alteration between TB and its counterparts (26), might limit the robustness of the signature. However, finding a signature with excellent performance is an aim but not the primary goal of this study. Our study was conducted to demonstrate the potential of lipid-related gene markers in TB management and suggest the direction for subsequent studies. Moreover, the identification of certain genes as potential candidates might be attributed to their high correlation with the “true” markers. Indeed, the partial overlap between signatures is frequently observed. The 10-lipid-gene biosignature also intersects one gene (MBOAT2) with the 558-gene signature representing the TB treatment response of Bloom et al. (35). However, to the best of our knowledge, the remaining nine genes were reported for the first time in our study. This finding implicates that there is still ample room for further research in discovering metabolism-centric biomarkers, particularly lipid-related genes. Last but not least, exploring the integration of lipid-related genes with other signatures to enhance their performance should be pursued in future investigations.
In the present study, we developed a biosignature based on key lipid-related genes that can be used to assist the management of TB. Our findings emphasize the crucial role of lipid metabolism in TB pathophysiology and treatment response. Additionally, the lipid-related genes have been implicated in the host immune response, highlighting the significant association between lipid metabolism and the immune system in TB. This association presents a promising target for the development of novel TB diagnostic and treatment monitoring strategies. It should be explored further to enhance our understanding and improve TB management.
Data availability statement
The original contributions presented in the study are included in the article/Supplementary Material. Further inquiries can be directed to the corresponding authors.
Author contributions
Conceptualization, SP, NL, DK, and J-GS; Investigation, NP and NL; Formal Analysis, NP, SP, NL, and NT; Writing – Original draft, NP, NA, NL, DK, and J-GS; Writing – Review & Editing, NP, NT, NA, NY, YL, HT, K-ML, SA, Y-SC, SP, NL, DK, and J-GS; Visualization, NP, NT, and NY, Data curation, NP, NT, NA, and NY; Methodology, NP, NT, NA, NY, YL, HT, K-ML, SA, Y-SC, SP, NL, DK, and J-GS; Validation, NP, NT, NA, NY, YL, HT, K-ML, SA, Y-SC, SP, NL, DK, and J-GS; Supervision, SP, NL, DK, and J-GS; Resources, J-GS; Funding acquisition, J-GS. All authors contributed to the article and approved the submitted version.
Funding
The National Research Foundation of Korea (NRF) grant funded by the Korean government (MSIT) (grant No. 2018R1A5A2021242) provided financial support for this study. The funders had no involvement in the study design, data collection, data analysis, interpretation, or development of the research content.
Acknowledgments
Figure 1 was created using biorender.com.
Conflict of interest
The authors declare that the research was conducted in the absence of any commercial or financial relationships that could be construed as a potential conflict of interest.
Publisher’s note
All claims expressed in this article are solely those of the authors and do not necessarily represent those of their affiliated organizations, or those of the publisher, the editors and the reviewers. Any product that may be evaluated in this article, or claim that may be made by its manufacturer, is not guaranteed or endorsed by the publisher.
Supplementary material
The Supplementary Material for this article can be found online at: https://www.frontiersin.org/articles/10.3389/fimmu.2023.1210372/full#supplementary-material
References
1. World Health Organization. Global tuberculosis report 2022. Geneva, Switzerland: World Health Organization (2022).
2. Gill CM, Dolan L, Piggott LM, McLaughlin AM. New developments in tuberculosis diagnosis and treatment. Breathe (Sheff) (2022) 18(1):210149. doi: 10.1183/20734735.0149-2021
3. Lee A, Xie YL, Barry CE, Chen RY. Current and future treatments for tuberculosis. BMJ (2020) 368:m216. doi: 10.1136/bmj.m216
4. Sant´Anna FM, Araújo-Pereira M, Schmaltz CAS, Arriaga MB, de Oliveira RVC, Andrade BB, et al. Adverse drug reactions related to treatment of drug-susceptible tuberculosis in Brazil: A prospective cohort study. Front Trop Dis (2022) 2:748310. doi: 10.3389/fitd.2021.748310
5. Chung SJ, Byeon SJ, Choi JH. Analysis of adverse drug reactions to first-line anti-tuberculosis drugs using the Korea adverse event reporting system. J Korean Med Sci (2022) 37(16):e128. doi: 10.3346/jkms.2022.37.e128
6. van den Boogaard J, Kibiki GS, Kisanga ER, Boeree MJ, Aarnoutse RE. New drugs against tuberculosis: problems, progress, and evaluation of agents in clinical development. Antimicrob Agents Chemother (2009) 53(3):849–62. doi: 10.1128/AAC.00749-08
7. Volmink J, Garner P. Directly observed therapy for treating tuberculosis. Cochrane Database Syst Rev (2007) 4):CD003343. doi: 10.1002/14651858.CD003343.pub3
8. Horne DJ, Royce SE, Gooze L, Narita M, Hopewell PC, Nahid P, et al. Sputum monitoring during tuberculosis treatment for predicting outcome: systematic review and meta-analysis. Lancet Infect Dis (2010) 10(6):387–94. doi: 10.1016/S1473-3099(10)70071-2
9. Hamada Y, Penn-Nicholson A, Krishnan S, Cirillo DM, Matteelli A, Wyss R, et al. Are mRNA based transcriptomic signatures ready for diagnosing tuberculosis in the clinic? - A review of evidence and the technological landscape. EBioMedicine (2022) 82:104174. doi: 10.1016/j.ebiom.2022.104174
10. Zimmer AJ, Lainati F, Aguilera Vasquez N, Chedid C, McGrath S, Benedetti A, et al. Biomarkers that correlate with active pulmonary tuberculosis treatment response: a systematic review and meta-analysis. J Clin Microbiol (2022) 60(2):e0185921. doi: 10.1128/JCM.01859-21
11. Singhania A, Wilkinson RJ, Rodrigue M, Haldar P, O’Garra A. The value of transcriptomics in advancing knowledge of the immune response and diagnosis in tuberculosis. Nat Immunol (2018) 19(11):1159–68. doi: 10.1038/s41590-018-0225-9
12. Gupta RK, Turner CT, Venturini C, Esmail H, Rangaka MX, Copas A, et al. Concise whole blood transcriptional signatures for incipient tuberculosis: a systematic review and patient-level pooled meta-analysis. Lancet Respir Med (2020) 8(4):395–406. doi: 10.1016/S2213-2600(19)30282-6
13. Warsinske H, Vashisht R, Khatri P. Host-response-based gene signatures for tuberculosis diagnosis: A systematic comparison of 16 signatures. PloS Med (2019) 16(4):e1002786. doi: 10.1371/journal.pmed.1002786
14. MacLean E, Broger T, Yerlikaya S, Fernandez-Carballo BL, Pai M, Denkinger CM. A systematic review of biomarkers to detect active tuberculosis. Nat Microbiol (2019) 4(5):748–58. doi: 10.1038/s41564-019-0380-2
15. Bayaa R, Ndiaye MDB, Chedid C, Kokhreidze E, Tukvadze N, Banu S, et al. Multi-country evaluation of RISK6, a 6-gene blood transcriptomic signature, for tuberculosis diagnosis and treatment monitoring. Sci Rep (2021) 11(1):13646. doi: 10.1038/s41598-021-93059-1
16. Long NP, Phat NK, Yen NTH, Park S, Park Y, Cho YS, et al. A 10-gene biosignature of tuberculosis treatment monitoring and treatment outcome prediction. Tuberculosis (Edinb) (2021) 131:102138. doi: 10.1016/j.tube.2021.102138
17. Sambarey A, Devaprasad A, Mohan A, Ahmed A, Nayak S, Swaminathan S, et al. Unbiased identification of blood-based biomarkers for pulmonary tuberculosis by modeling and mining molecular interaction networks. EBioMedicine (2017) 15:112–26. doi: 10.1016/j.ebiom.2016.12.009
18. World Health Organization. High priority target product profiles for new tuberculosis diagnostics: report of a consensus meeting, 28-29 April 2014. Geneva, Switzerland: World Health Organization (2014).
19. Walsh CJ, Hu P, Batt J, Santos CCD. Microarray meta-analysis and cross-platform normalization: integrative genomics for robust biomarker discovery. Microarrays (Basel) (2015) 4(3):389–406. doi: 10.3390/microarrays4030389
20. Simon J, Evans, Akil H, Watson SJ. Analyzing gene expression in depression. Am J Psychiatry (2009) 166(9):961–3. doi: 10.1176/appi.ajp.2009.09060806
21. Dozmorov I, Lefkovits I. Internal standard-based analysis of microarray data. Part 1: analysis of differential gene expressions. Nucleic Acids Res (2009) 37(19):6323–39. doi: 10.1093/nar/gkp706%JNucleicAcidsResearch
22. Li Y, Ge X, Peng F, Li W, Li JJ. Exaggerated false positives by popular differential expression methods when analyzing human population samples. Genome Biol (2022) 23(1):79. doi: 10.1186/s13059-022-02648-4
23. Shi H, Zhou Y, Jia E, Pan M, Bai Y, Ge Q. Bias in RNA-seq library preparation: current challenges and solutions. BioMed Res Int (2021) 2021:6647597. doi: 10.1155/2021/6647597
24. Bernardi S, Marcuzzi A, Piscianz E, Tommasini A, Fabris B. The complex interplay between lipids, immune system and interleukins in cardio-metabolic diseases. Int J Mol Sci (2018) 19(12). doi: 10.3390/ijms19124058
25. Collins JM, Jones DP, Sharma A, Khadka M, Liu KH, Kempker RR, et al. TCA cycle remodeling drives proinflammatory signaling in humans with pulmonary tuberculosis. PloS Pathog (2021) 17(9):e1009941. doi: 10.1371/journal.ppat.1009941
26. Long NP, Anh NK, Yen NTH, Phat NK, Park S, Thu VTA, et al. Comprehensive lipid and lipid-related gene investigations of host immune responses to characterize metabolism-centric biomarkers for pulmonary tuberculosis. Sci Rep (2022) 12(1):13395. doi: 10.1038/s41598-022-17521-4
27. Anh NK, Phat NK, Yen NTH, Jayanti RP, Thu VTA, Park YJ, et al. Comprehensive lipid profiles investigation reveals host metabolic and immune alterations during anti-tuberculosis treatment: Implications for therapeutic monitoring. BioMed Pharmacother (2023) 158:114187. doi: 10.1016/j.biopha.2022.114187
28. Cliff JM, Lee JS, Constantinou N, Cho JE, Clark TG, Ronacher K, et al. Distinct phases of blood gene expression pattern through tuberculosis treatment reflect modulation of the humoral immune response. J Infect Dis (2013) 207(1):18–29. doi: 10.1093/infdis/jis499
29. Thompson EG, Du Y, Malherbe ST, Shankar S, Braun J, Valvo J, et al. Host blood RNA signatures predict the outcome of tuberculosis treatment. Tuberculosis (Edinb) (2017) 107:48–58. doi: 10.1016/j.tube.2017.08.004
30. Queiroz ATL, Vinhaes CL, Fukutani ER, Gupte AN, Kumar NP, Fukutani KF, et al. A multi-center, prospective cohort study of whole blood gene expression in the tuberculosis-diabetes interaction. Sci Rep (2023) 13(1):7769. doi: 10.1038/s41598-023-34847-9
31. Kaforou M, Wright VJ, Oni T, French N, Anderson ST, Bangani N, et al. Detection of tuberculosis in HIV-infected and -uninfected African adults using whole blood RNA expression signatures: a case-control study. PloS Med (2013) 10(10):e1001538. doi: 10.1371/journal.pmed.1001538
32. Turner CT, Gupta RK, Tsaliki E, Roe JK, Mondal P, Nyawo GR, et al. Blood transcriptional biomarkers for active pulmonary tuberculosis in a high-burden setting: a prospective, observational, diagnostic accuracy study. Lancet Respir Med (2020) 8(4):407–19. doi: 10.1016/S2213-2600(19)30469-2
33. Singhania A, Verma R, Graham CM, Lee J, Tran T, Richardson M, et al. A modular transcriptional signature identifies phenotypic heterogeneity of human tuberculosis infection. Nat Commun (2018) 9(1):2308. doi: 10.1038/s41467-018-04579-w
34. Leong S, Zhao Y, Joseph NM, Hochberg NS, Sarkar S, Pleskunas J, et al. Existing blood transcriptional classifiers accurately discriminate active tuberculosis from latent infection in individuals from south India. Tuberculosis (Edinb) (2018) 109:41–51. doi: 10.1016/j.tube.2018.01.002
35. Bloom CI, Graham CM, Berry MP, Rozakeas F, Redford PS, Wang Y, et al. Transcriptional blood signatures distinguish pulmonary tuberculosis, pulmonary sarcoidosis, pneumonias and lung cancers. PloS One (2013) 8(8):e70630. doi: 10.1371/journal.pone.0070630
36. Penn-Nicholson A, Mbandi SK, Thompson E, Mendelsohn SC, Suliman S, Chegou NN, et al. RISK6, a 6-gene transcriptomic signature of TB disease risk, diagnosis and treatment response. Sci Rep (2020) 10(1):8629. doi: 10.1038/s41598-020-65043-8
37. Gautier L, Cope L, Bolstad BM, Irizarry RA. affy–analysis of Affymetrix GeneChip data at the probe level. Bioinformatics (2004) 20(3):307–15. doi: 10.1093/bioinformatics/btg405
38. Du P, Kibbe WA, Lin SM. lumi: a pipeline for processing Illumina microarray. Bioinformatics (2008) 24(13):1547–8. doi: 10.1093/bioinformatics/btn224
39. Johnson WE, Li C, Rabinovic A. Adjusting batch effects in microarray expression data using empirical Bayes methods. Biostatistics (2007) 8(1):118–27. doi: 10.1093/biostatistics/kxj037
40. Leek JT, Johnson WE, Parker HS, Jaffe AE, Storey JD. The sva package for removing batch effects and other unwanted variation in high-throughput experiments. Bioinformatics (2012) 28(6):882–3. doi: 10.1093/bioinformatics/bts034
41. Manimaran S, Selby HM, Okrah K, Ruberman C, Leek JT, Quackenbush J, et al. BatchQC: interactive software for evaluating sample and batch effects in genomic data. Bioinformatics (2016) 32(24):3836–8. doi: 10.1093/bioinformatics/btw538
42. Zhang Y, Parmigiani G, Johnson WE. ComBat-seq: batch effect adjustment for RNA-seq count data. NAR genom Bioinform (2020) 2(3):lqaa078. doi: 10.1093/nargab/lqaa078
43. Love MI, Huber W, Anders S. Moderated estimation of fold change and dispersion for RNA-seq data with DESeq2. Genome Biol (2014) 15(12):550. doi: 10.1186/s13059-014-0550-8
44. Hänzelmann S, Castelo R, Guinney J. GSVA: gene set variation analysis for microarray and RNA-Seq data. BMC Bioinf (2013) 14(1):7. doi: 10.1186/1471-2105-14-7
45. Gu Z, Eils R, Schlesner M. Complex heatmaps reveal patterns and correlations in multidimensional genomic data. Bioinformatics (2016) 32(18):2847–9. doi: 10.1093/bioinformatics/btw313
46. Conesa A, Nueda MJ, Ferrer A, Talón M. maSigPro: a method to identify significantly differential expression profiles in time-course microarray experiments. Bioinformatics (2006) 22(9):1096–102. doi: 10.1093/bioinformatics/btl056
47. Pang Z, Chong J, Zhou G, de Lima Morais DA, Chang L, Barrette M, et al. MetaboAnalyst 5.0: narrowing the gap between raw spectra and functional insights. Nucleic Acids Res (2021) 49(W1):W388–W96. doi: 10.1093/nar/gkab382
48. Kuhn M. Building predictive models in R using the caret package. J Stat Softw (2008) 28(5):1–26. doi: 10.18637/jss.v028.i05
49. Zhao P, Han H, Wu X, Wu J, Ren Z. ARP2/3 regulates fatty acid synthesis by modulating lipid droplets' Motility. Int J Mol Sci (2022) 23(15). doi: 10.3390/ijms23158730
50. Herdoiza Padilla E, Crauwels P, Bergner T, Wiederspohn N, Förstner S, Rinas R, et al. mir-124-5p regulates phagocytosis of human macrophages by targeting the actin cytoskeleton via the ARP2/3 complex. Front Immunol (2019) 10:2210. doi: 10.3389/fimmu.2019.02210
51. Zhang Y, Shen H, Liu H, Feng H, Liu Y, Zhu X, et al. Arp2/3 complex controls T cell homeostasis by maintaining surface TCR levels via regulating TCR+ endosome trafficking. Sci Rep (2017) 7(1):8952. doi: 10.1038/s41598-017-08357-4
52. Doll S, Proneth B, Tyurina YY, Panzilius E, Kobayashi S, Ingold I, et al. ACSL4 dictates ferroptosis sensitivity by shaping cellular lipid composition. Nat Chem Biol (2017) 13(1):91–8. doi: 10.1038/nchembio.2239
53. Padanad MS, Konstantinidou G, Venkateswaran N, Melegari M, Rindhe S, Mitsche M, et al. Fatty acid oxidation mediated by acyl-coA synthetase long chain 3 is required for mutant KRAS lung tumorigenesis. Cell Rep (2016) 16(6):1614–28. doi: 10.1016/j.celrep.2016.07.009
54. Gao L, Zhou Y, Zhou SX, Yu XJ, Xu JM, Zuo L, et al. PLD4 promotes M1 macrophages to perform antitumor effects in colon cancer cells. Oncol Rep (2017) 37(1):408–16. doi: 10.3892/or.2016.5216
55. Otani Y, Yamaguchi Y, Sato Y, Furuichi T, Ikenaka K, Kitani H, et al. PLD4 is involved in phagocytosis of microglia: expression and localization changes of PLD4 are correlated with activation state of microglia. PloS One (2011) 6(11):e27544. doi: 10.1371/journal.pone.0027544
56. Gomaraschi M, Bonacina F, Norata GD. Lysosomal acid lipase: from cellular lipid handler to immunometabolic target. Trends Pharmacol Sci (2019) 40(2):104–15. doi: 10.1016/j.tips.2018.12.006
57. Alqabandi M, de Franceschi N, Maity S, Miguet N, Bally M, Roos WH, et al. The ESCRT-III isoforms CHMP2A and CHMP2B display different effects on membranes upon polymerization. BMC Biol (2021) 19(1):66. doi: 10.1186/s12915-021-00983-9
58. Jorgensen JR, Tei R, Baskin JM, Michel AH, Kornmann B, Emr SD. ESCRT-III and ER-PM contacts maintain lipid homeostasis. Mol Biol Cell (2020) 31(12):1302–13. doi: 10.1091/mbc.E20-01-0061
59. Weiss G, Schaible UE. Macrophage defense mechanisms against intracellular bacteria. Immunol Rev (2015) 264(1):182–203. doi: 10.1111/imr.12266
60. Alvarez-Dominguez C, Stahl PD. Increased expression of rab5a correlates directly with accelerated maturation of listeria monocytogenesPhagosomes*. JBC (1999) 274(17):11459–62. doi: 10.1074/jbc.274.17.11459
61. Xie Y, Li J, Kang R, Tang D. Interplay between lipid metabolism and autophagy. Front Cell Dev Biol (2020) 8:431. doi: 10.3389/fcell.2020.00431
62. Eck F, Phuyal S, Smith MD, Kaulich M, Wilkinson S, Farhan H, et al. ACSL3 is a novel GABARAPL2 interactor that links ufmylation and lipid droplet biogenesis. J Cell Sci (2020) 133(18). doi: 10.1242/jcs.243477
63. Grkovich A, Armando A, Quehenberger O, Dennis EA. TLR-4 mediated group IVA phospholipase A2 activation is phosphatidic acid phosphohydrolase 1 and protein kinase C dependent. Biochim Biophys Acta Mol Cell Biol Lipids (2009) 1791(10):975–82. doi: 10.1016/j.bbalip.2009.02.002
64. Gubern A, Casas J, Barcelo-Torns M, Barneda D, de la Rosa X, Masgrau R, et al. Group IVA phospholipase A2 is necessary for the biogenesis of lipid droplets. J Biol Chem (2008) 283(41):27369–82. doi: 10.1074/jbc.M800696200
65. Gijon MA, Riekhof WR, Zarini S, Murphy RC, Voelker DR. Lysophospholipid acyltransferases and arachidonate recycling in human neutrophils. J Biol Chem (2008) 283(44):30235–45. doi: 10.1074/jbc.M806194200
66. Heyckendorf J, Georghiou SB, Frahm N, Heinrich N, Kontsevaya I, Reimann M, et al. Tuberculosis treatment monitoring and outcome measures: new interest and new strategies. Clin Microbiol Rev (2022) 35(3):e0022721. doi: 10.1128/cmr.00227-21
67. Warsinske HC, Rao AM, Moreira FMF, Santos PCP, Liu AB, Scott M, et al. Assessment of validity of a blood-based 3-gene signature score for progression and diagnosis of tuberculosis, disease severity, and treatment response. JAMA Netw Open (2018) 1(6):e183779. doi: 10.1001/jamanetworkopen.2018.3779
68. Hoang LT, Jain P, Pillay TD, Tolosa-Wright M, Niazi U, Takwoingi Y, et al. Transcriptomic signatures for diagnosing tuberculosis in clinical practice: a prospective, multicentre cohort study. Lancet Infect Dis (2021) 21(3):366–75. doi: 10.1016/S1473-3099(20)30928-2
69. Cliff JM, Kaufmann SH, McShane H, van Helden P, O'Garra A. The human immune response to tuberculosis and its treatment: a view from the blood. Immunol Rev (2015) 264(1):88–102. doi: 10.1111/imr.12269
70. Maertzdorf J, Kaufmann SH, Weiner J 3rd. Toward a unified biosignature for tuberculosis. Cold Spring Harb Perspect Med (2014) 5(1):a018531. doi: 10.1101/cshperspect.a018531
71. Cadena AM, Fortune SM, Flynn JL. Heterogeneity in tuberculosis. Nat Rev Immunol (2017) 17(11):691–702. doi: 10.1038/nri.2017.69
72. Vargas R, Abbott L, Frahm N, Yu W-H. Common gene signature model discovery and systematic validation for TB prognosis and response to treatment. bioRxiv (2022) 2022:11.28.518302. doi: 10.1101/2022.11.28.518302
73. Wang X, VanValkenberg A, Odom-Mabey AR, Ellner JJ, Hochberg NS, Salgame P, et al. Comparison of gene set scoring methods for reproducible evaluation of multiple tuberculosis gene signatures. bioRxiv (2023) 2023:1.19.520627. doi: 10.1101/2023.01.19.520627
74. Gavin AL, Huang D, Huber C, Martensson A, Tardif V, Skog PD, et al. PLD3 and PLD4 are single-stranded acid exonucleases that regulate endosomal nucleic-acid sensing. Nat Immunol (2018) 19(9):942–53. doi: 10.1038/s41590-018-0179-y
75. Sadhu L, Tsopoulidis N, Hasanuzzaman M, Laketa V, Way M, Fackler OT. ARPC5 isoforms and their regulation by calcium-calmodulin-N-WASP drive distinct Arp2/3-dependent actin remodeling events in CD4 T cells. Elife (2023) 12. doi: 10.7554/eLife.82450
76. Ming Y, Luo C, Ji B, Cheng J. ARPC5 acts as a potential prognostic biomarker that is associated with cell proliferation, migration and immune infiltrate in gliomas. BMC Cancer (2023) 23(1):937. doi: 10.1186/s12885-023-11433-w
77. Huang S, Sun L, Hou P, Liu K, Wu J. A comprehensively prognostic and immunological analysis of actin-related protein 2/3 complex subunit 5 in pan-cancer and identification in hepatocellular carcinoma. Front Immunol (2022) 13:944898. doi: 10.3389/fimmu.2022.944898
78. Zhao F, Ma J, Huang L, Deng Y, Li L, Zhou Y, et al. Comparative transcriptome analysis of PBMC from HIV patients pre- and post-antiretroviral therapy. Meta Gene (2017) 12:50–61. doi: 10.1016/j.mgene.2017.01.004
79. Suliman S, Thompson EG, Sutherland J, Weiner J 3rd, Ota MOC, Shankar S, et al. Four-gene pan-African blood signature predicts progression to tuberculosis. Am J Respir Crit Care Med (2018) 197(9):1198–208. doi: 10.1164/rccm.201711-2340OC
80. Cho Y, Park Y, Sim B, Kim J, Lee H, Cho S-N, et al. Identification of serum biomarkers for active pulmonary tuberculosis using a targeted metabolomics approach. Sci Rep (2020) 10(1):3825. doi: 10.1038/s41598-020-60669-0
81. Wen D, Cui J, Li P, Xiong Q, Chen G, Wu C. Syndecan-4 assists Mycobacterium tuberculosis entry into lung epithelial cells by regulating the Cdc42, N-WASP, and Arp2/3 signaling pathways. Microbes Infect (2022) 24(4):104931. doi: 10.1016/j.micinf.2022.104931
82. Sun J, Zhong X, Fu X, Miller H, Lee P, Yu B, et al. The actin regulators involved in the function and related diseases of lymphocytes. Front Immunol (2022) 13:799309. doi: 10.3389/fimmu.2022.799309
83. Wu YE, Zhang SW, Peng WG, Li KS, Li K, Jiang JK, et al. Changes in lymphocyte subsets in the peripheral blood of patients with active pulmonary tuberculosis. J Int Med Res (2009) 37(6):1742–9. doi: 10.1177/147323000903700610
84. Feng L, Li L, Liu Y, Qiao D, Li Q, Fu X, et al. B lymphocytes that migrate to tuberculous pleural fluid via the SDF-1/CXCR4 axis actively respond to antigens specific for Mycobacterium tuberculosis. Eur J Immunol (2011) 41(11):3261–9. doi: 10.1002/eji.201141625
85. Pan Y, Tang P, Cao J, Song Q, Zhu L, Ma S, et al. Lipid peroxidation aggravates anti-tuberculosis drug-induced liver injury: Evidence of ferroptosis induction. Biochem Biophys Res Commun (2020) 533(4):1512–8. doi: 10.1016/j.bbrc.2020.09.140
86. Kusner DJ, Hall CF, Schlesinger LS. Activation of phospholipase D is tightly coupled to the phagocytosis of Mycobacterium tuberculosis or opsonized zymosan by human macrophages. J Exp Med (1996) 184(2):585–95. doi: 10.1084/jem.184.2.585
87. Carranza C, Chavez-Galan L. Several routes to the same destination: inhibition of phagosome-lysosome fusion by mycobacterium tuberculosis. AJMS (2019) 357(3):184–94. doi: 10.1016/j.amjms.2018.12.003
88. Zhai W, Wu F, Zhang Y, Fu Y, Liu Z. The immune escape mechanisms of mycobacterium tuberculosis. Int J Mol Sci (2019) 20(2). doi: 10.3390/ijms20020340
89. Maphasa RE, Meyer M, Dube A. The macrophage response to mycobacterium tuberculosis and opportunities for autophagy inducing nanomedicines for tuberculosis therapy. Front Cell Infect Microbiol (2020) 10:618414. doi: 10.3389/fcimb.2020.618414
90. Kabuye D, Ndibalema A. Lysosomal acid lipase gene single nucleotide polymorphism and pulmonary tuberculosis susceptibility. Indian J Tuberc (2021) 68(2):179–85. doi: 10.1016/j.ijtb.2020.07.030
91. Mittal E, Skowyra ML, Uwase G, Tinaztepe E, Mehra A, Koster S, et al. Mycobacterium tuberculosis type VII secretion system effectors differentially impact the ESCRT endomembrane damage response. mBio (2018) 9(6):e01765–18. doi: 10.1128/mBio.01765-18
92. Xiao S, Zhou T, Pan J, Ma X, Shi G, Jiang B, et al. Identifying autophagy-related genes as potential targets for immunotherapy in tuberculosis. Int Immunopharmacol (2023) 118:109956. doi: 10.1016/j.intimp.2023.109956
93. Deretic V. Autophagy in tuberculosis. Cold Spring Harb Perspect Med (2014) 4(11):a018481. doi: 10.1101/cshperspect.a018481
94. Duan L, Gan H, Arm J, Remold HG. Cytosolic phospholipase A2 participates with TNF-alpha in the induction of apoptosis of human macrophages infected with Mycobacterium tuberculosis H37Ra. J Immunol (2001) 166(12):7469–76. doi: 10.4049/jimmunol.166.12.7469
95. Higgins AJ, Lees P. The acute inflammatory process, arachidonic acid metabolism and the mode of action of anti-inflammatory drugs. Equine Vet J (1984) 16(3):163–75. doi: 10.1111/j.2042-3306.1984.tb01893.x
96. Bafica A, Scanga CA, Serhan C, MaChado F, White S, Sher A, et al. Host control of Mycobacterium tuberculosis is regulated by 5-lipoxygenase-dependent lipoxin production. J Clin Invest (2005) 115(6):1601–6. doi: 10.1172/JCI23949
97. Tobin DM, Roca FJ, Oh SF, McFarland R, Vickery TW, Ray JP, et al. Host genotype-specific therapies can optimize the inflammatory response to mycobacterial infections. Cell (2012) 148(3):434–46. doi: 10.1016/j.cell.2011.12.023
98. Mayer-Barber KD, Andrade BB, Oland SD, Amaral EP, Barber DL, Gonzales J, et al. Host-directed therapy of tuberculosis based on interleukin-1 and type I interferon crosstalk. Nature (2014) 511(7507):99–103. doi: 10.1038/nature13489
Keywords: tuberculosis, lipid-related gene, transcriptomic biomarker, treatment monitoring, differential diagnosis
Citation: Phat NK, Tien NTN, Anh NK, Yen NTH, Lee YA, Trinh HKT, Le K-M, Ahn S, Cho Y-S, Park S, Kim D H, Long NP and Shin J-G (2023) Alterations of lipid-related genes during anti-tuberculosis treatment: insights into host immune responses and potential transcriptional biomarkers. Front. Immunol. 14:1210372. doi: 10.3389/fimmu.2023.1210372
Received: 22 April 2023; Accepted: 18 October 2023;
Published: 31 October 2023.
Edited by:
Jianping Xie, Southwest University, ChinaReviewed by:
Kayvan Zainabadi, NewYork-Presbyterian, United StatesLanbo Shi, Rutgers University, Newark, United States
Yifan Bao, Johnson & Johnson, United States
Copyright © 2023 Phat, Tien, Anh, Yen, Lee, Trinh, Le, Ahn, Cho, Park, Kim, Long and Shin. This is an open-access article distributed under the terms of the Creative Commons Attribution License (CC BY). The use, distribution or reproduction in other forums is permitted, provided the original author(s) and the copyright owner(s) are credited and that the original publication in this journal is cited, in accordance with accepted academic practice. No use, distribution or reproduction is permitted which does not comply with these terms.
*Correspondence: Jae-Gook Shin, phshinjg@inje.ac.kr; Nguyen Phuoc Long, phuoclong@inje.ac.kr