 Jessica Ramadhin
 Vanessa Silva-Moraes1
 Donald Harn
- 1Department of Infectious Diseases, University of Georgia, Athens, GA, United States
- 2Department of Pathology, University of Georgia, Athens, GA, United States
- 3Department of Chemistry-BMC, Uppsala University, Uppsala, Sweden
Obesity is the largest risk factor for the development of chronic diseases in industrialized countries. Excessive fat accumulation triggers a state of chronic low-grade inflammation to the detriment of numerous organs. To address this problem, our lab has been examining the anti-inflammatory mechanisms of two human milk oligosaccharides (HMOs), lacto-N-fucopentaose III (LNFPIII) and lacto-N-neotetraose (LNnT). LNFPIII and LNnT are HMOs that differ in structure via presence/absence of an α1,3-linked fucose. We utilize LNFPIII and LNnT in conjugate form, where 10-12 molecules of LNFPIII or LNnT are conjugated to a 40 kDa dextran carrier (P3DEX/NTDEX). Previous studies from our lab have shown that LNFPIII conjugates are anti-inflammatory, act on multiple cell types, and are therapeutic in a wide range of murine inflammatory disease models. The α1,3-linked fucose residue on LNFPIII makes it difficult and more expensive to synthesize. Therefore, we asked if LNnT conjugates induced similar therapeutic effects to LNFPIII. Herein, we compare the therapeutic effects of P3DEX and NTDEX in a model of diet-induced obesity (DIO). Male C57BL/6 mice were placed on a high-fat diet for six weeks and then injected twice per week for eight weeks with 25µg of 40 kDa dextran (DEX; vehicle control), P3DEX, or NTDEX. We found that treatment with P3DEX, but not NTDEX, led to reductions in body weight, adipose tissue (AT) weights, and fasting blood glucose levels. Mice treated with P3DEX also demonstrated improvements in glucose homeostasis and insulin tolerance. Treatment with P3DEX or NTDEX also induced different profiles of serum chemokines, cytokines, adipokines, and incretin hormones, with P3DEX notably reducing circulating levels of leptin and resistin. P3DEX also reduced WAT inflammation and hepatic lipid accumulation, whereas NTDEX seemed to worsen these parameters. These results suggest that the small structural difference between P3DEX and NTDEX has significant effects on the conjugates’ therapeutic abilities. Future work will focus on identifying the receptors for these conjugates and delineating the mechanisms by which P3DEX and NTDEX exert their effects.
Introduction
Obesity and related metabolic syndrome (MS) pose major medical risks to those afflicted, often worsening outcomes to infectious diseases (i.e., COVID-19) or leading to type 2 diabetes mellitus (T2DM), cardiovascular disease, fatty liver disease, stroke, and cancer. As of 2017-2018, the age-adjusted prevalence of obesity was estimated to be 42.4%. This is an 11.9% increase from 1999-2000, suggesting that the epidemic of being obese is worsening as time progresses (1). Obesity is defined as having a body-mass index (BMI) ≥ 30 kg/m2, but this measure is insufficient when used as a sole indicator for classification (2). MS is defined as having at least three of the following criteria: waist circumference >102cm for males; >88cm for women, elevated blood glucose levels >100mg/dL, decreased HDL cholesterol <50mg/dL for males; <40mg/dL for females, elevated triglycerides >150mg/dL, or elevated blood pressure >130/85 (3). The International Diabetes Foundation (IDF) has also suggested inclusion of additional criteria, such as elevated circulating levels of CRP, TNFα, IL-6 (4, 5). Once an individual is diagnosed with MS, his/her risk of serious disease is heightened.
Metabolic inflammation is a sustained, low-grade immune response that occurs as consequence of excess nutrient consumption and has been identified as the nexus between the obese state and serious complications. Within adipose tissue (AT) depots, adipocytes (fat cells) expand in number (hyperplasia) and size (hypertrophy) to store lipids and prevent lipotoxic build-up in peripheral organs (i.e. liver, pancreas, skeletal muscle, etc.) (6–11). This protective effect subsides, however, once adipocytes encounter mechanical stress and hypoxic conditions as a result of overexpansion (12–14). This leads to an increase in detrimental adipokines, chemokines, and cytokines, a decrease in anti-inflammatory or insulin-sensitizing factors, immune cell infiltration, and insulin resistance (IR) (15–20). In this regard, targeting altered signaling or cellular composition of obese AT might have therapeutic potential for those with MS.
We have been examining the mechanisms and biological effects of two human milk oligosaccharides (HMOs), lacto-N-fucopentaose III (LNFPIII) and lacto-N-neotetraose (LNnT). HMOs are the third most abundant component of human milk and provide numerous protective benefits to the breastfeeding infant (i.e. providing nutrients, training the immune system, preventing infection, establishing the microbiome, etc.) (21, 22). LNFPIII and LNnT differ in structure via the presence/absence of an α1,3-linked fucose residue. Due to the α1,3-linked fucose residue, LNFPIII is difficult to produce via chemical or enzymatic methods. LNnT has been synthesized by various laboratories and is present at higher concentrations (0.74 g/L vs. 0.33 g/L) in human milk (23–26). Glycom A/S has registered LNnT for use in infant formula in Europe (Novel Food Application 157) and the United States (GRAS Notice 659) (6). Pre-clinical assessment has been conducted on a chemically synthesized version of LNnT and there were no adverse effects at doses of up to 5000mg/kg/day in rats (26). Oral supplementation with LNnT has also been shown to be well-tolerated in humans (27).
LNnT is easier to synthesize and has been shown to be well-tolerated in humans, therefore we asked if the small structural difference between LNFPIII and LNnT impacts the conjugates’ therapeutic effect in DIO mice. LNFPIII conjugates (P3DEX) and LNnT conjugates (NTDEX) are composed of 10-12 molecules of LNFPIII or LNnT attached to a 40 kDa dextran carrier via an acetylphenylenediamine (APD) linker. Previous studies have shown that therapeutic intervention with LNFPIII-Dex (25µg/dose) in diet-induced obese (DIO) mice twice per week for four weeks led to improved metabolic homeostasis and increased concentrations of circulating IL-10. Of note, P3DEX treatment improved glucose and insulin tolerance, as well as enhanced insulin signaling in WAT. This was shown via increased expression of insulin receptor β (insrb), insulin receptor substrate 2 (irs2), CCAAT/enhancer-binding protein α (cebpa), and glucose transporter 4 (glut4). P3DEX treatment also decreased macrophage infiltration and crown-like structures in WAT. This coincided with decreased expression of tumor-necrosis factor α (tnfa), caspase-1 (casp1), NLR family pyrin domain containing 3 (nlrp3), interleukin-18 (il18), and interleukin-1β (il1b). In addition to restoring metabolic homeostasis and ameliorating insulin resistance, LNFPIII-Dex treatment also decreased lipogenic genes (fas, acc1/2, scd1, and srebp1c) and fat accumulation in the liver (28).
We report here that treatment with P3DEX, but not NTDEX, decreases total weight gain, reduces AT, improves glucose tolerance, and ameliorates insulin resistance. P3DEX and NTDEX exert wide-ranging effects on circulating chemokines, cytokines, adipokines, and incretin hormones when compared to DIO control mice treated with the 40 kDa dextran (DEX) carrier. Most striking, P3DEX, but not NTDEX, reduces WAT inflammation and hepatic lipid accumulation. This suggests that the slight structural difference between P3DEX and NTDEX alters the conjugates therapeutic abilities and exemplifies the differential roles that individual HMOs might execute in vivo.
Materials and Methods
Preparation of HMO Conjugates
LNFPIII was synthesized by Dr. Peng George Wang (Georgia State University, Atlanta, GA) (23, 29). LNnT was synthesized by Neose Technologies, Inc. LNFPIII (MW: 853.877 g/mol) and LNnT (MW: 707.60 g/mol) were sent to Dr. Thomas Norberg (Uppsala University, Uppsala, Sweden) for conjugation to aminodextran (DEX, 40 kDa average Mw, from Invitrogen, prod # D1861) using APD linker-spacers. On average, conjugates had 10-12 LNFPIII or LNnT monomers per 40 kDa dextran carrier. LNFPIII accounts for ~17-20% of the molecular weight of the P3DEX conjugate. LNnT accounts for ~15-17% of the molecular weight of the NTDEX conjugate.
Animal Experiments
6 to 8-week old male C57BL/6 mice were purchased from The Jackson Laboratory and maintained on a 12h light/dark cycle in the University of Georgia’s AALAC-accredited College of Veterinary Medicine Animal Resources Facility with food and water available ad libitum. After one week of acclimation, mice were housed n=3/cage and placed on a high-fat diet (HFD: Bio-Serv Cat. No. F3282) as described in Bhargava et al. (28). Given that the HFD is subject to spoilage, food was replenished 3 times per week. After 6 weeks of HFD, mice were divided into 3 cohorts and injected twice per week for 8 weeks via the intraperitoneal route with 25µg of 40 kDa dextran (DEX), LNFPIII conjugated to 40 kDa dextran (P3DEX), or LNnT conjugated to 40 kDa dextran (NTDEX). An experimental timeline is shown in Figure 1A. DEX, P3DEX, and NTDEX were dissolved in 0.9% NaCl prior to injection in a volume of 200µL. Experiments were performed in two independent mouse cohorts (n=6-8/group). Metabolic studies (GTT/ITT) were performed after 4 weeks of treatment with a 2-week rest period between in vivo assays. We performed a glucose tolerance test (GTT) at W10 of the experiment and an insulin tolerance test (ITT) at W12 (described below). Body weights were measured once/week and fasting blood glucose levels were measured prior to start of HFD (W0), pre-treatment (W6), and post-treatment (W14). Mice were euthanized at the end of W14 via CO2 asphyxiation followed by cervical dislocation after a 6h fast. Organs and serum samples were collected and stored at -80°C until use.
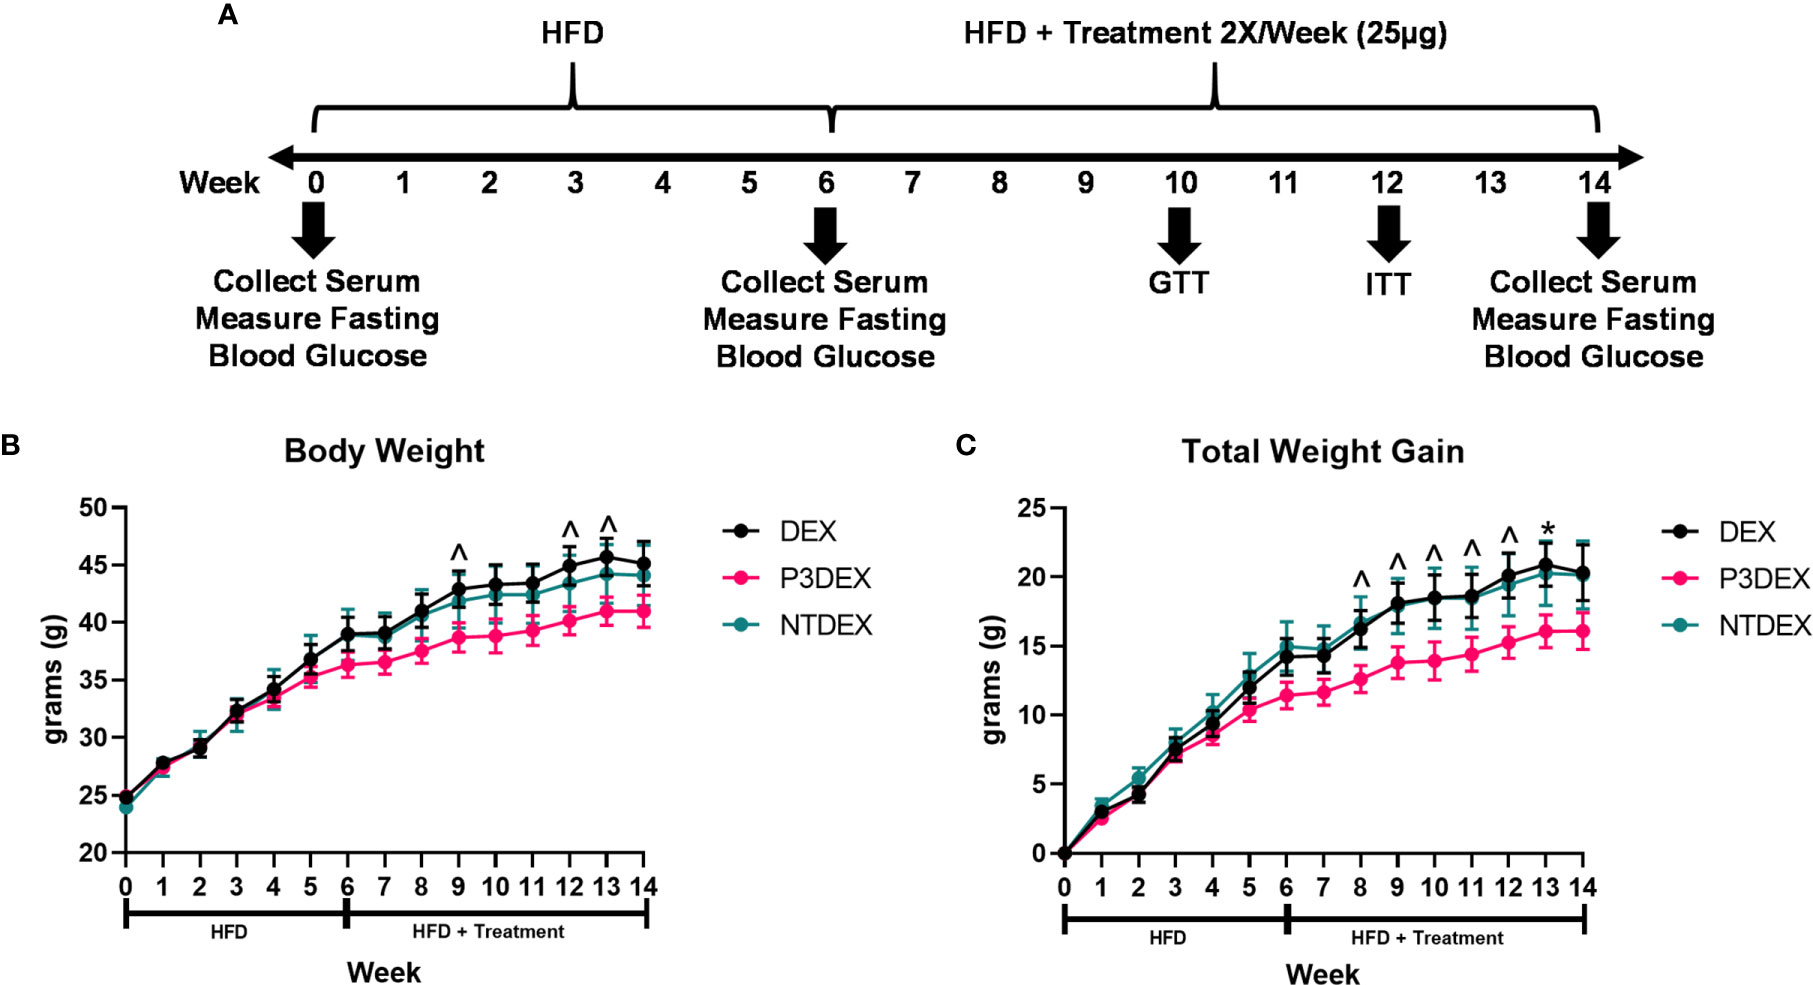
Figure 1 LNFPIII conjugates reduce total body and organ weights. (A) Experimental design. Male C57BL/6 mice were placed on HFD for 6 weeks prior to intervention twice per week with 25μg DEX, P3DEX, or NTDEX. (B, C) P3DEX reduces total body weight and weight gain. Two-way ANOVA with Dunnett’s Multiple Comparisons Test. (D–F) P3DEX reduces scWAT and WAT, but not BAT. (G–J) P3DEX and NTDEX have no effect on liver, heart, spleen, and kidney weights. One-way ANOVA with Dunnett’s Multiple Comparisons Test. *indicates a significant difference between DEX and P3DEX (p ≤ 0.05). ^indicates a trend between DEX and P3DEX (p ≤ 0.10).
Measurement of Body and Organ Weights
Mice were placed in a clean plastic container on a tared compact scale (Ohaus, Cat. No. CS200) to acquire body weight measurements (in grams). Body weights were recorded each week on Monday afternoon to minimize daily fluctuations. Body weights were recorded to the nearest hundredth. At sacrifice, organs (i.e. heart, spleen, liver, kidney, AT) were placed on clean Fisherbrand™ Polystyrene Antistatic Weighing Dishes (Fisher Scientific, Cat. No. 08-732-112) on a tared analytical scale (Sartorius, Cat. No. TE313S) for measurement. Organ weights were recorded to the nearest thousandth.
Glucose Tolerance Test (GTT)
A glucose tolerance test (GTT) were performed after 4 weeks of treatment (W10), according to Beguinot & Nigro with some modifications (24). Mice were fasted for 6h to obtain baseline blood measurements. Various fasting periods have been utilized in published studies involving GTTs and ITTs, but 6h fasts appear to be more physiological than longer 14-16h fasts. Previous studies have shown that prolonged fasting in mice results in increased insulin sensitivity, whereas fasting in humans leads to inhibition of insulin-stimulated glucose uptake (25, 26). Moreover, prolonged fasting in mice may lead to a state of starvation (30). To ensure translatable results, we utilized a 6h fasting period in our experiments. During GTTs, blood was acquired via tail snip and measured using a Bayer Contour® Next blood glucose monitoring system (Bayer, Parsippany, NJ). Basal glucose measurements were taken before mice were administered 2g glucose/kg (Sigma, Cat. No. G8270) in 10µL/g body weight via oral gavage. Thereafter, blood glucose measurements were taken at 15, 30, 60, 90, 120, 150, and 180-minute timepoints.
Insulin Tolerance Test (ITT)
An insulin tolerance test (ITT) was performed after 6 weeks of treatment (W12) to allow for a 2-week rest period between metabolic tests. The ITT was also performed according to Beguinot & Nigro with the aforementioned fasting modification (24). During the ITT, mice were fasted for 6h prior to baseline blood glucose measurements and intraperitoneal injection of 0.5IU/kg insulin (Humulin® R U-100, Lilly, Cat. No. HI-210) diluted in 0.9% NaCl in an injection volume of 3.6µL/g body weight. Thereafter, blood glucose measurements were taken at 15, 30, 60, and 90-minute timepoints. If blood glucose levels dropped below 36mg/dL, mice were rescued via injection of 20% aqueous glucose solution (Sigma, Cat. No. G8270).
Serum Evaluation of Adipokines, Chemokines, and Cytokines
The Bio-Plex Pro Mouse Cytokine 23-Plex Assay (Bio-Rad, Cat. No. M60009RDPD) and the Bio-Plex Pro Mouse Diabetes 8-Plex Assay (Bio-Rad, Cat. No. 171F7001M) were performed in multi-plex, according to Bio-Rad’s Technical Note 5975. These two panels can be performed via multiplex without altering assay sensitivity, specificity, and accuracy. Serum samples collected at sacrifice after a 6h fast and frozen at -80°C were prepared according to manufacturer’s instructions. Adipokines, chemokines, and cytokines were detected and quantified using the Bio-Rad Bio-Plex® 200 System, available at UGA’s Cytometry Shared Resource Laboratory.
Histopathology
WAT and liver samples were preserved in 10% formalin and processed, sectioned, and stained with hematoxylin & eosin (H&E) by the Comparative Pathology Lab in the College of Veterinary Medicine at the University of Georgia. Dr. Tamas Nagy, a board-certified pathologist, then assessed inflammation with WAT sections and lipid accumulation in the liver.
Measurement of ALT and AST
Liver function was assessed via measurement of alanine aminotransferase (AST) and aspartate aminotransferase (ALT). ALT was measured in serum using the Alanine Aminotransferase (ALT or SGPT) Activity Colorimeteric/Fluorometric Assay Kit (Biovision, Cat. No. K752), according to manufacturer’s instructions. AST was measured in serum using the Aspartate Aminotransferase (AST or SGOT) Activity Colorimetric Assay Kit (Biovision, Cat. No K753), according to manufacturer’s instructions. Absorbance was measured using the SPECTROstar Nano Microplate Reader (BMG Labtech).
Statistical Analysis
Statistics were performed using One-Way or Two-Way ANOVA with Dunnett’s Multiple Comparisons Tests in GraphPad Prism 8. * or ** was used to indicate significance (*p<0.05 or **p<0.01). ^ was used to indicate a trend (^p<0.10). Values are presented as mean ± SEM. Experiments were repeated twice for a total n=12-14 per treatment group.
Results
LNFPIII Conjugates Reduce Total Body and Organ Weights
Male C57BL/6 mice were placed on HFD for 6 weeks (W0-6) prior to beginning treatment twice per week with 25ug DEX, P3DEX, or NTDEX (W7-14) via the intraperitoneal route. Body weight was monitored weekly throughout the duration of the experiment (W0-W14). An experimental timeline is shown in Figure 1A. Mice treated with P3DEX weighed less overall than mice treated with the DEX carrier control or NTDEX (Figure 1B). Compared to DEX, P3DEX treatment reduced total body weight. This reduction trended towards significance (Two-Way ANOVA with Dunnett’s Multiple Comparisons Test; ^<0.10) at W9, 12, and 13. While it appears that the DIO mice treated with P3DEX begin to show lessened body weight and reduced total weight gain at W5 and W6 of the experiment, the difference is neither trending, nor significant at these timepoints. In Figure 1B, statistical analysis performed at W5 between DEX and P3DEX resulted in a non-trending or non-significant p-value of 0.5482 (One-Way ANOVA with Dunnett’s Multiple Comparisons Test, *p<0.05, ^p<0.10). At W6, the p-value for the statistical test performed between DEX and P3DEX was equal to 0.2719 (One-Way ANOVA with Dunnett’s Multiple Comparisons Test, ^p<0.10, *p<0.05). Treatment with NTDEX did not cause a significant reduction in total body weight at any point of measurement. Furthermore, there was no significant difference in total body weight between the 3 groups prior to treatment. When normalizing the body weights and examining total weight gain over time, it is clear that P3DEX treatment led to a reduction in total weight gain when compared to DEX-treated animals (Figure 1B). This trended toward significance at W8, 9, 10, 11, and 12 (Two-Way ANOVA with Dunnett’s Multiple Comparisons Test; *<0.05, ^p<0.10), and became significant at W13 (Two-Way ANOVA with Dunnett’s Multiple Comparisons Test; *p<0.05, ^p<0.10). When we normalized the body weight in Figure 1C, the difference between DEX and P3DEX remained non-trending and non-significant at W5 and W6, with a p-value of 0.4307 and 0.1891, respectively (One-Way ANOVA with Dunnett’s Multiple Comparisons Test, *p<0.05, p<0.10). For these reasons, we are confident that the trending and significant differences we observe at later timepoints are divergent and a result of P3DEX intervention. Again, treatment with NTDEX did not cause a significant reduction in total weight gain at any point of measurement and nearly mirrors the DEX control.
At sacrifice (W14), we collected and weighed subcutaneous (scWAT), visceral (VAT), and brown (BAT) adipose tissue, as well as livers, hearts, spleens, and kidneys. Figure 1D demonstrates that we saw a trend towards reduction of scWAT in P3DEX-treated mice compared to those treated with DEX (One-Way ANOVA with Dunnett’s Multiple Comparisons Test; *p<0.05, ^p<0.10). We saw no effect of NTDEX on scWAT compared to DEX. In terms of vWAT, we noted a significant reduction in P3DEX-treated mice compared to those treated with DEX (Figure 1E). We observed no differences in BAT between groups, but this is a smaller AT depot (Figure 1F). We did not observe a significant difference in liver, heart, spleen, or kidney weights (Figures 1G–J).
LNFPIII Conjugates Improve Glucose Tolerance and Reduce Insulin Resistance
We measured 6h-fasting blood glucose levels prior to HFD (W0), prior to treatment (W6), and prior to sacrifice (W14). Prior to HFD (W0), the average fasting blood glucose for all male mice was within normal range (88.5-154.9 mg/dL) (31). This was elevated prior to treatment (W6), demonstrating that the HFD induced metabolic dysfunction. Prior to sacrifice and post-treatment, mice treated with P3DEX had significantly lower fasting blood glucose levels (Figure 2A) than those treated with DEX. NTDEX treatment did not result in reductions in fasting blood glucose levels compared to those treated with DEX. When administered an oral gavage of 2g glucose/kg body weight during a GTT, mice treated with P3DEX exhibited a less dramatic increase in blood glucose levels at the 15-minute timepoint compared to those treated with DEX or NTDEX. P3DEX-treated animals were able to return to basal blood glucose levels more quickly than DEX- or NTDEX-treated mice. Mice treated with P3DEX had significantly lower blood glucose levels throughout the duration of the GTT and this was significant at 30, 60, 90, 120, 150, and 180 minutes (Figure 2B). When given an intraperitoneal injection of 0.5IU/kg body weight insulin, mice treated with P3DEX exhibited a greater decrease in blood glucose levels overall compared to those treated with DEX or NTDEX. Mice treated with P3DEX had significantly lower blood glucose levels throughout the duration of the ITT and this trended towards significance at 15 minutes (Figure 2C). Blood glucose levels of P3DEX-treated mice was significantly lower than DEX-treated mice at the 30-minute timepoint (Figure 2C). Thereafter, blood glucose levels between groups appeared to stabilize. This shows that DIO mice treated with DEX or NTDEX were less responsive than mice treated with P3DEX when injected with a bolus of insulin, suggesting the presence of IR in the DEX and NTDEX groups.
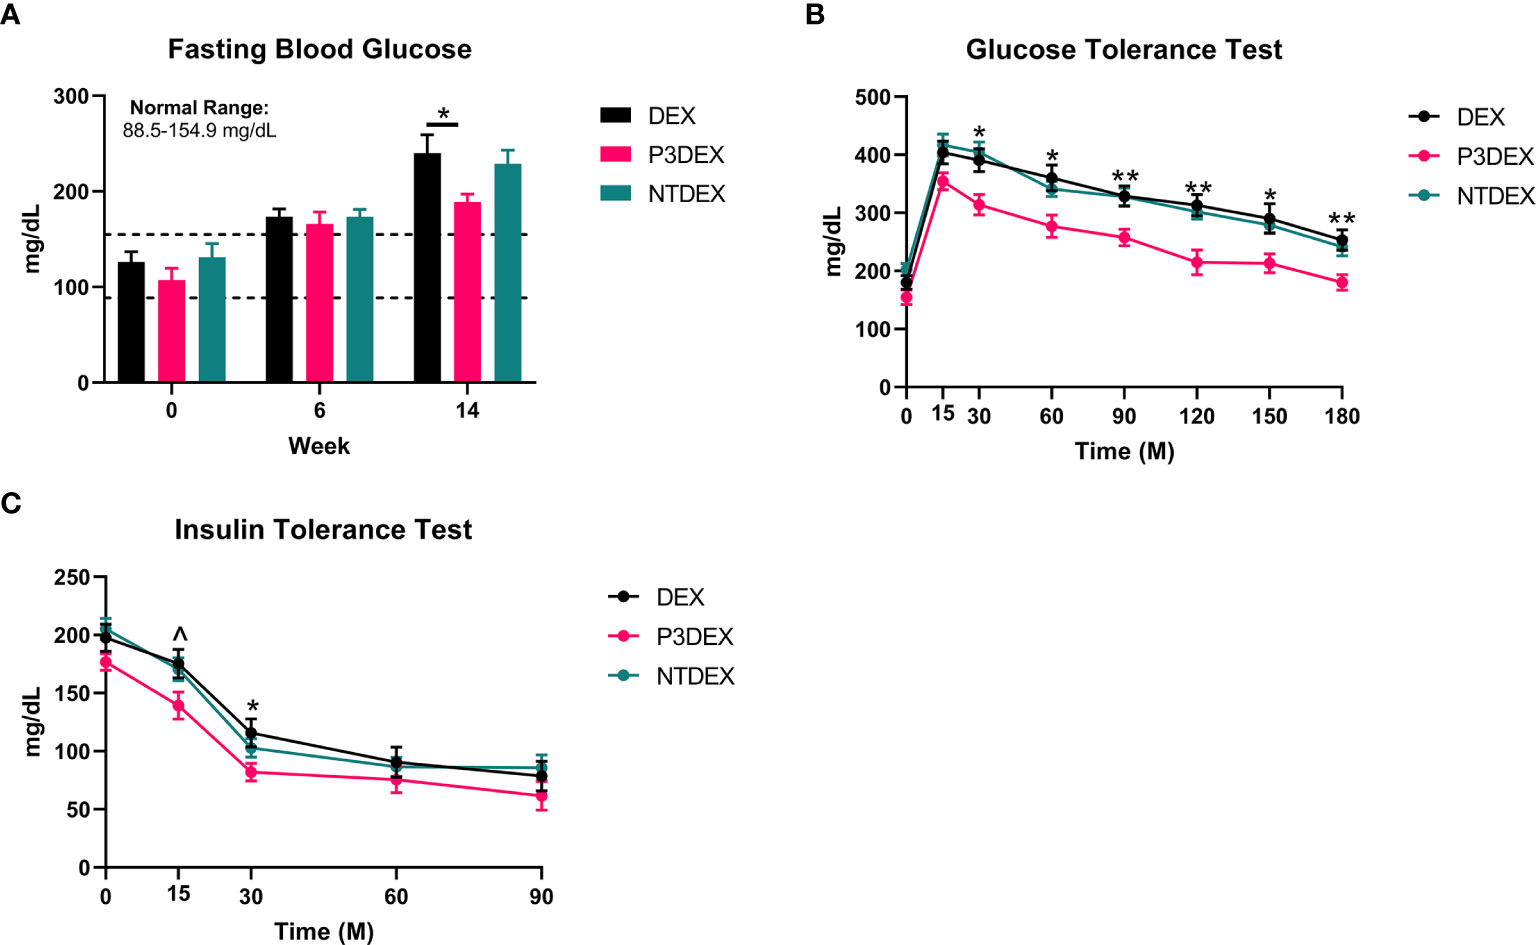
Figure 2 LNFPIII conjugates improve glucose homeostasis and reduce insulin resistance. (A) P3DEX reduces fasting blood glucose levels. (B) P3DEX improves glucose tolerance. (C) P3DEX improves insulin sensitivity. Two-way ANOVA with Dunnett’s Multiple Comparisons Test. *indicates a significant difference between DEX and P3DEX (p ≤ 0.05). ^indicates a trend between DEX and P3DEX (p ≤ 0.10). (**p ≤ 0.01).
LNFPIII and LNnT Conjugates Alter Hematopoietic Signals
Individuals diagnosed with MS are at higher risk of infection and illness, suggesting that the constant presence of low-grade inflammation exhausts and dampens the immune response to other pathogens or insults (32, 33). In order to maintain function, progenitor cells depend on nutrients and hematopoietic signals to proliferate and differentiate into diverse white blood cells (WBC) populations (34, 35). IL-3, for example, promotes proliferation of hematopoietic cells (34, 36). G-CSF and GM-CSF are then responsible for differentiation of cells into specific lineages (i.e. granulocytes and monocytes) and subsequent activation (34, 37). High levels of IL-3, G-CSF, or GM-CSF can lead to increased populations of WBCs, which can exacerbate inflammation and damage normal tissues. High WBC counts have been associated with parameters related to inflammation and well-documented in obese subjects (38–43).
We measured IL-3, C-CSF, and GM-CSF in serum samples collected from fasting DIO mice treated with DEX, P3DEX, or NTDEX. Serum from DIO mice treated with P3DEX or NTDEX trended towards decreased IL-3 levels compared to the DEX control (Figure 3A). G-CSF and GM-CSF were also slightly reduced, with the reduction in G-CSF becoming significant following NTDEX treatment (Figure 3A). These results suggest that both P3DEX and NTDEX have potential to dampen the excessive immune response associated with the obese state.
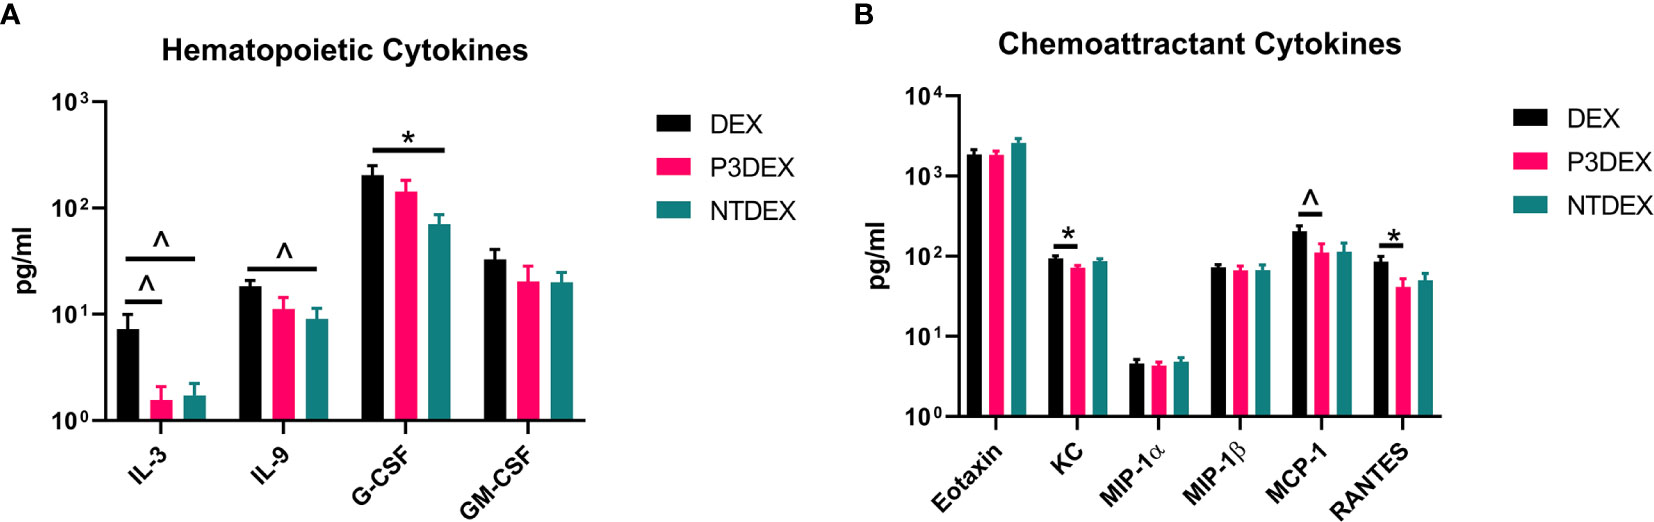
Figure 3 LNFPIII and LNnT conjugates alter hematopoietic and chemoattractant signals. Measurements of (A) hematopoietic and (B) chemoattractant cytokines are shown here in response to DEX, P3DEX, or NTDEX treatment. One-way ANOVA with Dunnett’s Multiple Comparisons Test. *indicates a significant difference (p ≤ 0.05). ^indicates a trend (p ≤ 0.10).
LNFPIII and LNnT Conjugates Alter Chemoattractant Signals
WBCs depend on chemoattractant signals for migration to injured sites. In the obese state, expansion of WAT enhances chemokine release and attracts WBCs to AT depots (44). This worsens metabolic inflammation and associated comorbidities.
We measured eotaxin/CCL11, KC/CXCL1, MCP-1/CCL2, MIP-1α/CCL3, MIP-1β/CCL4, and RANTES in serum samples collected from fasting DIO mice treated with DEX, P3DEX, or NTDEX. We saw no differences in circulating levels of eotaxin/CCL11, a chemokine known to attract eosinophils (Figure 3B). While circulating eotaxin/CCL11 is known to increase in the obese state, neither P3DEX, nor NTDEX altered these levels (45, 46). This makes sense as we have no evidence that either conjugate alters eosinophil function. KC/CXCL1 is a neutrophil chemoattractant that increases in patients with T2DM, as well as in diabetic-prone db/db mice with evidence of impact on pancreatic islet function (47–49). P3DEX treatment resulted in a significant decrease in serum KC/CXCL1 compared to the DEX control (Figure 3B). NTDEX treatment did not reduce serum KC/CXCL1, suggesting mechanistic differences between NTDEX and P3DEX conjugates. It is well-reported in the literature that P3DEX and NTDEX act on macrophages (50–54). MCP-1/CCL2 is instrumental for macrophage recruitment to AT depots and circulating concentrations are increased in the obese state (55). Furthermore, mice deficient in MCP-1 signaling exhibit lessened macrophage infiltration and inflammation in AT depots (56, 57). P3DEX treatment resulted in a significant decrease in serum MCP-1/CCL2 compared to the DEX control (Figure 3B). Although NTDEX also appeared to decrease circulating MCP-1/CCL2 levels, this decrease was not significant (Figure 3B). Neither P3DEX, nor NTDEX had an effect on MIP-1α/CCL3 or MIP-1β/CCL4 (Figure 3B). MIP-1α and MIP-1β are also elevated in genetic (ob/ob, db/db) and DIO mice, as well as obese humans (19, 58, 59). While MIP-1α and MIP-1β both increase in the obese state, there is evidence that they do not alter macrophage infiltration in AT. RANTES is responsible for T cell recruitment and is also increased in the obese state (58, 59). We noted a significant reduction in serum RANTES following P3DEX treatment (Figure 3B). NTDEX also appeared to reduce serum concentration of RANTES, but this was not significant (Figure 3B). Overall, these results demonstrate that P3DEX is more effective at decreasing circulating chemoattractant signals than NTDEX.
LNFPIII and LNnT Alter Cytokines Involved in Innate and Adaptive Immunity
Given their pleiotropic nature, cytokines are difficult to characterize in the context of DIO. We measured numerous innate and adaptive cytokines in serum samples collected from fasting DIO mice treated with DEX, P3DEX, or NTDEX. Once macrophages are recruited to AT depots, IFNγ secretion helps these cells maintain classical (M1) activation (60). Neither P3DEX, nor NTDEX, had a significant effect on circulating concentrations of IFNγ (Figure 4). P3DEX treatment led to a slight, nonsignificant, reduction in IL-1α (Figure 4). IL-1β was unaffected by P3DEX or NTDEX treatment (Figure 4). Both IL-1α and IL-1β are elevated in obese individuals with reductions documented following weight loss (61–63). IL-2, involved in T cell proliferation and activation, was lowered, but nonsignificant, in response to P3DEX and NTDEX (Figure 4). IL-4 trended towards reduction in P3DEX-treated mice and was significant for those treated with NTDEX (Figure 4). This reduction was unanticipated, given that both P3DEX and NTDEX promote TH2 responses and alternative activation (M2) of macrophages (51–54). P3DEX and NTDEX treatment also led to slight reductions in IL-5, another TH2 cytokine, which tends to help maintain homeostasis in WAT depots (Figure 4) (64). P3DEX did not impact circulating IL-6 levels, but NTDEX eliminated IL-6 compared to the DEX control (Figure 4). IL-9, a TH2 cytokine, trended toward decreased circulating levels in DIO mice treated with NTDEX (Figure 4) (65). Neither P3DEX, nor NTDEX treatment, had a significant effect on circulating IL-10 levels (Figure 4). While P3DEX and NTDEX did not impact levels of IL-12(p40), P3DEX treatment led to a significant reduction in IL-12(p70) (Figure 4). This reduction in the bioactive form of IL-12 suggests quelling of the TH1 immune response, which might contribute to P3DEX’s therapeutic effects (66). We observed no differences in serum IL-13, another TH2 cytokine that aids in overcoming insulin resistance (Figure 4) (67). IL-17a increased in response to P3DEX and NTDEX treatment, but this increase was not significant (Figure 4). Last, we observed a slight, but nonsignificant, reduction in TNFα in response to P3DEX and NTDEX treatment (Figure 4). Similar to other markers, circulating TNFα is elevated in obese individuals (17). Moreover, neutralization of TNFα led to improved insulin responses (15). Overall, P3DEX treatment seems to decrease circulating cytokine levels, both inflammatory and TH2-associated. While these cytokine responses are ambiguous when considered on their own, they are indispensable for delineating how P3DEX treatment reduces body weight and improves glucose homeostasis in vivo.
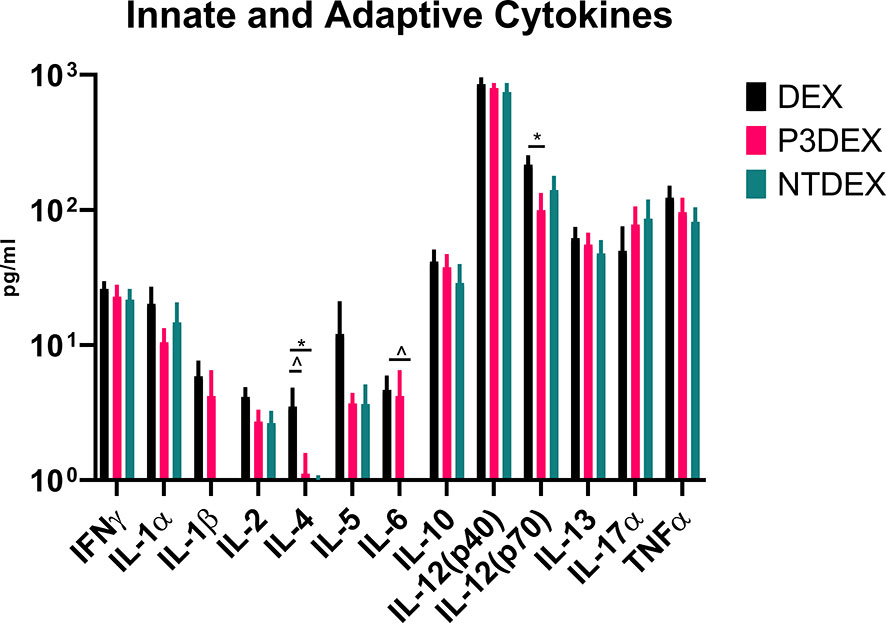
Figure 4 LNFPIII and LNnT conjugates alter innate and adaptive cytokines. Measurement of innate and adaptive cytokines are shown here in response to DEX, P3DEX, or NTDEX treatment. One-way ANOVA with Dunnett’s Multiple Comparisons Test. *indicates a significant difference (p ≤ 0.05). ^indicates a trend (p ≤ 0.10).
LNFPIII Conjugates Modulate Adipokine Secretion
Measurement of AT-specific markers (adipokines), rather than pleiotropic cytokines, might provide more insight on the therapeutic or non-therapeutic effects of P3DEX and NTDEX in the context of DIO. Ghrelin, for instance, is an orexigenic adipokine that stimulates food intake (68). Circulating levels of ghrelin are lower in the obese state and higher in those that are lean (69–71). Ghrelin also quells secretion of markers related to inflammation and inhibits NF-κB signaling (72, 73). Although we were unable to monitor food intake in our studies, we found that P3DEX treatment led to a slight, but nonsignificant, increase in ghrelin (Figure 5A). P3DEX treatment also led to a significant decrease in leptin, a hormone generated in AT in proportion to fat content (Figure 5A) (74). Circulating leptin concentrations coincide with reductions in AT (75, 76). Decreases in leptin also coincide with increases in orexigenic peptides (i.e. ghrelin), which might explain the slight increase shown in Figure 5A (77, 78). NTDEX treatment led to a trending reduction in circulating levels of resistin, while P3DEX treatment led to a significant decrease (Figure 5A). P3DEX treatment seems to have beneficial effects on specific adipokines (i.e. leptin and resistin), which corresponds with its effects on adipose tissue and glucose homeostasis.
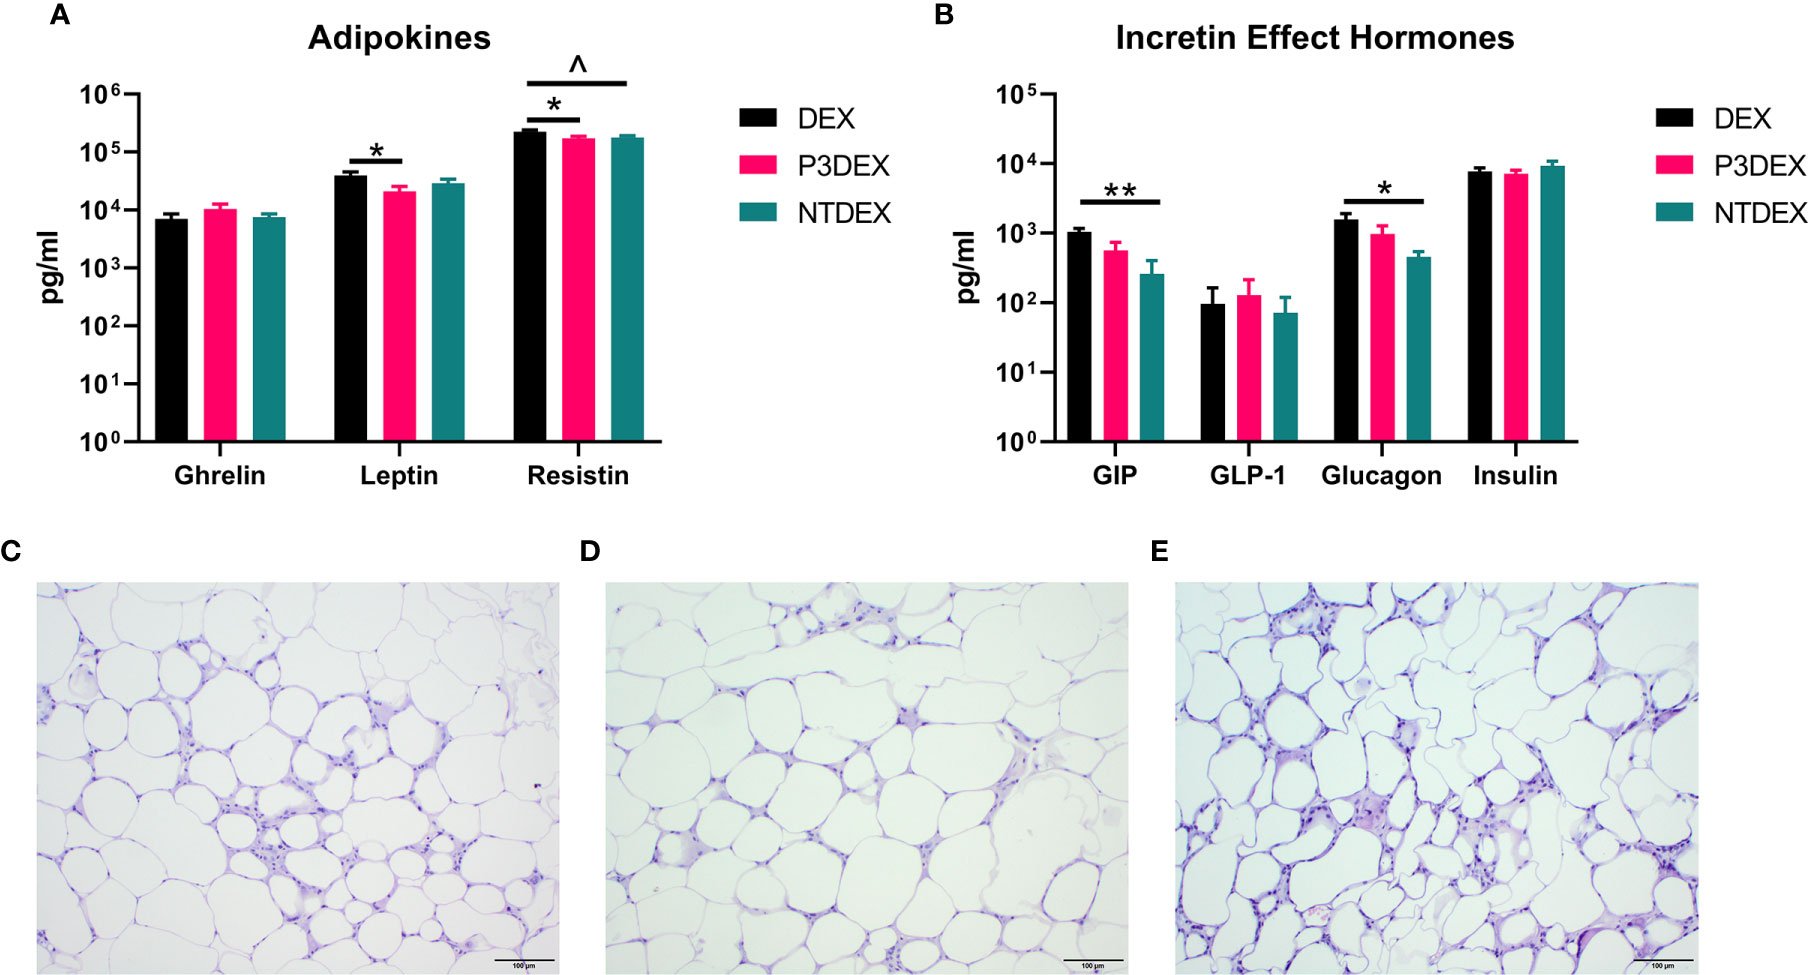
Figure 5 LNFPIII conjugates reduce adipokines and WAT inflammation, while LNnT conjugates alter incretin effect hormones. Measurement of (A) adipokines and (B) incretin effect hormones in DIO mice treated with DEX, P3DEX, or NTDEX. One-way ANOVA with Dunnett’s Multiple Comparisons Test. *indicates a significant difference (*p ≤ 0.05, **p ≤ 0.01). ^indicates a trend (p ≤ 0.10). Histological analysis of vWAT depots from DIO mice treated with (C) DEX, (D) P3DEX, or (E) NTDEX.
LNnT Conjugates Alter the Incretin Effect
During the incretin effect, glucose-dependent insulinotropic polypeptide (GIP) and glucagon-like peptide 1 (GLP-1) are released from the gut to stimulate insulin secretion in response to food intake (79). P3DEX and NTDEX reduced circulating levels of GIP, with the reduction induced via NTDEX being significant (Figure 5B). In pancreatic islets, decreases in GIP correspond with decreases in insulin and glucagon secretion (80). Both P3DEX and NTDEX did not have an effect on GLP-1, another incretin hormone (Figure 5B). P3DEX treatment led to a slight reduction in glucagon and NTDEX treatment led to a significant reduction (Figure 5B). NTDEX treatment led to a significant reduction in GIP, which aligns with the corresponding decrease in glucagon. We observed a trending increase in the ratio of insulin to glucagon in response to NTDEX treatment, an indicator of excess nutrient load (Figure 5B) (81). We conclude here that P3DEX treatment has beneficial effects on specific adipokines (i.e. ghrelin, leptin, and resistin), while NTDEX might impact incretin hormones and postprandial insulin release. These findings further support that these two HMO conjugates differ in terms of mechanism and therapeutic potential.
LNFPIII Conjugates Reduce WAT Inflammation and Hepatic Lipid Accumulation
We report various in vivo changes in response to both P3DEX and NTDEX. Upon examination of vWAT tissue, we observed what appeared to decreased immune cell infiltrate and crown-like structures in DIO mice treated with P3DEX compared to DEX and NTDEX (Figures 5C–E). DIO mice treated with NTDEX exhibited greater inflammation within vWAT even when compared to the DEX control (Figure 5E). In the liver, we observed significant lipid accumulation in DIO mice treated with the DEX control (Figure 6A). In contrast, we observed reduced lipid accumulation in the livers of DIO mice treated with P3DEX (Figure 6B). DIO mice treated with NTDEX showed greater lipid accumulation than the DEX control, suggesting a worsening of MS (Figure 6C). This was corroborated by the increased ratio of aspartate aminotransferase (AST) to alanine aminotransferase (ALT) detected in the serum of DIO mice treated with NTDEX (Figure 6D). At the tissue level, it is clear that NTDEX does not induce the same therapeutic benefit as P3DEX.
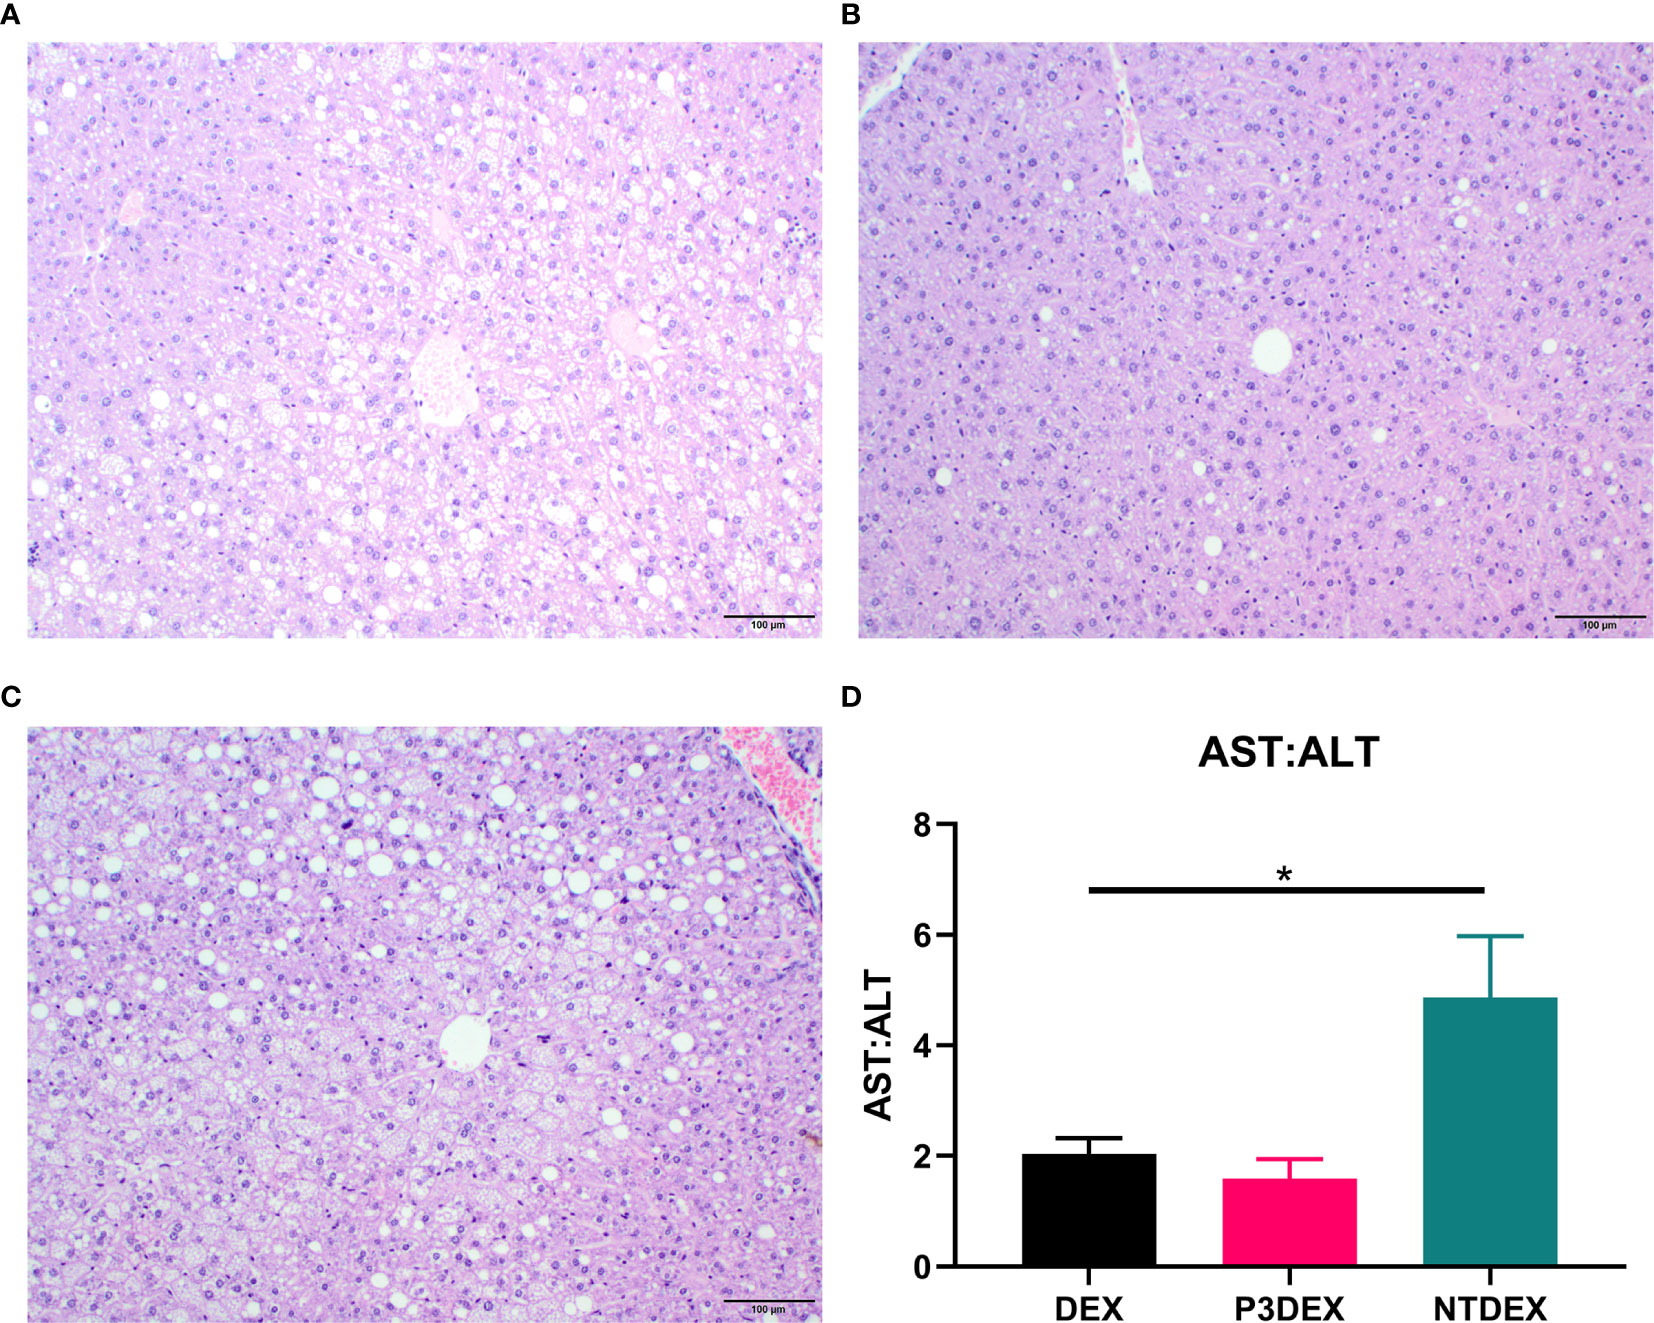
Figure 6 LNFPIII conjugates reduce hepatic lipid accumulation and liver damage. Liver sections from DIO mice treated with (A) DEX, (B) P3DEX, or (C) NTDEX. (D) Ratio of circulating AST:ALT. One-way ANOVA with Dunnett’s Multiple Comparisons Test. *indicates a significant difference (p ≤ 0.05).
Discussion
Although LNFPIII and LNnT differ only by the presence or absence of an α1,3-linked fucose in their structures, their therapeutic effects in a DIO model differ significantly in vivo. In general, HMOs present in human breastmilk are known to block infection, modulate the immune response, shape the intestinal microbiome, and serve as nutrients for brain development (22, 82). However, the effects of specific groups of HMOs (nonfucosylated neutral HMOs, fucosylated HMOs, and sialylated HMOs) or individual HMOs themselves have not been thoroughly studied. 2’-fucosyllactose (2’FL; fucosylated) and LNnT (neutral) are the two most abundant and well-studied HMOs to date [Ref]. 2’FL has been reported at ~2.74g/L in secretor mothers, while LNnT has been reported at ~0.74g/L (21). Both HMOs have been purified from human breastmilk and/or synthesized at industrial levels for supplementation in infant formula (23, 29, 83–85). LNFPIII, in contrast, is less abundant (~0.33g/L) and expensive to acquire from purified human breastmilk (21). It has also not been synthesized via chemical or enzymatic methods at an industrial level. To determine if LNnT would function in vivo similar to LNFPIII, we initiated studies to compare the therapeutic effects of LNFPIII conjugates to LNnT conjugates in a murine model of DIO.
Previous studies demonstrate both LNFPIII and LNnT conjugates promote M2 macrophage polarization, an immune process that has been deemed important for regulating and ameliorating adipose tissue inflammation and treating T2DM (51, 52, 86, 87). Several anti-diabetic drugs on the market, such as metformin and several thiazolidinediones target insulin resistance in part via altering M1/M2 macrophage polarization and reducing inflammation within WAT (88, 89). Bhargava et al. (2012) demonstrated that LNFPIII conjugates improve glucose tolerance and insulin resistance, as well as reduce WAT inflammation and ameliorate non-alcoholic hepatosteatosis in a similar model of DIO (28). We expand on these studies herein, demonstrating that DIO mice treated with LNFPIII conjugates (P3DEX) exhibit reductions in total weight gain and subcutaneous/visceral AT (Figures 1B–E). Reductions in total weight gain and subcutaneous/visceral AT depots were not reported in Bhargava et al. (2012), but it is important to note the difference in treatment duration between the two studies. In Bhargava et al. (2012), DIO mice treated with LNFPIII conjugates twice per week for four weeks. The experimental timeline here differs, during which treatment was performed twice per week for eight weeks. It is possible that the longer duration of treatment used in this experiment allowed for differences in weight gain and subcutaneous/visceral AT depots to become apparent. Similar to Bhargava et al. (2012), we observed significant reductions in fasting blood glucose levels post-treatment (Figure 2A), as well as improved glucose and insulin tolerance (Figures 2B, C). It is striking that the LNnT conjugates (NTDEX) did not induce these effects. We have shown in previous studies that P3DEX acts on B cells, macrophages, dendritic cells, adipocytes, and hepatocytes (28, 50, 52–54, 86, 90–94). NTDEX activates macrophages, but not dendritic cells, suggesting differences in cellular mechanisms between the two glycans (51). We also have evidence that P3DEX and NTDEX act on adipocytes in vitro (unpublished). Thus, it is likely that M2 macrophage polarization is not the sole mechanism via which P3DEX exerts its therapeutic effect. Furthermore, additional studies must be performed in parallel to delineate the mechanistic differences present between the two HMO conjugates.
This is the first in vivo report comparing the therapeutic effects of P3DEX and NTDEX in a DIO model. Compared to P3DEX, NTDEX did not reduce weight gain or improve glucose homeostasis. Both P3DEX and NTDEX had differential effects on circulating chemokines, cytokines, adipokines, and incretin hormones (Figures 3–5). Only P3DEX reduced weight gain and improved glucose homeostasis, yet both P3DEX and NTDEX altered cytokines involved in hematopoiesis and may each have roles in reducing inflammation (Figures 1–3). The effects of P3DEX appear to be more pronounced as treatment of DIO mice led to reductions in several chemotactic cytokines (i.e. KC, MCP-1, RANTES) (Figure 3). This could be due to reductions in AT mass and subsequent decreases in pro-inflammatory signals from AT depots. P3DEX and NTDEX also altered numerous innate and adaptive cytokines, but given the pleiotropic nature of these markers, it is difficult to make conclusions about the role that they might have in ameliorating MS (Figure 4). Furthermore, an increase/decrease in one marker can lead to a compensating increase/decrease in another. We saw a trending decrease in IL-4 for animals treated with P3DEX and a significant decrease for those treated with NTDEX. P3DEX and NTDEX both promote TH2 responses and alternative activation (M2) of macrophages, so this result was unexpected (51–54). The role of IL-6 in DIO is controversial, as some studies suggest that IL-6 exacerbates insulin resistance and others note beneficial effects (95–97). Given that we do not observe improvements in glucose or insulin tolerance in DIO mice treated with NTDEX, it is likely that elimination of IL-6 does not have a significant therapeutic impact in our studies. Furthermore, deletion of IL-6 in in vivo studies have not been successful in delineating its role in DIO and T2DM (97). P3DEX has been shown to increase circulating IL-10 levels in DIO mice, but the studies presented herein are different in terms of experimental conditions and design (i.e. animal housing facilities, longer treatment period, etc.) (28). IL-17a is a prominent marker of inflammation and is elevated in obese individuals, but there is also evidence of an anti-adipogenic role for this cytokine (98). The fasting serum samples analyzed here offer a snapshot in time following 8 weeks of DEX, P3DEX, or NTDEX treatment. It is well-known that these markers fluctuate over time and/or depend on disease progression. Another method to determine the specific roles and importance of the documented adipokines, chemokines, or cytokines would be to eliminate these molecules in DIO mice on DEX, P3DEX, and NTDEX treatment regimens and evaluate whether the conjugates’ therapeutic capabilities are altered.
While the chemokine and cytokine results do not allow us to focus on a distinct mechanism, it is clear that P3DEX and NTDEX altered adipokines and incretin hormones in a more straight-forward manner (Figure 5). Adipokines, such as ghrelin, leptin, and resistin, are directly secreted from AT depots and indispensable for metabolic regulation. We observed a slight, but non-significant increase in ghrelin in response to P3DEX treatment (Figure 5A). Ghrelin is known to decrease in the obese state and inversely correlates with BMI, so the observed increase in response to P3DEX treatment aligns with the decreased weight gain that we report here (99–101). In the obese state, individuals often present with low ghrelin levels and high leptin levels to which they become resistant (102). P3DEX slightly increased circulating ghrelin, as well as significantly decreased circulating leptin, an adipokine generated in proportion to fat content (Figure 5A) (103). P3DEX also significantly decreased resistin, an adipokine known to increase with inflammation and insulin resistance (Figure 5A) (104). Resistin also perpetuates states of inflammation via induction of pro-inflammatory cytokines (i.e. IL-1, IL-6, IL-12, TNFα, etc.) and molecules related to chemoattraction (i.e. VCAM-1, ICAM-1, MCP-1, etc.) (105, 106). Whether these changes occur as a result of overall decreases in AT or if P3DEX acts directly on adipocytes to modulate ghrelin, leptin, and resistin secretion is yet to be investigated. In contrast to P3DEX, NTDEX induced significant changes in incretin hormones. NTDEX treatment led to a significant decrease in GIP, a hormone that stimulates insulin secretion and synthesis, as well as glucagon secretion (Figure 5B) (80). In this regard, the observed decrease in response to NTDEX treatment could be damaging in the context of DIO. This decrease also corresponded with a significant decrease in glucagon secretion (Figure 5B) and a trending increase in the ratio of insulin:glucagon (Figure 5B).
Similar to Bhargava et al. (2012), P3DEX decreased WAT inflammation and lipid accumulation in the liver (Figures 5, 6). However, NTDEX treatment seemed to worsen WAT inflammation and increase hepatic lipid accumulation even compared to DEX treatment (Figures 5, 6). This was exemplified by the significant increase in the ratio of AST : ALT in DIO mice treated with NTDEX (Figure 6D). We expected NTDEX to ameliorate WAT inflammation and hepatic lipid accumulation similar to P3DEX, however, NTDEX appeared to have a damaging effect at the tissue level. Future studies will further investigate mechanistic changes induced by P3DEX and NTDEX at the tissue level in this DIO model.
The complete mechanism of both LNFPIII and LNnT conjugates is unknown. Internalization of LNFPIII conjugates occurs via a receptor-mediated process, which undergoes clathrin-dependent endocytosis (53). Internalization does not require TLR4 or MyD88, but does require CD14. Signaling continues via CD14/TLR4-Ras-Raf1-TPL2-MEK to induce ERK and NFκB signaling. This results in production of anti-inflammatory mediators, such as IL-4, IL-10, MMP9, and CCL22. In contrast, LNnT conjugates do not activate antigen-presenting cells (APCs) via TLR4/MD2/CD14, so it is probable that the fucose residue on LNFPII is vital for signaling (54). It is also likely that, while anti-inflammatory in vivo, LNnT conjugates induce effects that differ from LNFPIII conjugates. LNFPIII conjugates also act directly on adipocytes and hepatocytes, but it is unknown whether this is the case for LNnT conjugates. To further investigate the mechanism of LNFPIII and LNnT conjugates, we have generated monoclonal antibodies (mAbs) that will serve as useful probes for future studies (i.e. co-immunoprecipitation). We hope to determine the receptors that P3DEX and NTDEX bind to in various cells, elucidate their overall mechanisms, and determine if P3DEX might be a useful treatment for humans with MS.
Data Availability Statement
The raw data supporting the conclusions of this article will be made available by the authors, without undue reservation.
Ethics Statement
The animal study was reviewed and approved by UGA’s Institutional Animal Care and Use Committee (IACUC).
Author Contributions
JR and DH designed the experiments. JR and VS-M performed the experiments. TNa performed histopathological analysis. JR and DH analyzed and interpreted the results. JR and DH wrote the manuscript. TNo synthesized both LNFPIII and LNnT conjugates. All authors contributed to the article and approved the submitted version.
Funding
This project was funded by an American Heart Association (AHA) Predoctoral Fellowship (17PRE33410423) and UGA’s Obesity Initiative.
Conflict of Interest
The authors declare that the research was conducted in the absence of any commercial or financial relationships that could be construed as a potential conflict of interest.
Acknowledgments
We would like to thank the American Heart Association and the University of Georgia’s Obesity Initiative for providing funds to complete these studies. We would also like to thank Dr. George Wang (Georgia State University, Atlanta, GA) for preparation of LNFPII, Dr. Kaori Sakamoto for additional histopathologic analysis of liver and adipose tissue, and University of Georgia’s Animal Resources personnel for their assistance with animal care and maintenance.
References
1. Hales CM, Carroll MD, Fryar CD, Ogden CL. Prevalence of Obesity and Severe Obesity Among Adults: United States, 2017-2018. NCHS Data Brief (2020) 360:1–8.
2. Weir CB, Jan A. Bmi Classification Percentile And Cut Off Points. In: Statpearls. Treasure Island (FL: StatPearls Publishing Copyright © 2020, StatPearls Publishing LLC (2020).
3. Godoy-Matos AF, Silva Júnior WS, Valerio CM. NAFLD as a Continuum: From Obesity to Metabolic Syndrome and Diabetes. Diabetol Metab Syndr (2020) 12:60. doi: 10.1186/s13098-020-00570-y
4. Alberti KG, Zimmet P, Shaw J. The Metabolic Syndrome–a New Worldwide Definition. Lancet (2005) 366(9491):1059–62. doi: 10.1016/S0140-6736(05)67402-8
5. Zimmet P, Magliano D, Matsuzawa Y, Alberti G, Shaw J. The Metabolic Syndrome: A Global Public Health Problem and a New Definition. J Atheroscler Thromb (2005) 12(6):295–300. doi: 10.5551/jat.12.295
6. Hirsch J, Han PW. Cellularity of Rat Adipose Tissue: Effects of Growth, Starvation, and Obesity. J Lipid Res (1969) 10(1):77–82. doi: 10.1016/S0022-2275(20)42651-3
7. Faust IM, Johnson PR, Stern JS, Hirsch J. Diet-Induced Adipocyte Number Increase in Adult Rats: A New Model of Obesity. Am J Physiol (1978) 235(3):E279–86. doi: 10.1152/ajpendo.1978.235.3.E279
8. Spalding KL, Arner E, Westermark PO, Bernard S, Buchholz BA, Bergmann O, et al. Dynamics of Fat Cell Turnover in Humans. Nature (2008) 453(7196):783–7. doi: 10.1038/nature06902
9. Tang W, Zeve D, Suh JM, Bosnakovski D, Kyba M, Hammer RE, et al. White Fat Progenitor Cells Reside in the Adipose Vasculature. Science (2008) 322(5901):583–6. doi: 10.1126/science.1156232
10. Wang QA, Tao C, Gupta RK, Scherer PE. Tracking Adipogenesis During White Adipose Tissue Development, Expansion and Regeneration. Nat Med (2013) 19(10):1338–44. doi: 10.1038/nm.3324
11. Vishvanath L, MacPherson KA, Hepler C, Wang QA, Shao M, Spurgin SB, et al. Pdgfrβ+ Mural Preadipocytes Contribute to Adipocyte Hyperplasia Induced by High-Fat-Diet Feeding and Prolonged Cold Exposure in Adult Mice. Cell Metab (2016) 23(2):350–9. doi: 10.1016/j.cmet.2015.10.018
12. Hosogai N, Fukuhara A, Oshima K, Miyata Y, Tanaka S, Segawa K, et al. Adipose Tissue Hypoxia in Obesity and its Impact on Adipocytokine Dysregulation. Diabetes (2007) 56(4):901–11. doi: 10.2337/db06-0911
13. Halberg N, Khan T, Trujillo ME, Wernstedt-Asterholm I, Attie AD, Sherwani S, et al. Hypoxia-Inducible Factor 1alpha Induces Fibrosis and Insulin Resistance in White Adipose Tissue. Mol Cell Biol (2009) 29(16):4467–83. doi: 10.1128/MCB.00192-09
14. Salans LB, Knittle JL, Hirsch J. The Role of Adipose Cell Size and Adipose Tissue Insulin Sensitivity in the Carbohydrate Intolerance of Human Obesity. J Clin Invest (1968) 47(1):153–65. doi: 10.1172/JCI105705
15. Hotamisligil GS, Shargill NS, Spiegelman BM. Adipose Expression of Tumor Necrosis Factor-Alpha: Direct Role in Obesity-Linked Insulin Resistance. Science (1993) 259(5091):87–91. doi: 10.1126/science.7678183
16. Hotamisligil GS, Arner P, Caro JF, Atkinson RL, Spiegelman BM. Increased Adipose Tissue Expression of Tumor Necrosis Factor-Alpha in Human Obesity and Insulin Resistance. J Clin Invest (1995) 95(5):2409–15. doi: 10.1172/JCI117936
17. Dandona P, Weinstock R, Thusu K, Abdel-Rahman E, Aljada A, Wadden T. Tumor Necrosis Factor-Alpha in Sera of Obese Patients: Fall With Weight Loss. J Clin Endocrinol Metab (1998) 83(8):2907–10. doi: 10.1210/jc.83.8.2907
18. Weisberg SP, McCann D, Desai M, Rosenbaum M, Leibel RL, Ferrante A. Obesity is Associated With Macrophage Accumulation in Adipose Tissue. J Clin Invest (2003) 112(12):1796–808. doi: 10.1172/JCI200319246
19. Xu H, Barnes GT, Yang Q, Tan G, Yang D, Chou CJ, et al. Chronic Inflammation in Fat Plays a Crucial Role in the Development of Obesity-Related Insulin Resistance. J Clin Invest (2003) 112(12):1821–30. doi: 10.1172/JCI200319451
20. Maury E, Brichard SM. Adipokine Dysregulation, Adipose Tissue Inflammation and Metabolic Syndrome. Mol Cell Endocrinol (2010) 314(1):1–16. doi: 10.1016/j.mce.2009.07.031
21. Thurl S, Munzert M, Boehm G, Matthews C, Stahl B. Systematic Review of the Concentrations of Oligosaccharides in Human Milk. Nutr Rev (2017) 75(11):920–33. doi: 10.1093/nutrit/nux044
22. Bode L. Human Milk Oligosaccharides: Every Baby Needs a Sugar Mama. Glycobiology (2012) 22(9):1147–62. doi: 10.1093/glycob/cws074
23. Xiao Z, Guo Y, Liu Y, Li L, Zhang Q, Wen L, et al. Chemoenzymatic Synthesis of a Library of Human Milk Oligosaccharides. J Org Chem (2016) 81(14):5851–65. doi: 10.1021/acs.joc.6b00478
24. Beguinot F, Nigro C. Measurement of Glucose Homeostasis In Vivo: Glucose and Insulin Tolerance Tests. Methods Mol Biol (2012) 933:219–28. doi: 10.1007/978-1-62703-068-7_14
25. Ayala JE, Samuel VT, Morton GJ, Obici S, Croniger CM, Shulman GI, et al. Standard Operating Procedures for Describing and Performing Metabolic Tests of Glucose Homeostasis in Mice. Dis Model Mech (2010) 3(9-10):525–34. doi: 10.1242/dmm.006239
26. Bowe JE, Franklin ZJ, Hauge-Evans AC, King AJ, Persaud SJ, Jones PM. Metabolic Phenotyping Guidelines: Assessing Glucose Homeostasis in Rodent Models. J Endocrinol (2014) 222(3):G13–25. doi: 10.1530/JOE-14-0182
27. Elison E, Vigsnaes LK, Rindom Krogsgaard L, Rasmussen J, Sørensen N, McConnell B, et al. Oral Supplementation of Healthy Adults With 2’-O-fucosyllactose and lacto-N-neotetraose is Well Tolerated and Shifts the Intestinal Microbiota. Br J Nutr (2016) 116(8):1356–68. doi: 10.1017/S0007114516003354
28. Bhargava P, Li C, Stanya KJ, Jacobi D, Dai L, Liu S, et al. Immunomodulatory Glycan LNFPIII Alleviates Hepatosteatosis and Insulin Resistance Through Direct and Indirect Control of Metabolic Pathways. Nat Med (2012) 18(11):1665–72. doi: 10.1038/nm.2962
29. Chen C, Zhang Y, Xue M, Liu XW, Li Y, Chen X, et al. Sequential One-Pot Multienzyme (OPME) Synthesis of lacto-N-neotetraose and its Sialyl and Fucosyl Derivatives. Chem Commun (Camb) (2015) 51(36):7689–92. doi: 10.1039/C5CC01330E
30. Andrikopoulos S, Blair AR, Deluca N, Fam BC, Proietto J. Evaluating the Glucose Tolerance Test in Mice. Am J Physiol Endocrinol Metab (2008) 295(6):E1323–32. doi: 10.1152/ajpendo.90617.2008
31. Whary MT, Baumgarth N, Fox JG, Barthold SW. Chapter 3 - Biology and Diseases of Mice. In: Fox JG, et al, editors. Laboratory Animal Medicine, 3rd ed. Boston: Academic Press (2015). p. 43–149.
32. Huttunen R, Syrjänen J. Obesity and the Outcome of Infection. Lancet Infect Dis (2010) 10(7):442–3. doi: 10.1016/S1473-3099(10)70103-1
33. Huttunen R, Syrjänen J. Obesity and the Risk and Outcome of Infection. Int J Obes (Lond) (2013) 37(3):333–40. doi: 10.1038/ijo.2012.62
34. Ogawa M. Differentiation and Proliferation of Hematopoietic Stem Cells. Blood (1993) 81(11):2844–53. doi: 10.1182/blood.V81.11.2844.bloodjournal81112844
35. Bohnsack BL, Hirschi KK. Nutrient Regulation of Cell Cycle Progression. Annu Rev Nutr (2004) 24:433–53. doi: 10.1146/annurev.nutr.23.011702.073203
37. Choi KD, Vodyanik M, Slukvin II. Hematopoietic Differentiation and Production of Mature Myeloid Cells From Human Pluripotent Stem Cells. Nat Protoc (2011) 6(3):296–313. doi: 10.1038/nprot.2010.184
38. Pratley RE, Wilson C, Bogardus C. Relation of the White Blood Cell Count to Obesity and Insulin Resistance: Effect of Race and Gender. Obes Res (1995) 3(6):563–71. doi: 10.1002/j.1550-8528.1995.tb00191.x
39. Herishanu Y, Rogowski O, Polliack A, Marilus R. Leukocytosis in Obese Individuals: Possible Link in Patients With Unexplained Persistent Neutrophilia. Eur J Haematol (2006) 76(6):516–20. doi: 10.1111/j.1600-0609.2006.00658.x
40. Dixon JB, O’Brien PE. Obesity and the White Blood Cell Count: Changes With Sustained Weight Loss. Obes Surg (2006) 16(3):251–7. doi: 10.1381/096089206776116453
41. Farhangi MA, Keshavarz SA, Eshraghian M, Ostadrahimi A, Saboor-Yaraghi A. White Blood Cell Count in Women: Relation to Inflammatory Biomarkers, Haematological Profiles, Visceral Adiposity, and Other Cardiovascular Risk Factors. J Health Popul Nutr (2013) 31(1):58–64. doi: 10.3329/jhpn.v31i1.14749
42. Nanji AA, Freeman JB. Relationship Between Body Weight and Total Leukocyte Count in Morbid Obesity. Am J Clin Pathol (1985) 84(3):346–7. doi: 10.1093/ajcp/84.3.346
43. Ryder E, Diez-Ewald M, Mosquera J, Fernández E, Pedreañez A, Vargas R, et al. Association of Obesity With Leukocyte Count in Obese Individuals Without Metabolic Syndrome. Diabetes Metab Syndr (2014) 8(4):197–204. doi: 10.1016/j.dsx.2014.09.002
44. Xue W, Fan Z, Li L, Lu J, Zhai Y, Zhao J. The Chemokine System and its Role in Obesity. J Cell Physiol (2019) 234(4):3336–46. doi: 10.1002/jcp.27293
45. Vasudevan AR, Wu H, Xydakis AM, Jones PH, Smith EO, Sweeney JF, et al. Eotaxin and Obesity. J Clin Endocrinol Metab (2006) 91(1):256–61. doi: 10.1210/jc.2005-1280
46. Lee EH, Itan M, Jang J, Gu HJ, Rozenberg P, Mingler MK, et al. Eosinophils Support Adipocyte Maturation and Promote Glucose Tolerance in Obesity. Sci Rep (2018) 8(1):9894. doi: 10.1038/s41598-018-28371-4
47. Nunemaker CS, Chung HG, Verrilli GM, Corbin KL, Upadhye A, Sharma P. Increased Serum CXCL1 and CXCL5 are Linked to Obesity, Hyperglycemia, and Impaired Islet Function. J Endocrinol (2014) 222(2):267–76. doi: 10.1530/JOE-14-0126
48. Sajadi SM, Khoramdelazad H, Hassanshahi G, Rafatpanah H, Hosseini J, Mahmoodi M, et al. Plasma Levels of CXCL1 (GRO-Alpha) and CXCL10 (Ip-10) are Elevated in Type 2 Diabetic Patients: Evidence for the Involvement of Inflammation and Angiogenesis/Angiostasis in This Disease State. Clin Lab (2013) 59(1-2):133–7. doi: 10.7754/Clin.Lab.2012.120225
49. De Filippo K, Dudeck A, Hasenberg M, Nye E, van Rooijen N, Hartmann K, et al. Mast Cell and Macrophage Chemokines CXCL1/CXCL2 Control the Early Stage of Neutrophil Recruitment During Tissue Inflammation. Blood (2013) 121(24):4930–7. doi: 10.1182/blood-2013-02-486217
50. Atochina O, Daly-Engel T, Piskorska D, McGuire E, Harn DA. A Schistosome-Expressed Immunomodulatory Glycoconjugate Expands Peritoneal Gr1(+) Macrophages That Suppress Naive CD4(+) T Cell Proliferation Via an IFN-gamma and Nitric Oxide-Dependent Mechanism. J Immunol (2001) 167(8):4293–302. doi: 10.4049/jimmunol.167.8.4293
51. Terrazas LI, Walsh KL, Piskorska D, McGuire E, Harn DA Jr. The Schistosome Oligosaccharide lacto-N-neotetraose Expands Gr1(+) Cells That Secrete Anti-Inflammatory Cytokines and Inhibit Proliferation of Naive CD4(+) Cells: A Potential Mechanism for Immune Polarization in Helminth Infections. J Immunol (2001) 167(9):5294–303. doi: 10.4049/jimmunol.167.9.5294
52. Atochina O, Da'dara AA, Walker M, Harn DA. The Immunomodulatory Glycan LNFPIII Initiates Alternative Activation of Murine Macrophages In Vivo. Immunology (2008) 125(1):111–21. doi: 10.1111/j.1365-2567.2008.02826.x
53. Srivastava L, Tundup S, Choi BS, Norberg T, Harn D. Immunomodulatory Glycan Lacto-N-Fucopentaose III Requires Clathrin-Mediated Endocytosis to Induce Alternative Activation of Antigen-Presenting Cells. Infect Immun (2014) 82(5):1891–903. doi: 10.1128/IAI.01293-13
54. Tundup S, Srivastava L, Norberg T, Watford W, Harn D. A Neoglycoconjugate Containing the Human Milk Sugar Lnfpiii Drives Anti-Inflammatory Activation of Antigen Presenting Cells in a CD14 Dependent Pathway. PloS One (2015) 10(9):e0137495. doi: 10.1371/journal.pone.0137495
55. Christiansen T, Richelsen B, Bruun JM. Monocyte Chemoattractant Protein-1 is Produced in Isolated Adipocytes, Associated With Adiposity and Reduced After Weight Loss in Morbid Obese Subjects. Int J Obes (Lond) (2005) 29(1):146–50. doi: 10.1038/sj.ijo.0802839
56. Weisberg SP, Hunter D, Huber R, Lemieux J, Slaymaker S, Vaddi K, et al. CCR2 Modulates Inflammatory and Metabolic Effects of High-Fat Feeding. J Clin Invest (2006) 116(1):115–24. doi: 10.1172/JCI24335
57. Kanda H, Tateya S, Tamori Y, Kotani K, Hiasa K, Kitazawa R, et al. MCP-1 Contributes to Macrophage Infiltration Into Adipose Tissue, Insulin Resistance, and Hepatic Steatosis in Obesity. J Clin Invest (2006) 116(6):1494–505. doi: 10.1172/JCI26498
58. Jiao P, Chen Q, Shah S, Du J, Tao B, Tzameli I, et al. Obesity-Related Upregulation of Monocyte Chemotactic Factors in Adipocytes: Involvement of Nuclear Factor-Kappab and C-Jun NH2-terminal Kinase Pathways. Diabetes (2009) 58(1):104–15. doi: 10.2337/db07-1344
59. Huber J, Kiefer FW, Zeyda M, Ludvik B, Silberhumer GR, Prager G, et al. CC Chemokine and CC Chemokine Receptor Profiles in Visceral and Subcutaneous Adipose Tissue are Altered in Human Obesity. J Clin Endocrinol Metab (2008) 93(8):3215–21. doi: 10.1210/jc.2007-2630
60. Chawla A, Nguyen KD, Goh YP. Macrophage-Mediated Inflammation in Metabolic Disease. Nat Rev Immunol (2011) 11(11):738–49. doi: 10.1038/nri3071
61. Meier CA, Bobbioni E, Gabay C, Assimacopoulos-Jeannet F, Golay A, Dayer J. IL-1 Receptor Antagonist Serum Levels are Increased in Human Obesity: A Possible Link to the Resistance to Leptin? J Clin Endocrinol Metab (2002) 87(3):1184–8. doi: 10.1210/jcem.87.3.8351
62. Um JY, Chung HS, Song MY, Shin HD, Kim HM. Association of interleukin-1beta Gene Polymorphism With Body Mass Index in Women. Clin Chem (2004) 50(3):647–50. doi: 10.1373/clinchem.2003.025858
63. Di Renzo L, Bigioni M, Del Gobbo V, Premrov MG, Barbini U, Di Lorenzo N, et al. Interleukin-1 (Il-1) Receptor Antagonist Gene Polymorphism in Normal Weight Obese Syndrome: Relationship to Body Composition and IL-1 Alpha and Beta Plasma Levels. Pharmacol Res (2007) 55(2):131–8. doi: 10.1016/j.phrs.2006.11.002
64. Wensveen FM, Valentic S, Sestan M, Turk Wensveen T, Polic B. The “Big Bang” in Obese Fat: Events Initiating Obesity-Induced Adipose Tissue Inflammation. Eur J Immunol (2015) 45(9):2446–56. doi: 10.1002/eji.201545502
65. Goswami R, Kaplan MH. A Brief History of IL-9. J Immunol (2011) 186(6):3283–8. doi: 10.4049/jimmunol.1003049
66. Gee K, Guzzo C, Che Mat NF, Ma W, Kumar A. The IL-12 Family of Cytokines in Infection, Inflammation and Autoimmune Disorders. Inflammation Allergy Drug Targets (2009) 8(1):40–52. doi: 10.2174/187152809787582507
67. Darkhal P, Gao M, Ma Y, Liu D. Blocking High-Fat Diet-Induced Obesity, Insulin Resistance and Fatty Liver by Overexpression of Il-13 Gene in Mice. Int J Obes (Lond) (2015) 39(8):1292–9. doi: 10.1038/ijo.2015.52
68. Yanagi S, Sato T, Kangawa K, Nakazato M. The Homeostatic Force of Ghrelin. Cell Metab (2018) 27(4):786–804. doi: 10.1016/j.cmet.2018.02.008
69. Toshinai K, Mondal MS, Nakazato M, Date Y, Murakami N, Kojima M, et al. Upregulation of Ghrelin Expression in the Stomach Upon Fasting, Insulin-Induced Hypoglycemia, and Leptin Administration. Biochem Biophys Res Commun (2001) 281(5):1220–5. doi: 10.1006/bbrc.2001.4518
70. Cummings DE, Weigle DS, Frayo RS, Breen PA, Ma MK, Dellinger EP, et al. Plasma Ghrelin Levels After Diet-Induced Weight Loss or Gastric Bypass Surgery. N Engl J Med (2002) 346(21):1623–30. doi: 10.1056/NEJMoa012908
71. Shiiya T, Nakazato M, Mizuta M, Date Y, Mondal MS, Tanaka M, et al. Plasma Ghrelin Levels in Lean and Obese Humans and the Effect of Glucose on Ghrelin Secretion. J Clin Endocrinol Metab (2002) 87(1):240–4. doi: 10.1210/jcem.87.1.8129
72. Dixit VD, Schaffer EM, Pyle RS, Collins GD, Sakthivel SK, Palaniappan R, et al. Ghrelin Inhibits Leptin- and Activation-Induced Proinflammatory Cytokine Expression by Human Monocytes and T Cells. J Clin Invest (2004) 114(1):57–66. doi: 10.1172/JCI200421134
73. Moreno M, Chaves JF, Sancho-Bru P, Ramalho F, Ramalho LN, Mansego ML, et al. Ghrelin Attenuates Hepatocellular Injury and Liver Fibrogenesis in Rodents and Influences Fibrosis Progression in Humans. Hepatology (2010) 51(3):974–85. doi: 10.1002/hep.23421
74. Myers MG Jr, Leibel RL, Seeley RJ, Schwartz MW. Obesity and Leptin Resistance: Distinguishing Cause From Effect. Trends Endocrinol Metab (2010) 21(11):643–51. doi: 10.1016/j.tem.2010.08.002
75. Weigle DS, Duell PB, Connor WE, Steiner RA, Soules MR, Kuijper JL. Effect of Fasting, Refeeding, and Dietary Fat Restriction on Plasma Leptin Levels. J Clin Endocrinol Metab (1997) 82(2):561–5. doi: 10.1210/jc.82.2.561
76. Keim NL, Stern JS, Havel PJ. Relation Between Circulating Leptin Concentrations and Appetite During a Prolonged, Moderate Energy Deficit in Women. Am J Clin Nutr (1998) 68(4):794–801. doi: 10.1093/ajcn/68.4.794
77. Ahima RS, Prabakaran D, Mantzoros C, Qu D, Lowell B, Maratos-Flier E, et al. Role of Leptin in the Neuroendocrine Response to Fasting. Nature (1996) 382(6588):250–2. doi: 10.1038/382250a0
78. Morton GJ, Cummings DE, Baskin DG, Barsh GS, Schwartz MW. Central Nervous System Control of Food Intake and Body Weight. Nature (2006) 443(7109):289–95. doi: 10.1038/nature05026
79. Nauck MA, Meier JJ. Incretin Hormones: Their Role in Health and Disease. Diabetes Obes Metab (2018) 20:5–21. doi: 10.1111/dom.13129
80. Kim W, Egan JM. The Role of Incretins in Glucose Homeostasis and Diabetes Treatment. Pharmacol Rev (2008) 60(4):470–512. doi: 10.1124/pr.108.000604
81. Kalra S, Gupta Y. The Insulin:Glucagon Ratio and the Choice of Glucose-Lowering Drugs. Diabetes Ther (2016) 7(1):1–9. doi: 10.1007/s13300-016-0160-4
82. Moukarzel S, Bode L. Human Milk Oligosaccharides and the Preterm Infant: A Journey in Sickness and in Health. Clin Perinatol (2017) 44(1):193–207. doi: 10.1016/j.clp.2016.11.014
83. Bandara MD, Stine KJ, Demchenko AV. The Chemical Synthesis of Human Milk Oligosaccharides: Lacto-N-neotetraose (Galβ1→4glcnacβ1→3galβ1→4glc). Carbohydr Res (2019) 483:107743. doi: 10.1016/j.carres.2019.107743
84. Coulet M, Phothirath P, Constable A, Marsden E, Schilter B. Pre-Clinical Safety Assessment of the Synthetic Human Milk, Nature-Identical, Oligosaccharide Lacto-N-neotetraose (Lnnt). Food Chem Toxicol (2013) 62:528–37. doi: 10.1016/j.fct.2013.09.018
85. Hegar B, Wibowo Y, Basrowi RW, Ranuh RG, Sudarmo SM, Munasir Z, et al. The Role of Two Human Milk Oligosaccharides, 2’-Fucosyllactose and Lacto-N-Neotetraose, in Infant Nutrition. Pediatr Gastroenterol Hepatol Nutr (2019) 22(4):330–40. doi: 10.5223/pghn.2019.22.4.330
86. Thomas PG, Carter MR, Da'dara AA, DeSimone TM, Harn DA. A Helminth Glycan Induces APC Maturation Via Alternative NF-Kappa B Activation Independent of I Kappa B Alpha Degradation. J Immunol (2005) 175(4):2082–90. doi: 10.4049/jimmunol.175.4.2082
87. Ni Y, Ni L, Zhuge F, Xu L, Fu Z, Ota T. Adipose Tissue Macrophage Phenotypes and Characteristics: The Key to Insulin Resistance in Obesity and Metabolic Disorders. Obesity (2020) 28(2):225–34. doi: 10.1002/oby.22674
88. Jing Y, Wu F, Li D, Yang L, Li Q, Li R. Metformin Improves Obesity-Associated Inflammation by Altering Macrophages Polarization. Mol Cell Endocrinol (2018) 461:256–64. doi: 10.1016/j.mce.2017.09.025
89. Koppaka S, Kehlenbrink S, Carey M, Li W, Sanchez E, Lee D-E, et al. Reduced Adipose Tissue Macrophage Content Is Associated With Improved Insulin Sensitivity in Thiazolidinedione-Treated Diabetic Humans. Diabetes (2013) 62(6):1843. doi: 10.2337/db12-0868
90. Velupillai P, Secor WE, Horauf AM, Harn DA. B-1 Cell (CD5+B220+) Outgrowth in Murine Schistosomiasis is Genetically Restricted and is Largely Due to Activation by Polylactosamine Sugars. J Immunol (1997) 158(1):338–44. doi: 10.2337/db12-0868
91. Okano M, Satoskar AR, Nishizaki K, Abe M, Harn DA Jr. Induction of Th2 Responses and IgE is Largely Due to Carbohydrates Functioning as Adjuvants on Schistosoma Mansoni Egg Antigens. J Immunol (1999) 163(12):6712–7.
92. Thomas PG, Carter MR, Atochina O, Da'Dara AA, Piskorska D, McGuire E, et al. Maturation of Dendritic Cell 2 Phenotype by a Helminth Glycan Uses a Toll-like Receptor 4-Dependent Mechanism. J Immunol (2003) 171(11):5837–41. doi: 10.4049/jimmunol.171.11.5837
93. Atochina O, Harn D. Lnfpiii/LeX-stimulated Macrophages Activate Natural Killer Cells Via CD40-CD40L Interaction. Clin Diagn Lab Immunol (2005) 12(9):1041–9. doi: 10.1128/CDLI.12.9.1041-1049.2005
94. Wang Y, Da'Dara AA, Thomas PG, Harn DA. Dendritic Cells Activated by an Anti-Inflammatory Agent Induce CD4(+) T Helper Type 2 Responses Without Impairing CD8(+) Memory and Effector Cytotoxic T-lymphocyte Responses. Immunology (2010) 129(3):406–17. doi: 10.1111/j.1365-2567.2009.03193.x
95. Ellingsgaard H, Hauselmann I, Schuler B, Habib AM, Baggio LL, Meier DT, et al. Interleukin-6 Enhances Insulin Secretion by Increasing Glucagon-Like Peptide-1 Secretion From L Cells and Alpha Cells. Nat Med (2011) 17(11):1481–9. doi: 10.1038/nm.2513
96. El-Kadre LJ, Tinoco AC. Interleukin-6 and Obesity: The Crosstalk Between Intestine, Pancreas and Liver. Curr Opin Clin Nutr Metab Care (2013) 16(5):564–8. doi: 10.1097/MCO.0b013e32836410e6
97. Kim JH, Bachmann RA, Chen J. Interleukin-6 and Insulin Resistance. Vitam Horm (2009) 80:613–33. doi: 10.1016/S0083-6729(08)00621-3
98. Ahmed M, Gaffen SL. IL-17 in Obesity and Adipogenesis. Cytokine Growth Factor Rev (2010) 21(6):449–53. doi: 10.1016/j.cytogfr.2010.10.005
99. Tschöp M, Weyer C, Tataranni PA, Devanarayan V, Ravussin E, Heiman ML. Circulating Ghrelin Levels are Decreased in Human Obesity. Diabetes (2001) 50(4):707–9. doi: 10.2337/diabetes.50.4.707
100. Otto B, Cuntz U, Fruehauf E, Wawarta R, Folwaczny C, Riepl RL, et al. Weight Gain Decreases Elevated Plasma Ghrelin Concentrations of Patients With Anorexia Nervosa. Eur J Endocrinol (2001) 145(5):669–73. doi: 10.1530/EJE-1450669
101. Otto B, Tschöp M, Frühauf E, Heldwein W, Fichter M, Otto C, et al. Postprandial Ghrelin Release in Anorectic Patients Before and After Weight Gain. Psychoneuroendocrinology (2005) 30(6):577–81. doi: 10.1016/j.psyneuen.2005.01.009
102. Frederich RC, Hamann A, Anderson S, Löllmann B, Lowell BB, Flier JS. Leptin Levels Reflect Body Lipid Content in Mice: Evidence for Diet-Induced Resistance to Leptin Action. Nat Med (1995) 1(12):1311–4. doi: 10.1038/nm1295-1311
103. Friedman JM, Halaas JL. Leptin and the Regulation of Body Weight in Mammals. Nature (1998) 395(6704):763–70. doi: 10.1038/27376
104. Huang X, Yang Z. Resistin’s, Obesity and Insulin Resistance: The Continuing Disconnect Between Rodents and Humans. J Endocrinol Invest (2016) 39(6):607–15. doi: 10.1007/s40618-015-0408-2
105. Lehrke M, Reilly MP, Millington SC, Iqbal N, Rader DJ, Lazar MA. An Inflammatory Cascade Leading to Hyperresistinemia in Humans. PloS Med (2004) 1(2):e45. doi: 10.1371/journal.pmed.0010045
Keywords: glycoconjugates, human milk oligosaccharides (HMOs), lacto-N-fucopentaose III (LNFPIII), lacto-N-neotetraose (LNnT), Lewisx antigen, metabolic syndrome, obesity
Citation: Ramadhin J, Silva-Moraes V, Nagy T, Norberg T and Harn D (2021) A Comparison of Two Structurally Related Human Milk Oligosaccharide Conjugates in a Model of Diet-Induced Obesity. Front. Immunol. 12:668217. doi: 10.3389/fimmu.2021.668217
Received: 15 February 2021; Accepted: 30 April 2021;
Published: 20 May 2021.
Edited by:
Marina Chaves De Oliveira, Federal University of Minas Gerais, BrazilCopyright © 2021 Ramadhin, Silva-Moraes, Nagy, Norberg and Harn. This is an open-access article distributed under the terms of the Creative Commons Attribution License (CC BY). The use, distribution or reproduction in other forums is permitted, provided the original author(s) and the copyright owner(s) are credited and that the original publication in this journal is cited, in accordance with accepted academic practice. No use, distribution or reproduction is permitted which does not comply with these terms.
*Correspondence: Donald Harn, dharn@uga.edu