 Elisa Crisci1*†
 Marco Moroldo1‡
 Thien-Phong Vu Manh2‡Ammara Mohammad3†Laurent Jourdren3Celine Urien4Edwige Bouguyon4Elise Bordet4Claudia Bevilacqua1
 Mickael Bourge5Jérémy Pezant6Alexis Pléau6Olivier Boulesteix6Isabelle Schwartz4Nicolas Bertho4†§
 Elisabetta Giuffra1*§
- 1Université Paris Saclay, INRAE, AgroParisTech, GABI, Jouy-en-Josas, France
- 2Aix Marseille Univ, CNRS, INSERM, CIML, Marseille, France
- 3Genomics Core Facility, Institut de Biologie de l’ENS (IBENS), Département de biologie, École normale supérieure, CNRS, INSERM, Université PSL, Paris, France
- 4Virologie et Immunologie Moléculaire, INRAE, Université Paris-Saclay, Jouy-en-Josas, France
- 5Institute for Integrative Biology of the Cell (I2BC), CEA, CNRS, Université Paris-Sud, Université Paris-Saclay, Gif-sur-Yvette, France
- 6Plate-Forme d’Infectiologie Expérimentale-PFIE-UE1277, Centre Val de Loire, INRAE, Nouzilly, France
Porcine reproductive and respiratory syndrome (PRRS) has an extensive impact on pig production. The causative virus (PRRSV) is divided into two species, PRRSV-1 (European origin) and PRRSV-2 (North American origin). Within PRRSV-1, PRRSV-1.3 strains, such as Lena, are more pathogenic than PRRSV-1.1 strains, such as Flanders 13 (FL13). To date, the molecular interactions of PRRSV with primary lung mononuclear phagocyte (MNP) subtypes, including conventional dendritic cells types 1 (cDC1) and 2 (cDC2), monocyte-derived DCs (moDC), and pulmonary intravascular macrophages (PIM), have not been thoroughly investigated. Here, we analyze the transcriptome profiles of in vivo FL13-infected parenchymal MNP subpopulations and of in vitro FL13- and Lena-infected parenchymal MNP. The cell-specific expression profiles of in vivo sorted cells correlated with their murine counterparts (AM, cDC1, cDC2, moDC) with the exception of PIM. Both in vivo and in vitro, FL13 infection altered the expression of a low number of host genes, and in vitro infection with Lena confirmed the higher ability of this strain to modulate host response. Machine learning (ML) and gene set enrichment analysis (GSEA) unraveled additional relevant genes and pathways modulated by FL13 infection that were not identified by conventional analyses. GSEA increased the cellular pathways enriched in the FL13 data set, but ML allowed a more complete comprehension of functional profiles during FL13 in vitro infection. Data indicates that cellular reprogramming differs upon Lena and FL13 infection and that the latter might keep antiviral and inflammatory macrophage/DC functions silent. Although the slow replication kinetics of FL13 likely contribute to differences in cellular gene expression, the data suggest distinct mechanisms of interaction of the two viruses with the innate immune system during early infection.
Introduction
Although there have been several improvements in swine breeding, management, and health achieved in recent decades, porcine reproductive and respiratory syndrome (PRRS) remains one of the top challenges for the pig industry.
The causative virus (PRRSV) presents a vast genetic diversity worldwide and has been divided into two species, PRRSV-1 (European origin) and PRRSV-2 (North American origin) (1). The European subspecies PRRSV-1 is further divided into 4 genetic subtypes (2), and viral strains within these subtypes show strong differences in levels of virulence (3, 4).
In the lung tract, PRRSV mainly affects lung mononuclear phagocytes (MNP), in particular, alveolar macrophages (AM) and pulmonary intravascular macrophages (PIM) (5). Several immunoprofiling studies have been published on the effect of PRRSV infection on AM with comprehensive reviews provided (6, 7). Overall, cytokine expression and production are strain-dependent and differ between in vitro and in vivo conditions. In vitro differentiated macrophages and dendritic cells (DC) present variable susceptibility to PRRSV according to the culture conditions (8). In vivo primary DC subtypes do not support a productive replication, but the infection modulates their cytokine production and capacity to polarize T helper cells (9).
Early transcriptomic studies tried to highlight the complex and contrasting patterns triggered by different PRRSV strains (10–12). However, the heterogeneity of experimental designs, strains, and employed technologies have made it difficult to identify common and specific biological functions altered by PRRSV with only partial insights provided by the meta-analysis of available infection studies (13). Moreover, obtaining adequate transcriptional information for deriving biological interpretation can be challenging when dealing with low input amounts (e.g., specific cell subsets or single cells) as well as with low-virulent strains and early infection phases. AM is the most studied population with few other studies on peripheral blood mononuclear cells (14, 15) and tracheobronchial lymph nodes (16), but no genome-wide transcriptional studies have been reported yet for lung primary parenchymal MNP.
Classical statistics may be limited in handling data sets from biological studies using “Omics” methods (17). As a complement or alternative to classical approaches, supervised machine learning (ML) offers the possibility to accommodate heterogeneity of data and is robust to biological variation. ML helps to classify transcriptomic data by pattern recognition (expression “fingerprinting”) and provides mechanistic insights when paired with other downstream procedures, such as pathway analysis (18, 19). ML has been used in transcriptomic studies of viral infections in humans (20, 21) and was recently applied to identify genes associated with feed efficiency in pigs (22).
Here, we adopted an integrated gene expression approach to characterize different MNP subpopulations (macrophages and DCs) infected with the low-virulent Flanders 13 (FL13) strain (subtype 1.1) both in vivo and in vitro and analyzed a complementary in vitro experimental infection with high-virulent Lena (subtype 1.3). A low number of differentially expressed genes (DEGs) were found upon FL13 infection compared to mock-infected cells both in vivo and in vitro although the considerably higher number of DEGs triggered by the Lena in vitro infection confirmed the strong modulation induced by this strain. Classical DEG-based and gene set enrichment analysis (GSEA) approaches showed limited resolution on the in vitro FL13 data set, whereas ML provided additional biological insight into the gene expression modulation triggered by this strain.
Overall, our results indicate that the cellular and metabolic reprogramming differ between high and low pathogenic strains: FL13 keeps antiviral and inflammatory macrophage/DC functions silent, suggesting a different mechanism of pathogenesis upon early infection compared to the highly pathogenic Lena. This underlines the added value in biological interpretation of ML techniques for unraveling genomic signatures hidden with classical statistics approaches.
Materials and Methods
Virus Production and Titration
The two strains of PRRSV-1 used in this study, FL13 (13V091) (23) and Lena (3), were kindly provided by Dr. Hans Nauwynck (University of Ghent, Belgium). FL13 (13V091) was isolated in Belgium in 2013. This virus belongs to the usually low pathogenic pan-European subtype 1.1 but has spread rapidly in pig populations with good replicating capacity in macrophages (23). In subsequent in vivo and in vitro investigations, it did not reveal abnormal pathogenicity, and in our system, it behaved as a low pathogenic strain (personal communication) (9, 24). The Lena strain is a highly virulent strain belonging to the 1.3 subtype (2) isolated in Belarus in 2007 from a herd showing high mortality, reproductive failures, and respiratory disorders (3). Lena and FL13 viral stocks were produced using fresh AMs. Supernatants from infected cells were clarified by centrifugation at 3,300 G, filtered on 0.8 µm. Then, 30 ml of supernatant was layered on 4 ml 17% sucrose cushion and centrifuged at 100,000 G for 5 h, 30 min. The pelleted viruses were resuspended in RPMI medium. Titration of viruses was performed on fresh primary AM using the Spearman-Karber TCID50 method according to the OIE manual of diagnostic tests (OIE, “Chapter 2.8.7 Porcine Reproductive and Respiratory Syndrome,” Terr. Man., no. May 2015, 2015).
In Vivo Infection
For the in vivo experiment, PRRSV-1 FL13 infection was performed at PFIE (INRAE, Nouzilly, France). The animal experiment was authorized by the French Ministry for Research (authorization no. 2015051418327338), and protocols were approved by the national ethics committee (APAFIS#413). Six large white female pigs coming from an INRAE breeding unit (Unité Expérimentale de Physiologie Animale de l’Orfrasière PAO-INRA, Nouzilly), free of respiratory infections and tested free from PRRSV, were housed in biosecurity level 2 air-filtered animal facilities. Treatments, housing, and husbandry conditions conformed to the European Union Guidelines (directive 2010/63/EU on the protection of animals used for scientific purposes). At 8–9 weeks of age, three pigs were inoculated intranasally with FL13 (5x10⁵ TCID50/per animal in 2.5 ml per nostril), and three were mock infected. Five days postinfection (pi), the animals were euthanized (Zoletil, Virbac, France) and exsanguinated. Lung cells were collected and processed as previously described (9, 25, 26). Briefly, broncho-alveolar lavage (BAL) cells were collected using PBS + 2 mM EDTA. After the BAL procedure, peripheral parenchymal tissue from diaphragmatic lobes (PAR) were sampled, minced, and incubated in complete RPMI plus 2 mg/ml collagenase D (Roche, Meylan, France), 1 mg/ml dispase (Invitrogen), and 0.1 mg/ml Dnase I (Roche). Digested PAR was crushed and filtered on 100-µm cell strainers. Red blood cells were lysed using erythrolysis buffer (10 mM NaHCO3, 155 mM NH4Cl, and 10 mM EDTA). Cells were washed in PBS/EDTA and frozen in FBS + 10% dimethyl sulfoxide (DMSO, Sigma-Aldrich, St Louis, MO) for further analysis.
Cell Sorting and Flow Cytometry Analysis
Isolated frozen BAL and PAR cells were separately enriched in MNP cells by 1.065 density iodixanol gradient (Optiprep®, Nycomed Pharma, Oslo, Norway) as previously described (9). They were stained in a blocking solution composed of PBS/EDTA supplemented with 5% horse serum and 5% swine serum. Antibodies were added to the blocking solution for 30 min on ice and then washed in PBS/EDTA with 2% FBS (for list of antibodies refer to Supplementary Table 1). Staining was accomplished in 4 steps: the uncoupled primary antibodies of different species/isotypes (mouse IgG1 anti CD13, mouse IgG2b anti-CD172a, mouse IgG2a anti MHC-II) followed by the secondary species/isotype specific fluorochrome-coupled antibodies (anti-mouse IgG1-Alexa647, anti-mouse IgG2a-PE-Cy7, anti-mouse IgG2b APC-Cy7); then, the biotinylated primary antibody anti-CD11c followed by the streptavidin-coupled Alexa700 along with the fluorochrome-coupled primary antibodies anti-CD163-PE and anti-CD1-FITC. A saturation step with IgG1, IgG2a, and IgG2b irrelevant antibodies was performed between the second and the third step. DAPI staining (Sigma-Aldrich) was performed to exclude dead cells. Compensations were set according to monocolor staining. The MoFlo ASTRIOS sorter (Beckman-Coulter, Paris, France) was used to isolate specific cell subpopulations. FlowJo software (version 10.1.0, Tree Star, Ashland, OR) was used to analyze subpopulation prevalence and purity. Cells were analyzed using an LSR Fortessa cytometer and Diva software (Becton Dickinson, Franklin Lakes, New Jersey) during standardization.
In Vitro Infection
For in vitro experiments, lungs were obtained from the same breeding unit as for the in vivo study (Unité Expérimentale de Physiologie Animale de l’Orfrasière PAO-INRA, Nouzilly, France). All tested samples were negative for PRRSV. Lung parenchymal immune cells were collected and processed as described in the in vivo section. Parenchymal cells were then enriched in MNP cells by 1.065 density iodixanol gradient (Optiprep®, Nycomed Pharma, Oslo, Norway) as previously described (9). The cell composition of this gradient-enriched MNP preparation has been analyzed in detail in (9). The MNP was infected with either FL13 or Lena. All infections were performed on freshly enriched MNP at 2.106 cells/ml for 24 h in complete RPMI at MOI 0.5. In order to avoid MNP adherence, incubations at 37°C were performed in 2-ml tubes with drilled caps for air renewal, located in a Corning-Costar 50-ml polypropylene tube. A complementary uninfected negative control was included.
Low Input RNA-Seq Library Construction and Sequencing
RNAseq was performed on two sets of samples: 1) cDC1, cDC2, moDC, PIM, and AM cells from the in vivo experiments and 2) gradient-enriched MNP from the in vitro experiments.
Total RNA from cells was extracted directly after sorting using the Arcturus PicoPure RNA Isolation kit (ThermoFisher Scientific, Waltham, US) according to the manufacturer’s instructions. The RNase-Free DNase Set (Qiagen, Europe) was used to remove contaminating DNA. RNA integrity was assessed using an RNA 6000 Pico kit on a Bioanalyzer 2100 (Agilent Technologies, Santa Clara, US). RNA sequencing library preparation and Illumina sequencing were performed at the IBENS genomic core facility (Ecole Normale Superieure, Paris, France). Briefly, 1–3 ng of total RNA were amplified and converted to cDNA using the SMART-Seq v4 Ultra Low Input RNA kit (Clontech, Takara Bio Europe, Kyoto, Japan). Afterward, 150 pg of amplified cDNA were used to prepare the libraries with the Nextera XT DNA kit (Illumina, San Diego, US). The first set of libraries was sequenced in 30-plex on 3 high-output flow cells, and the second set was sequenced in 12-plex on 1 high-output flow cell. A 75-bp read sequencing was performed on a NextSeq 500 sequencer (Illumina, San Diego, US). Respectively, a mean of 50 ± 5.7 and 40 ± 3.7 million passing Illumina quality filter reads was obtained for samples from the first and second experiments.
RNAseq Data Analysis
The analyses were performed using the Eoulsan pipeline (27), which included the steps of read filtering, mapping, alignment filtering, read quantification, normalization, and differential analysis. Before the mapping step, poly N read tails were trimmed, reads shorter than 40 bp were removed, and reads with a mean quality ≤30 were discarded. Reads were then aligned against the Sus scrofa 11.1 genome from Ensembl version 91, FL13 (GenBank accession number: KT159248) or Lena virus (GenBank accession number: JF802085.1) using STAR (version 2.5.2b) (28). Alignments from reads matching more than once on the reference genome were removed using the Java version of samtools (29). To calculate gene expression, the Sus scrofa GTF genome annotation version 91 from the Ensembl database was used. All overlapping regions between alignments and referenced exons (or genes) were counted using HTSeq-count 0.5.3 (30).
The RNAseq gene expression data and the raw FASTQ files were submitted to GEO (www.ncbi.nlm.nih.gov/geo/) and are available under the accession number GSE147632.
The normalization step and the differential analyses were carried out with DESeq2 1.8.1 (31). The expression matrix thus obtained was then filtered to retain the genes with a minimum 2-fold change across all samples and used to perform a principal component analysis (PCA) with FactoMineR (32) and a clustering analysis subject to multiscale bootstrap resampling with Pvclust (33) in the R statistical environment.
Machine Learning
To perform ML of the FL13-infected and control MNP in vitro data sets, the normalized count matrix and the attributes (genes) obtained from each replicate (n = 4) were used. The normalized count matrix was used for both classical statistics and ML approaches. A first data reduction was performed by removing genes without expression and genes with no consistent replicate values, which generated approximately 16,000 genes that were subsequently used for the downstream ML approach.
The Waikato Environment for Knowledge Analysis (WEKA version 3.8.4, www.cs.waikato.ac.nz/ml/weka/) was used to perform the sequential minimal optimization (SMO) support vector machines (SVMs) learning classifier algorithm (34) together with decision tree approaches (random forest or RF and J48 algorithms) and multilayer perceptron (MLP) neural network (19). Genes were ranked based on Shannon entropy (information gain) in dichotomous classification assignment by SVMs (35). The SVMs, RF, and J48 were used to classify the FL13- and mock-infected gene data set in a data dimensionality reduction approach as previously described (36). MLP was used when the data set was reduced to below 2,000 genes due to the high computing capacity needed for the algorithm.
Class assignment of all ML algorithms was evaluated by two cross-validation strategies: 1) a percentage split whereby 66% of the data were randomly selected and used for training and the remaining 34% of the data were used in testing and 2) a stratified hold-out (n-fold) method with 4-fold, in which 3-fold of the randomized gene expression data were used for training and 1-fold was used for testing. A 4-fold stratified holdout was used for SVMs, RF, and J48 cross-validation when the samples were classified as FL13 or control using the complete gene expression data set. In all cross-validations, the SVMs, RF, and J48 were naive to the holdout data and the percentage of correct assignment was used to evaluate classifier performance. All data classes were properly represented in the ML training and cross-validation data sets (37). The performance of the SVMs, RF, and J48 was evaluated as a percentage of correct classification during the cross-validations. Additionally, the Kappa statistic and area under the receiver operating characteristic curve (AUROC) of each model were reported. Kappa statistic and AUROC evaluate the agreement between the actual and assigned classes by a classifier and can be interpreted in a way similar to a p-/q-value of classical statistics (19). The random probability of chance for dichotomous assignment was assumed to be 50% based on the law of probability. A negative Kappa statistic and/or an AUROC of less than 0.500 indicates that ML classifier performance is worse than that predicted by random assignment. As a negative control of ML, the values for the 900 relevant gene data sets were randomly reordered 10 times, and each was entered into ML and analyzed with SVMs, RF, and J48 as described above. The results of these negative control models were interpreted based on expectations of the law of probability.
Generation of Cell-Specific Gene Signatures and High Throughput GSEA
All the murine microarray data used in the study were obtained from GEO and generated using the Affymetrix Mouse Gene 1.0 ST array (Thermo Fisher Scientific, Waltham, US). Three data sets were used to match as much as possible the diversity of the cell types studied. We selected the data sets in such a way that at least one cell type was found in common in order to enable validation of data set effect correction. Two data sets were generated by the Immgen consortium (GEO accession numbers GSE15907 and GSE37448), and a third data set was generated by the Murphy laboratory [GSE75015, (38)].
The list of microarray samples used, their GEO identification numbers, and expected associated cell populations are provided in Supplementary File 1 (murine_microarrays_EC_study.csv).
Raw CEL files were processed in the R statistical environment (version 3.6.1). Quality control of the array hybridization and normalization of the raw expression data with robust multi-chip analysis (39) were performed using the “oligo” R package (40). Presence of a putative batch effect was evaluated by a PCA, which revealed an effect due to data sets. This was corrected using the ComBat batch correction algorithm from the “sva” R package (41).
BubbleGUM software (42) was used to generate splenic and lung MNP subset and porcine blood (GSE66311) cell subset specific transcriptomic signatures and to assess their enrichment across pig lung cell types in a similar way as in Carpentier et al. (43).
Using GeneSign, gene signatures of murine and porcine cell subsets were generated (i.e., the lists of genes that are more highly expressed in the cell subsets of interest as compared to other cell subsets) using the “MinTest/MaxRef” calculation method with a minimal fold change of 1.0 or 1.2 (home_made_signatures_PIG_symbols_EC_study.csv, Supplementary File 2) (porcine_blood_cell_signatures_EC_study.cvs, Supplementary File 3). The murine MNP signature Affymetrix IDs were then converted into the official symbols of their porcine gene orthologs using Ensembl BioMart (44) (Supplementary File 2).
To run BubbleMap, we used these signatures together with a list of 50 independent GeneSets from MSigDB (45) for statistical power. BubbleMap was used with 1,000 gene set–based permutations and with “signal to noise” as a metric for ranking the genes. The results are displayed as a BubbleMap, in which each bubble is a GSEA result and summarizes the information from the corresponding enrichment plot.
Unsupervised Hierarchical Clustering and Multiscale Bootstrap Resampling
For the transcriptomic data, only the genes displaying a fold change >2 across all conditions were considered. The robustness of the tree was tested by multiscale bootstrap resampling using the pvclust package with parameters “correlation” as distance and “Ward.D2” as cluster method with 1,000 iterations at 10 different data set sizes comprising between 50% and 140% of the complete data set.
Functional Analyses of the Transcriptome
Functional analyses of swine RNAseq data were performed using two approaches. First, all the DEG lists obtained from both in vivo and in vitro experiments and the gene list obtained by ML were analyzed with Ingenuity Pathways Analysis 01-16 (IPA, version 51963813, March 2020 release, Qiagen, Hilden, Germany). Only the canonical pathways with a –log (p-value) >2 and including at least 4 genes were considered. A second analysis was performed using GSEA (version 4.0.3, http://software.broadinstitute.org/gsea/index.jsp). The analysis was carried out using the “h.all.v7.1” and “c2.cp.kegg.v7.1” MsigDB gene sets, with 2,500 permutations and the “gene_set” option as permutation type. Prior to both analyses, the porcine gene names were converted into their human orthologs using the “dbOrtho” tool of bioDBnet (https://biodbnet-abcc.ncifcrf.gov/db/dbOrtho.php) in order to match the MSigDB gene set human symbols.
RT-qPCR
Quantification of viral particles using RT-qPCR detection was performed in swabs and sera, using FL13 N gene primers (F: 5’ GGGAATGGCCAGTCAGTCAA 3’, R: 5’ ATCTTCAGCAGCTAGGGGGA 3’) (46) and setting a limit of detection at Ct = 35. Briefly, viral RNA was extracted using the NucleoSpin® RNA Virus kit (Nagel-Macherey GmbH, Düren, Germany). A one-step qRT-PCR was performed using the iTaqTM universal probes one-step kit (BIO-RAD, Hercules, CA, USA). A standard curve was made with four 10-fold dilutions of the FL13 inoculum (101 to 104 TCID50/mL). The number of TCID50-equivalent/mL in each sample was determined using the FL13 RNA standard calibration curve.
Based on the transcriptomic analyses, a panel of porcine genes was selected for qPCR validation of RNAseq data. Primers were designed with PrimerExpress 3.0 using standard parameters (Thermo Scientific, Waltham, US), and the potential formation of primer dimers was further evaluated using the “Multiple Primer Analyzer” web tool (Thermo Scientific, Waltham, US). Primer sequences are provided in Supplementary Table 2.
The qPCR validations were performed on residual cDNA after RNA-seq library preparation. The cDNA concentrations were estimated with a Qubit (Thermo Fisher Scientific, Waltham, US) and normalized to 80 pg/µl in a final volume of 100 µl.
Amplification reactions were run in duplicate on a QuantStudio™ 12K Flex (Thermo Fisher Scientific, Waltham, US). First, we validated primer efficiency with a standard curve of four serial dilution points of cDNA (ranging from 1,000 pg to 1 pg of cDNA) and a no template control (NTC). The qPCR amplification mixture (20 µL) contained 5 µL single-strand cDNA template (400 pg for each reaction), 10 µL 2X Power SYBR Green PCR Master Mix buffer (Thermo Fisher Scientific, Waltham, US), and forward and reverse primer (final concentration of 100 nM each) for the genes BIRC5, ATP2C1, COX5B, ATG5, ENS13436 (CYT B-C1-10), CYC1, and SHARPIN and forward and reverse primer (final concentration of 300 nM each) for the genes STMN1, DTX4, COX5A, and GAPDH. After primer optimization (with range of efficiency -3.32 to -3.4), the qPCR reactions were run in triplicate on a QuantStudio™ 12K Flex (Thermo Fisher Scientific, Waltham, US), and the quality control of data was performed using the Connect platform (Thermo Fisher Scientific, Waltham, US). The data were subsequently downloaded as .txt files and analyzed by the ΔΔCt method.
The correlation among the fold change values obtained by qPCR and the corresponding ones obtained by RNAseq was evaluated using a Spearman’s Rho test.
Results
FL13 In Vivo Infection
Pigs were infected or mock-treated with FL13, and nasal swabs and sera were collected at days 0 and 5 pi. As expected, at 5 days pi, the swabs and sera of FL13-infected animals were positive (between 50 and 5,000 TCID50-equivalent/mL; Supplementary Figure 1A). Animals did not show evident clinical signs, and lungs presented only mild lesions at culling (data not shown), which was compatible with the early stage of the infection and with the low pathogenicity of the strain.
Isolation and Sorting of Enriched MNP From Lung Tissues
Enriched MNP isolated from BAL or from lung parenchyma (100–200.106/sample) were stained with a 7-color flow cytometry strategy as described in the Materials and Methods section, following the strategy used in (9), to sort AM, PIM, moDC, cDC1, and cDC2 (25). Because of a 1-year-long commercial anti-CADM1 antibody shortage in the United States and Europe, the protocol was modified to use CD13 instead of CADM1 to gate cDC1. We took advantage of the identification of CD13 as a cDC1 marker in bovine blood (47) and human lung (48) to use antiswine CD13 monoclonal antibodies generated in our laboratory (49). The new cDC1 gating was validated as MHCII+, CD11c+, CD13+, CD172a-, and CD163- (Figure 1A) and allowed the identification of the very same cells as the one stained using anti-CADM1 antibodies (Supplementary Figure 2).
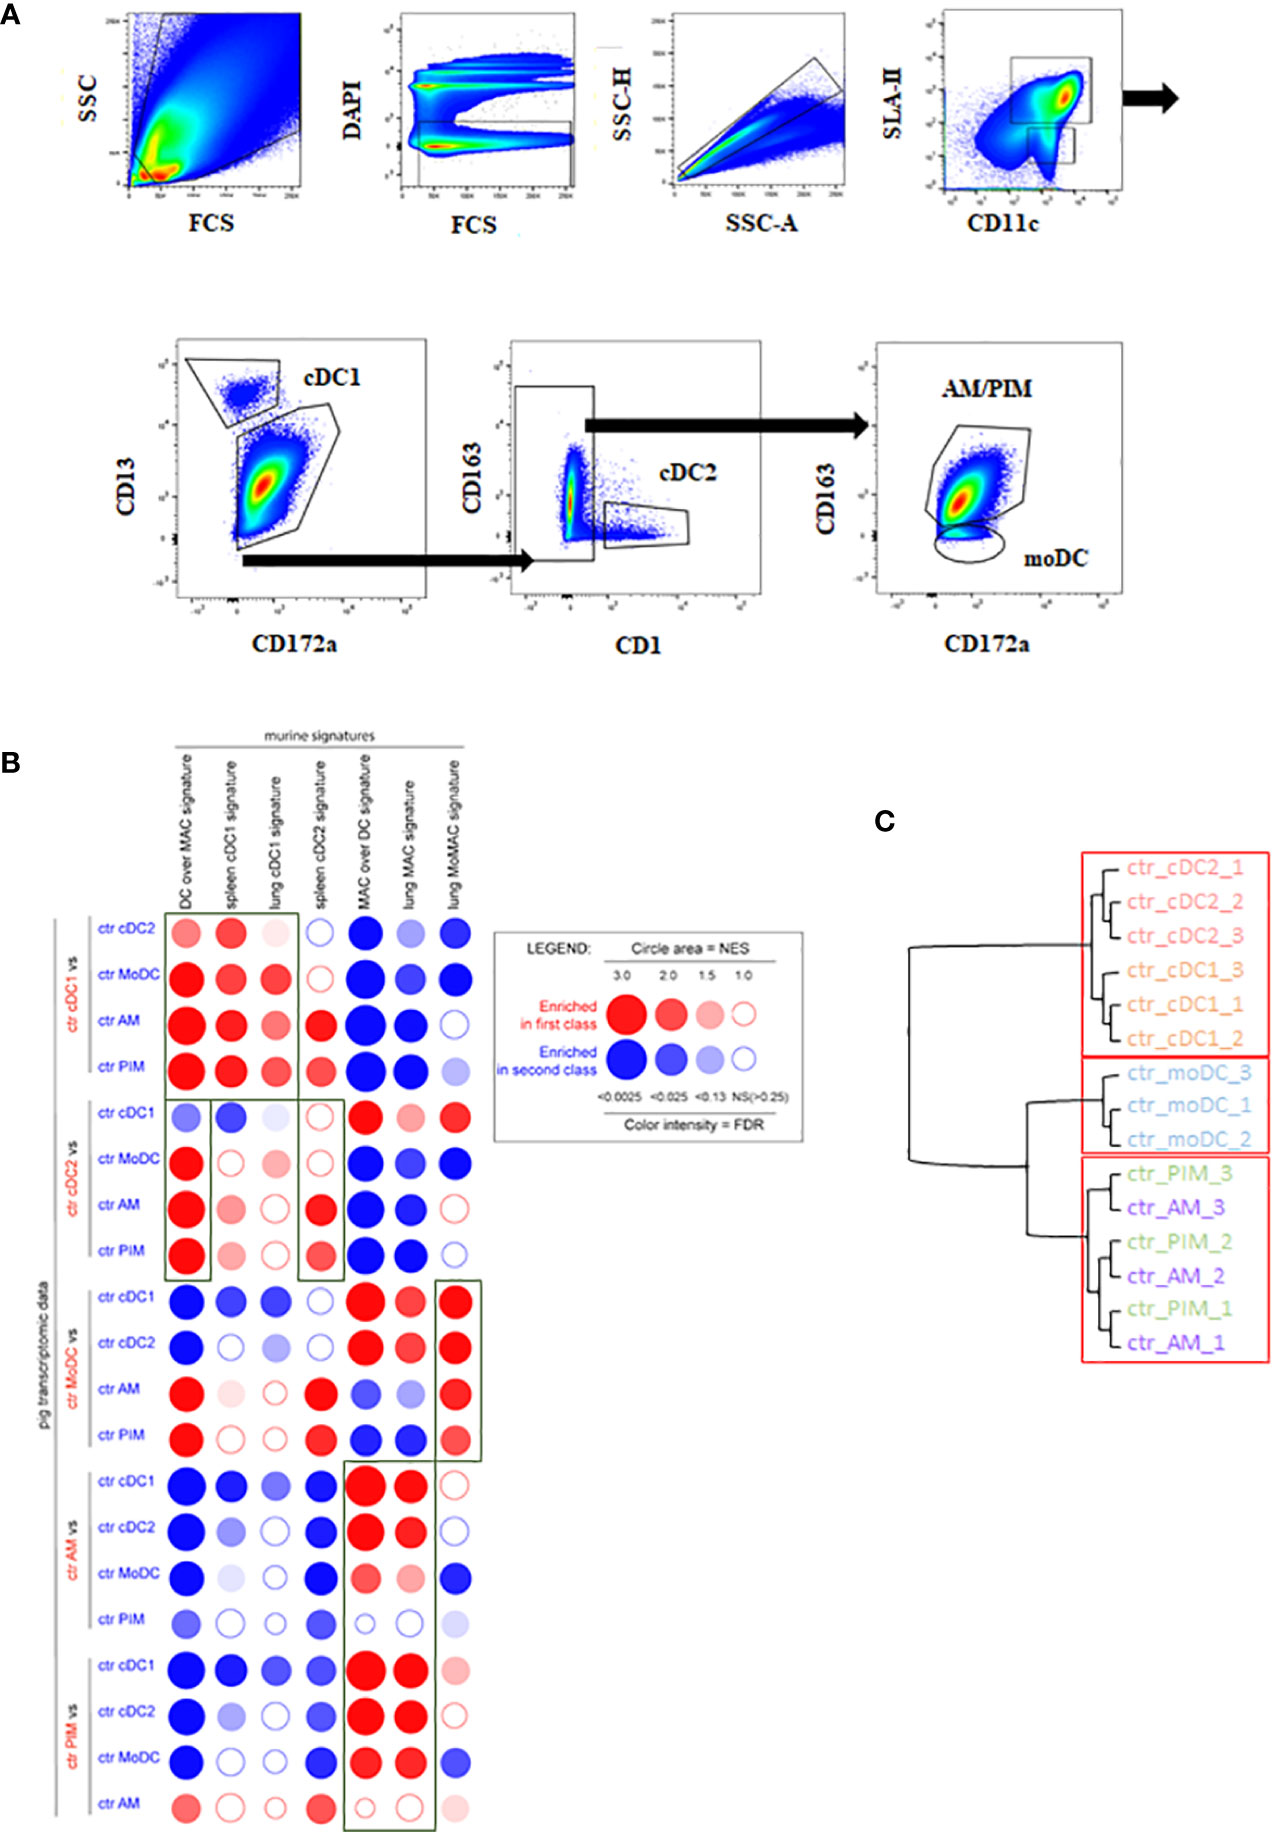
Figure 1 MNP subpopulations sorting strategy in vivo. cDC1, cDC2, moDC, AM, and PIM were sorted from infected or control lung parenchyma at day 5 pi. (A) MNP subpopulations were defined by using MHC-II/CD11c/CD172a/CD13/CD163 markers. Each graph is the offspring of the previous gate from left to right or following the arrows. Data are representative of 3 independent sorting experiments. (B) Analysis of the homologies between porcine and mouse MNP subsets by high throughput GSEA using BubbleGUM. Data are represented as bubbles, bigger and darker for stronger and more significant enrichment in a color matching that of the population in which the gene set was enriched. Boxes correspond to enrichments of interest. (C) Unsupervised hierarchical clustering and multiscale bootstrap resampling on the transcriptome of sorted MNP from control animals. An approximately unbiased (AU) p-value was calculated for each node of the cluster dendrogram. Clusters with AU ≥ 95% are indicated by the rectangles.
After sorting, 105 cells per subtype were obtained except for the cDC1 and cDC2 subsets for which the cell number ranged between 1,800 and 63,000 cells, depending on the sample.
Transcriptional Signatures of MNP Subsets
A total of 30 cDNA libraries from the cell populations of the two groups (FL13-infected and control) were sequenced, which yielded 50 ± 5.7 M reads/sample mapped to the pig genome.
The RNAseq data of the different porcine pulmonary MNP were compared, using BubbleGUM with murine MNP signatures in order to validate the sorting strategy (42).
By performing pairwise comparisons of porcine immune cell types, we examined the distribution bias of transcriptomic signatures specific for putatively equivalent mouse immune cells using the GSEA methodology as previously published for the comparison of human and mouse cell types (50) (Figure 1B).
The mouse DC over MAC [i.e., genes more highly expressed in murine DC as compared to mouse lung macrophage (MAC)] signature was systematically and strongly enriched in DC subsets (cDC1, cDC2) and moDC when compared to macrophages (AM, PIM), thus validating the DC identity of these 3 cell types. Moreover, the DC over MAC signature was enriched in cDC1 and cDC2 when compared to moDC. The mouse spleen cDC2 signature was systematically enriched in porcine cDC2 although non significantly when compared to cDC1 and moDC, whereas spleen and lung cDC1 signatures were systematically enriched in cDC1 versus all the other lung MNP. The lung MAC signature was significantly enriched in porcine AM except for comparison with PIM. Similarly, the mouse MAC over DC signature (i.e., genes more highly expressed in murine macrophages as compared to DC) was significantly enriched in porcine AM except for comparison with PIM, in agreement with the absence of this subpopulation in mice (5, 51). The mouse monocyte-derived cell signature (lung MoMAC) was significantly enriched in moDC in agreement with a differentiation from blood monocytes of porcine moDC (Figure 1B). Alternatively, we also compared porcine lung MNP transcriptomic data with porcine blood mononuclear cell signatures generated from data obtained in a previous work (Supplementary Figure 3) (52). The cDC1 blood signature was clearly enriched in the lung cDC1 when compared to all other lung cell subsets. The classical monocyte (cMo) signature was enriched in the moDC, PIM, and AM when compared with cDC, confirming the monocyte–macrophage functional bias. The population defined as nonclassical monocytes (ncMo) resembled more the moDC population. Finally, the B lymphocyte signature was not enriched in our lung cells, and the pDC signature had very little enrichment in lung DC subsets when compared with AM and PIM.
Additionally, to test the similarity of expression patterns between MNP replicates, a hierarchical clustering was performed on the pulmonary MNP data (Figure 1C). As expected, the approach showed a clear segregation between lung tissue-resident macrophages (AM and PIM) and lung cDC (cDC1 and cDC2). The clustering put in evidence the clear difference between cDC and moDC because moDC preferentially clusters with AM and PIM, whereas AM and PIM did not cluster separately, highlighting their similarity and probable common origin (Figure 1C) (5). The AM versus PIM contrast showed the lowest number of DEGs, and all the other contrasts highlighted high differences between the diverse cell subtypes (Supplementary Table 3A).
Overall, the high-throughput GSEA using murine and blood porcine signatures validated and confirmed the identities of the porcine lung MNP isolated with the new sorting strategy.
Mild Effects of FL13 Infection on MNP Subsets In Vivo
We investigated the level of infection in each cell subtype by mapping the sequences to the FL13 reference genome sequence. As expected, AM and PIM showed the highest level of FL13 matching reads compared with DC subtypes (Supplementary Figure 1B). The moDC, cDC1, and cDC2 cells showed low levels of FL13 matching reads (45–480 reads), which is compatible with either PRRSV abortive infection, endocytosis of viral particles, or phagocytosis of infected apoptotic cells by the three DC subtypes and comparable to our previous results (9).
To evaluate the impact of FL13 infection on the different MNP subsets, we performed PCA (Supplementary Figure 4A) and a hierarchical clustering (Supplementary Figure 4B) on the transcriptomes of MNP from control and infected animals. Both approaches showed a clear lack of separation between cells from FL13-infected and control animals, highlighting the scarce modifications induced upon FL13 infection that are probably related to the low pathogenicity of the strain and/or to the mild effects at the early stage of infection.
Evidence of Cell Cycle Arrest and Apoptosis in FL13 Infected-AM and PIM In Vivo
In order to gain insight into the similarities and differences each MNP subset transcriptionally undergoes upon FL13 infection, we performed a BubbleMap analysis, using as gene sets the DEGs identified in each MNP subset upon infection and comparing each MNP subset from control and infected animals (Figure 2A). This analysis revealed that the genes that were significantly up- and down-regulated in cDC1, cDC2, and moDC from infected animals were also found to be globally up- and down-regulated in all other MNP from infected animals, including AM and PIM, although to a lesser extent. However, genes found that significantly up- and down-regulated in AM and PIM were globally also found similarly regulated in PIM and AM, respectively, but not in DC subsets, most likely because these genes are modulated by the PRRSV productive infection of PIM and AM (9) (Supplementary Figure 1B). Interestingly, the genes up-regulated in moDC upon infection were not, as a group, found regulated in the AM subset (Figure 2A) in agreement with the respective pro- and anti-inflammatory functions of moDC and AM.
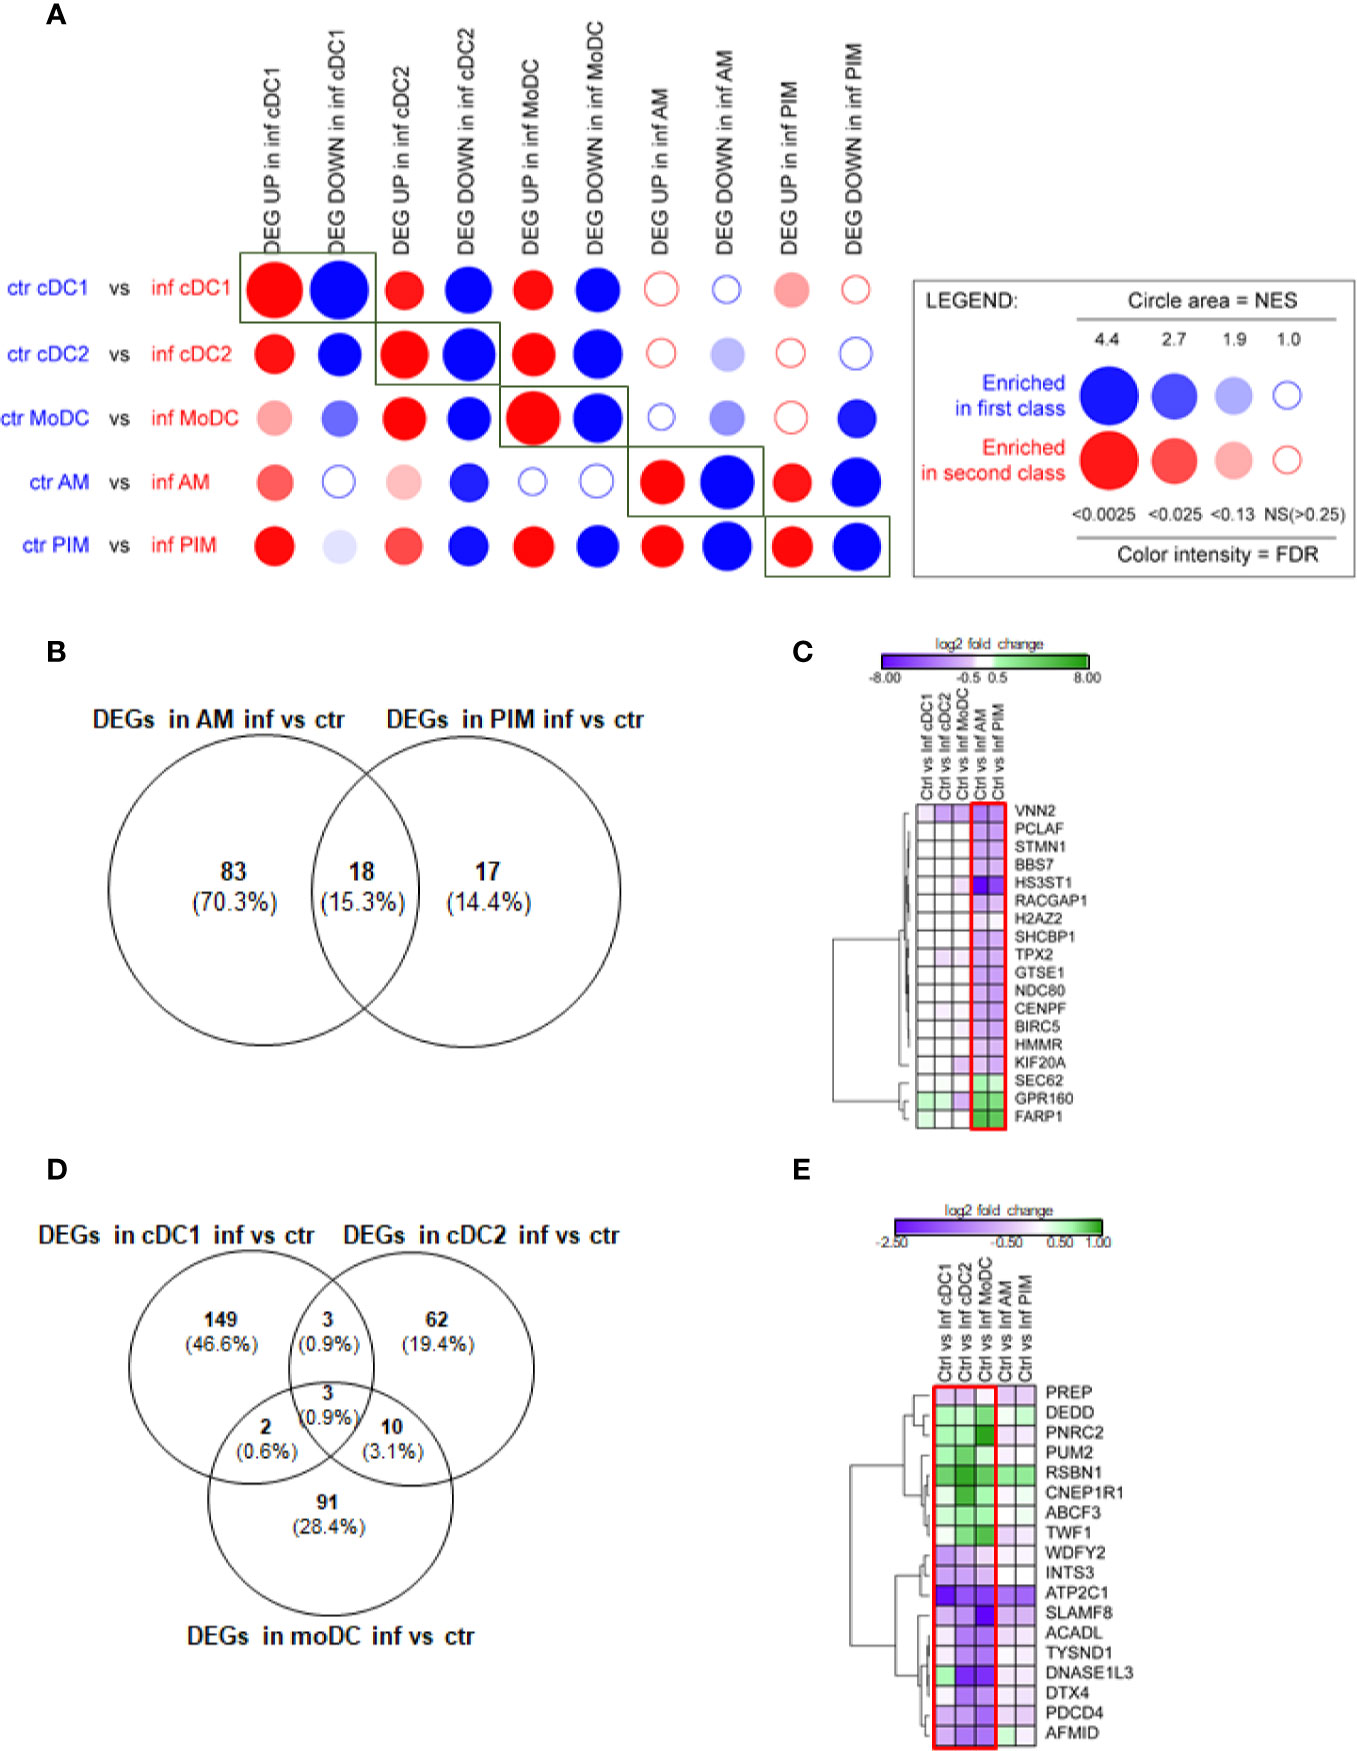
Figure 2 FL13 in vivo infection. Macrophages (AM, PIM) and DC subsets (moDC, cDC1, and cDC2) sorted from FL13 (inf) and control (ctr) animals at day 5 pi. (A) Analysis of the DEGs between the different MNP subsets by high throughput GSEA using BubbleGUM. Control/validation enrichments, in which genes identified as DEGs in a given cell subset between control and FL13 infected animals were found enriched by BubbleMap in the respective counterparts, are highlighted by rectangles. (B) Venn diagram of DEGs identified in all macrophage subsets based on the contrast of AM and PIM from infected versus control animals and a FDR < 0.05. (C) Heatmap displaying the log2 ratios of the DEG shared between AM and PIM from infected versus control animals as shown in Figure 2B. Three and 15 DEGs are up- (green) and down- (purple) regulated, respectively. Red box includes DEGs with FDR < 0.05. (D) Venn diagram of DEGs identified in all 3 DC subsets based on the contrast of cDC1, cDC2, and moDC in infected versus control animals and a FDR < 0.05. (E) Heatmap displaying the log2 ratios of the DEGs shared between at least two DC subsets from infected versus control animals as shown in Figure 2D. DEGs are up- (green) and down- (purple) regulated. Red box includes DEGs with FDR < 0.05 in at least two DC subtypes.
When focusing on DEGs (FDR < 0.05), AM from FL13-infected animals showed 101 DEGs compared to AM from control animals, whereas PIM showed only 35 DEGs in infected versus control animals (Figure 2B). Thus, PRRSV-1 triggered a limited gene modulation on PIM compared to AM although they presented similar virus levels [Supplementary Figure 1 and (53)]. Interestingly, upon FL13 infection, PIM shared more than half of their DEGs (18, of which 15 down-regulated and 3 up-regulated) with AM (Figure 2C). Log2 FC levels of DEGs were similar between AM (Mean -1.22 ± 2.7 SD) and PIM (Mean -1.13 ± 1.8 SD).
BIRC5 and STMN1 were validated by qPCR (Supplementary Table 4). BIRC5 [a member of the inhibitor of apoptosis protein (IAP) family that prevents apoptotic cell death] was down-regulated together with 7 other genes (CENPF, GTSE1, HMMR, KIF20A, NDC80, STMN1, and TPX2) involved in the progression of the cell cycle, mitosis, and DNA damage responses. Among them, STMN1 was identified by meta-analysis of PRRV data (13). Thus, our data align with previous studies showing that PRRSV modulates apoptosis (54) and cell cycle in AM while integrating, for the first time, the analysis of the PIM expression.
Upon FL13 Infection, DC Showed Cell Cycle Arrest and an Anti-Apoptotic Profile In Vivo
The number of DEGs found in cDC1 (157) from infected animals was higher than in moDC (106) and cDC2 (55) (Figure 2D) (Supplementary Table 3B).
Only three DEGs (ATP2C1, INTS3, RSBN1) were shared between the three DC subtypes (Figure 2D). ATP2C1 (validated by qPCR, Supplementary Table 4) codes for the SPCA1 protein, an ATP-powered calcium pump that transports calcium ions into the Golgi. SPCA1 regulates proteases within the trans-Golgi network that require calcium for their activity and have been described as critical for the maturation of different virus glycoproteins (56). The tendency (p value > 0.05) of ATP2C1 down-regulation found in macrophages suggests that it might be involved, but not sufficient, in the decreased virus susceptibility described in in vivo DC subtypes (9).
Upon infection, DC displayed the down-regulation of a gene related to the DNA repair and mitotic cell cycle, INTS3, and the up-regulation of RSBN1, a gene involved in chromatin organization.
Three DEGs were exclusively shared by cDC1 and cDC2 from FL13-infected animals (Figure 2E), all involved to a certain extent with protein and peptide cellular turnover: PUM2, a protein involved in the translational control, acting as a post-transcriptional repressor by binding mRNA targets; PREP, a cytosolic endopeptidase with proteolysis function and ENSSSCG00000040538 (WDFY2), a protein and metal ion-binding gene.
MoDC shared several DEGs (11) with cDC2 but only 2 DEGs with cDC1 (Figures 2D, E). The two shared with cDC1, DEDD (a regulator of the apoptosis process, a scaffold protein that directs CASP3 to substrates and facilitates in their ordered degradation during apoptosis) and PNRC2 (a mediator of mRNA decay) were up-regulated. Only 3 (ABCF3, CNEP1R1, TWF1) out of 11 genes shared between moDC and cDC2 were up-regulated in response to infection.
Although the expression profile of macrophages (AM and PIM) from infected animals suggested apoptosis, moDC and cDC2 profiles presented a general down-regulation of apoptosis promoters, such as DNASE1L3 (which promotes DNA breakdown during apoptosis) and PDCD4 (promoter of apoptosis and autophagy) upon infection. We also observed the down-regulation of DTX4 (validated by qPCR, Supplementary Table 4), an important promoter of the innate immune system and regulator of the Notch signaling, involved in DC differentiation (57) and part of the mechanism of degradation of TBK1, belonging to the type I interferon signaling (58).
Finally, ABCF3 has been classified in the defense response to virus GO term. Its silencing has been correlated with increased replication of flavivirus (59). ABCF3 up-regulation mainly in cDC2 and moDC might represent another complementary molecular mechanism to control PRRSV replication in DC. Interestingly, two upregulated DEGs shared by all DC contrasts, i.e., PUM2 and TWF1, had been related to the response to different PRRSV strains by meta-analysis (13).
Pathway Analysis of In Vivo FL13 Infected-Cell Subsets
Due to the low number of DEGs, using IPA, we detected only a few significant pathways in the FL13 PIM versus control contrast that were mainly related to the cell cycle biological process. Similarly, the FL13 AM versus control contrast showed pathways involved in cell cycle process and senescence together with additional metabolic pathways (Figure 3). The GSEA approach (Figure 4) confirmed the IPA findings related to the down-regulation of cell cycle/mitosis/replication and DNA/nucleotide repair capacity in infected AM/PIM and allowed limited additional biological interpretations. AM from infected animals showed down-regulation of the mTOR pathway, unfolded protein response, and phagocytosis function together with the reduction of metabolic pathways related to their altered energetic capacity upon infection. These features were shared between AM and PIM with the data clearly showing that AM were the most affected subset (Figure 4). Thus, both IPA and GSEA pointed to altered cell cycle, DNA repair, and altered metabolism in cells from infected animals together with the apoptotic phenotype of AM and PIM upon FL13 infection.
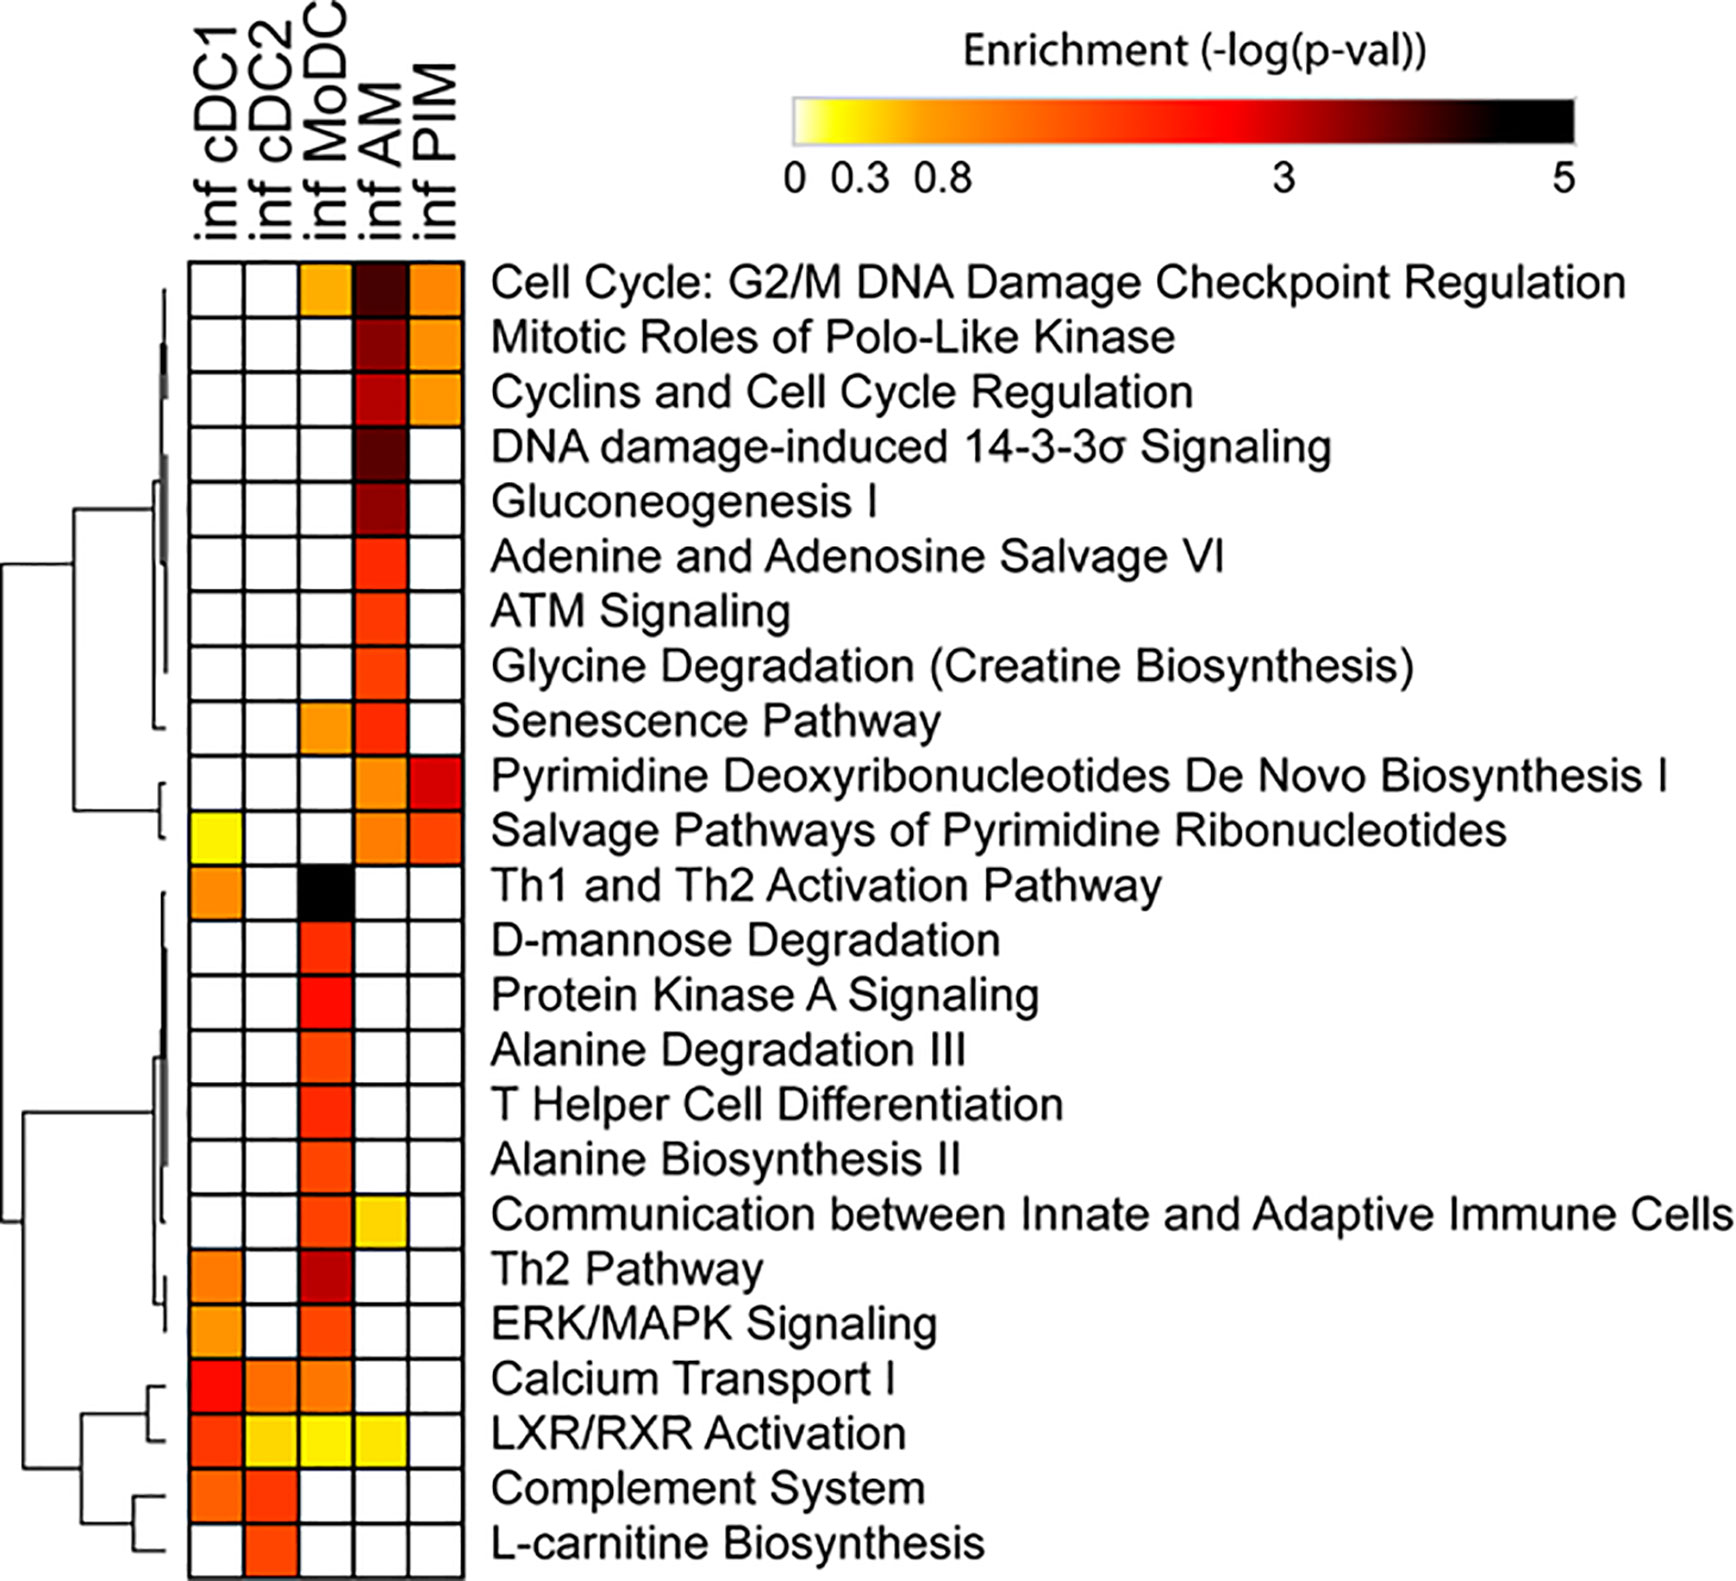
Figure 3 Enrichment of functional annotations in MNP subsets from infected versus control animals using IPA. Heatmap displaying selected functional annotations from IPA found to be enriched in one or more cell subsets from FL13-infected versus control animals. Hierarchical clustering was performed with Morpheus (Broad Institute) using the One minus Pearson correlation and the average linkage method.
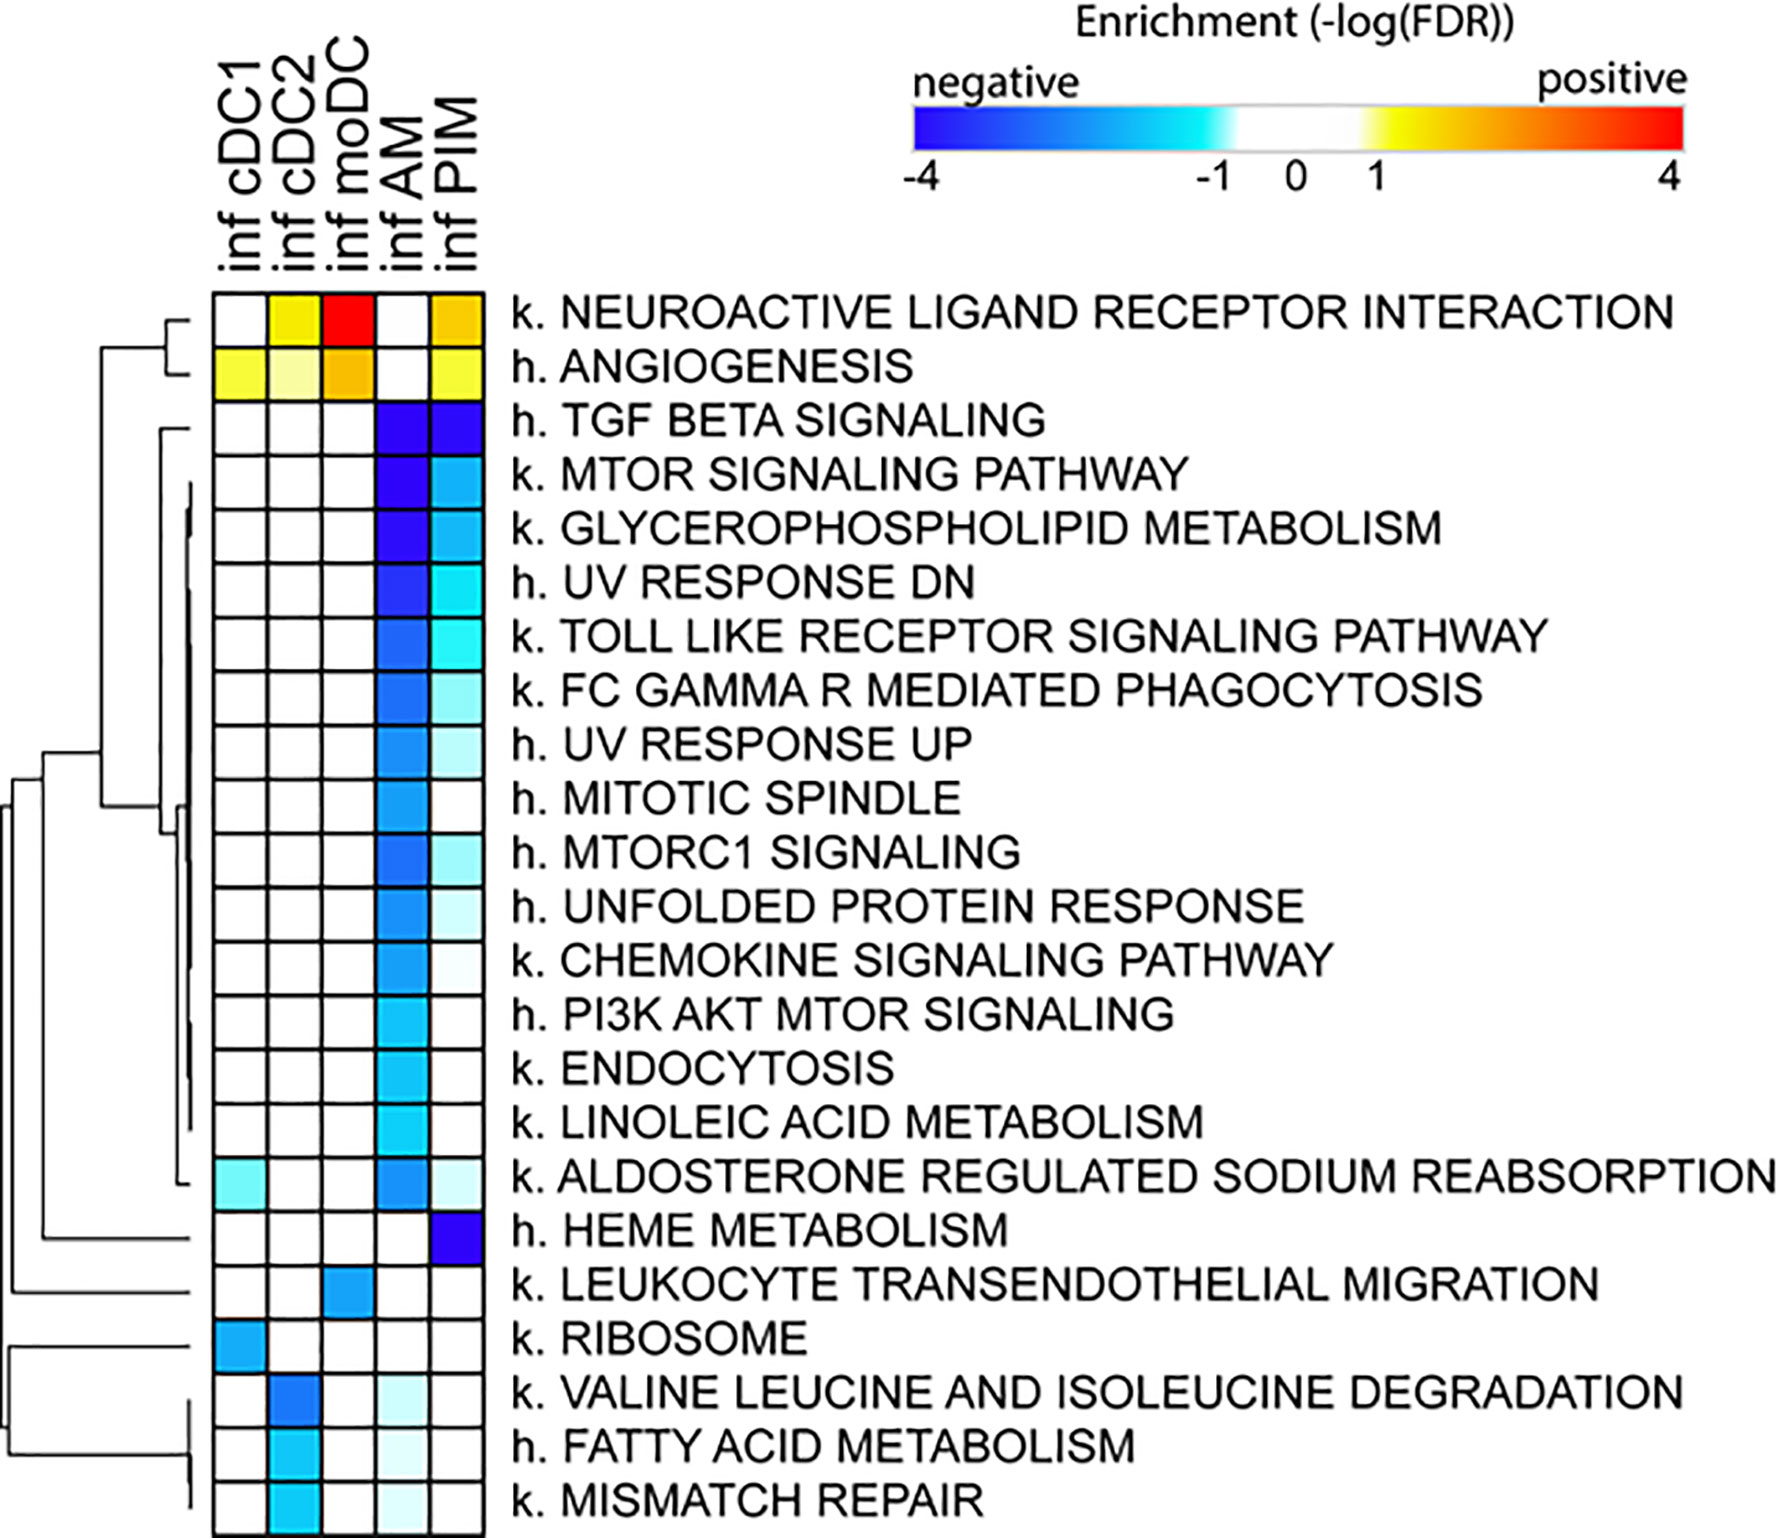
Figure 4 Enrichment of functional annotations in MNP subsets from infected versus control animal using GSEA. Heatmap displaying selected gene sets from MSigDB found to be enriched by GSEA in one or more cell subsets from FL13-infected versus control animals. Gene sets found up- and down-regulated upon infection have positive (red) and negative (blue) enrichments, respectively. Gene sets preceded with k. come from the Kegg pathway database, and gene sets preceded with h. come from the Hallmark collection of the MSigDB. Hierarchical clustering was performed with Morpheus (Broad Institute) using the One minus Pearson correlation and the average linkage method.
When we consider the DC subsets, IPA detected only few significant pathways with moDC displayed as the most affected population upon infection (Figure 3). MoDC versus the control data set was enriched in several metabolic pathways and, interestingly, in the “Th2 pathway” and “Th1 and Th2 activation pathway,” which suggests a potential alteration in their T cell priming ability (Figure 3). In this case, GSEA was not able to increase any significant biological interpretation (Figure 4). Thus, both IPA and GSEA of DEGs allowed limited insights into the transcriptional regulation of DC subsets triggered by PRRSV-1.
FL13 and Lena In Vitro Infection of MNP
We previously reported that in vitro infection of enriched parenchymal lung MNP preparations follows a similar infection pattern to in vivo infected MNP (9). Thus, fresh parenchymal lung cells were enriched in MNP by density gradient and infected with either FL13 or Lena virus. Lena infection was added into the system to gain comparative insights with a highly pathogenic strain using a refined primary in vitro system.
It is important to note that MNP prepared from lung parenchyma after the BAL procedure are depleted of most of the AM (26).
As for the in vivo study, we investigated the level of infection in each group by first mapping viral reads to the FL13 and Lena reference genomes. As expected, Lena showed the highest level of matching reads compared with FL13 (Supplementary Figure 1C).
Subsequently, the host transcriptome profiles were analyzed between FL13- and Lena-infected cells and controls (Supplementary Table 3C). Only 24 DEGs were found in FL13-infected cells compared with controls, whereas a huge amount of DEGs (4,556) was found after Lena infection (Supplementary Table 3C). This confirmed previous reports of the strong immune stimulation induced by Lena (9, 60, 61).
Similar to the in vivo setup, FL13 in vitro infection of MNP triggered limited immune cell stimulation.
Only 12 out of the 23 expressed genes found in FL13-infected cells were common with Lena-infected cells (Figure 5A), including 8 genes with the same pattern of expression (down-regulated: RASSFA, SLC46A2, CCDC153, PDZD3, and up-regulated: WDR76, BCOR, POGZ, FIGNL1) and 4 of them showing opposite patterns (GRHPR and CYT B-C1-10, SHARPIN, CYC1) down-regulated in FL13 and up-regulated in Lena (Figure 5B) (Supplementary Table 4). Interestingly, CYC1 and CYT B-C1-10 are both involved in the mitochondrial respiratory chains, and similarly, GRHPR has an oxidoreductase activity. These three genes were all down-regulated during FL13 infection and consistent in pattern to the in vivo cell subtypes (PIM, moDC, and cDC1 and 2). Conversely, Lena infection showed up-regulation of these genes. Finally, NDUFB6, involved in the mitochondrial respiratory chain complex, was down-regulated during in vitro FL13 infection and in most of the in vivo infected cells (macrophages and cDC subtypes) but showed the opposite pattern in Lena (data not shown).
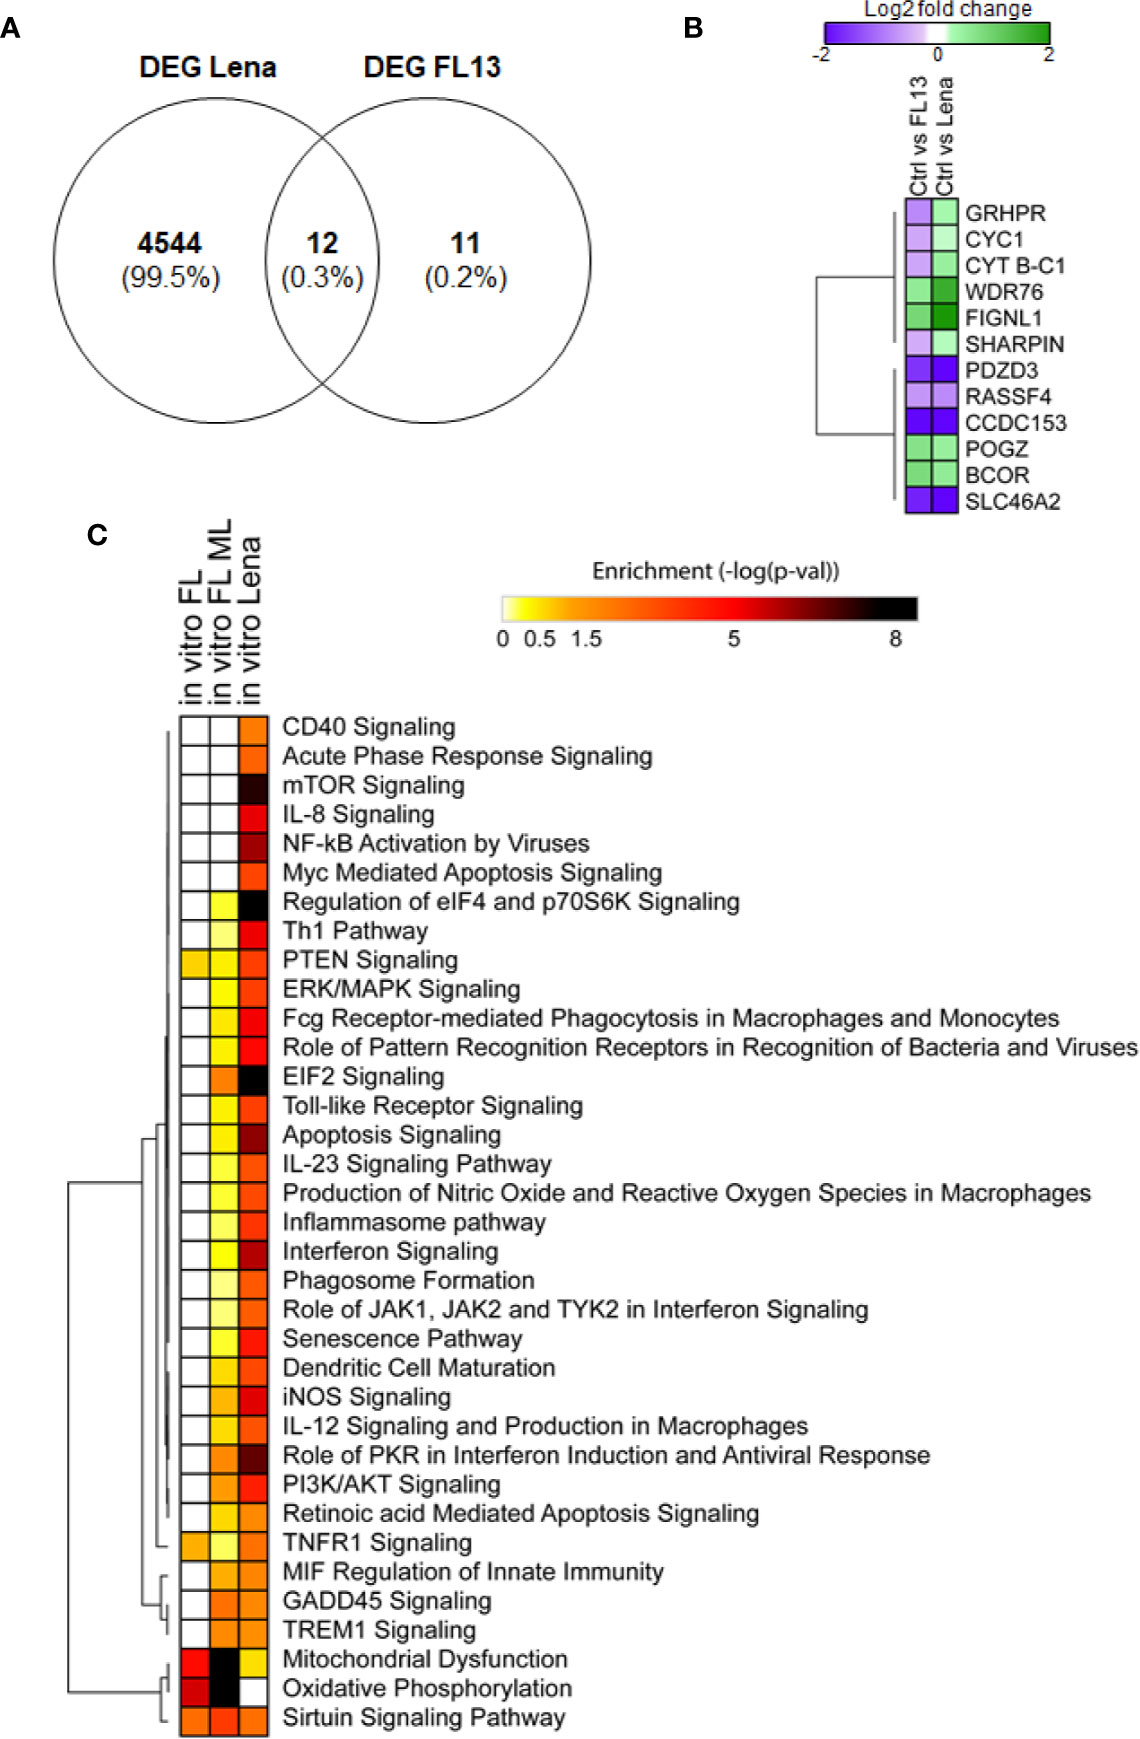
Figure 5 FL13 and Lena in vitro infection. Enriched MNP were infected with FL13 and Lena at MOI = 0.5 and mock inoculated for 24 h. (A) Venn diagram of DEGs between FL13 and Lena infected versus control MNP. (B) Heatmap displaying the log2 ratios of the DEGs shared in MNP upon FL13 and Lena infection versus control as shown in Figure 5A. (C) FL13 classical, FL13 ML, and Lena classical analysis compared with IPA. Heatmap displaying selected functional annotations from IPA found to be enriched in one or more DEG lists identified in FL13 or Lena infected versus control MNP, according to different methodologies (conventional vs. ML approaches). Hierarchical clustering was performed with Morpheus (Broad Institute) using the One minus Pearson correlation and the average linkage method.
Of note, three genes (ATG5, COX5A, COX5B) discovered with ML were additionally validated in all the in vivo mononuclear phagocyte subsets by qPCR (Supplementary Table 4), confirming the accuracy of this data mining method.
Functional Analyses of FL13 and Lena In Vitro Infection
First, an ML approach was used to unravel other potentially hidden intracellular pathways modulated by FL13 infection. In the case of Lena infection, the conventional analysis had a high discovery resolution (4,556 DEGs; Supplementary Table 3C), and the ML approach was “overfitting” even upon a data dimensionality reduction (data not shown).
By SMO classifier, decision tree algorithms, and MLP using WEKA software in a data dimensionality reduction, the ML identified 900 relevant genes in the FL13 data set. The best ML classifier performance was reached using around 2,000 genes (Correct classification 100%, Kappa Statistic 1, AUROC 1) and dropped after the removal of the first 900 classified genes (Correct classification range 33.00%–66.66%, Kappa statistic range 0.00–0.40, AUROC range 0.34–0.75). The correct classification of the randomized data sets (negative control of machine learning) ranged from 43.75% to 48.75%, which is around the predicted value after random assignment into two groups (50%). Kappa statistics ranged from -0.03 to 0.00, and AUROC ranged from 0.42 to 0.47.
Importantly, all the 21 genes already obtained by conventional analysis in both the in vivo and in vitro FL13 data sets were included in the list of genes discovered by ML.
The IPA of the genes obtained by ML for the contrast FL13 MNP versus mock (Figure 5C in vitro FL ML) was more powerful than the conventional approach (Figure 5C in vitro FL) with additional pathways, such as GADD45 signaling, TREM1 and EIF2 signaling, and other pathways related to cell cycle regulation and DNA damage response identified (Figure 5C). As expected, Lena infection was much more potent in the up-regulation of several inflammatory, interferon, and apoptosis pathways compared with FL13 that lacked such types of responses.
The results on FL13 (obtained by ML) were compared to those obtained on Lena (by conventional approach) by the analysis of pathway enrichment (contrast Lena MNP vs. mock; Figure 5C). The two comparisons shared 18 pathways, displaying various enrichment values with only 9 pathways showing significant differences (data not shown). In particular, FL13 infection presented a reduction in the oxidative mitochondrial metabolism (both oxidative phosphorylation and citric acid cycle, Figure 5C, Supplementary Figure 5), whereas Lena mostly modulated the aerobic glycolysis (AKT/mTOR/PI3K) pathways (Figure 5C). The sirtuin pathway, related to an epigenetic-inflammation-suppressive pathway was modulated in both FL13 and Lena (Figure 5C).
When compared to the meta-analysis of the PRRSV host response (13), the FL13 analysis by ML highlighted the previously identified oxidative phosphorylation and mitochondrial dysfunction, and the TREM1 signaling was consistent with one of the top five canonical pathways of the pig specific response to PRRSV (13) (Figure 5C). The analysis of the Lena data set pointed out mTOR signaling and regulation of eIF4 and p70S6K signaling as additional pathways shared with the global pig immune response and the toll-like receptor signaling with the pig-specific response to PRRSV (13). In addition, a total number of 191 genes were shared by Badaoui’s gene list (13) and Lena versus ctr (exact Fisher’s F test P-value < 0.05).
Thus, ML performed better than GSEA to expand the limited findings obtained by conventional analysis (Figure 5, Supplementary Figure 5) as well as to reveal genes and intracellular pathways shared or not between FL13 and Lena and supported by previous studies (13).
Discussion
AM have been the most studied population during PRRSV infection, but high-resolution expression profiling of lung primary parenchymal subpopulations, recognized as critical components of the innate immune responses against viruses, is missing. Here, we evaluated the transcriptomes of in vivo FL13-infected lung MNP subpopulations and in vitro FL13- and Lena-infected parenchymal MNP.
Genetic Signatures of Porcine Lung MNP
As a follow-up to our previous studies (9, 25, 26), we confirmed the different identities of the porcine lung MNP isolated from in vivo PRRSV-1 FL13-infected animals with a new sorting strategy. We established cell-specific expression profiles that were subsequently validated with their murine counterparts with the exception of PIM. Indeed, PIM represents a unique population present in the Laurasiatheria superorder, including pigs and other livestock mammals but not mice and humans (62). AM and PIM showed similar transcriptomic signatures, highlighting their probable common origin as previously proposed (5). The genetic signatures of PIM, cDC, and moDC at steady state and upon PRRSV-1.1 infection add up to the knowledge of relevant parenchymal MNP subsets for future insights into PRRSV and for comparative studies with other pig respiratory diseases.
Effect of FL13 In Vivo Infection on Different Mononuclear Phagocyte Subsets
In agreement with its low virulence, FL13 had moderate effects on every cell subtype. Both AM and PIM confirmed the highest rate of infection compared to the other MNP subsets, known for being weakly susceptible, or not at all, to in vivo PRRSV-1 infection (7, 9). FL13-PIM showed a lower gene modulation (around 3-fold fewer DEGs) compared to FL13-AM, suggesting a different level of activation induced by FL13 despite the similar infection rate (Supplementary Figure 1B). As expected, we identified DEGs associated with apoptosis and down-regulation of proliferation in FL13-infected macrophages, especially in AM.
The DC subsets shared an anti-apoptotic profile (Figure 2) and the down-regulation of ATP2C1, a gene previously shown to correlate with resistance and decreasing viral spread in other viral infections (paramyxovirus, togavirus, flavivirus) (56). cDC2 and moDC also shared the up-regulation of ABCF3, an antiviral gene that, when silenced, was correlated with increased replication of flavivirus (59). Despite those interesting findings on the potential DC mechanisms to control PRRSV-1 replication, their susceptibility is probably related to a multifactorial genetic modulation, including the low or null expression of the main PRRSV receptor CD163 and the tuning of apoptosis. Further studies are needed to evaluate the specificity of DC resistance together with ATP2C1 and ABCF3 roles. Interestingly, cDC and moDC clustered separately at steady state, confirming our previous observation (52), but displayed similar FL13 responses, especially between moDC and cDC2, pointing out a convergent genetic reprogramming despite their different origin, as previously described in mouse and human (63).
Despite the slow replication kinetics of FL13 likely contributing to the cellular gene expression, the capacity to not trigger a strong immune response and to keep antiviral and inflammatory functions silent could be one of the immune evasion strategies used by PRRSV1.1 strains, such as FL13, to maintain its fitness. However, given the lack of a clear transcriptomic segregation between infected and control cells, the actual impact of these putative mechanisms on the different cell types remains difficult to assess.
Comparative Analysis of FL13 and Lena Infections
Although FL13 cellular reprogramming was moderate or even silent, Lena in vitro infection induced the typical cellular profiles of a virulent strain, i.e., high replication rate, massive gene expression, and activation of the immune responses as previously described in different HP strains (3, 5, 9, 61, 64, 65). Thanks to a more complete analysis performed after ML, we could identify molecular signatures pointing to different modulatory mechanisms by the two strains.
It has been recently shown that NSP1α protein from highly pathogenic PRRSV-2 inhibited NF-kB activation by targeting the linear ubiquitin chain assembly complex (LUBAC) composed by the SHARPIN, HOIP, and HOIL-1L subunit (66). In particular, SHARPIN has been associated with NFkB activation and described as essential for cytokine production and induction of Th1 differentiation by DC (67, 68). In our data, SHARPIN was up-regulated in vitro by Lena infection but was consistently down-regulated by FL13 both in vivo (PIM, moDC, and cDC1 and 2) and in vitro. Thus, our data are consistent with previous reports, and they may explain the weak Th1 priming in FL13 infection as opposed to the strong Th1 induction profile in Lena infection previously observed in these cells (9). Future studies comparing the behavior of plasmacytoid DC upon FL13 and Lena infections may provide additional insights into antiviral responses.
The cellular redox homeostasis emerges as an important molecular signature of cell impairment upon PRRSV-1 infection, and our in vitro findings suggest distinctive pathogenic mechanisms of the two strains in the alteration of the mitochondrial function and in the modulation of the cellular metabolism (Figure 5, Supplementary Table 3). Mitochondria are the cellular “power plants” and are involved in a range of several intracellular functions, including regulation of redox homeostasis and cell fate (69). Previously, oxidative stress has been described to correlate with immune response impairment by alteration of the macrophage respiratory burst (70) and by modification of the reducing milieu in the immunological synapse between DC and T cells (71).
Oxidative stress appears to be induced by both PRRSV-1 strains through different pathways. Among the several cellular functions and pathways modulated by Lena (Figure 5C, Supplementary Figure 4), mTOR is a major host cell signaling pathway that regulates protein synthesis, cell growth, proliferation, and survival. It is also established that many viruses exploit this signaling cascade for their own benefit. Previous studies have pointed out the role of mTOR associated with repression of type I IFN during PRRSV (72, 73) and the induction of apoptosis through a mitochondria-mediated pathway (74). Lena showed a clear modulation of mTOR signaling that favors glycolysis, inflammation, cytokine production, and the capacity to prime T cells toward Th1 (75) and no involvement in the oxidative phosphorylation pathway. In contrast, our findings point to a decreased oxidative phosphorylation and citric acid cycle induced by FL13 through a different pattern of gene suppression. However, it remains difficult to untangle the respective roles of the low replication rate of FL13 and its active down-modulation of the immune response in the resulting immune evasion capacity of the virus.
Viruses can induce different metabolic reprogramming that depends on the host cell type that is infected (76). Many cellular disturbances, such as redox imbalance, cause accumulation of misfolded proteins or unfolded proteins, which, in turn, leads to activation of an evolutionary conserved signaling pathway called the unfolded protein response (UPR). Severe or prolonged activation of the UPR can cause cell death induction that is involved in the pathogenesis of various diseases (77). The induction of UPR has been found not only contributing to PRRSV-induced apoptosis in host cells (55, 78), but also involving in the regulation of virus replication and dysregulation of AM cytokine production (79). In our data, infection of lung parenchymal MNP involved the UPR pathway and apoptosis, and the profile was more significant during Lena than FL13 infection.
Conclusion
This study shows, for the first time, the different transcriptomic profiles identified in lung MNP upon in vivo infection with a PRRSV-1 strain. The distinctive molecular signatures and pathways of cellular reprogramming found in vitro are suggestive of a different mechanism of pathogenesis driven by low and highly pathogenic strains. As such, this work paves the way for future mechanistic studies to evaluate the role of virus genetics and restriction factors in driving such distinctive cellular expression beneath the pathogenesis of the infection.
Data Availability Statement
The datasets presented in this study can be found in online repositories. The names of the repository/repositories and accession number(s) can be found in the article/Supplementary Material.
Ethics Statement
The animal study was reviewed and approved by the French Ministry for Research (authorization no. 2015051418327338) and protocols were approved by the national ethics committee (APAFIS#413).
Author contributions
EC performed most of the experiments, conceptualization, machine learning, data analysis, and wrote the manuscript. ElB, EdB, and NB performed the in vitro experiments. JP, AP, and OB supported in vivo experiments. ElB and EdB supported the samples collection and processing. AM and LJ performed the library preparation, sequencing and primary RNAseq data analysis. MM performed the design of qPCR primers, PCA and functional analysis of the data. CB performed the RT-qPCR for validations. MB supported the cell-sorting. CU performed the RT-qPCR for the viral loads in swabs and sera. TPVM performed the interspecies transcriptomic comparison study and curated data visualization. EG, IS, and NB provided financial supports. NB and EG conceived the study, supervised the working program, and contributed to writing the manuscript. All authors contributed to the article and approved the submitted version.
Funding
This work was funded by the Animal Health and Welfare ERA-Net (anihwa)-project KILLeuPRRSV.
The present work has benefited from the core facilities of Imagerie-Gif, (http://www.i2bc.paris-saclay.fr), member of IBiSA (http://www.ibisa.net). It was supported by the Programme d’Investissement d’Avenir France-BioImaging (Agence Nationale de la Recherche ANR-10-ISBN-04-01), and the Labex Saclay Plant Science (Agence Nationale de la recherche, ANR-11-IDEX-0003-02).
EC was supported by the Animal Health and Welfare ERANet (anihwa)-project KILLeuPRRSV and the AgreenSkills+ fellowship program, which has received funding from the EU’s Seventh Framework Programme under grant agreement N◦ FP7-609398 (AgreenSkills+ contract). ElB was supported by H2020 SAPHIR. The École normale supérieure genomic core facility was supported by the France Génomique national infrastructure, funded as part of the “Investissements d’Avenir” program managed by the Agence Nationale de la Recherche (contract ANR-10-INBS-09).
Conflict of Interest
The authors declare that the research was conducted in the absence of any commercial or financial relationships that could be construed as a potential conflict of interest.
Acknowledgments
The authors would like to thank Dr. Benjamin J. Reading for the support in the machine learning approach and in the critical evaluation of the paper and Dr. Hans Nauwynck for providing the PRRSV-1 strains and valuable comments to the paper. We thank Kyle Miskell for the English edition.
Supplementary Material
The Supplementary Material for this article can be found online at: https://www.frontiersin.org/articles/10.3389/fimmu.2020.588411/full#supplementary-material
References
1. Kuhn JH, Lauck M, Bailey AL, Shchetinin AM, Vishnevskaya TV, Bao Y, et al. Reorganization and expansion of the nidoviral family Arteriviridae. Arch Virol (2016) 161(3):755–68. doi: 10.1007/s00705-015-2672-z
2. Stadejek T, Stankevicius A, Murtaugh MP, Oleksiewicz MB. Molecular evolution of PRRSV in Europe: current state of play. Vet Microbiol (2013) 165(1-2):21–8. doi: 10.1016/j.vetmic.2013.02.029
3. Karniychuk UU, Geldhof M, Vanhee M, Van Doorsselaere J, Saveleva TA, Nauwynck HJ. Pathogenesis and antigenic characterization of a new East European subtype 3 porcine reproductive and respiratory syndrome virus isolate. BMC Vet Res (2010) 6:30. doi: 10.1186/1746-6148-6-30
4. Morgan SB, Graham SP, Salguero FJ, Sanchez Cordon PJ, Mokhtar H, Rebel JM, et al. Increased pathogenicity of European porcine reproductive and respiratory syndrome virus is associated with enhanced adaptive responses and viral clearance. Vet Microbiol (2013) 163(1-2):13–22. doi: 10.1016/j.vetmic.2012.11.024
5. Bordet E, Maisonnasse P, Renson P, Bouguyon E, Crisci E, Tiret M, et al. Porcine Alveolar Macrophage-like cells are pro-inflammatory Pulmonary Intravascular Macrophages that produce large titers of Porcine Reproductive and Respiratory Syndrome Virus. Sci Rep (2018) 8(1):10172. doi: 10.1038/s41598-018-28234-y
6. Darwich L, Diaz I, Mateu E. Certainties, doubts and hypotheses in porcine reproductive and respiratory syndrome virus immunobiology. Virus Res (2010) 154(1-2):123–32. doi: 10.1016/j.virusres.2010.07.017
7. Crisci E, Fraile L, Montoya M. Cellular Innate Immunity against PRRSV and Swine Influenza Viruses. Vet Sci (2019) 6(1):26. doi: 10.3390/vetsci6010026
8. Singleton H, Graham SP, Bodman-Smith KB, Frossard JP, Steinbach F. Establishing Porcine Monocyte-Derived Macrophage and Dendritic Cell Systems for Studying the Interaction with PRRSV-1. Front Microbiol (2016) 7:832. doi: 10.3389/fmicb.2016.00832
9. Bordet E, Blanc F, Tiret M, Crisci E, Bouguyon E, Renson P, et al. Porcine Reproductive and Respiratory Syndrome Virus Type 1.3 Lena Triggers Conventional Dendritic Cells 1 Activation and T Helper 1 Immune Response Without Infecting Dendritic Cells. Front Immunol (2018) 9:2299. doi: 10.3389/fimmu.2018.02299
10. Genini S, Delputte PL, Malinverni R, Cecere M, Stella A, Nauwynck HJ, et al. Genome-wide transcriptional response of primary alveolar macrophages following infection with porcine reproductive and respiratory syndrome virus. J Gen Virol (2008) 89(Pt 10):2550–64. doi: 10.1099/vir.0.2008/003244-0
11. Zhou P, Zhai S, Zhou X, Lin P, Jiang T, Hu X, et al. Molecular characterization of transcriptome-wide interactions between highly pathogenic porcine reproductive and respiratory syndrome virus and porcine alveolar macrophages in vivo. Int J Biol Sci (2011) 7(7):947–59. doi: 10.7150/ijbs.7.947
12. Jiang Z, Zhou X, Michal JJ, Wu XL, Zhang L, Zhang M, et al. Reactomes of porcine alveolar macrophages infected with porcine reproductive and respiratory syndrome virus. PLoS One (2013) 8(3):e59229. doi: 10.1371/journal.pone.0059229
13. Badaoui B, Tuggle CK, Hu ZL, Reecy JM, Ait-Ali T, Anselmo A, et al. Pig immune response to general stimulus and to porcine reproductive and respiratory syndrome virus infection: a meta-analysis approach. BMC Genomics (2013) 14:220. doi: 10.1186/1471-2164-14-220
14. Rola-Luszczak M, Materniak-Kornas M, Pluta A, Podgorska K, Nielsen J, Stadejek T, et al. Transcriptional profiles of PBMCs from pigs infected with three genetically diverse porcine reproductive and respiratory syndrome virus strains. Mol Biol Rep (2018) 45(5):675–88. doi: 10.1007/s11033-018-4204-x
15. Islam MA, Neuhoff C, Aqter Rony S, Grosse-Brinkhaus C, Uddin MJ, Holker M, et al. PBMCs transcriptome profiles identified breed-specific transcriptome signatures for PRRSV vaccination in German Landrace and Pietrain pigs. PLoS One (2019) 14(9):e0222513. doi: 10.1371/journal.pone.0222513
16. Miller LC, Fleming DS, Lager KM. Comparison of the Transcriptome Response within the Swine Tracheobronchial Lymphnode Following Infection with PRRSV, PCV-2 or IAV-S. Pathogens (2020) 9(2):99. doi: 10.3390/pathogens9020099
17. Dakna EIDM. Statistical Inference in High-Dimensional Omics Data. In: Antonia Vlahou HM, Zoidakis J, Magni F, editors. Integration of Omics Approaches and Systems Biology for Clinical Applications. Hoboken, NJ, USA: John Wiley & Sons, Inc (2018). p. 196–206.
18. Chapman RW, Reading BJ, Sullivan CV. Ovary transcriptome profiling via artificial intelligence reveals a transcriptomic fingerprint predicting egg quality in striped bass, Morone saxatilis. PLoS One (2014) 9(5):e96818. doi: 10.1371/journal.pone.0096818
19. Witten IHF, Hall E, Pal M. C. Data Mining: Practical Machine Learning Tools and Techniques. Amsterdam, The Netherlands: Elsevier Science (2016). 17th of November 2016.
20. Jong VL, Ahout IM, van den Ham HJ, Jans J, Zaaraoui-Boutahar F, Zomer A, et al. Transcriptome assists prognosis of disease severity in respiratory syncytial virus infected infants. Sci Rep (2016) 6:36603. doi: 10.1038/srep36603
21. Barral-Arca R, Gomez-Carballa A, Cebey-Lopez M, Curras-Tuala MJ, Pischedda S, Viz-Lasheras S, et al. RNA-Seq Data-Mining Allows the Discovery of Two Long Non-Coding RNA Biomarkers of Viral Infection in Humans. Int J Mol Sci (2020) 21(8):2748. doi: 10.3390/ijms21082748
22. Piles M, Fernandez-Lozano C, Velasco-Galilea M, González-Rodríguez O, Sánchez JP, Torrallardona D, et al. Machine learning applied to transcriptomic data to identify genes associated with feed efficiency in pigs. Genet Sel Evol (2019) 51(1):10. doi: 10.1186/s12711-019-0453-y
23. Frydas IS, Trus I, Kvisgaard LK, Bonckaert C, Reddy VR, Li Y, et al. Different clinical, virological, serological and tissue tropism outcomes of two new and one old Belgian type 1 subtype 1 porcine reproductive and respiratory virus (PRRSV) isolates. Vet Res (2015) 46:37. doi: 10.1186/s13567-015-0166-3
24. Trus I, Frydas IS, Reddy VR, Bonckaert C, Li Y, Kvisgaard LK, et al. Immunity raised by recent European subtype 1 PRRSV strains allows better replication of East European subtype 3 PRRSV strain Lena than that raised by an older strain. Vet Res (2016) 47:15. doi: 10.1186/s13567-015-0292-y
25. Maisonnasse P, Bordet E, Bouguyon E, Bertho N. Broncho Alveolar Dendritic Cells and Macrophages Are Highly Similar to Their Interstitial Counterparts. PLoS One (2016) 11(12):e0167315. doi: 10.1371/journal.pone.0167315
26. Maisonnasse P, Bouguyon E, Piton G, Ezquerra A, Urien C, Deloizy C, et al. The respiratory DC/macrophage network at steady-state and upon influenza infection in the swine biomedical model. Mucosal Immunol (2016) 9(4):835–49. doi: 10.1038/mi.2015.105
27. Jourdren L, Bernard M, Dillies MA, Le Crom S. Eoulsan: a cloud computing-based framework facilitating high throughput sequencing analyses. Bioinformatics (2012) 28(11):1542–3. doi: 10.1093/bioinformatics/bts165
28. Dobin A, Davis CA, Schlesinger F, Drenkow J, Zaleski C, Jha S, et al. STAR: ultrafast universal RNA-seq aligner. Bioinformatics (2013) 29(1):15–21. doi: 10.1093/bioinformatics/bts635
29. Li H, Handsaker B, Wysoker A, Fennell T, Ruan J, Homer N, et al. The Sequence Alignment/Map format and SAMtools. Bioinformatics (2009) 25(16):2078–9. doi: 10.1093/bioinformatics/btp352
30. Anders S, Pyl PT, Huber W. HTSeq–a Python framework to work with high-throughput sequencing data. Bioinformatics (2015) 31(2):166–9. doi: 10.1093/bioinformatics/btu638
31. Love MI, Huber W, Anders S. Moderated estimation of fold change and dispersion for RNA-seq data with DESeq2. Genome Biol (2014) 15(12):550. doi: 10.1186/s13059-014-0550-8
32. Lê SJJ, Husson F. FactoMineR: An R Package for Multivariate Analysis. J Stat Softw (2008) 25(1):1–18. doi: 10.18637/jss.v025.i01
33. Suzuki R, Shimodaira H. Pvclust: an R package for assessing the uncertainty in hierarchical clustering. Bioinformatics (2006) 22(12):1540–2. doi: 10.1093/bioinformatics/btl117
34. Cortes C, Vapnik V. Support-vector networks. Mach Learn (1995) 20(3):273–97. doi: 10.1007/BF00994018
35. Keerthi SS, Shevade SK, Bhattacharyya C, Murthy KRK. Improvements to Platt’s SMO Algorithm for SVM Classifier Design. Neural Computat (2001) 13(3):637–49. doi: 10.1162/089976601300014493
36. Phillips CA, Reading BJ, Livingston M, Livingston K, Ashwell CM. Evaluation via Supervised Machine Learning of the Broiler Pectoralis Major and Liver Transcriptome in Association With the Muscle Myopathy Wooden Breast. Front Physiol (2020) 11:101. doi: 10.3389/fphys.2020.00101
37. Schilling J, Nepomuceno A, Schaff JE, Muddiman DC, Daniels HV, Reading BJ. Compartment proteomics analysis of white perch (Morone americana) ovary using support vector machines. J Proteome Res (2014) 13(3):1515–26. doi: 10.1021/pr401067g
38. Briseno CG, Haldar M, Kretzer NM, Wu X, Theisen DJ, Kc W, et al. Distinct Transcriptional Programs Control Cross-Priming in Classical and Monocyte-Derived Dendritic Cells. Cell Rep (2016) 15(11):2462–74. doi: 10.1016/j.celrep.2016.05.025
39. Irizarry RA, Hobbs B, Collin F, Beazer-Barclay YD, Antonellis KJ, Scherf U, et al. Exploration, normalization, and summaries of high density oligonucleotide array probe level data. Biostatistics (2003) 4(2):249–64. doi: 10.1093/biostatistics/4.2.249
40. Carvalho BS, Irizarry RA. A framework for oligonucleotide microarray preprocessing. Bioinformatics (2010) 26(19):2363–7. doi: 10.1093/bioinformatics/btq431
41. Johnson WE, Li C, Rabinovic A. Adjusting batch effects in microarray expression data using empirical Bayes methods. Biostatistics (2007) 8(1):118–27. doi: 10.1093/biostatistics/kxj037
42. Spinelli L, Carpentier S, Montanana Sanchis F, Dalod M, Vu Manh TP. BubbleGUM: automatic extraction of phenotype molecular signatures and comprehensive visualization of multiple Gene Set Enrichment Analyses. BMC Genomics (2015) 16:814. doi: 10.1186/s12864-015-2012-4
43. Carpentier S, Vu Manh TP, Chelbi R, Henri S, Malissen B, Haniffa M, et al. Comparative genomics analysis of mononuclear phagocyte subsets confirms homology between lymphoid tissue-resident and dermal XCR1(+) DCs in mouse and human and distinguishes them from Langerhans cells. J Immunol Methods (2016) 432:35–49. doi: 10.1016/j.jim.2016.02.023
44. Cunningham F, Achuthan P, Akanni W, Allen J, Amode MR, Armean IM, et al. Ensembl 2019. Nucleic Acids Res (2019) 47(D1):D745–51. doi: 10.1093/nar/gky1113
45. Liberzon A. A description of the Molecular Signatures Database (MSigDB) Web site. Methods Mol Biol (2014) 1150:153–60. doi: 10.1007/978-1-4939-0512-6_9
46. Bordet E, Fretaud M, Crisci E, Bouguyon E, Rault S, Pezant J, et al. Macrophage-B Cell Interactions in the Inverted Porcine Lymph Node and Their Response to Porcine Reproductive and Respiratory Syndrome Virus. Front Immunol (2019) 10:953. doi: 10.3389/fimmu.2019.00953
47. Talker SC, Baumann A, Barut GT, Keller I, Bruggmann R, Summerfield A. Precise Delineation and Transcriptional Characterization of Bovine Blood Dendritic-Cell and Monocyte Subsets. Front Immunol (2018) 9:2505. doi: 10.3389/fimmu.2018.02505
48. Granot T, Senda T, Carpenter DJ, Matsuoka N, Weiner J, Gordon CL, et al. Dendritic Cells Display Subset and Tissue-Specific Maturation Dynamics over Human Life. Immunity (2017) 46(3):504–15. doi: 10.1016/j.immuni.2017.02.019
49. Delmas B, Gelfi J, L’Haridon R, Vogel LK, Sjostrom H, Noren O, et al. Aminopeptidase N is a major receptor for the entero-pathogenic coronavirus TGEV. Nature (1992) 357(6377):417–20. doi: 10.1038/357417a0
50. Crozat K, Guiton R, Guilliams M, Henri S, Baranek T, Schwartz-Cornil I, et al. Comparative genomics as a tool to reveal functional equivalences between human and mouse dendritic cell subsets. Immunol Rev (2010) 234:177–98. doi: 10.1111/j.0105-2896.2009.00868.x
51. Patel BV, Tatham KC, Wilson MR, O’Dea KP, Takata M. In vivo compartmental analysis of leukocytes in mouse lungs. Am J Physiol-Lung C (2015) 309(7):L639–L52. doi: 10.1152/ajplung.00140.2015
52. Vu Manh TP, Elhmouzi-Younes J, Urien C, Ruscanu S, Jouneau L, Bourge M, et al. Defining Mononuclear Phagocyte Subset Homology Across Several Distant Warm-Blooded Vertebrates Through Comparative Transcriptomics. Front Immunol (2015) 6:299. doi: 10.3389/fimmu.2015.00299
53. Museau L, Hervet C, Saade G, Menard D, Belloc C, Meurens F, et al. Prospecting potential links between PRRSV infection susceptibility of alveolar macrophages and other respiratory infectious agents present in conventionally reared pigs. Vet Immunol Immunopathol (2020) 229:110114. doi: 10.1016/j.vetimm.2020.110114
54. Fan LH. Signaling pathways involved in regulating apoptosis induction in host cells upon PRRSV infection. Virus Genes (2019) 55(4):433–9. doi: 10.1007/s11262-019-01665-z
55. Yuan S, Zhang N, Xu L, Zhou L, Ge X, Guo X, et al. Induction of Apoptosis by the Nonstructural Protein 4 and 10 of Porcine Reproductive and Respiratory Syndrome Virus. PLoS One (2016) 11(6):e0156518. doi: 10.1371/journal.pone.0156518
56. Hoffmann HH, Schneider WM, Blomen VA, Scull MA, Hovnanian A, Brummelkamp TR, et al. Diverse Viruses Require the Calcium Transporter SPCA1 for Maturation and Spread. Cell Host Microbe (2017) 22(4):460–70.e5. doi: 10.1016/j.chom.2017.09.002
57. Cheng P, Gabrilovich D. Notch signaling in differentiation and function of dendritic cells. Immunol Res (2008) 41(1):1–14. doi: 10.1007/s12026-007-8011-z
58. Cui J, Li Y, Zhu L, Liu D, Songyang Z, Wang HY, et al. NLRP4 negatively regulates type I interferon signaling by targeting the kinase TBK1 for degradation via the ubiquitin ligase DTX4. Nat Immunol (2012) 13(4):387–95. doi: 10.1038/ni.2239
59. Courtney SC, Di H, Stockman BM, Liu H, Scherbik SV, Brinton MA. Identification of novel host cell binding partners of Oas1b, the protein conferring resistance to flavivirus-induced disease in mice. J Virol (2012) 86(15):7953–63. doi: 10.1128/JVI.00333-12
60. Garcia-Nicolas O, Auray G, Sautter CA, Rappe JC, McCullough KC, Ruggli N, et al. Sensing of Porcine Reproductive and Respiratory Syndrome Virus-Infected Macrophages by Plasmacytoid Dendritic Cells. Front Microbiol (2016) 7:771. doi: 10.3389/fmicb.2016.00771
61. Renson P, Rose N, Le Dimna M, Mahe S, Keranflec’h A, Paboeuf F, et al. Dynamic changes in bronchoalveolar macrophages and cytokines during infection of pigs with a highly or low pathogenic genotype 1 PRRSV strain. Vet Res (2017) 48(1):15. doi: 10.1186/s13567-017-0420-y
62. Brain JD, Molina RM, DeCamp MM, Warner AE. Pulmonary intravascular macrophages: their contribution to the mononuclear phagocyte system in 13 species. Am J Physiol (1999) 276(1):L146–54. doi: 10.1152/ajplung.1999.276.1.L146
63. Manh TP, Alexandre Y, Baranek T, Crozat K, Dalod M. Plasmacytoid, conventional, and monocyte-derived dendritic cells undergo a profound and convergent genetic reprogramming during their maturation. Eur J Immunol (2013) 43(7):1706–15. doi: 10.1002/eji.201243106
64. Weesendorp E, Stockhofe-Zurwieden N, Popma-De Graaf DJ, Fijten H, Rebel JM. Phenotypic modulation and cytokine profiles of antigen presenting cells by European subtype 1 and 3 porcine reproductive and respiratory syndrome virus strains in vitro and in vivo. Vet Microbiol (2013) 167(3-4):638–50. doi: 10.1016/j.vetmic.2013.09.021
65. Ferrari L, Canelli E, De Angelis E, Catella A, Ferrarini G, Ogno G, et al. A highly pathogenic porcine reproductive and respiratory syndrome virus type 1 (PRRSV-1) strongly modulates cellular innate and adaptive immune subsets upon experimental infection. Vet Microbiol (2018) 216:85–92. doi: 10.1016/j.vetmic.2018.02.001
66. Jing H, Fang L, Ding Z, Wang D, Hao W, Gao L, et al. Porcine Reproductive and Respiratory Syndrome Virus nsp1alpha Inhibits NF-kappaB Activation by Targeting the Linear Ubiquitin Chain Assembly Complex. J Virol (2017) 91(3):e01911–16. doi: 10.1128/JVI.01911-16
67. Liang Y. SHARPIN Negatively Associates with TRAF2-Mediated NF kappa B Activation. PLoS One (2011) 6(7):e21696. doi: 10.1371/journal.pone.0021696
68. Wang Z, Sokolovska A, Seymour R, Sundberg JP, HogenEsch H. SHARPIN Is Essential for Cytokine Production, NF-kappa B Signaling, and Induction of Th1 Differentiation by Dendritic Cells. PLoS One (2012) 7(2):e31809. doi: 10.1371/journal.pone.0031809
69. Kang J, Pervaiz S. Mitochondria: redox metabolism and dysfunction. Biochem Res Int (2012) 2012:896751. doi: 10.1155/2012/896751
70. Jezek J, Cooper KF, Strich R. Reactive Oxygen Species and Mitochondrial Dynamics: The Yin and Yang of Mitochondrial Dysfunction and Cancer Progression. Antioxid (Basel) (2018) 7(1):13. doi: 10.3390/antiox7010013
71. Matsue H, Edelbaum D, Shalhevet D, Mizumoto N, Yang C, Mummert ME, et al. Generation and function of reactive oxygen species in dendritic cells during antigen presentation. J Immunol (2003) 171(6):3010–8. doi: 10.4049/jimmunol.171.6.3010
72. Pujhari S, Kryvvoruchko M, Zakhartchouk AN. Role of phosphatidylinositol-3-kinase (PI3K) and the mammalian target of rapamycin (mTOR) signalling pathways in porcine reproductive and respiratory syndrome virus (PRRSV) replication. Virus Res (2014) 194:138–44. doi: 10.1016/j.virusres.2014.09.017
73. Liu QF, Miller LC, Blecha F, Sang YM. Reduction of infection by inhibiting mTOR pathway is associated with reversed repression of type I interferon by porcine reproductive and respiratory syndrome virus. J Gen Virol (2017) 98(6):1316–28. doi: 10.1099/jgv.0.000802
74. Lee SM, Kleiboeker SB. Porcine reproductive and respiratory syndrome virus induces apoptosis through a mitochondria-mediated pathway. Virology (2007) 365(2):419–34. doi: 10.1016/j.virol.2007.04.001
75. Du X, Chapman NM, Chi H. Emerging Roles of Cellular Metabolism in Regulating Dendritic Cell Subsets and Function. Front Cell Dev Biol (2018) 6:152. doi: 10.3389/fcell.2018.00152
76. Thaker SK, Ch’ng J, Christofk HR. Viral hijacking of cellular metabolism. BMC Biol (2019) 17(1):59. doi: 10.1186/s12915-019-0678-9
77. Xu C, Bailly-Maitre B, Reed JC. Endoplasmic reticulum stress: cell life and death decisions. J Clin Invest (2005) 115(10):2656–64. doi: 10.1172/JCI26373
78. Huo Y, Fan L, Yin S, Dong Y, Guo X, Yang H, et al. Involvement of unfolded protein response, p53 and Akt in modulation of porcine reproductive and respiratory syndrome virus-mediated JNK activation. Virology (2013) 444(1-2):233–40. doi: 10.1016/j.virol.2013.06.015
Keywords: PRRSV-1, pig, lung mononuclear phagocytes, gene expression, immunogenomics, machine learning
Citation: Crisci E, Moroldo M, Vu Manh T-P, Mohammad A, Jourdren L, Urien C, Bouguyon E, Bordet E, Bevilacqua C, Bourge M, Pezant J, Pléau A, Boulesteix O, Schwartz I, Bertho N and Giuffra E (2020) Distinctive Cellular and Metabolic Reprogramming in Porcine Lung Mononuclear Phagocytes Infected With Type 1 PRRSV Strains. Front. Immunol. 11:588411. doi: 10.3389/fimmu.2020.588411
Received: 29 July 2020; Accepted: 19 October 2020;
Published: 07 December 2020.
Edited by:
Javier Dominguez, National Institute for Agricultural and Food Research and Technology (INIA), SpainReviewed by:
Stephanie Christina Talker, University of Bern, SwitzerlandEnric M. Mateu, Autonomous University of Barcelona, Spain
Hanchun Yang, China Agricultural University, China
Copyright © 2020 Crisci, Moroldo, Vu Manh, Mohammad, Jourdren, Urien, Bouguyon, Bordet, Bevilacqua, Bourge, Pezant, Pléau, Boulesteix, Schwartz, Bertho and Giuffra. This is an open-access article distributed under the terms of the Creative Commons Attribution License (CC BY). The use, distribution or reproduction in other forums is permitted, provided the original author(s) and the copyright owner(s) are credited and that the original publication in this journal is cited, in accordance with accepted academic practice. No use, distribution or reproduction is permitted which does not comply with these terms.
*Correspondence: Elisa Crisci, ecrisci@ncsu.edu; Elisabetta Giuffra, elisabetta.giuffra@inrae.fr
†Present addresses: Elisa Crisci, Department of Population Health and Pathobiology, College of Veterinary Medicine, North Carolina State University, Raleigh, NC, United States
Ammara Mohammad, Institut du Cerveau et de la Moelle épinière—ICM, Hôpital de la Pitié-Salpêtrière, Paris, France
Nicolas Bertho, BIOEPAR, INRAE, Oniris, Nantes, France
‡These authors have contributed equally to this work
§These authors share senior authorship