 Shijia Liu1Yunke Guo1Lu Lu1Jiawei Lu2Mengying Ke3Tingting Xu3Yan Lu1Wenjun Chen1Jue Wang2Deshun Kong3Qiuxiang Shen3Youjuan Zhu3WenFeng Tan4Wei Ji1*
 Wei Zhou2*
- 1Department of Rheumatology and Immunology, Affiliated Hospital of Nanjing University of Chinese Medicine, Nanjing, China
- 2State Key Laboratory of Natural Medicines, School of Traditional Chinese Pharmacy, China Pharmaceutical University, Nanjing, China
- 3Jiangsu Collaborative Innovation Center of Chinese Medicinal Resources Industrialization, College of Pharmacy, Nanjing University of Chinese Medicine, Nanjing, China
- 4Department of Rheumatology and Immunology, The First Affiliated Hospital With Nanjing Medical University, Nanjing, China
Rheumatoid arthritis (RA), afflicting over 1% of the population, is an inflammatory joint disease leading to cartilage damage and ultimately impaired joint function. Disease-modifying anti-rheumatic drugs are considered as the first-line treatment to inhibit the progression of RA, and the treatment depends on the disease status assessment. The disease activity score 28 as clinical gold standard is extensively used for RA assessment, but it has the limitations of delayed assessment and the need for specialized expertise. It is necessary to discover biomarkers that can precisely monitor disease activity, and provide optimized treatment for RA patients. A total of 1,244 participants from two independent centers were divided into five cohorts. Cohorts 1–4 constituted sera samples of moderate to high active RA, low active RA, RA in remission and healthy subjects. Cohort 5 consisted of sera of RA, osteoarthritis (OA), ankylosing spondylitis (AS), systemic lupus erythematosus (SLE), primary Sjogren's syndrome (pSS) and healthy subjects. Biomarkers were found from cohorts 1–2 (screening sets), cohort 3 (discovery and external validation sets), cohort 4 (drug intervention set) and cohort 5 (biomarker-specific evaluation set). We found 68 upregulated and 74 downregulated proteins by TMT-labeled proteomics in cohort 1, and fibrinogen-like protein 1 (FGL1) had the highest area under the receiver operating characteristic curve (AUC) values in cohort 2. In cohort 3, in cross-comparison among moderate/high active RA, low active RA, RA in remission and healthy subjects, FGL1 had AUC values of approximately 0.9000 and predictive values of 90%. Additionally, FGL1 had a predictive value of 91.46% for moderate/high active RA vs. remission/low active RA and 80.77% for RA in remission vs. low active RA in cohort 4. Importantly, FGL1 levels had no significant difference in OA and AS compared with healthy persons. The concentrations in SLE and pSS were improved, but approximately 3-fold lower than that in active RA in cohort 5. In summary, FGL1 is a novel and specific biomarker that could be clinically useful for predicting progression of RA.
Introduction
Rheumatoid arthritis (RA) is a chronic autoimmune disease that affects approximately 1% of the global population (1). It is characterized by inflammation of the synovial joints, which causes joint destruction, functional impairment, disability and premature mortality (2). Presently, RA is diagnosed by a total score between six and 10 based on the sum of the individual scores in the four domains in the 2010 Rheumatoid Arthritis Classification Criteria of the American College of Rheumatology/European League Against Rheumatism collaborative initiative (3). It has been reported that the cumulative disease activity score correlates well with RA progression and complications, and the existing target-to-treat strategy with the use of disease-modifying anti-rheumatic drugs (DMARDs) aggressively targets disease symptoms in hopes of achieving clinical remission (4). The treatment relies on the assessment of disease status (5, 6). For example, the American College of Rheumatology recommends different treatments for early (disease duration ≤ 6 months) and established (disease duration ≥ 6 months) RA with moderate/high disease activity, with low disease activity and in remission. Owing to the heterogeneous nature of the disease, patients show varied pharmacological responses to DMARDs. It would be ideal to monitor RA activity on a daily basis to optimize the treatment for RA (7). The erythrocyte sedimentation rate (ESR) and C-reactive protein (CRP) are the most common blood markers for the disease activity of RA, while they are neither highly sensitive nor specific to inherent changes in disease activity levels (8, 9). Rheumatoid factor (RF) and anticyclic citrullinated peptide antibody (ACPA) are representative serological markers for RA diagnosis and prognosis, including radiographic progression, but they do not usually correlate with disease progression (10). Urine soluble CD14 was reported to be a biomarker of high disease activity of RA, but the area under the receiver operating characteristic (ROC) curve was only 0.71 (11). The disease activity score 28 (DAS28), which is based on the number of tender joint, the number of swollen joint, and the ESR or CRP level, has been widely used for clinical assessment of RA. The level of disease activity can be interpreted as low (2.6<DAS ≤ 3.2), moderate (3.2<DAS≤5.1), or high (DAS >5.1). A DAS ≤2.6 represents remission according to the criteria of the European League Against Rheumatism (12, 13). However, the method has the limitations of delayed assessment and the need for specialized expertise. There are no precise universal or easy-to-use assessment methods that can facilitate the evaluation of disease activity and the prediction of disease severity. It is crucial to discover novel biomarkers to precisely monitor disease activity and severity of RA and provide personalized therapies by gaining insight into patients' pathogenic processes.
Herein, a total of 1,244 participants recruited from two independent centers were divided into five cohorts. Cohorts 1–4 consisted of serum samples from persons with moderate/high active RA, low active RA, RA in remission and healthy subjects. Cohort 5 constituted samples from persons with RA, osteoarthritis (OA), ankylosing spondylitis (AS), systemic lupus erythematosus (SLE), primary Sjogren's syndrome (pSS) and healthy persons. Biomarkers were found in cohorts 1–2 using TMT-based quantitative proteomics as screening sets, cohort 3 as discovery and external validation sets, cohort 4 as drug intervention set and cohort 5 as biomarker-specific assessment set. The overall goal was to identify novel biomarkers that could evaluate the disease activity and prognosis of RA (Figure 1).
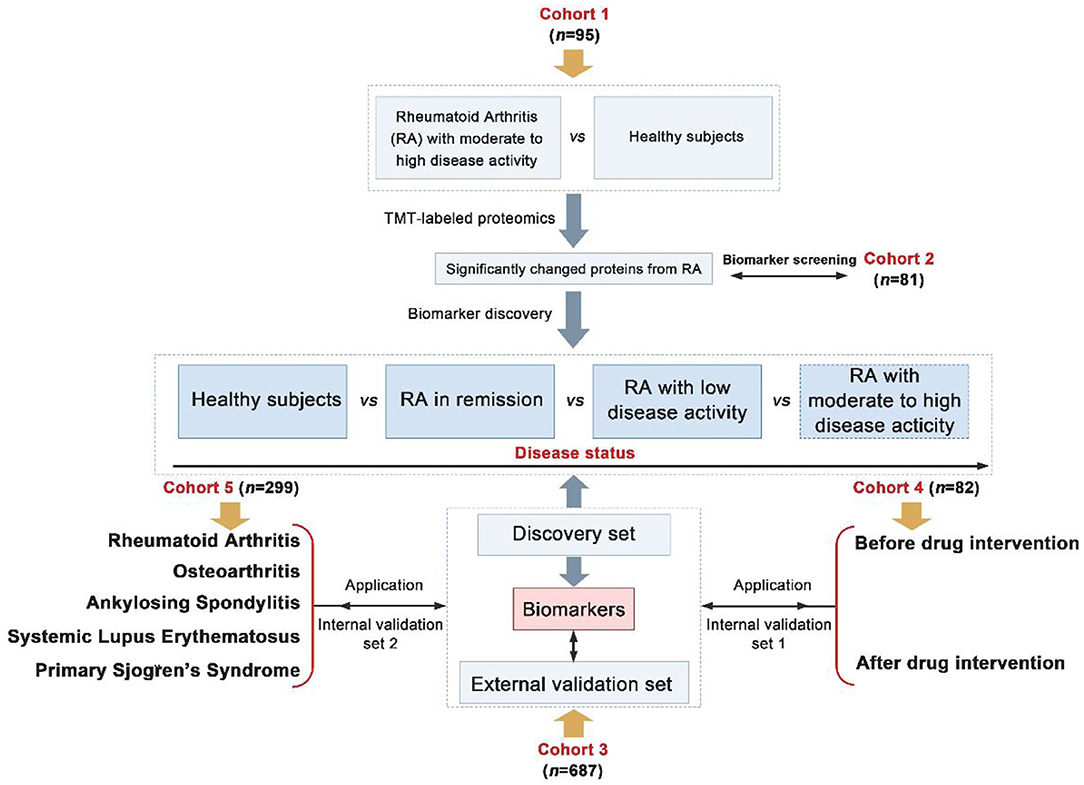
Figure 1. Overall strategy of biomarkers discovery for the assessment of disease activity and prognosis of Rheumatoid arthritis (RA) (Differentially expressed proteins were screened from fold change > 1.2 and p < 0.05).
Materials and Methods
Subjects and Sample Collection
We recruited a total of 1,244 participants from two centers and divided them into five cohorts. Information on patients' clinical parameters was retrospectively collected from medical records. All procedures were approved by the medical ethics committee of the Affiliated Hospital of Nanjing University of Chinese Medicine and followed the tenets of the Declaration of Helsinki (2018NL-106-02). In cohort 1, there were 35 RA patients with moderate to high disease activity and 60 healthy individuals from the Affiliated Hospital of Nanjing University of Chinese Medicine (Table 1). Cohort 2 consisted of 38 RA patients with moderate to high disease activity, 15 RA patients in remission/with low disease activity and 28 healthy subjects from the Affiliated Hospital of Nanjing University of Chinese Medicine (Table 2). Cohort 3 consisted of 221 RA patients with moderate to high disease activity, 50 RA patients with low disease activity, 74 RA patients in remission and 182 healthy subjects from the Affiliated Hospital of Nanjing University of Chinese Medicine; and an additional 47 RA patients with moderate to high disease activity, 34 RA patients with low disease activity, 28 RA patients in remission and 51 healthy subjects from the First Affiliated Hospital with Nanjing Medical University (Tables 3, 4). Cohort 4 was composed of 82 RA patients with moderate to high disease activity before DMARD treatment and 23 RA patients with moderate to high disease activity, 26 RA patients with low disease activity and 33 RA patients in remission after DMARD intervention from the Affiliated Hospital of Nanjing University of Chinese Medicine (Table 5). In cohort 5, there were 35 healthy subjects, 47 RA patients (23 RA patients in remission and 24 RA patients with low to high disease activity), 50 OA patients (12 OA patients with Kellgren-Lawrence grade II and 38 OA patients with Kellgren-Lawrence grade III), 60 AS patients (27 patients with stable AS and 33 patients with active AS), 65 SLE patients (27 patients with inactive SLE and 38 patients with active SLE) and 42 pSS patients (32 patients with stable pSS to pSS with low disease activity and 10 patients with pSS with moderate to high disease activity) from the Affiliated Hospital of Nanjing University of Chinese Medicine (Table 6). The disease activity status of RA was defined according to the DAS28 score using a formula that included the ESR (12). The following subjects were excluded: current smokers and those with rheumatoid vasculitis, proven amyloidosis, infection, known thyroid disease, liver disease, pregnancy and malignancy. Radiographs of both feet and hands were analyzed by board-certified rheumatologists for all patients with RA. Each patient had suffered from RA for at least 6 months. All blood samples were centrifuged immediately at 2,000 × g for 10 min, and sera were transferred into clean Eppendorf tubes, and stored at −80°C before analysis.
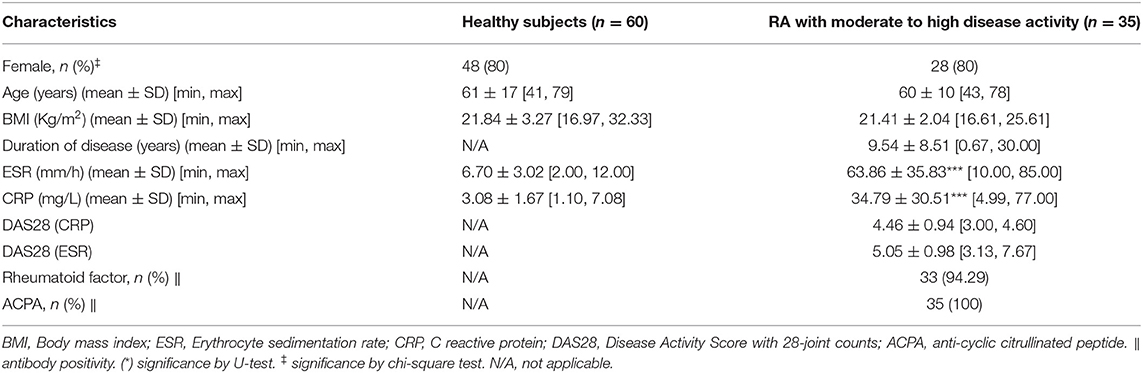
Table 1. Baseline characteristics of rheumatoid arthritis (RA) patients with moderate to high disease activity and healthy subjects from cohort 1.
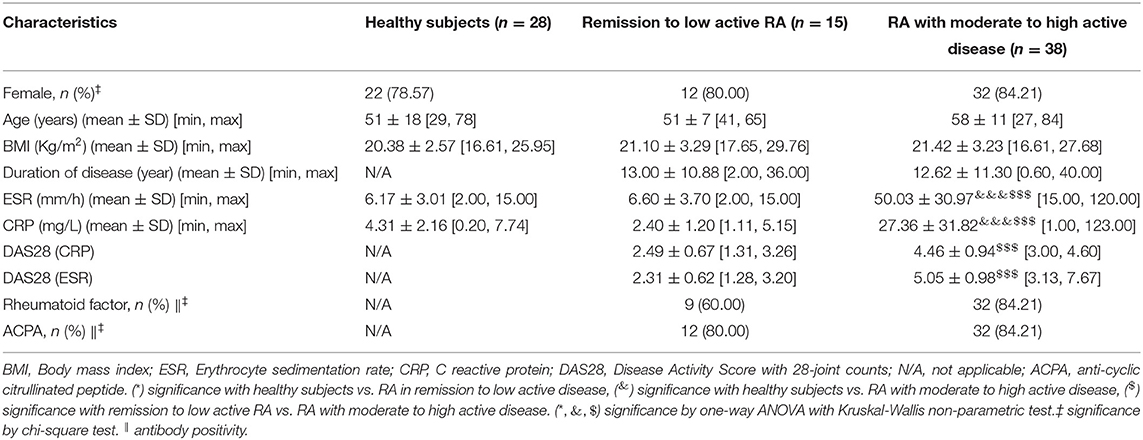
Table 2. Baseline characteristics of remission to low active rheumatoid arthritis (RA), moderate to high active RA and healthy subjects from cohort 2.
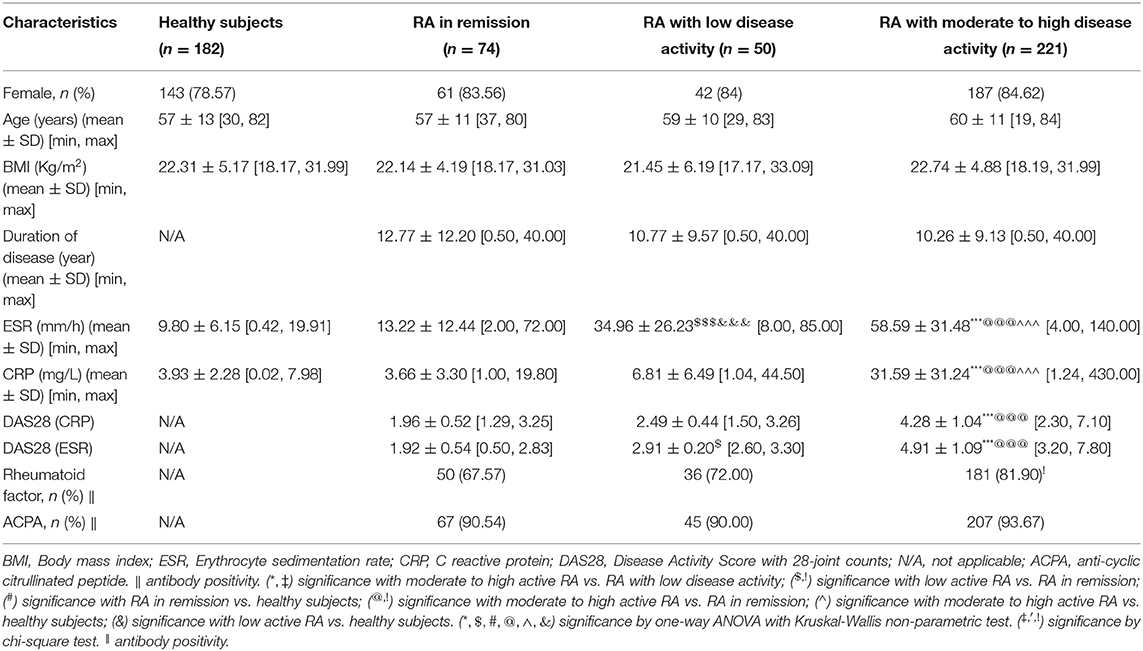
Table 3. Baseline characteristics of rheumatoid arthritis (RA) in remission, RA with low disease activity, RA with moderate to high disease activity and healthy persons in discovery set from cohort 3.
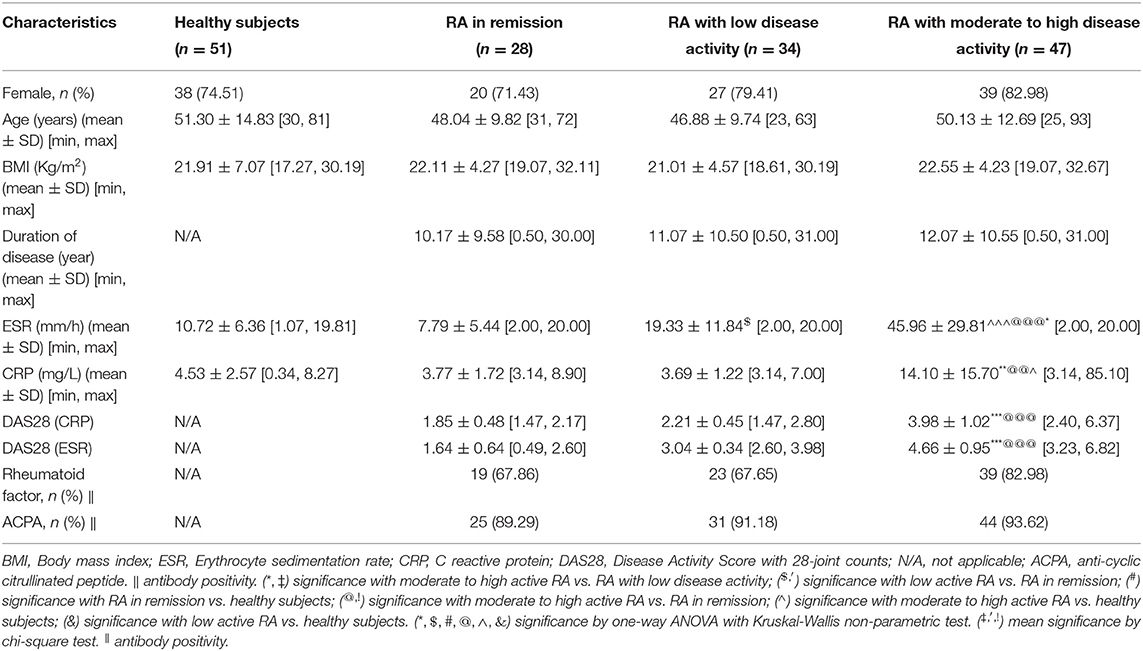
Table 4. Baseline characteristics of rheumatoid arthritis (RA) in remission, RA with low disease activity, RA with moderate to high disease activity and healthy persons in external validation set from cohort 3.
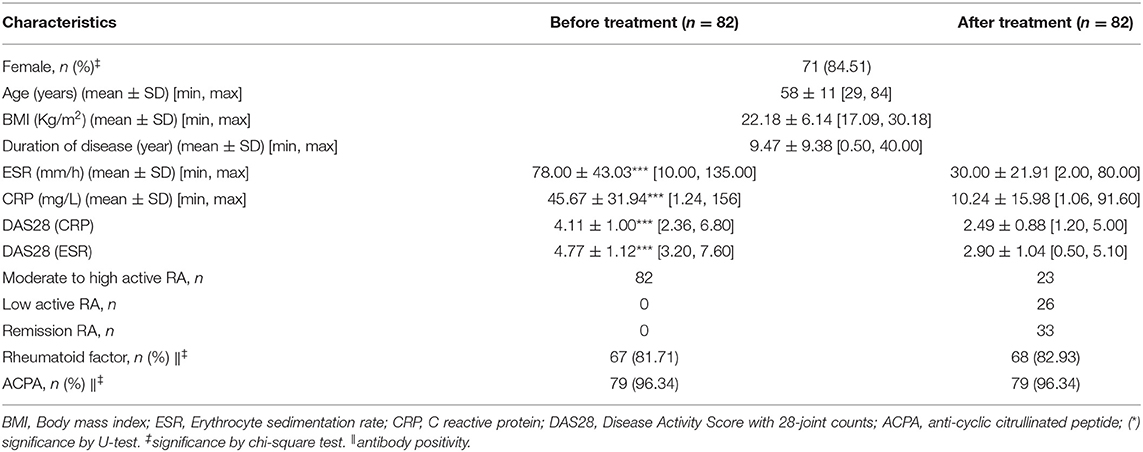
Table 5. Baseline characteristics of rheumatoid arthritis (RA) patients before and after treatment of conventional synthetic disease-modifying anti-rheumatic drugs (DMARDs) in cohort 4.
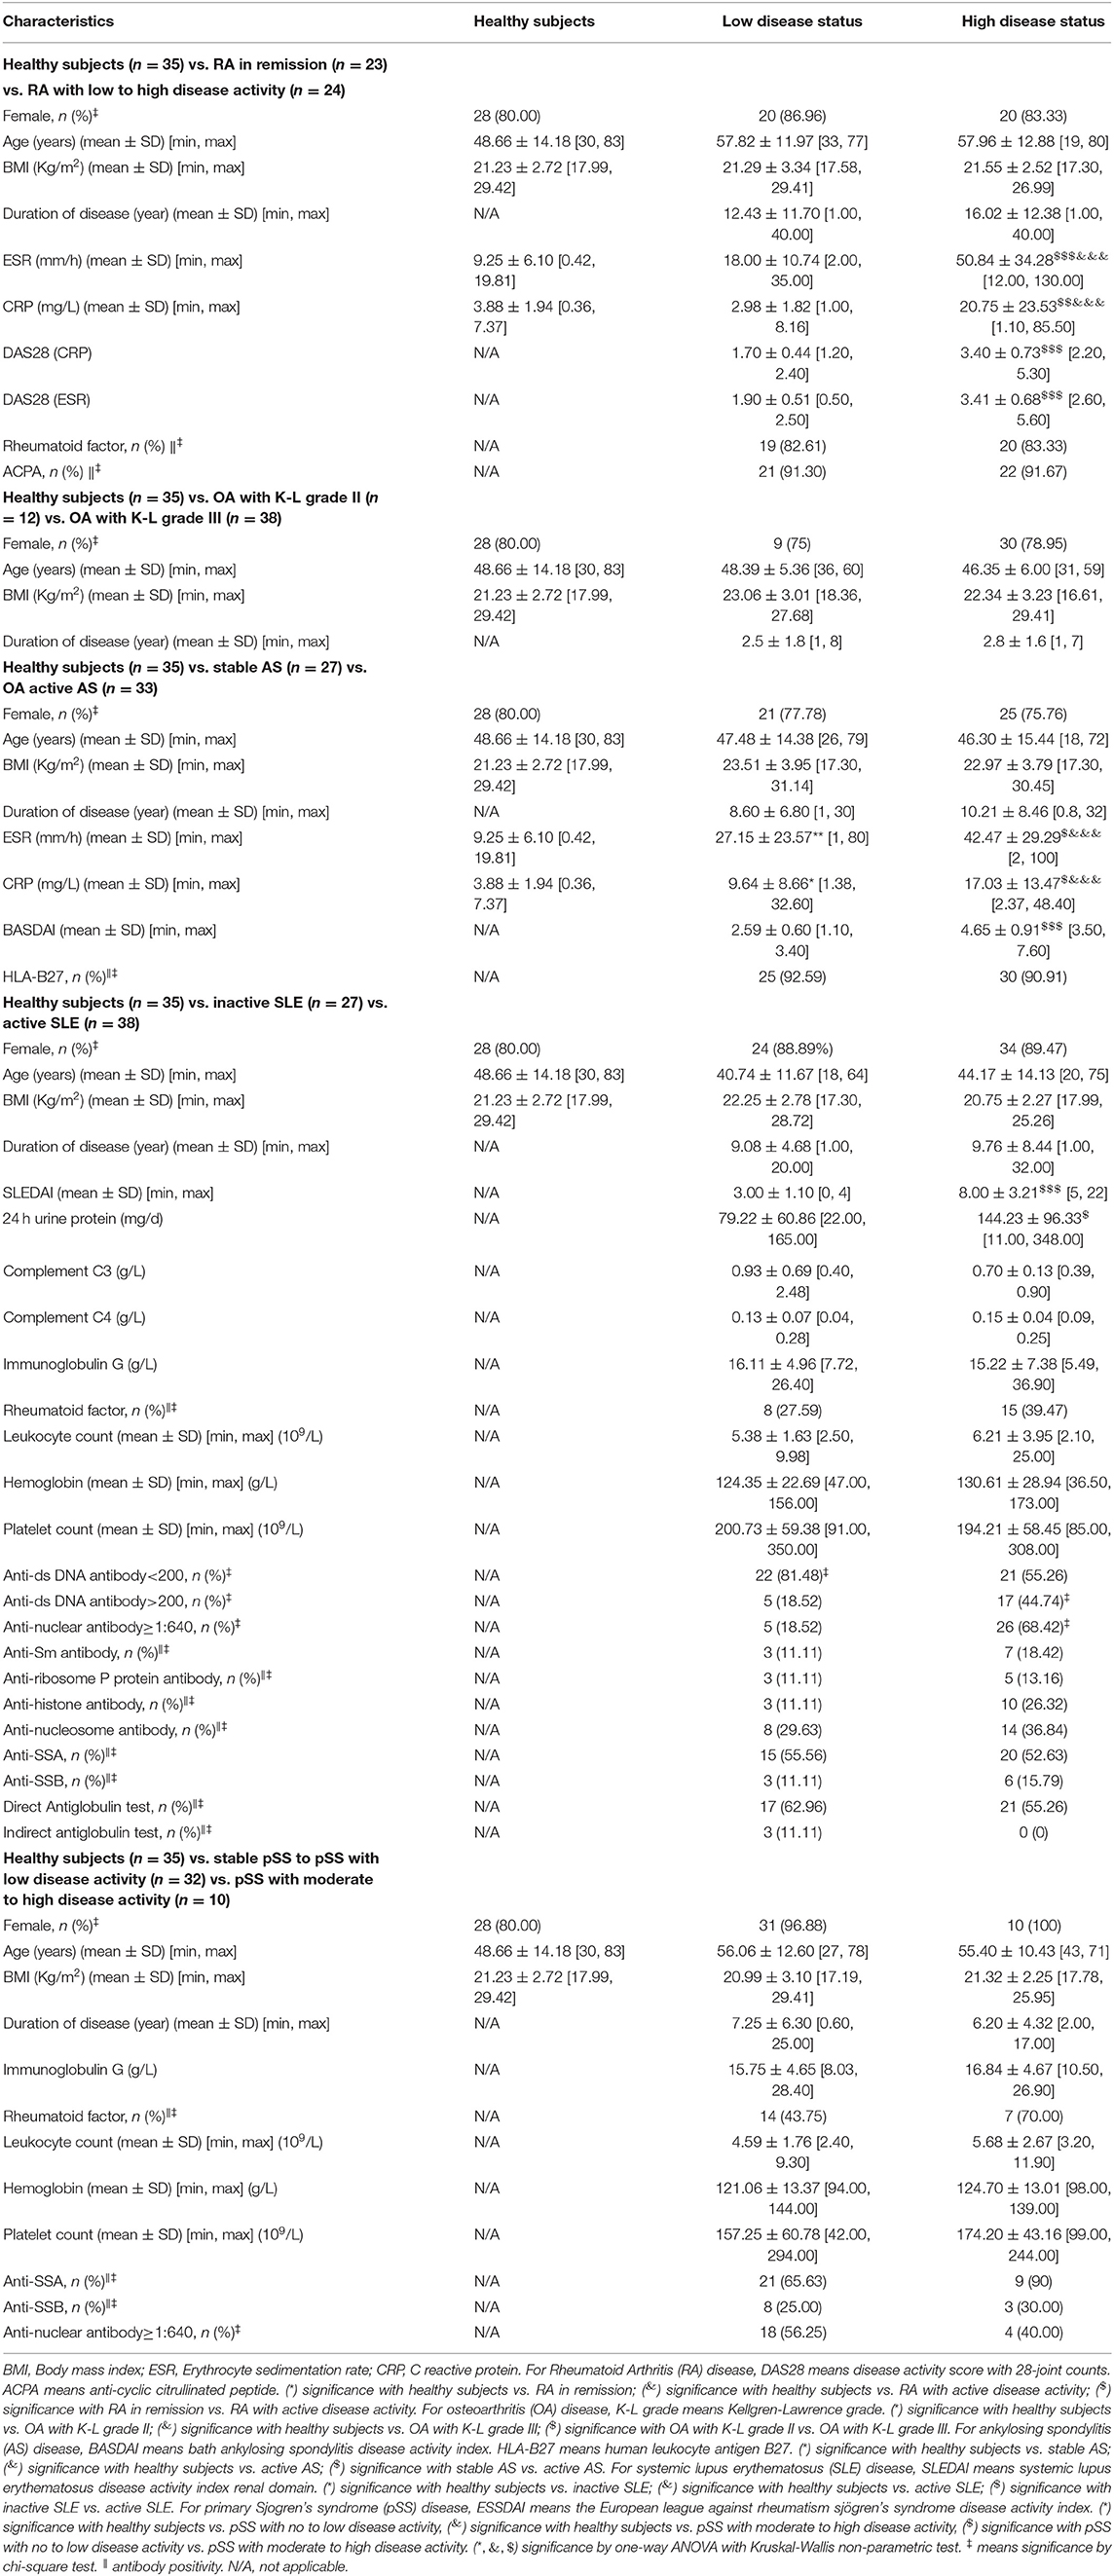
Table 6. Baseline characteristics of rheumatoid arthritis (RA), osteoarthritis (OA) in knee, ankylosing spondylitis (AS), systemic lupus erythematosus (SLE), and primary Sjogren's syndrome (pSS) from cohort 5.
TMT-Based Quantitative Serum Proteomics
The comparative proteomic method was described previously (14). The mass spectrometry proteomics data have been deposited to the ProteomeXchange Consortium (http://www.proteomexchange.org) via the PRIDE partner repository with the dataset identifier PXD021689.
Enzyme-Linked Immunosorbent Assay (ELISA) Analysis of Biomarkers From Cohorts (2–5)
Human alpha-1-acid glycoprotein 2 (ORM2), phospholipase A2 (PLA2) and serum amyloid A2 (SAA2) ELISA kits were purchased from Elabscience Biotechnology Inc. (Houston, Texas, USA). The CRP ELISA kit was purchased from Beckman Coulter, Inc. (Fullerton, CA, USA). The protein-arginine deiminase type-4 (PADI4) ELISA kit was purchased from CUSABIO TECHNOLOGY LLC. (Houston, Texas, USA). Fibrinogen-like protein 1 (FGL1) was purchased from Biorbyt LLC (San Francisco, CA, USA). The serum protein levels in cohorts (2–5) were measured using 96 (Human) ELISA kits according to the manufacturer's protocol.
Statistical Analysis
Results were expressed as the mean ± SD for continuous variables and as the number (percent) for categorical variables. The statistical significance of difference in proteomics between active RA and healthy subjects was calculated using a non-parametric test (Mann–Whitney U-test). For cross-comparison among groups, the Kruskal-Wallis test was used. For categorical data, the difference in prevalence was evaluated by a chi-square or Fisher's exact test. Receiver operating characteristic (ROC) analysis was utilized for diagnosis of different disease activity status. Statistical analyses were performed using SPSS software version 19.0 (IBM Corp., Armonk, New York). For each statistical analysis, a p < 0.05 was considered significance.
Results
Differentially Expressed Proteins in Cohort 1 Are Identified by TMT-Based Proteomics
A comparative proteomic method was used to characterize the protein profiles. Supplementary Figure 1 shows good quality control of the proteomic data with regard to protein coverage, precursor ion tolerance, peptide length and protein mass. From these data, 762 proteins were identified as being differentially expressed in the sera of RA patients vs. healthy persons (Supplementary Table 1). We found 68 upregulated and 74 downregulated proteins in active RA patients compared to healthy subjects (Figure 2A and Supplementary Table 2). Among them, phospholipase A2 (PLA2), CRP, serum amyloid A2 (SAA2), Fibrinogen-like protein 1 (FGL1) and alpha-1-acid glycoprotein 2 (ORM2) were considered the most significantly upregulated immune/inflammation-related proteins, while protein-arginine deiminase type-4 (PADI4) was the most significantly downregulated immune/inflammation-related protein (Figure 2B). The GO database showed that the differentially expressed proteins, mostly existed in the extracellular region, had metal and calcium ion binding functions, and were involved in single-organism and organic substance metabolic processes (Supplementary Figure 2). The KEGG database showed that they were mainly involved in linoleic acid metabolism, alpha-linolenic acid metabolism and the Toll-like receptor signaling pathway (Figure 2C).
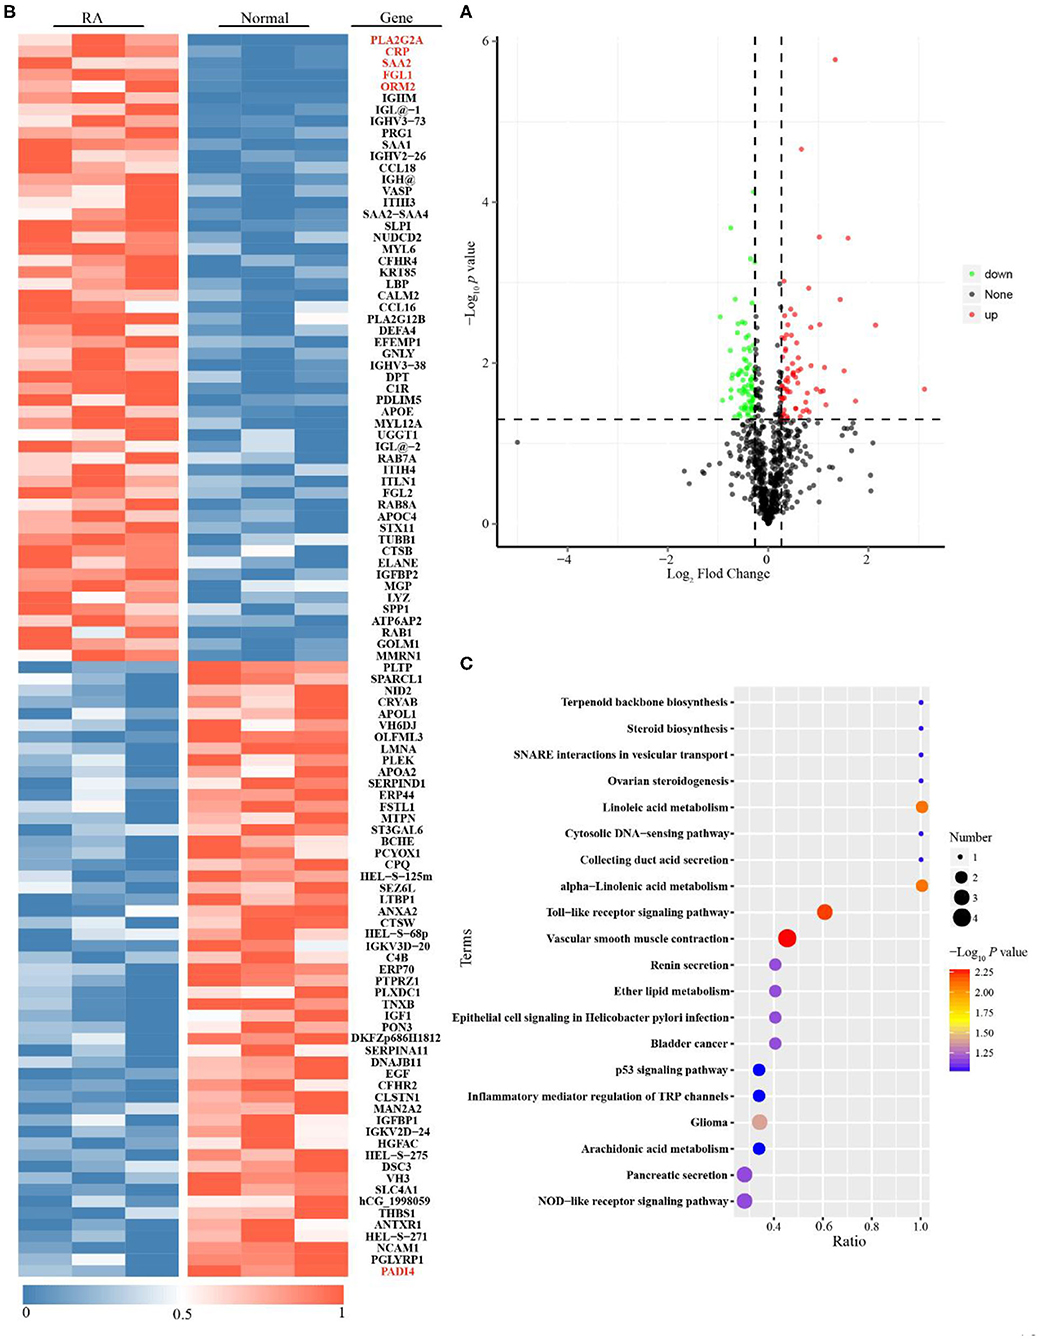
Figure 2. Proteomics analysis for Rheumatoid arthritis (RA) patients with moderate to high disease activity vs. healthy subjects. (A) Single volcano plots of the comparison of moderate to high active RA vs. healthy subjects (68 increased proteins are shown in volcano plots described in red color; 74 decreased proteins are displayed in volcano plots described in green color). (B) Heatmap of 142 differentially expressed proteins for the comparison of moderate to high active RA vs. healthy subjects. (C) KEGG enrichment analysis for differentially expressed proteins (The ratio means the protein numbers of significant differentially expressed proteins which located pathway entry divided into the total protein numbers of all annotated proteins which located pathway entry. When the ratio is greater, it means the degree of enrichment is higher. P-value was determined by hypergeometric test. When the p-value is closer to zero, the enrichment is more remarkable).
Fibrinogen-Like Protein 1 Is a Novel Biomarker for Predicting Disease Activity and Prognosis of RA Based on Cohorts 2–5
Cohort 2 (screening set), cohort 3 (discovery and validation sets), cohort 4 (drug intervention set) and cohort 5 (biomarker-specific evaluation set) were used to discover biomarkers for the assessment of disease activity and prognosis of RA. In cohort 2, we found that the serum concentrations, as determined by ELISA, of CRP and FGL1, but not those of PLA2, SAA2, ORM2, and PADI4 were consistent with the results of the proteomics analysis for the comparison of patients with RA with moderate to high disease activity vs. healthy subjects, while only FGL1 was significantly different in the comparison between RA patients in remission or with low disease activity and healthy subjects (Supplementary Figure 3). In cohort 3, we found that FGL1 can adequately differentiate among patients at different stages in the disease progression; its ability to differentiate among these patients was much better than those of CRP and ESR (Supplementary Figures 4, 5A). The area under the ROC curve (AUC) for the differentiation of RA patients with high/moderate disease activity from those in remission/with low disease activity was 0.935, the sensitivity was 95.16%, the specificity was 77.83% (95% confidence interval from 0.911 to 0.960), and the predictive value was 92.66% in the external validation set when using 0.29 as the cut-off value (Figures 3A1,B1 and Table 7). The AUC, sensitivity and specificity in RA patients with low disease activity vs. those in remission were 0.873, 90.54, and 70%, respectively, with a 95% confidence interval from 0.811 to 0.936, and the predictive value was 93.55% when 0.58 was used as the cut-off value (Figures 3A2,B2 and Table 7). For differentiation of RA patients in remission from healthy subjects, FGL1 had an AUC of 0.905, a sensitivity of 70.88%, a specificity of 98.65% with a 95% confidence interval from 0.871 to 0.940, and a predictive value of 96.20% when 0.84 was used as the cut-off value (Figures 3A3,B3 and Table 7). For the differentiation of RA patients with moderate to high disease activity from RA patients with low disease activity, FGL1 had an AUC of 0.872, a sensitivity of 92.00%, a specificity of 75.11% with a 95% confidence interval from 0.830 to 0.915, and predictive value of 88.89% when 0.23 was used as the cut-off value (Figures 3A4,B4 and Table 7). Meanwhile, the AUC, sensitivity and specificity for the differentiation of RA patients with low to high disease activity from those in remission were 0.959, 97.30, and 85.24% with a 95% confidence interval from 0.940 to 0.977, respectively. The predictive value when 0.16 was used as the cut-off value was 91.74% (Figures 3A5,B5 and Table 7). In cohort 4, we further validated that RA patients with moderate to high disease activity can be adequately distinguished from other RA patients, with predictive accuracies of 92.68% before intervention and 91.46% after drug treatment. Additionally, after treatment, RA patients with low disease activity and those in remission can be differentiated between with a predictive accuracy of 80.77% (Figure 3C and Supplementary Figure 5B). The analysis of cohort 4 showed that FGL1 is a potential biomarker for the prediction of prognosis. To evaluate the specificity of FGL1 for RA, the analysis was performed in cohort 5, and the results showed that the serum levels of FGL1 in OA and AS patients had no significant difference compared with that in healthy persons. The FGL1 level was 2.8-fold in active or inactive SLE and 3.8-fold in pSS with low or moderate to high disease activity, but ~10-fold in RA with low to high disease activity, higher than in healthy subjects (Figure 3D). The analysis in cohort 5 shows that FGL1 exhibits a high level of specificity in the pathogenesis of RA. Overall, the outcome of the study from cohorts 2–5 demonstrates that FGL1 is a good biomarker for the evaluation of disease activity and prognosis of RA.
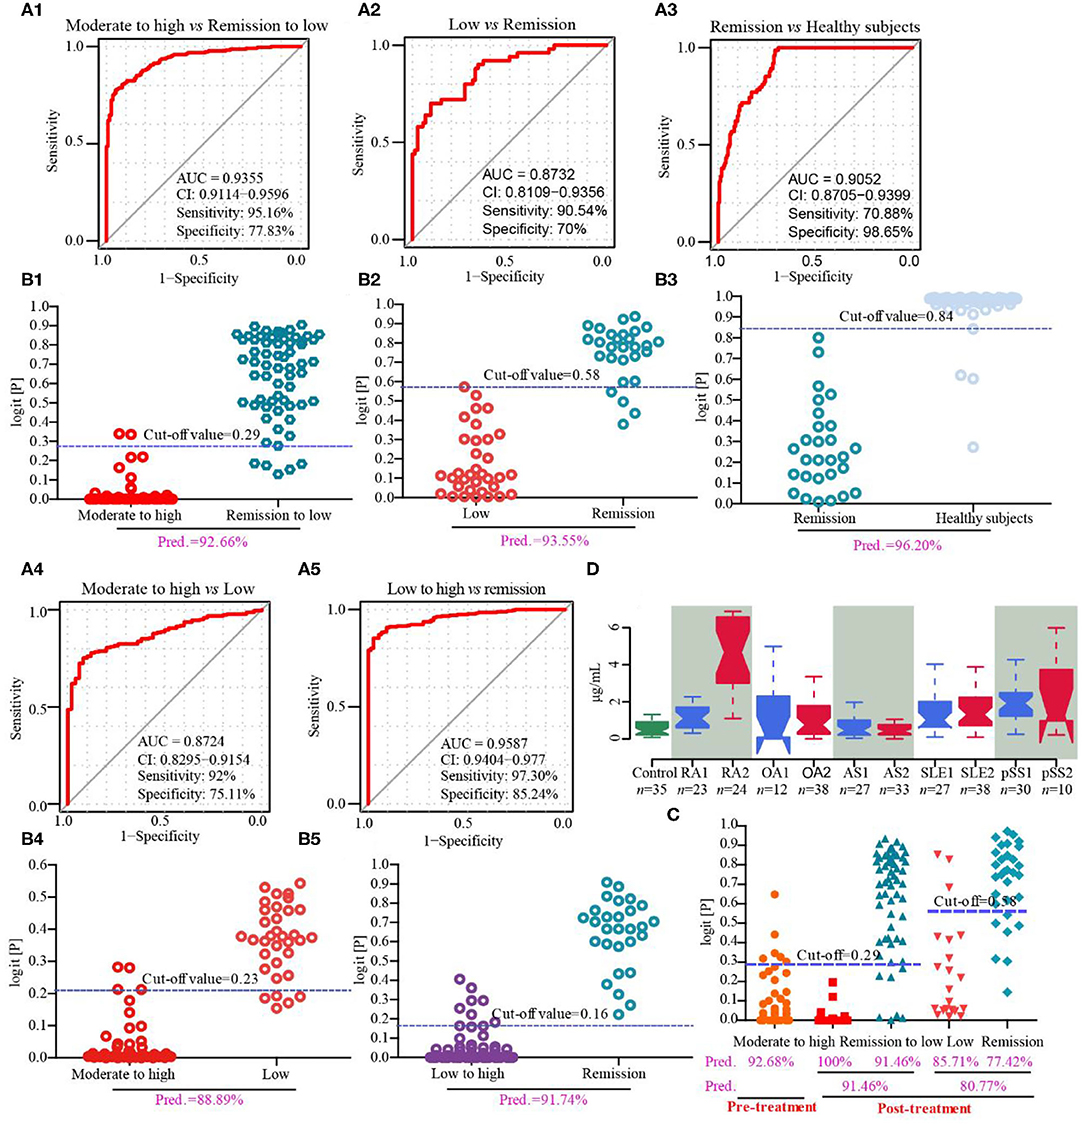
Figure 3. Discovery and validation of fibrinogen-like protein 1 (FGL1) as a novel biomarker from cohorts 3–5. (A1,B1), respectively mean the receiver operating characteristic (ROC) curve in the discovery set and predictive value in the validation set of RA with moderate to high vs. remission to low disease activity from cohort 3; (A2,B2) mean the ROC curve in the discovery set and predictive value in the validation set, respectively, of RA with low disease activity vs. RA in remission from cohort 3; (A3,B3), respectively mean the ROC curve in the discovery set and predictive value in the validation set of RA in remission vs. healthy subjects from cohort 3; (A4,B4) mean the ROC curve in the discovery set and predictive value in the validation phase, respectively, of moderate to high active RA vs. low active RA from cohort 3; (A5,B5), respectively, mean the ROC curve in the discovery set and predictive value in the validation phase of low to high active RA vs. RA in remission from cohort 3. (C) represents the predictive values in drug intervention from cohort 4. (D) describes serum concentrations of FGL1 in healthy subjects (control), RA in remission (RA1), active RA (RA2), osteoarthritis with Kellgren-Lawrence grade II (OA1), osteoarthritis with Kellgren-Lawrence grade III (OA2), stable ankylosing spondylitis (AS1), active ankylosing spondylitis (AS2), inactive systemic lupus erythematosus (SLE1), active systemic lupus erythematosus (SLE2), stable primary Sjogren's syndrome to primary Sjogren's syndrome with low disease activity (pSS1) and primary Sjogren's syndrome with moderate to high disease activity (pSS2). There are no significant differences among control, OA1 and OA2 and among control, AS1 and AS2. It shows no significance in SLE1 vs. SLE2 and pSS vs. pSS2, but significance with control. It displays significance among control, RA1 and RA2. The statistical significance of difference is calculated using a Kruskal-Wallis test.
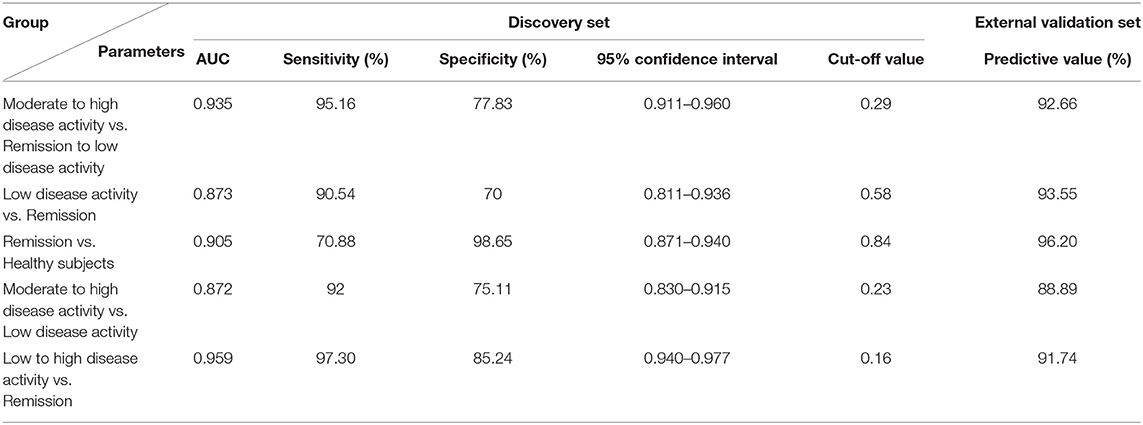
Table 7. Parameters of unconditional logistic regression model for differentiating different disease status of rheumatoid arthritis (RA) in cohort 3.
Discussion
This work describes a comprehensive comparative proteomics analysis of potential biomarkers for the assessment of disease activity and prognosis of RA; this was a large-scale (n = 1,244), two-center study. Proteomic phenotypes revealed 68 upregulated and 74 downregulated proteins among 762 proteins identified in the comparison of RA patients with moderate to high disease activity and healthy subjects, and the most differentially expressed immune-/inflammation-related proteins were PLA2, CRP, SAA2, FGL1, ORM2, and PADI4. The proteomics data strongly support an innate inflammatory pathogenesis in RA (15). Only FGL1 had an AUC of 0.9723 for moderate/high active vs. remission/low active RA, and an AUC of 0.8643 for remission/low active RA vs. healthy persons. We then found that FGL1 from cross-comparisons of moderate to high active RA, low active RA, remission and healthy subjects were ~0.9000 in AUC values and 90% in predictive values. FGL1 showed a good predictive accuracy for disease progression of pre- and post-treated RA patients. Importantly, we found the level of FGL1 in active RA was 10-fold higher than in OA, AS and healthy persons, and 3-fold higher than in SLE and pSS patients. These results suggest that FGL1 is a novel and specific biomarker for predicting progression of RA.
FGL1, called hepatocyte derived fibrinogen-related protein 1 or hepassocin, belongs to the fibrinogen family, with a high degree of amino acid homology with the carboxyl terminus of the fibrinogen β- and γ-subunits, but it does not have a platelet-binding site, cross-linking region, or thrombin-sensitive site, which are necessary for fibrin clot formation (16). FGL1 is primarily secreted by hepatocytes, and partial hepatectomy and IL-6 induce the promoter activity of FGL1, due to the STAT3 and hepatocyte nuclear factor-1 (HNF1) binding sites in the FGL1 promoter (17). FGL1 accelerates hepatocyte proliferation and protects against liver injury by activating the EGFR/ERK cascade through the Src-dependent pathway, exhibiting its potential to be used to treat fulminant hepatic failure in humans (18–20). However, it induces insulin resistance by the disruption of insulin signaling and induces non-alcoholic fatty liver disease (NAFLD) via the mechanism of hepatic lipid accumulation due to the activity of the ERK/JNK pathway. Increased FGL1 level is therefore a risk factor for both diabetes and NAFLD (21–23). FGL1 induces adipogenesis through an ERK1/2-C/EBPβ-dependent pathway. Blocking FGL1 as a therapeutic target may combat obesity (24). Importantly, FGL1 was reported to be a major inhibitory ligand for lymphocyte-activation gene 3 (LAG-3), an immune inhibitory receptor in antigen-specific T cells (25). The level of LAG-3+ regulatory T cells in peripheral blood was lower in RA patients with high disease activity than in healthy subjects, according to a small-scale study (26). It seems that the association of upregulated circulating FGL1 with disease activity is beneficial for the inhibition of autoimmunity but enhances the risks of obesity, diabetes and cardiovascular events (27–29). Finally, FGL1-LAG-3 pathway could become a novel intervention target for RA treatment.
Our study has a few limitations worth mentioning. Firstly, our recruited patients were suffered from RA for at least 6 months. Whether FGL1 plays a role in RA early diagnosis remains unclear. Secondly, we focused on the discovery of protein biomarkers, but ignored the metabolic biomarkers. Thirdly, only serum samples in RA patients were collected. In the future, early stage RA patients (<6 months) will be included to enhance the translational values of FGL1 in the clinical setting, and the combination of proteomics with metabolomics can be used to identify more potential specific biomarkers by analysis of serum, urine, feces, synovial fluid and T cells from blood based on a large-scale, multi-center study.
Data Availability Statement
The datasets presented in this study can be found in online repositories. The names of the repository/repositories and accession number(s) can be found below: http://www.proteomexchange.org/, PXD021689.
Ethics Statement
The studies involving human participants were reviewed and approved by Medical ethics committee of the Affiliated Hospital of Nanjing University of Chinese Medicine and the tenets of the Declaration of Helsinki (2018NL-106-02). The patients/participants provided their written informed consent to participate in this study.
Author Contributions
WZ, SL, WJ, and YG: study design. LL, JL, MK, TX, YL, WC, JW, DK, QS, YZ, and WT: sample collection. WZ, SL, WJ, and YG: analyses of data. WZ, SL, and YG: interpretation of data. WZ and SL: writing and editing of the manuscript. All authors contributed to the article and approved the submitted version.
Funding
This work was financially supported by the National Natural Science Foundation of China (Nos. 81774096, 81704099, and 81803694), the Open Projects of the Discipline of Chinese Medicine of Nanjing University of Chinese Medicine Supported by the Subject of Academic Priority Discipline of Jiangsu Higher Education Institutions (No. ZYX03KF031), the Jiangsu Provincial Medical Youth Talent (Nos. QNRC2016642 and LGY2018061), the Young Elite Scientists Sponsorship Program by CAST (No. QNRC2-B04), the top six talent project of Jiangsu province 2016 (No. WSN-051), the Fundamental Research Funds for the Central Universities (2632020ZD07), and Administration of Traditional Chinese Medicine of Jiangsu Province (ZD201804).
Conflict of Interest
The authors declare that the research was conducted in the absence of any commercial or financial relationships that could be construed as a potential conflict of interest.
Acknowledgments
We thank American Journal Experts for the editorial services rendered and Novogene Corporation for proteomics research. We also thank Mr. Majie Wang from China Pharmaceutical University for data processing.
Supplementary Material
The Supplementary Material for this article can be found online at: https://www.frontiersin.org/articles/10.3389/fimmu.2020.579228/full#supplementary-material
References
1. Gibofsky A. Overview of epidemiology, pathophysiology, and diagnosis of rheumatoid arthritis. Am J Manag Care. (2012) 18:S295–302.
2. Smolen JS, Aletaha D. Patients with rheumatoid arthritis in clinical care. Ann Rheum Dis. (2004) 63:221–5. doi: 10.1136/ard.2003.012575
3. Aletaha DT, Neogi AJ, Silman J, Funovits J, Felson DT, Bingham CO, et al. 2010 rheumatoid arthritis classification criteria: an American College of Rheumatology/European League Against Rheumatism collaborative initiative. Ann Rheum Dis. (2010) 69:1580–8. doi: 10.1002/art.27584
4. Smolen JS, Aletaha D, Bijlsma JW, Breedveld FC, Boumpas D, Burmester G, et al. Treating rheumatoid arthritis to target: recommendations of an international task force. Ann Rheum Dis. (2010) 69:631–7. doi: 10.1136/ard.2009.123919
5. Smolen JS, Landewé R, Bijlsma J, Burmester G, Chatzidionysiou K, Dougados M, et al. EULAR recommendations for the management of rheumatoid arthritis with synthetic and biological disease-modifying antirheumatic drugs: 2016 update. Ann Rheum Dis. (2017) 76:960–77. doi: 10.1136/annrheumdis-2016-210715
6. Singh JA, Saag KG, Bridges SL Jr, Akl EA, Bannuru RR, Sullivan MC, et al. 2015 American College of Rheumatology guideline for the treatment of rheumatoid arthritis. Arthritis Rheumatol. (2016) 68:1–26. doi: 10.1002/art.39480
7. Zatarain E, Strand V. Monitoring disease activity of rheumatoid arthritis in clinical practice: contributions from clinical trials. Nat Clin Pract Rheumatol. (2006) 2:611–8. doi: 10.1038/ncprheum0246
8. Wells G, Li T, Maxwell L, Maclean R, Tugwell P. Responsiveness of patient reported outcomes including fatigue, sleep quality, activity limitation, and quality of life following treatment with abatacept for rheumatoid arthritis. Ann Rheum Dis. (2008) 67:260–5. doi: 10.1136/ard.2007.069690
9. Pincus T, Braun J, Kavanaugh A, Smolen JS. Optimisation of assessment for rheumatic diseases in clinical trials, observational studies and routine clinical care. Clin Exp Rheumatol. 32:S85.
10. Nell V, Machold KP, Stamm TA, Eberl G, Heinzl H, Uffmann M, et al. Autoantibody profiling as early diagnostic and prognostic tool for rheumatoid arthritis. Ann Rheum Dis. (2005) 64:1731–6. doi: 10.1136/ard.2005.035691
11. Kang MJ, Park YJ, You S, Yoo SA, Choi S, Kim DH, et al. Urinary proteome profile predictive of disease activity in rheumatoid arthritis. J Proteome Res. (2014) 13:5206–17. doi: 10.1021/pr500467d
12. Fransen J, Stucki G, van Riel P. Rheumatoid arthritis measures: Disease Activity Score (DAS), Disease Activity Score-28 (DAS28), Rapid Assessment of Disease Activity in Rheumatology (RADAR), and Rheumatoid Arthritis Disease Activity Index (RADAI). Arthritis Care Res. (2003) 49:S214–24. doi: 10.1002/art.11407
13. Prevoo ML, van 't Hof MA, Kuper HH, van Leeuwen MA, van de Putte LB, van Riel PL. Modified disease activity scores that include twenty-eight-joint counts. Development and validation in a prospective longitudinal study of patients with rheumatoid arthritis. Arthritis Rheum. (1995) 38:44–8. doi: 10.1002/art.1780380107
14. Liu S, Ji W, Lu J, Tang X, Guo Y, Ji M, et al. Discovery of potential serum protein biomarkers in ankylosing spondylitis using tandem mass tag-based quantitative proteomics. J Proteome Res. (2020) 19:864–72. doi: 10.1021/acs.jproteome.9b00676
15. Smolen JS, Aletaha D, McInnes IB. Rheumatoid arthritis. Lancet. (2016) 388:2023–38. doi: 10.1016/S0140-6736(16)30173-8
16. Yamamoto T, Gotoh M, Sasaki H, Terada M, Kitajima M, Hirohashi S. Molecular cloning and initial characterization of a novel fibrinogen-related gene, HFREP-1. Biochem Biophys Res Commun. (1993) 193:681–7. doi: 10.1006/bbrc.1993.1678
17. Yu HT, Yu M, Li CY, Zhan YQ, Xu WX, Li YH, et al. Specific expression and regulation of hepassocin in the liver and down-regulation of the correlation of hnf1alpha with decreased levels of hepassocin in human hepatocellular carcinoma. J Biol Chem. (2009) 284:13335–47. doi: 10.1074/jbc.M806393200
18. Li CY, Cao CZ, Xu WX, Cao MM, Yang F, Dong L, et al. Recombinant human hepassocin stimulates proliferation of hepatocytes in vivo and improves survival in rats with fulminant hepatic failure. Gut. (2010) 59:817–26. doi: 10.1136/gut.2008.171124
19. Gao M, Zhan YQ, Yu M, Ge CH, Li CY, Zhang JH, et al. Hepassocin activates the EGFR/ERK cascade and induces proliferation of L02 cells through the Src-dependent pathway. Cell Signal. (2014) 26:2161–6. doi: 10.1016/j.cellsig.2014.04.013
20. Calvaruso V. Hepassocin as a treatment for fulminant hepatic failure: will it translate from rats to human? Gut. (2010) 59:709–10. doi: 10.1136/gut.2009.201020
21. Wu HT, Lu FH, Ou HY, Su YC, Hung HC, Wu JS, et al. The role of hepassocin in the development of non-alcoholic fatty liver disease. J Hepatol. (2013) 59:1065–72. doi: 10.1016/j.jhep.2013.06.004
22. Wu HT, Ou HY, Hung HC, Su YC, Lu FH, Wu JS, et al. A novel hepatokine, HFREP1, plays a crucial role in the development of insulin resistance and type 2 diabetes. Diabetologia. (2016) 59:1732–42. doi: 10.1007/s00125-016-3991-7
23. Jung TW, Chung YH, Kim HC, Abd El-Aty AM, Jeong JH. Hyperlipidemia-induced hepassocin in the liver contributes to insulin resistance in skeletal muscle. Mol Cell Endocrinol. (2018) 470:26–33. doi: 10.1016/j.mce.2017.10.014
24. Wu HT, Chen SC, Fan KC, Kuo CH, Lin SY, Wang SH, et al. Targeting fibrinogen-like protein 1 is a novel therapeutic strategy to combat obesity. FASEB J. (2020) 34:2958–67. doi: 10.1096/fj.201901925R
25. Wang J, Sanmamed MF, Datar I, Su TT, Ji L, Sun J, et al. Fibrinogen-like protein 1 is a major immune inhibitory ligand of LAG-3. Cell. (2019) 176:334–47. doi: 10.1016/j.cell.2018.11.010
26. Nakachi S, Sumitomo SJ, Tsuchida YM, Tsuchiya H, Kono M, Kato R, et al. Interleukin-10-producing LAG3+ regulatory T cells are associated with disease activity and abatacept treatment in rheumatoid arthritis. Arthritis Res Ther. (2017) 19:97. doi: 10.1186/s13075-017-1309-x
27. Solomon DH, Reed GW, Kremer JM, Curtis JR, Farkouh ME, Harrold LR, et al. Disease activity in rheumatoid arthritis and the risk of cardiovascular events. Arthritis Rheumatol. (2015) 67:1449–55. doi: 10.1002/art.39098
28. de Resende Guimarães MFB, Rodrigues CEM, Gomes KWP, Machado CJ, Brenol CV, Krampe SF, et al. High prevalence of obesity in rheumatoid arthritis patients: association with disease activity, hypertension, dyslipidemia and diabetes, a multi-center study. Adv Rheumatol. (2019) 59:44. doi: 10.1186/s42358-019-0089-1
Keywords: rheumatoid arthritis, disease activity, TMT-labeled proteomics, biomarker, fibrinogen-like protein 1
Citation: Liu S, Guo Y, Lu L, Lu J, Ke M, Xu T, Lu Y, Chen W, Wang J, Kong D, Shen Q, Zhu Y, Tan W, Ji W and Zhou W (2020) Fibrinogen-Like Protein 1 Is a Novel Biomarker for Predicting Disease Activity and Prognosis of Rheumatoid Arthritis. Front. Immunol. 11:579228. doi: 10.3389/fimmu.2020.579228
Received: 02 July 2020; Accepted: 20 August 2020;
Published: 06 October 2020.
Edited by:
James Cheng-Chung Wei, Chung Shan Medical University Hospital, TaiwanReviewed by:
Dong Zhou, University of Pittsburgh, United StatesYasser Mohamed El-Sherbiny, Nottingham Trent University, United Kingdom
Copyright © 2020 Liu, Guo, Lu, Lu, Ke, Xu, Lu, Chen, Wang, Kong, Shen, Zhu, Tan, Ji and Zhou. This is an open-access article distributed under the terms of the Creative Commons Attribution License (CC BY). The use, distribution or reproduction in other forums is permitted, provided the original author(s) and the copyright owner(s) are credited and that the original publication in this journal is cited, in accordance with accepted academic practice. No use, distribution or reproduction is permitted which does not comply with these terms.
*Correspondence: Wei Ji, weiweiji1103@163.com; Wei Zhou, wzhou@cpu.edu.cn