 Hans Faber1†‡
 Dunja Kurtoic1‡
 Gurumoorthy Krishnamoorthy2Peter Weber1
 Benno Pütz1
 Bertram Müller-Myhsok1,3*
 Frank Weber1†‡
 Till F. M. Andlauer1,4*‡
- 1Max Planck Institute of Psychiatry, Munich, Germany
- 2Max Planck Institute of Biochemistry, Martinsried, Germany
- 3Institute of Translational Medicine, University of Liverpool, Liverpool, United Kingdom
- 4Department of Neurology, Klinikum rechts der Isar, School of Medicine, Technical University of Munich, Munich, Germany
Recent genome-wide association studies have identified over 230 genetic risk loci for multiple sclerosis. Current experimental autoimmune encephalomyelitis (EAE) models requiring active induction of disease may not be optimally suited for the characterization of the function of these genes. We have thus used gene expression profiling to study whether spontaneous opticospinal EAE (OSE) or MOG-induced EAE mirrors the genetic contribution to the pathogenesis of multiple sclerosis more faithfully. To this end, we compared gene expression in OSE and MOG EAE models and analyzed the relationship of both models to human multiple sclerosis risk genes and T helper cell biology. We observed stronger gene expression changes and an involvement of more pathways of the adaptive immune system in OSE than MOG EAE. Furthermore, we demonstrated a more extensive enrichment of human MS risk genes among transcripts differentially expressed in OSE than was the case for MOG EAE. Transcripts differentially expressed only in diseased OSE mice but not in MOG EAE were significantly enriched for T helper cell-specific transcripts. These transcripts are part of immune-regulatory pathways. The activation of the adaptive immune system and the enrichment of both human multiple sclerosis risk genes and T helper cell-specific transcripts were also observed in OSE mice showing only mild disease signs. These expression changes may, therefore, be indicative of processes at disease onset. In summary, more human multiple sclerosis risk genes were differentially expressed in OSE than was observed for MOG EAE, especially in TH1 cells. When studying the functional role of multiple sclerosis risk genes and pathways during disease onset and their interactions with the environment, spontaneous OSE may thus show advantages over MOG-induced EAE.
Introduction
Although animal models are widely used in human research, it is still discussed whether they can adequately mirror diseases like multiple sclerosis (MS) that only exist in humans. MS is a chronic inflammatory disease of the central nervous system (CNS), with both environmental and genetic risk factors contributing to disease susceptibility. The recent identification of more than 230 genetic risk loci for MS (1, 2) requires a reassessment of the widely used experimental autoimmune encephalomyelitis (EAE) animal models. To support analyses of the primary cause and etiology of MS, animal models should ideally replicate mechanisms taking place during MS disease induction.
Most EAE models are actively induced by injection of myelin-derived antigens in conjunction with potent adjuvants (3). One such antigen is myelin oligodendrocyte glycoprotein (MOG), a component of the outer surface of myelin (4). Injection of the MOG35−55 peptide into C57BL/6 mice leads to chronic EAE (5) and thus serves as a popular animal model to date. A related model, passively-transferred EAE, is caused by bulk transfer of in vitro-activated myelin-specific T cells (6).
By contrast, transgenic models such as opticospinal EAE (OSE) spontaneously develop autoimmune disease and may, therefore, be better suited to study disease onset than induced EAE is. Spontaneous models can be used for identifying environmental triggers of MS (7, 8) and might support analyses of genetic risk factors for human MS. They circumvent problems specific to induced ones, such as adjuvant inoculation, with its partially unknown effects. In OSE, ~50% of the animals develop a spontaneous inflammatory demyelinating CNS disease, predominantly affecting optic nerves and the lumbar part of the spinal cord (9). These mice carry two transgenic modifications: they express a T cell receptor (TCR) recognizing the MOG35−55 peptide and B cells with MOG-specific receptors. In OSE, MOG-specific B cells function as antigen-presenting cells to trigger disease onset by activating MOG-specific T cells (10). Notably, B cell-depleting treatments for MS appear to target primarily cellular and not humoral B cell responses, and, thus, result in a reduced T cell activation (11).
For a long time, TH1 cells were considered as the predominant drivers of EAE and MS (4). This hypothesis was challenged by emerging evidence for a substantial role of TH17 cells in the disease etiology, including the discovery that the transfer of TH17 cells can induce EAE. In fact, both TH cell types can induce EAE, albeit with distinct pathologies (12). In humans, genome-wide association studies (GWAS) have identified many MS risk loci that support a central role of TH cells and TH cell differentiation in the pathophysiology of MS (1, 2, 13).
Despite their valuable contributions to our understanding of MS pathophysiology and drug development, the relationship of EAE to human MS remains controversial (14). All available EAE models are, to some degree, artificial. Therefore, knowledge of whether gene expression changes in diseased mice involve MS risk genes can support the choice of an EAE model for specific research projects. The present study had three aims: First, to characterize gene expression differences in diseased OSE and MOG35−55 EAE mice, two widely used EAE models with markedly different forms of induction. Second, to explore which of OSE or MOG-induced EAE resembles human MS more closely. To this end, we examined to which degree genes differentially expressed in spinal cord samples of OSE and MOG EAE showed significant enrichment of human MS risk genes. Third, to analyze expression differences of TH cell-specific transcripts in both EAE models.
Materials and Methods
Mice, Animal Handling, and Scoring
All mice used in this study had a C57BL/6 background and were bred in the animal facilities of the Max Planck Institute of Biochemistry and Neurobiology, Martinsried, Germany. For the OSE model, double-transgenic 2D2 (TCRMOG) × IgHMOG (OSE) mice were used (9). For MOG EAE, wildtype C57BL/6 mice were immunized subcutaneously with 200 μg of a MOG peptide consisting of the amino acids 35–55, emulsified in complete Freund's adjuvant supplemented with 5 mg/ml Mycobacterium tuberculosis (strain H37Ra, Thermo Fischer Scientific BD Difco), as described previously (9). Pertussis toxin (400 ng, List Biological Laboratories) was injected intraperitoneally on the day of immunization and 48 h later. Control mice (CFA) received the same treatment but without the MOG peptide. For the analysis of EAE models, only female mice were used. For the TH cell analyses, OSE mice of mixed gender were used (15).
Scores for clinical signs of EAE were assessed daily according to the standard 5-point scale (9, 16): 0: healthy animal; 1: animal with a flaccid tail; 2: animal with impaired righting reflex and/or gait; 3: animal with one paralyzed hind leg; 4: animal with both hind legs paralyzed; 5: moribund animal or death of the animal after preceding clinical disease. See Supplementary Figure 1 for the disease course of MOG EAE compared to control mice. Following our ethically approved protocol, the mice were sacrificed when they reached a score of 4. The animal welfare committee of the government of Upper Bavaria (Tierschutzkommission der Regierung von Oberbayern, Munich, Germany) approved the protocol. The animal procedures were in strict accordance with the guidelines set down by the animal welfare committee of the government of Upper Bavaria.
In vitro CD4+ T Cell Differentiation
T cells derived from the spleen of a mixed-gender pool of four OSE mice were used to polarize pathogenic effector TH1 and TH17 cells, as described previously (15). In brief, four separate batches of four mice each were used for this experiment. To generate TH1 cells, total erythrocyte-lysed spleen cells from OSE mice were cultured in the presence of a MOG peptide (amino acids 1–125), IL-12, IL-18, and anti-IL-4. After 3 days, IL-2 was added to the culture. To generate TH17 cells, total erythrocyte-lysed spleen cells from OSE mice were cultured in the presence of a MOG peptide (amino acids 1–125), TGF-β1, IL-6, IL-23, anti-IL-4, and anti-IFN-γ. After 3 days, IL-23 was added to the culture. In both cases, cells were re-stimulated after 6 days and harvested after 9 and, once more, after 12 days. Naïve TH0 cells were harvested on day 0. The success of polarization was evaluated by flow cytometry, ELISA, and quantitative real-time PCR (Supplementary Figure 2 and Supplementary Methods).
Microarrays
Two separate microarray experiments were performed on the Illumina gene expression profiling platform: The first comprised RNA isolated from total spinal cord preparations of healthy and diseased EAE mice. The second experiment analyzed gene expression profiles of naïve TH0 cells and in vitro polarized TH1 and TH17 cells. For the analysis of EAE models, the Sentrix BeadChip Array MouseWG-6 v2 (Illumina, San Diego, USA) was used; for the TH cell microarray, the Sentrix BeadChip Array MouseWG-6 v1.1 (Illumina, San Diego, USA). Four chips (24 samples, four per experimental group) were hybridized in the EAE experiment, three chips (18 samples from four separate experiments: 4 × TH0, 7 × TH1, 7 × TH17) were used for the TH cell analysis. In each experiment, all samples and chips were processed in parallel. RNA processing, array hybridization, and quantification followed the same protocols in both experiments: First, concentration and purity of total RNA were assessed by 260 nm UV absorption and by 260/280 ratios, respectively (Nanophotometer, Implen, Munich, Germany). Second, RNA integrity was evaluated using a chip-based electrophoretic assay (Agilent RNA 6000 Nano Kit used in conjunction with the Agilent 2100 bioanalyzer, Agilent Technologies, Waldbronn, Germany). Mean RNA integrity numbers were 8.4 (SD = 0.5) for the EAE and 9.0 (SD = 0.5) for the TH cell experiment. Third, RNA was amplified and labeled using the Illumina TotalPrep RNA Amplification Kit (Ambion, Houston, TX, USA) and hybridized onto Illumina gene expression arrays following the manufacturer's instructions. Fourth, fluorescence signals were scanned on an Illumina BeadStation and analyzed by in-house software routines. The manufacturer's built-in controls were analyzed, including hybridization controls and sample-dependent parameters. All microarrays fulfilled Illumina's recommendations for quality control (QC).
Quality Control of Microarrays
Raw probe intensities were exported as summary data using Illumina's GenomeStudio, and further statistical processing was carried out using R v3.3.2 (17). For the analysis of EAE models, summary data was loaded using the Bioconductor package beadarray (18), and QC was conducted with lumi (19) and vsn (20). Each probe was transformed and normalized through variance stabilization and normalization. Probes were removed if they showed a detection p-value < 0.05 in >10% of the samples or had a “no match” or “bad” probe quality in the illuminaMousev2.db package. This procedure left 21,483 transcripts from 24 samples. For the TH cell experiment, summary data was loaded using limma (21) and QC was conducted with limma and vsn. Probes were transformed, normalized, and filtered as described above, based on the illuminaMousev1p1.db package. This pipeline left 17,858 transcripts. Technical batch effects were examined by inspecting the association of the first ten principal components of expression levels with expression chip and position on the chip.
Analysis of Differential Expression
Principal component analysis (PCA) was conducted in R using the function prcomp without scaling of variables; PCs were scaled for display. K-means clustering was performed using kmeans with k = 4; the analysis was repeated 100 times and the most stable clustering solution was selected. Differential expression was assessed with limma. For the analysis of differential expression across the EAE models, six mouse types were examined (with four mice each): wild-type (WT); healthy OSE controls (OSE0); OSE with disease score 1 (OSE1); OSE score 4 (OSE4); as a MOG EAE control, healthy control mice injected with complete Freund's adjuvant but not with a MOG peptide (CFA); as MOG35−55 EAE, C57BL/6 wildtype mice injected with adjuvant and MOG35−55 peptide, rated score 4 (MOG4). The design matrix was constructed from the six mouse types. Each expression chip contained one sample per mouse type. The four chips were added to the model as random effects via the duplicateCorrelation function. The five contrasts MOG4-CFA, CFA-WT, OSE4-OSE0, OSE1-OSE0, and OSE4-WT were computed on the fitted linear model and moderated t-tests were calculated using the eBayes function. For the TH cell experiment, the design matrix was constructed from the three cell types (naïve TH0, TH1, TH17), with the four mouse pools treated as random effects. Only TH1 and TH17 cells harvested on day 9 were analyzed. The two contrasts TH1-TH0 and TH17-TH0 were examined.
Overrepresentation Analyses
Overrepresentation analyses (ORA) were conducted using WebGestalt v2019 (22) in R, based on the gene ontology (GO) biological process database. Genes were submitted as unique Entrez IDs, and the reference was genome protein-coding. The significance level was determined using a hypergeometric test, followed by calculation of the Benjamini-Hochberg false discovery rate (FDR) (23).
Enrichment Tests
The enrichment of genes was calculated using a permutation test in R. For this test, the unique Entrez IDs of genes were used. First, the amount of unique differentially expressed genes was determined, and the same number of random genes was selected. Second, the number of these random genes overlapping with the test set of genes (e.g., MS susceptibility genes) was determined. These two steps were repeated 100,000 times. Third, to calculate a p-value, the number of observations where the overlap between random genes and test genes was equal to or larger than the overlap between differentially expressed genes and test genes was counted and divided by the number of permutations.
For the enrichment analysis with MS susceptibility genes, the 558 genes outside the major histocompatibility complex (MHC) region listed in Supplementary Table 18 of the MS genomic map published in 2019 by the IMSGC were used (2). From this list, CTB-50L17.10, RP11-345J4.5, JAZF1-AS1, ZEB1-AS1, GATA3-AS1, SSTR5-AS1, and RPL34-AS1 were excluded to generate the list of 551 prioritized putative MS susceptibility genes described in the IMSGC publication.
Results
We compared gene expression profiles of total spinal cord preparations derived from two EAE models, OSE and MOG35−55 EAE. Double-transgenic OSE mice developed CNS autoimmunity spontaneously, predominantly affecting the lumbar part of the spinal cord. In the MOG35−55 EAE model, the disease was induced in C57BL/6 wildtype (WT) mice by immunization with a MOG35−55 peptide. PCA of gene expression profiles separated healthy (OSE0, CFA, and WT) from diseased [OSE score 1 (OSE1), OSE score 4 (OSE4), and MOG score 4 (MOG4)] animals along the first component (Figure 1A). Most variance in gene expression was thus observed between healthy and diseased mice and not between EAE models. Because of the spontaneous nature of disease development in OSE mice, gene expression in diseased OSE4 animals showed more variance than was, e.g., observed in MOG4 mice, which exhibit a more stereotypic disease course (9).
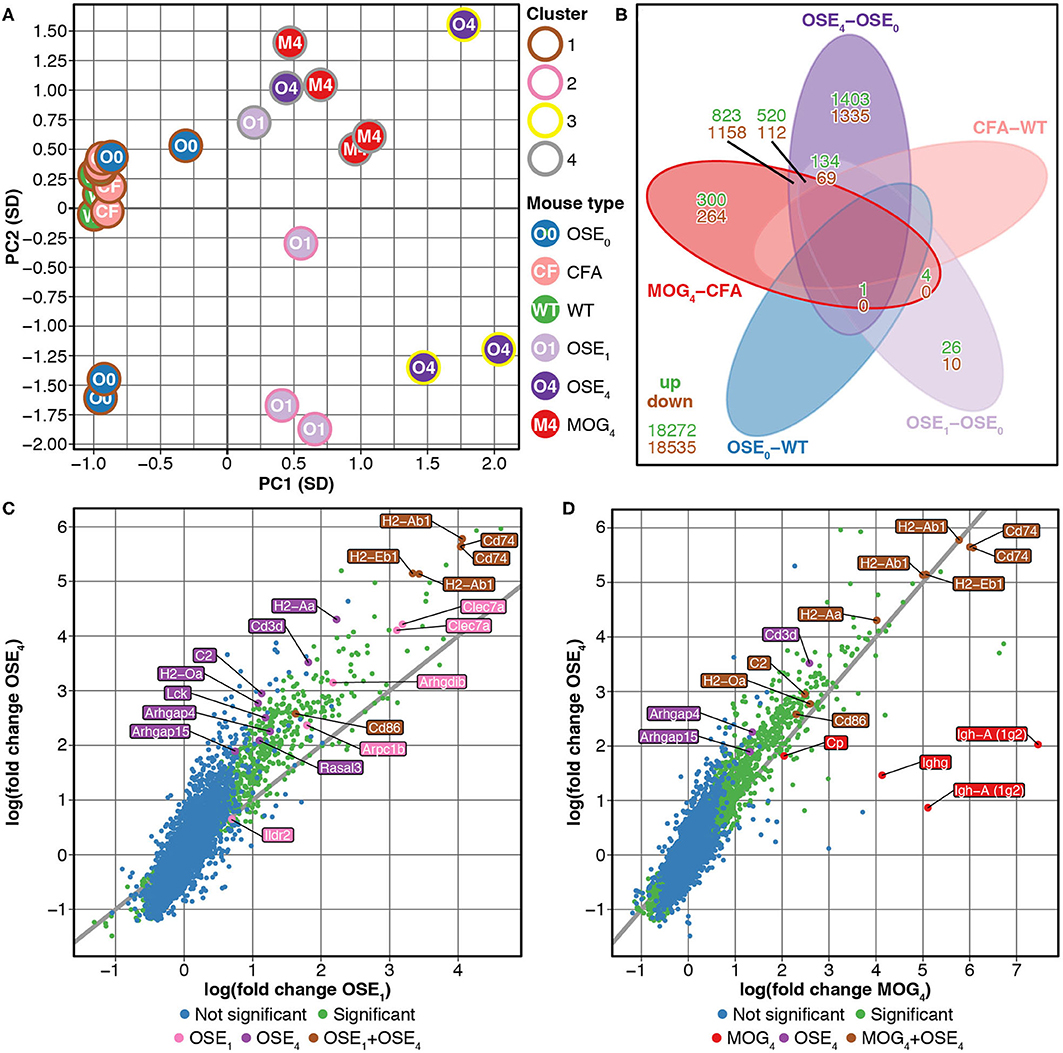
Figure 1. Differential expression analysis of OSE and MOG EAE models. (A) Principal component analysis (PCA) of gene expression profiles grouped by k-means clustering. The cluster solution displayed here was the most frequent (34 of 100). In 97 of 100 analyses, all WT, OSE0, and CFA mice were placed into separate clusters than OSE1, OSE4, and MOG4 mice (Supplementary Table 1). Because of the spontaneous nature of disease development in OSE mice, gene expression in diseased OSE4 animals showed more variance than was, e.g., observed in MOG4 mice, which exhibit a more stereotypic disease course (9). PC, principal component; SD, standard deviations. (B) Venn diagram highlighting the number of transcripts differentially expressed in the analyzed contrasts. For this plot, up- and downregulated transcripts were analyzed separately, and transcripts differentially expressed in opposing directions are therefore included in the counts. (C,D) OSE4 mice showed greater fold changes of expression levels than (C) OSE1 and (D) MOG4 mice, each compared to its control condition (OSE0 and CFA, respectively) (Supplementary Table 3). For each group, the ten most differentially expressed genes (with Entrez IDs) are labeled. If two probes per gene were present among the top differentially expressed transcripts, the gene was counted only once, but both probes are plotted. The groups are: differentially expressed in OSE1 only (light magenta), differentially expressed in OSE4 only (dark magenta), differentially expressed in MOG4 only (red), differentially expressed in (C) both OSE1 and OSE4 or (D) both MOG4 and OSE4 (brown; with higher expression levels observed for OSE4).
Unsupervised k-means clustering on PCs further supported this finding, which consistently (in 97 of 100 replications) placed healthy and diseased animals into separate clusters (Figure 1A, Supplementary Table 1). The most frequent cluster solution (34/100) placed all healthy mice together in cluster 1; additional clusters were OSE1 only (cluster 2), OSE4 only (cluster 3), and a mixed cluster of the remaining diseased animals (cluster 4). We could thus successfully detect disease-relevant gene expression changes in the animals.
Stronger Gene Expression Changes in the OSE Model
Next, we analyzed gene expression changes in OSE and MOG EAE mice. We examined differential expression for five contrasts: OSE1-OSE0, OSE4-OSE0, MOG4-CFA, and the two control contrasts CFA-WT and OSE0-WT (Figure 1B, Supplementary Table 2). In the control contrast CFA-WT, no transcript was differentially regulated. A single transcript was upregulated in OSE0-WT, T cell receptor alpha chain (Tcra), which was also upregulated in all other contrasts except CFA-WT. The number of significantly up- and downregulated transcripts was higher for OSE4-OSE0 (n = 5,555) than for MOG4-CFA (n = 3,182). In total, the expression of 864 transcripts differed significantly between MOG4 and OSE4 mice (Supplementary Table 2). Interestingly, 4.88× more transcripts were differentially expressed specifically only in OSE4-OSE0 than only in MOG4-CFA (Figure 1B). Moreover, fold changes were higher in OSE4-OSE0 than in either OSE1-OSE0 (binomial test: p = 1.4 × 10−65 for all transcripts, p = 9.9 × 10−119 for transcripts differentially expressed in both contrasts, Figure 1C) or MOG4-CFA (p = 5.8 × 10⁻³ for all, p = 2.7 × 10−221 for differentially expressed transcripts, Figure 1D; Supplementary Table 3). Stronger global gene expression changes were thus triggered in OSE than in MOG EAE.
Overrepresentation of Immune System Processes Especially for OSE
To characterize the expression changes in the different EAE models further, we conducted ORA analyses of the analyzed contrasts (Supplementary Table 4, Supplementary Figure 3) and of differentially expressed transcripts for three groups (Supplementary Figure 4): First, common disease transcripts (CDT), differentially expressed for both contrasts OSE4-OSE0 and MOG4-CFA but not in the two control contrasts OSE0-WT or CFA-WT. Second, OSE4-specific transcripts (OSE4sp), differentially expressed for the contrast OSE4-OSE0 but not for MOG4-CFA or the control contrasts. Third, MOG4-specific transcripts (MOG4sp), differentially expressed for MOG4-CFA but not for OSE4-OSE0 or the control contrasts. When examining CDT, 1,379 redundant GO biological processes remained significant after correction for multiple testing (Supplementary Table 4). Together with other immune-related gene sets, immune response, regulation of immune system process, and T cell activation were among the top-associated terms (adjusted p < 2 × 10⁻¹⁶). These and other immune-associated processes remained significant in OSE4sp (adjusted p ≤ 3.5 × 10⁻², Supplementary Figure 4). By contrast, no immune system-specific process was significant for MOG4sp. More expression changes in the immune system were, therefore, triggered in OSE than in MOG EAE.
Activation of the Adaptive Immune System in OSE1 Mice
While MOG EAE develops rapidly in a highly stereotypical manner, the clinical course of OSE is usually slower and shows more inter-individual variability (24). OSE thus allows for studying disease at different stages, and we analyzed mice showing a mild disease score of 1 (OSE1). Compared to OSE0, 34 transcripts were differentially expressed specifically in OSE1 animals and not in any other contrast [OSE1-specific transcripts (OSE1sp), Supplementary Table 5]. These transcripts are potentially indicative of changes during mild or early disease. However, no significant GO biological processes were identified for them. Transcripts differentially regulated in both OSE1 and OSE4 consistently showed the same direction of regulation compared to OSE0 [binomial test p = 4.36 × 10−252, 95% confidence interval (CI) 0.995–1.0, Supplementary Table 3]. When analyzing all transcripts differentially expressed in OSE1-OSE0 but not in control contrasts [OSE1-expressed transcripts (OSE1ex), Supplementary Table 5], 805 processes were significant after correction for multiple gene sets. Among them were the three previously highlighted GO terms (adjusted p < 2 × 10⁻¹⁶, Supplementary Table 4, Supplementary Figure 4). Furthermore, the gene sets B cell mediated immunity and antigen processing and presentation were significantly overrepresented not only in the analysis of CDT but also for the OSE1ex transcripts, indicating a potential role of B cells also in mildly affected OSE mice.
Enrichment of MS Susceptibility Genes Among Transcripts Expressed in OSE
Over 230 independent genetic loci associated with MS susceptibility in humans have been identified (1, 2). Based on these GWAS loci, 551 human MS susceptibility candidate genes have been proposed (2), for which expression data of 499 transcripts were available in our dataset. We conducted a PCA on these transcripts (265 genes) to analyze whether the expression of MS risk genes was increased in the EAE models. The first component, explaining 75.7% of the variance in expression of these transcripts, was significantly higher in all disease groups than in controls, indicating high expression levels of MS-associated genes in EAE, with the highest levels observed for OSE4 (Figure 2A, Supplementary Table 6). Also individual MS risk genes, e.g., H2-Ab1, Cd52, and Cd86 (1, 2), as well as further putative MS-associated genes like Cd74, were among the transcripts showing the lowest differential expression p-values. They were significantly upregulated in all three diseased mouse types (Figures 1C,D, 2B–D, Supplementary Figure 5, Supplementary Table 2). Furthermore, differentially expressed genes from the analysis sets CDT, OSE4sp, and OSE1ex were significantly enriched for MS risk genes, while the MOG4sp genes were not (Table 1). OSE might thus be more closely connected to the etiology of human MS than MOG35−55 EAE is.
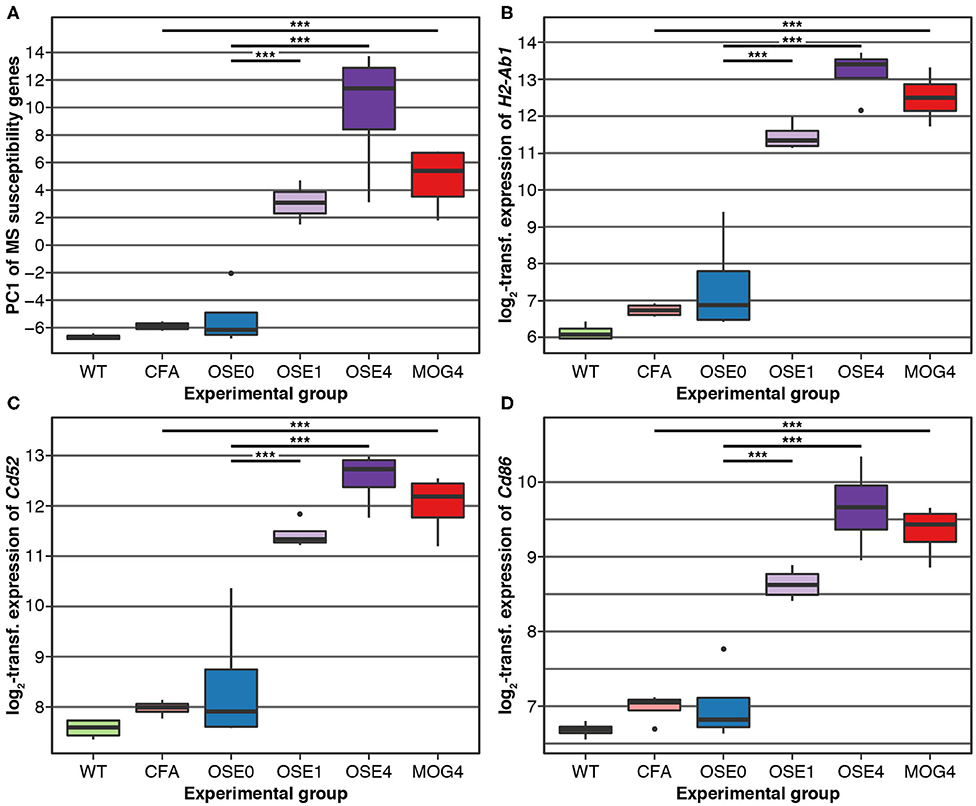
Figure 2. MS risk genes show a higher expression in diseased EAE animals. (A) Principal component analysis (PCA) of gene expression profiles of putative MS risk genes. Diseased mice showed higher MS risk gene expression levels (Supplementary Table 6). PC, principal component; y-axis unit, standard deviations. (B–D) Examples of expression levels of three putative MS risk genes, H2-Ab1, Cd52, and Cd86 (Supplementary Table 2). In all three cases, diseased mice showed significantly higher expression levels, with the highest expression observed for OSE4 mice. Significance levels: *** adjusted p < 0.001.
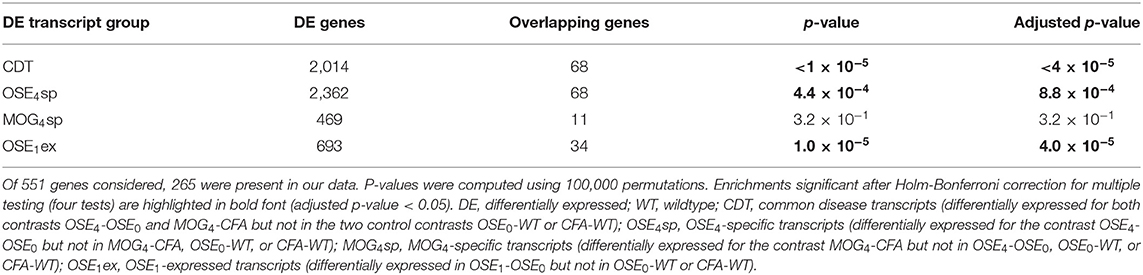
Table 1. Enrichment of MS susceptibility genes.
Gene Expression in OSE Overlaps With TH Cell-Specific Transcripts
TH cell differentiation was identified as a key pathway in the etiology of MS (13). We, therefore, analyzed whether gene expression changes in EAE models were related to TH cell differentiation. To this end, gene expression profiling of in vitro polarized TH1 and TH17 cells was conducted, derived from OSE mice. Compared to naïve TH0 cells, 8 × more transcripts were differentially expressed specifically in TH1 than in TH17 cells (Figure 3A). None of the transcripts differentially expressed in both TH1 and TH17 were regulated in opposite directions.
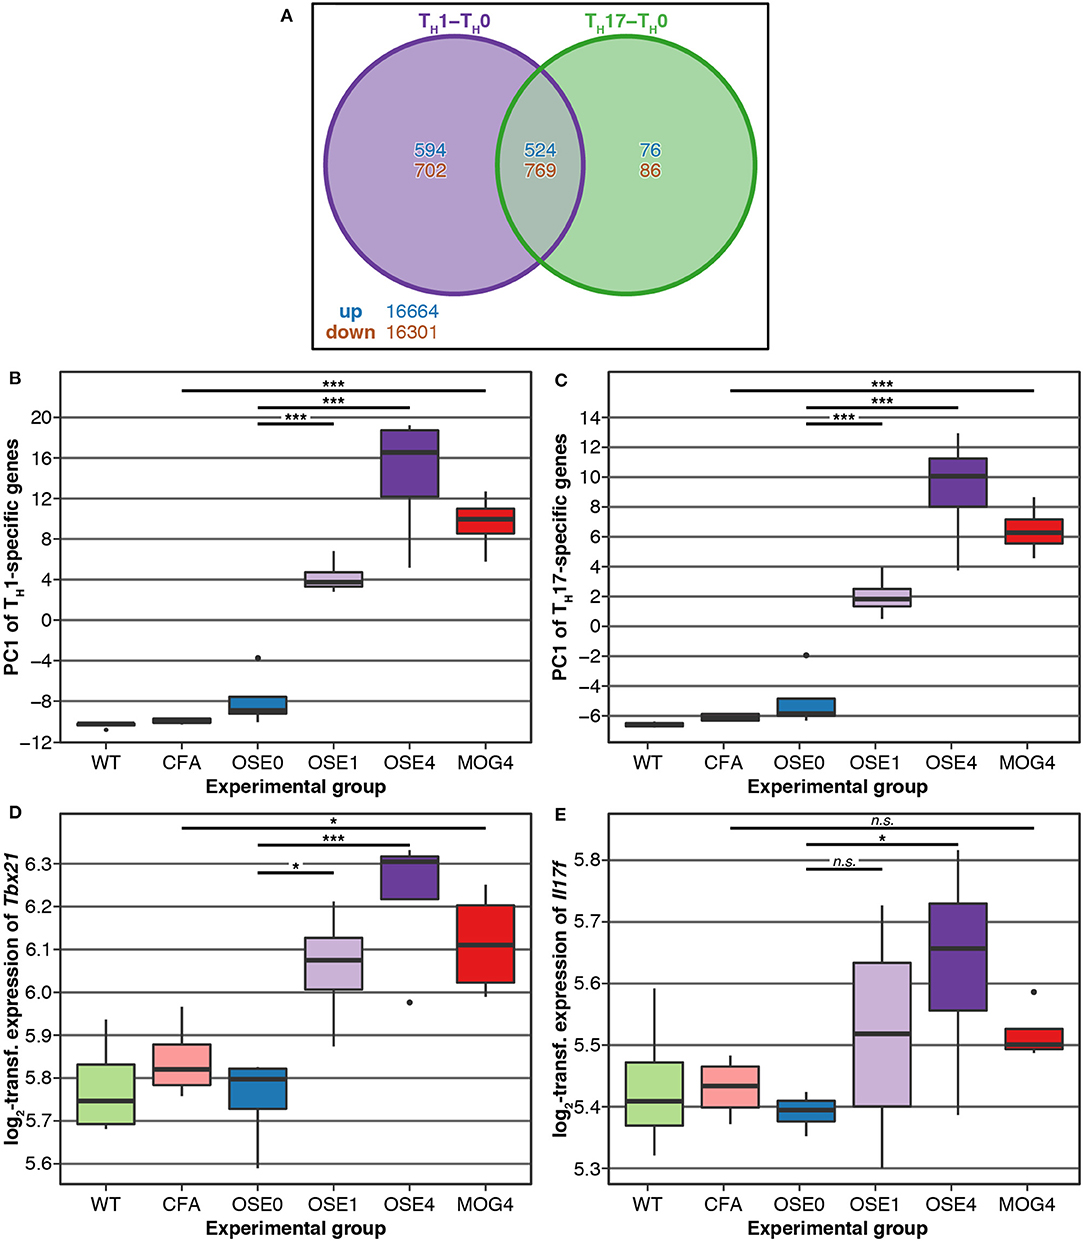
Figure 3. Genes differentially expressed in TH cells show a higher expression in diseased EAE animals, especially in OSE4. (A) Venn diagram highlighting the number of transcripts differentially expressed in TH cells. For this plot, up- and downregulated transcripts were analyzed separately, and transcripts differentially expressed in opposing directions are therefore included in the counts. (B,C) Principal component analysis (PCA) of gene expression profiles of transcripts differentially expressed in (B) TH1 and (C) TH17 cells. Diseased mice showed higher TH cell-specific expression levels (Supplementary Table 7). PC, principal component; y-axis unit: standard deviations. (D,E) Examples of expression levels of the TH1 signature molecule (D) Tbx21 and the TH17 signature molecule (E) Il17f . Diseased mice showed significantly higher expression levels of Tbx21, yet only OSE4 mice showed an increased expression of Il17f . Furthermore, the TH1 signature molecule Ifng was expressed significantly higher only in OSE4; the TH17 signature molecules Rorc and Il17a were not differentially expressed in any contrast (Supplementary Table 8). Significance levels: n.s.: p ≥ 0.05, * adjusted p < 0.05, *** adjusted p < 0.001.
We examined via PCA whether the expression of TH1- and TH17-specific, differentially expressed probes was higher in EAE models than controls. The first component of TH1-and TH17-specific gene expression explained 49.6 and 68.6% of the variance, respectively. For both TH cell types, the first component of cell-specific transcripts was significantly higher in all disease groups than in controls, with the highest levels for OSE4 (Figures 3B,C, Supplementary Table 7). Among signature molecules for TH1 cells, Tbx21 (T-bet) was significantly upregulated in all diseased mice, Ifng only in OSE4 (Figure 3D, Supplementary Table 8). Of the examined TH17 markers, only Il17f was upregulated in OSE4, neither Rorc nor Il17a were differentially expressed (Figure 3E, Supplementary Table 8).
After correction for multiple testing, the CDT, OSE4sp, and OSE1ex analysis sets were significantly enriched for TH1- and TH17-specific transcripts (Table 2). In the case of MOG4sp transcripts, the overlap was lower and only significant for TH1-specific probes. These experiments indicate a stronger overlap of known MS-associated immune responses involving TH cells with OSE than with MOG EAE.
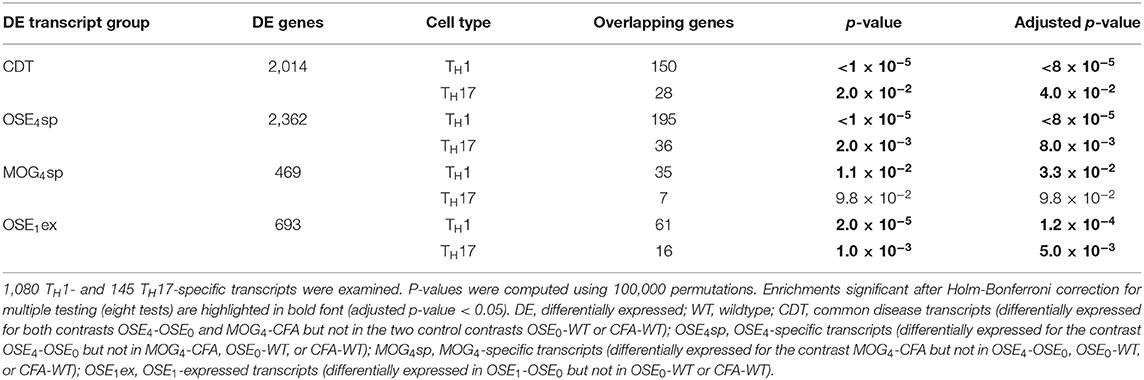
Table 2. Enrichment of TH-specific transcripts.
Finally, we analyzed whether EAE-associated genes differentially expressed in TH1 or TH17 cells were more closely connected to human MS. To this end, we intersected the lists of EAE-specific and TH-specific transcripts. Immune-related biological processes were overrepresented for CDT, OSE4sp, and OSE1ex genes intersected with TH1-specific genes. (Supplementary Table 9, Supplementary Figure 6). No terms were significantly overrepresented for any TH17-specific or MOG4sp genes.
CDT and OSE1ex genes differentially expressed in TH1 cells were significantly enriched for the IMSGC MS risk genes (p < 7 × 10⁻⁴, Table 3). The enrichment for OSE4sp did not withstand correction for multiple testing. Neither any of the TH17-specific gene sets nor the genes from the MOG4sp group were enriched for these risk genes. Thus, we conclude that OSE entails gene expression changes involving human MS gene risk genes, especially in TH1 cells, which were not observed to the same degree for MOG EAE.
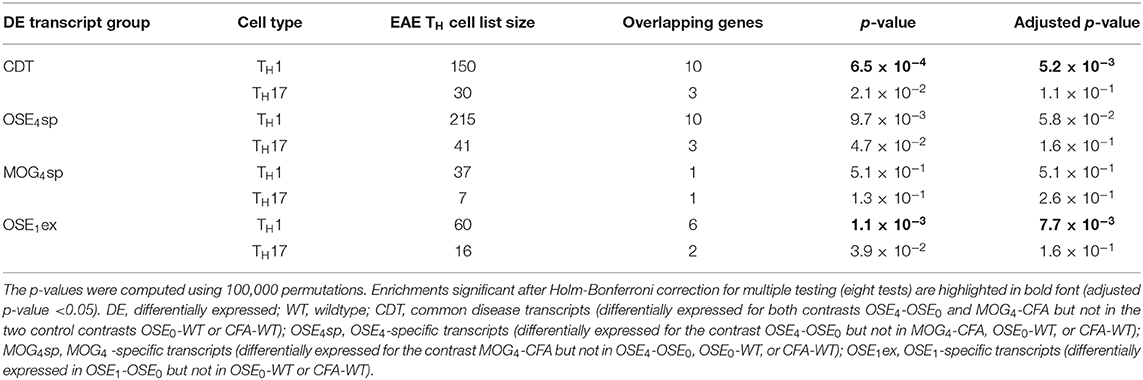
Table 3. Enrichment of MS susceptibility genes among TH-specific transcripts.
Discussion
With the identification of over 230 MS risk loci in recent GWAS, we move closer to understanding the etiology of MS. Further research relies on adequate animal models that have to be reassessed in the context of GWAS data. Given the interplay of genetics and environment in human MS, spontaneous EAE models like OSE might be more apt for studying the genetic risk component of MS than induced EAE models that require active experimental manipulation. In the present study, we performed spinal cord gene expression profiling to, first, characterize differences between spontaneous OSE and MOG-induced EAE and, second, to analyze the relationship of both models to human MS risk genes and TH cell biology.
OSE May Reflect the Etiology of MS Better Than MOG EAE Does
In comparison to MOG EAE, gene expression changes in OSE were stronger and more closely linked to immune pathways. This might reflect a more complex mode of disease induction in OSE than is the case for MOG EAE. OSE features active B and T cell cooperation, a mechanism highly relevant for the pathophysiology of human MS, as demonstrated by the effectivity of B cell-depleting treatments (10, 11). More than MOG EAE, OSE-specific transcripts were enriched for both human MS risk genes and TH cell-specific transcripts and showed an overrepresentation of immune-specific gene sets. We thus hypothesize that OSE shows advantages over MOG EAE in studying the functional role of human MS risk genes and their associated immune pathways.
Nevertheless, many of the differentially expressed genes indicate that both EAE models faithfully recapitulate critical functional pathways of MS, especially regarding the role of antigen presentation and CD4+ T cells in MS immunopathogenesis (25, 26). Transcripts for the HLA genes H2-Eb1 and H2-Ab1, homologous to HLA-DRB5 and HLA-DQB1, were among the most differentially expressed probes. The alleles HLA-DRB5*01:01 and HLA-DQB1*06:02 are part of the DR15-DQ6 haplotype and are, most likely because of linkage disequilibrium with HLA-DRB1*15:01, strongly associated with MS risk (27). In MS, memory B cells mediate autoproliferation of brain-homing TH1 cells in a HLA-DRB1*15:01-dependent manner (28). Interestingly, the antigen-presenting function of MOG-specific B cells is, in cooperation with T cells, important for the development of OSE (10). Among putative non-MHC MS risk genes (1, 2), Cd86, Cd52, and Cd74 showed very robust support for differential expression.
We could thus show that EAE, and in particular OSE, constitutes a valuable model for studying the role of human MS risk genes. Several previous studies support this finding: First, humanized EAE models successfully replicated HLA-related risk variants, including HLA-DRB*15:01 (29). Second, knockout mice lacking the MS-associated Il7r are resistant to EAE (30). Third, shared human and EAE risk loci exist that are linked to TH cell differentiation (31). Fourth, an overlap of upregulated genes between myelin-reactive T cells from MS patients and encephalitogenic CD4+ T cells isolated from EAE was described (32). Fifth, in a passive-transfer EAE study, several MS risk genes were suggested to be implicated in the transition from in vitro-generated MOG-specific TH17 cells to encephalitogenic CD4+ T cells (33).
Functional pathways involving MS risk genes interact with environmental factors to trigger an autoimmune response, as demonstrated by the role of epigenetic factors for MS risk (1, 34). Spontaneous EAE models might resemble gene-environment interactions more faithfully than MOG EAE does. For instance, in a spontaneous EAE model, disease onset could be prevented in mice kept under germ-free conditions (7). In this model, a higher incidence of EAE was observed following the transfer of the human gut microbiome from MS patients than when transferring the microbiome from the patient's healthy twin (8).
TH1-Specific Transcripts Are Enriched for MS Risk Genes
Our gene set analyses point at a central role of lymphocyte activation in EAE induction and shed light on the ongoing controversy regarding the relative importance of TH1 and TH17 cells in mediating CNS autoimmunity (35). In accordance with previous studies (9), we observed a higher differential expression of selected TH1- than of TH17-specific transcripts in diseased mice. Interestingly, a high TH1/TH17 ratio is indicative of a lesion distribution pattern characterized by prominent spinal cord involvement, as is the case for both EAE models investigated in our study (12, 15, 36).
CDT and OSE1ex transcripts differentially expressed in TH1 cells were significantly enriched for MS risk genes (Table 3). We did not observe such an enrichment for transcripts differentially expressed in TH17 cells. Albeit also OSE4sp genes were only enriched for risk genes in TH1 cells at nominal significance (unadjusted p = 0.0097), TH1-expressed MOG4sp transcripts showed no trend for the enrichment of MS risk genes at all (unadjusted p = 0.51). In GO overrepresentation analyses, immune-related biological processes like positive regulation of T cell proliferation were significant for OSE4sp-genes differentially expressed in TH1 cells, but no GO gene sets at all were overrepresented in TH1-specific MOG4sp genes. In the context of TH1-driven immune responses, the OSE model might thus be linked more closely to human MS risk genes than MOG35−55 EAE is. However, TH17 cells can shift toward a TH1 phenotype in EAE (37, 38). The TH1 markers analyzed in the EAE models may, accordingly, reflect expression in a significant proportion of former TH17 cells. Therefore, our findings do not argue against a relevant impact of TH17 cells in either EAE model.
Expression Patterns Across Different Disease Stages Can Be Studied Using OSE
Most genes differentially expressed in OSE1 mice were also recapitulated in severely affected OSE4 mice and showed the same direction of regulation in both disease stages. Many factors active in severe EAE thus also influence EAE during a mild or, potentially, early disease course. Effective immunotherapy is facilitated if the same biological pathways are continuously active throughout the entire disease. For example, the gene set response to interferon-beta was highly overrepresented in both OSE1ex and CDT and Cd52 was differentially expressed in all diseased mice. Studying mild OSE cases might, therefore, constitute an interesting model for defining the initial triggers of MS and the identification of novel therapeutic options.
Limitations
Our gene expression analysis of two EAE models had several limitations: First, the microarrays used covered only part of the murine transcriptome and thus, some MS risk genes could not be analyzed. Second, the statistical power of our analyses was restricted by the sample size. Third, the initial phases of EAE are hard to define since the disease develops over a short period. We thus analyzed mild OSE cases as a proxy for early disease. It is, however, unknown whether these animals would have developed more severe EAE later.
Conclusions
Although hundreds of genetic MS risk loci have been identified, their functional role in the etiology of the disease still has to be resolved. Ideally, suitable animal models recapitulate molecular and functional pathways involving these genes. They may thus move research closer to the primary cause and etiology of MS, thereby supporting the identification of effective immunotherapies. No animal model fully reflects a heterogeneous human disease like MS and each EAE model available today only replicates a part of the human disease. Researchers will thus continue to study different aspects of MS using a variety of EAE models. Our results indicate that OSE, with its closer link to MS risk genes and TH cell biology, may be better suited for studying the etiology of MS and for defining specific therapeutic targets than MOG-induced EAE is. Future studies will show whether OSE can fulfill this promise to model the human MS genetic risk landscape faithfully.
Data Availability Statement
The datasets presented in this study can be found in online repositories. The names of the repository and accession number(s) can be found at: https://www.ebi.ac.uk/arrayexpress/, E-MTAB-9132; https://www.ebi.ac.uk/arrayexpress/, E-MTAB-9133.
Ethics Statement
The animal study was reviewed and approved by Tierschutzkommission der Regierung von Oberbayern, Munich, Germany.
Author Contributions
HF, GK, PW, and FW contributed to the original conception and design of the study. HF, GK, and PW conducted experiments. DK and TA devised the statistical analyses. DK, BP, and TA conducted statistical analyses. BM-M and FW supervised the study. HF and TA drafted the manuscript. All authors contributed to manuscript revision, read, and approved the submitted version.
Funding
TA was supported by the German Federal Ministry of Education and Research (BMBF) through the DIFUTURE consortium of the Medical Informatics Initiative Germany (grant 01ZZ1804A) and by the European Union's Horizon 2020 Research and Innovation Programme (grant MultipleMS, EU RIA 733161). TA and BM-M were supported by the BMBF through the Integrated Network IntegraMent, under the auspices of the e:Med Programme (grant 01ZX1614J). GK was supported by the European Research Council starting grant (GAMES; 635617), German research foundation (DFG) SFB TR-128 (Project A1), and by the Max Planck Society.
Conflict of Interest
The authors declare that the research was conducted in the absence of any commercial or financial relationships that could be construed as a potential conflict of interest.
Supplementary Material
The Supplementary Material for this article can be found online at: https://www.frontiersin.org/articles/10.3389/fimmu.2020.02165/full#supplementary-material
Supplementary Figure 1. Disease course of MOG EAE in C57BL/6 mice. MOG EAE was induced in C57BL/6 mice as described in the Methods. The plot shows mean clinical scores (n = 4) and the standard error of the mean. The disease score of MOG EAE mice began to increase on day ten. The mice were sacrificed when they reached a score of 4. Control mice (CFA) consistently remained at a disease score of 0.
Supplementary Figure 2. Efficiency of TH1 and TH17 differentiation. (A) T cells from OSE mice were activated under TH1- and TH17-polarizing conditions and analyzed for intracellular IL-17 and IFN-γ cytokine expression by flow cytometry. The data represent the percentage of cytokine-producing cells in the gated CD4+ populations of naïve (TH0), TH1, and TH17 cells. (B) Quantification of IL-17 and IFN-γ in the culture supernatants of TH1 and TH17 cells by ELISA. The plots show the mean and the standard error of the mean (SEM). (C) IL-17 and IFN-γ mRNA expression of naïve (TH0), TH1-, and TH17-polarized cells quantified by real-time PCR. The data are representative of three independent experiments. The plots show the mean and SEM.
Supplementary Figure 3. Overrepresented immune system pathways in OSE and MOG EAE contrasts. The plots show overrepresented GO terms that are descendants of the term Immune System Process (Supplementary Table 4) for the contrasts (A) OSE1-OSE0, (B) OSE4-OSE0, (C) MOG4-CFA, and (D) MOG4-OSE4. The -log10(FDR) from hypergeometric tests is shown on the x-axis and used for coloring the plots (darker colors represent lower FDRs).
Supplementary Figure 4. The top 40 overrepresented immune system pathways in the differentially expressed transcripts groups. The plots show the top 40 overrepresented GO terms that are descendants of the term Immune System Process (Supplementary Table 4) for the transcript groups (A) CDT, common disease transcripts (differentially expressed for both contrasts OSE4-OSE0 and MOG4-CFA but not in the two control contrasts OSE0-WT or CFA-WT), (B) OSE4sp, OSE4-specific transcripts (differentially expressed for the contrast OSE4-OSE0 but not in MOG4-CFA, OSE0-WT, or CFA-WT), (C) OSE1ex, OSE1-expressed transcripts (differentially expressed in OSE1-OSE0 but not in OSE0-WT or CFA-WT). Note that no GO terms that are descendants of the term Immune System Process were significantly overrepresented for the group MOG4sp, MOG4-specific transcripts (differentially expressed for the contrast MOG4-CFA but not in OSE4-OSE0, OSE0-WT, or CFA-WT). The -log10(FDR) from hypergeometric tests is shown on the x-axis and used for coloring the plots (darker colors represent lower FDRs).
Supplementary Figure 5. Expression levels of Cd74 and Icam1. Diseased mice showed an increased expression of (A) Cd74 and (B) Icam1 (Supplementary Table 2). Significance levels: * adjusted p < 0.05, ** adjusted p < 0.01, *** adjusted p < 0.001.
Supplementary Figure 6. The top 40 overrepresented immune system pathways in the differentially expressed transcripts groups intersected with TH1-specific genes. The plots show the top 40 overrepresented GO terms that are descendants of the term Immune System Process (Supplementary Table 9) for the transcript groups (A) CDT (common disease transcripts) intersected with TH1-specific genes, (B) OSE4sp (OSE4-specific transcripts) intersected with TH1-specific genes, (C) OSE1ex (OSE1-expressed transcripts) intersected with TH1-specific genes. Note that no GO terms were significantly overrepresented for any TH17-specific or MOG4sp genes. The -log10(FDR) from hypergeometric tests is shown on the x-axis and used for coloring the plots (darker colors represent lower FDRs).
Supplementary Table 1. Results from k-means clustering (Figure 1A).
Supplementary Table 2. Differential expression results for all analyzed contrasts. FC, fold change; CI, 95% confidence interval.
Supplementary Table 3. Comparison of fold changes in expression levels between contrasts (Figures 1C,D). CI, 95% confidence interval.
Supplementary Table 4. Results from WebGestalt gene ontology (GO) over-representation analyses (ORA) for the analysis groups CDT, OSE4sp, MOG4sp, and OSE1ex (see the legend of Table 1 and Supplementary Figure 5) as well as the contrasts OSE1-OSE0, OSE4-OSE0, MOG4-CFA, and MOG4-OSE4 (Supplementary Figure 4). FDR, 5% false discovery rate. Gene sets that are labeled in bold if they are descendants of the GO term “Immune System Process”.
Supplementary Table 5. Differential expression results for the analysis groups (see the legend of Table 1) CDT, CDT, OSE4sp, MOG4sp, OSE1ex, and OSE1sp. OSE1sp transcripts were differentially expressed in OSE1-OSE0 but not in any other contrast. FC, fold change, CI, 95% confidence interval. For CDT transcripts, separate coefficients are provided for the two contrasts MOG4-CFA and OSE4-OSE0.
Supplementary Table 6. Results from the principal component analysis (PCA) of gene expression profiles of putative MS risk genes (Figure 2A). FC, fold change, CI, 95% confidence interval. P-values were adjusted for multiple testing using Holm-Bonferroni correction.
Supplementary Table 7. Results from the principal component analysis (PCA) of gene expression profiles of TH cell-specific transcripts (Figures 3B,C). FC, fold change; CI, 95% confidence interval. P-values were adjusted for multiple testing using Holm-Bonferroni correction.
Supplementary Table 8. Differential expression results for selected TH1 and TH17 signature molecules (Figures 3D,E). DE, differentially expressed.
Supplementary Table 9. Results from Webgestalt gene ontology (GO) over-representation analyses (ORA) for the analysis groups CDT, OSE4sp, and OSE1ex (see the legend of Table 1) among TH1-specific transcripts (Supplementary Figure 6). For MOG4sp or TH17-specific transcripts, no significant gene sets were found. FDR, 5% false discovery rate. Gene sets that are labeled in bold if they are descendants of the GO term “Immune System Process”.
References
1. Andlauer TF, Buck D, Antony G, Bayas A, Bechmann L, Berthele A, et al. Novel multiple sclerosis susceptibility loci implicated in epigenetic regulation. Sci Adv. (2016) 2:e1501678. doi: 10.1126/sciadv.1501678
2. International Multiple Sclerosis Genetics Consortium. Multiple sclerosis genomic map implicates peripheral immune cells and microglia in susceptibility. Science. (2019) 365:eaav7188. doi: 10.1126/science.aav7188
3. Hurst WE. The effects of the injection of normal brain emulsion into rabbits, with special reference to the aetiology of the paralytic accidents of antirabic treatment. J Hyg. (1932) 32:33–44. doi: 10.1017/S0022172400017800
4. Glatigny S, Bettelli E. Experimental autoimmune encephalomyelitis (EAE) as animal models of multiple sclerosis (MS). Csh Perspect Med. (2018) 8:a028977. doi: 10.1101/cshperspect.a028977
5. Mendel I, Rosbo NK, de Ben-Nun A. A myelin oligodendrocyte glycoprotein peptide induces typical chronic experimental autoimmune encephalomyelitis in H-2b mice: fine specificity and T cell receptor Vβ expression of encephalitogenic T cells. Eur J Immunol. (1995) 25:1951–9. doi: 10.1002/eji.1830250723
6. Ben-Nun A, Wekerle H, Cohen IR. The rapid isolation of clonable antigen-specific T lymphocyte lines capable of mediating autoimmune encephalomyelitis. Eur J Immunol. (1981) 11:195–9. doi: 10.1002/eji.1830110307
7. Berer K, Mues M, Koutrolos M, Rasbi Z, Boziki M, Johner C, et al. Commensal microbiota and myelin autoantigen cooperate to trigger autoimmune demyelination. Nature. (2011) 479:538. doi: 10.1038/nature10554
8. Berer K, Gerdes L, Cekanaviciute E, Jia X, Xiao L, Xia Z, et al. Gut microbiota from multiple sclerosis patients enables spontaneous autoimmune encephalomyelitis in mice. Proc Natl Acad Sci USA. (2017) 114:10719–24. doi: 10.1073/pnas.1711233114
9. Krishnamoorthy G, Lassmann H, Wekerle H, Holz A. Spontaneous opticospinal encephalomyelitis in a double-transgenic mouse model of autoimmune T cell/B cell cooperation. J Clin Investig. (2006) 116:2385–92. doi: 10.1172/JCI28330
10. Molnarfi N, Schulze-Topphoff U, Weber MS, Patarroyo JC, Prod'homme T, Varrin-Doyer M, et al. MHC class II–dependent B cell APC function is required for induction of CNS autoimmunity independent of myelin-specific antibodies. J Exp Med. (2013) 210:2921–37. doi: 10.1084/jem.20130699
11. Lehmann-Horn K, Kronsbein HC, Weber MS. Targeting B cells in the treatment of multiple sclerosis: recent advances and remaining challenges. Ther Adv Neurol Diso. (2013) 6:161–73. doi: 10.1177/1756285612474333
12. Jäger A, Dardalhon V, Sobel RA, Bettelli E, Kuchroo VK. Th1, Th17, and Th9 effector cells induce experimental autoimmune encephalomyelitis with different pathological phenotypes. J Immunol. (2009) 183:7169–77. doi: 10.4049/jimmunol.0901906
13. The International Multiple Sclerosis Genetics Consortium The Wellcome Trust Case Control Consortium 2 Sawcer S Hellenthal G Pirinen M Spencer CC. Genetic risk and a primary role for cell-mediated immune mechanisms in multiple sclerosis. Nature. (2011) 476:214–9. doi: 10.1038/nature10251
14. Ben-Nun A, Kaushansky N, Kawakami N, Krishnamoorthy G, Berer K, Liblau R, et al. From classic to spontaneous and humanized models of multiple sclerosis: impact on understanding pathogenesis and drug development. J Autoimmun. (2014) 54:33–50. doi: 10.1016/j.jaut.2014.06.004
15. Domingues HS, Mues M, Lassmann H, Wekerle H, Krishnamoorthy G. Functional and pathogenic differences of Th1 and Th17 cells in experimental autoimmune encephalomyelitis. PLoS ONE. (2010) 5:e15531. doi: 10.1371/journal.pone.0015531
16. Miller SD, Karpus WJ, Davidson TS. Experimental autoimmune encephalomyelitis in the mouse. Curr Protoc Immunol. (2010) 88:15.1.1–20. doi: 10.1002/0471142735.im1501s88
17. R Core Team R: A Language and Environment for Statistical Computing. Vienna: R Foundation for Statistical Computing. (2020). Available online at: https://www.R-project.org/ (accessed August 1, 2020).
18. Dunning MJ, Smith ML, Ritchie ME, Tavaré S. beadarray: R classes and methods for Illumina bead-based data. Bioinformatics. (2007) 23:2183–4. doi: 10.1093/bioinformatics/btm311
19. Du P, Kibbe WA, Lin SM. lumi: a pipeline for processing Illumina microarray. Bioinformatics. (2008) 24:1547–48. doi: 10.1093/bioinformatics/btn224
20. Huber W, von Heydebreck A, Sültmann H, Poustka A, Vingron M. Variance stabilization applied to microarray data calibration and to the quantification of differential expression. Bioinformatics. (2002) 18:S96–104. doi: 10.1093/bioinformatics/18.suppl_1.S96
21. Ritchie ME, Phipson B, Wu D, Hu Y, Law CW, Shi W, et al. limma powers differential expression analyses for RNA-sequencing and microarray studies. Nucleic Acids Res. (2015) 43:e47. doi: 10.1093/nar/gkv007
22. Liao Y, Wang J, Jaehnig EJ, Shi Z, Zhang B. WebGestalt 2019: gene set analysis toolkit with revamped UIs and APIs. Nucleic Acids Res. (2019) 47:W199–205. doi: 10.1093/nar/gkz401
23. Benjamini Y, Hochberg Y. Controlling the false discovery rate: a practical and powerful approach to multiple testing. J Royal Stat Soc Ser B Methodol. (1995) 57:289–300. doi: 10.1111/j.2517-6161.1995.tb02031.x
24. Krishnamoorthy G, Holz A, Wekerle H. Experimental models of spontaneous autoimmune disease in the central nervous system. J Mol Med. (2007) 85:1161–73. doi: 10.1007/s00109-007-0218-x
25. Patsopoulos NA, Barcellos LF, Hintzen RQ, Schaefer C, van Duijn CM, Noble JA, et al. Fine-mapping the genetic association of the major histocompatibility complex in multiple sclerosis: HLA and non-HLA effects. PLoS Genet. (2013) 9:e1003926. doi: 10.1371/journal.pgen.1003926
26. Moutsianas L, Jostins L, Beecham AH, Dilthey AT, Xifara DK, Ban M, et al. Class II HLA interactions modulate genetic risk for multiple sclerosis. Nat Genet. (2015) 47:1107–13. doi: 10.1038/ng.3395
27. Hollenbach JA, Oksenberg JR. The immunogenetics of multiple sclerosis: a comprehensive review. J Autoimmun. (2015) 64:13–25. doi: 10.1016/j.jaut.2015.06.010
28. Jelcic I, Nimer FA, Wang J, Lentsch V, Planas R, Jelcic I, et al. Memory B cells activate brain-homing, autoreactive CD4+ T cells in multiple sclerosis. Cell. (2018) 175:85–100.e23. doi: 10.1016/j.cell.2018.08.011
29. Gregersen JW, Kranc KR, Ke X, Svendsen P, Madsen LS, Thomsen AR, et al. Functional epistasis on a common MHC haplotype associated with multiple sclerosis. Nature. (2006) 443:574–7. doi: 10.1038/nature05133
30. Ashbaugh JJ, Brambilla R, Karmally SA, Cabello C, Malek TR, Bethea JR. IL7Rα contributes to experimental autoimmune encephalomyelitis through altered T cell responses and nonhematopoietic cell lineages. J Immunol. (2013) 190:4525–34. doi: 10.4049/jimmunol.1203214
31. Blankenhorn EP, Butterfield R, Case LK, Wall EH, Rio R, del Diehl SA, et al. Genetics of experimental allergic encephalomyelitis supports the role of T helper cells in multiple sclerosis pathogenesis. Ann Neurol. (2011) 70:887–96. doi: 10.1002/ana.22642
32. Cao Y, Goods BA, Raddassi K, Nepom GT, Kwok WW, Love JC, et al. Functional inflammatory profiles distinguish myelin-reactive T cells from patients with multiple sclerosis. Sci Transl Med. (2015) 7:287ra74. doi: 10.1126/scitranslmed.aaa8038
33. Hoppmann N, Graetz C, Paterka M, Poisa-Beiro L, Larochelle C, Hasan M, et al. New candidates for CD4 T cell pathogenicity in experimental neuroinflammation and multiple sclerosis. Brain. (2015) 138:902–17. doi: 10.1093/brain/awu408
34. Kular L, Liu Y, Ruhrmann S, Zheleznyakova G, Marabita F, Gomez-Cabrero D, et al. DNA methylation as a mediator of HLA-DRB1*15:01 and a protective variant in multiple sclerosis. Nat Commun. (2018) 9:2397. doi: 10.1038/s41467-018-04732-5
35. Hiltensperger M, Korn T. The interleukin (IL)-23/T helper (Th)17 axis in experimental autoimmune encephalomyelitis and multiple sclerosis. Csh Perspect Med. (2017) 8:a029637. doi: 10.1101/cshperspect.a029637
36. Stromnes IM, Cerretti LM, Liggitt D, Harris RA, Goverman JM. Differential regulation of central nervous system autoimmunity by TH1 and TH17 cells. Nat Med. (2008) 14:337–42. doi: 10.1038/nm1715
37. Hirota K, Duarte JH, Veldhoen M, Hornsby E, Li Y, Cua DJ, et al. Fate mapping of IL-17-producing T cells in inflammatory responses. Nat Immunol. (2011) 12:255–63. doi: 10.1038/ni.1993
Keywords: experimental autoimmune encephalomyelitis (EAE), myelin oligodendrocyte glycoprotein (MOG), T helper cell (Th), multiple sclerosis, risk genes, gene expression
Citation: Faber H, Kurtoic D, Krishnamoorthy G, Weber P, Pütz B, Müller-Myhsok B, Weber F and Andlauer TFM (2020) Gene Expression in Spontaneous Experimental Autoimmune Encephalomyelitis Is Linked to Human Multiple Sclerosis Risk Genes. Front. Immunol. 11:2165. doi: 10.3389/fimmu.2020.02165
Received: 21 May 2020; Accepted: 10 August 2020;
Published: 18 September 2020.
Edited by:
Marcello Moccia, University of Naples Federico II, ItalyReviewed by:
Georgina Xanthou, Biomedical Research Foundation of the Academy of Athens (BRFAA), GreeceRichard Milner, San Diego Biomedical Research Institute, United States
Copyright © 2020 Faber, Kurtoic, Krishnamoorthy, Weber, Pütz, Müller-Myhsok, Weber and Andlauer. This is an open-access article distributed under the terms of the Creative Commons Attribution License (CC BY). The use, distribution or reproduction in other forums is permitted, provided the original author(s) and the copyright owner(s) are credited and that the original publication in this journal is cited, in accordance with accepted academic practice. No use, distribution or reproduction is permitted which does not comply with these terms.
*Correspondence: Bertram Müller-Myhsok, bmm@psych.mpg.de; Till F. M. Andlauer, till.andlauer@tum.de
‡These authors have contributed equally to this work
†Present address: Hans Faber, Schön Klinik Bad Aibling Harthausen, Bad Aibling, Germany
Frank Weber, Neurologische Klinik, Sana Kliniken des Landkreises Cham GmbH, Cham, Germany