 Blanca Grases-Pintó1,2
 Mar Abril-Gil1,2
 Margarida Castell1,2
 Maria J. Rodríguez-Lagunas1,2
 Stephen Burleigh3,4*
 Frida Fåk Hållenius3,4
 Olena Prykhodko3,4
 Francisco J. Pérez-Cano1,2*
 Àngels Franch1,2
- 1Physiology Section, Department of Biochemistry and Physiology, Faculty of Pharmacy and Food Science, University of Barcelona, Barcelona, Spain
- 2Research Institute of Nutrition and Food Safety of the University of Barcelona (INSA-UB), Santa Coloma de Gramenet, Spain
- 3Food for Health Science Centre, Lund University, Lund, Sweden
- 4Department of Food Technology, Engineering and Nutrition, Lund University, Lund, Sweden
Dietary components in early life play a role in both microbiota and intestinal immune system maturation in mammalian species. Adipokines, as endogenously produced hormones from breast milk, may have an impact on this process. The aim of the present study was to establish the influence of leptin and adiponectin supplementation during suckling on the intraepithelial lymphocyte composition, intestinal barrier function, intestinal gene expression, and gut microbiota in rat. For this purpose, newborn Wistar rats were supplemented daily with leptin, adiponectin, or whey protein concentrate during the first 21 days of life. Lymphocyte composition was established by immunofluorescence staining and flow cytometry analysis; intestinal gene expression by real-time PCR and cecal microbiota were analyzed through 16S rRNA gene sequencing. Although leptin and adiponectin were able to increase the Tc TCRαβ+ and NKT cell proportion, they decreased the NK cell percentage in IEL. Moreover, adipokine supplementation differentially modified CD8+ IEL. While the supplementation of leptin increased the proportion of CD8αα+ IEL (associated to a more intestinal phenotype), adiponectin enhanced that of CD8αβ+ (related to a peripheral phenotype). Furthermore, both adipokines enhanced the gene expression of TNF-α, MUC-2, and MUC-3, and decreased that of FcRn. In addition, the adipokine supplementations decreased the abundance of the Proteobacteria phylum and the presence of Blautia. Moreover, leptin-supplemented animals had lower relative abundance of Sutterella and a higher proportion of Clostridium genus, among others. However, supplementation with adiponectin resulted in lower abundance of the Roseburia genus and a higher proportion of the Enterococcus genus. In conclusion, the supplementation with leptin and adiponectin throughout the suckling period had an impact on both the IEL composition and the gut microbiota pattern, suggesting a modulatory role of these adipokines on the development of intestinal functionality.
Introduction
The intestinal microbiota develops in early life and although the microbiota colonizes the intestine mainly after birth, over the years the opinion about when the colonization starts has been changing (1). In the past, it was considered that the in utero environment was sterile and it was not until delivery that colonization began, when the newborn passed through the vagina or skin (Cesarean section) and adopted maternal microbiota (2). However, latest studies have shown that bacteria may already start their colonization during pregnancy, since microbiota have been found to present in the placenta or amniotic fluid, and have even been isolated in the meconium (2–4). It is also suggested that the placenta has its own microbiota (5). Despite all the factors affecting the gut microbiome in utero, the main factor shaping the gut ecosystem after birth is diet, when bacteria are transferred to the infant through breast milk and later with the introduction of solid food (1). The process of gut colonization in newborns sets the stage for adults' microbiome and its dysregulation in early life could affect health thereafter (6).
Intestinal microbiota composition during the first year of life differs from that present in adults, it is less stable, more variable in its composition and has low diversity (7, 8). At birth, the newborn's gut has an aerobic environment, where mainly facultative anaerobes such as Enterobacteriaceae or Staphylococcus can colonize (9, 10). Some days after, the growth of Bifidobacterium, Clostridium, and Bacteroidetes, strict anaerobe bacteria, appear due to the conversion of the intestine to an anaerobic environment (11). Until weaning, the microbiota depends on the diet of the infant, thus breastfed infants have Bifidobacteria as dominant genus, whereas formula-fed newborns show an increase in the Enterobacteria (2). When solid food is introduced, the microbiota suffers another important change and it turns toward adult-like microbiota, presenting an increase in the abundance of Bacteroides, Clostridium, Ruminococcus, and Prevotella (9, 10). Moreover, there are other different factors that influence the intestinal microbiota of the newborn, such as the gestational age, the birth weight, gender of the baby, mode of delivery, location of birth (home or hospital), geographic location, hospitalization of the newborn, maternal and/or infant use of antibiotics, probiotics or prebiotics; finally, the size of the family or the presence of pets at home could modulate it (12).
Microbiota plays an important role in the maturation of the immune system, mainly with those lymphocytes present in the gut-associated lymphoid tissue (GALT) (9). At birth, GALT is not fully mature and it is still developing during suckling (13). In the epithelium of the intestinal mucosa are located the intraepithelial lymphocytes (IEL), which are the first immune cells in contact with intestinal antigens, protecting the gut from infections (14). The importance of the crosstalk between the colonizing bacteria and the underlying lymphoid cells is well-known (15). If there is not a good development of the GALT or a good intestinal colonization by the microbiota, this communication is lost and makes the baby more susceptible to infections (15, 16).
Human milk provides a high number of bioactive factors that promote the formation of innate and adaptive immune factors, such as lactoferrin, cytokines, growth factors, adipokines, secretory immunoglobulin A (sIgA), among others. These components protect the infant against infections and promote their immune system maturation (17). Moreover, breast milk also contains bacteria from the mother's gut and some compounds, such as prebiotic oligosaccharides, which also participate in the microbiota's development (18). In previous studies, we have described the role of leptin and adiponectin, adipokines present in breast milk, in the maturation of the early life immune system, particularly in systemic immune response (19) and also in the inductive GALT (20). In line with this, we hypothesized that these adipokines could also influence the effector GALT, the gut microbiota and also their interaction, promoting the development in this first stage of life. Thus, the purpose of this paper is to study the influence of leptin and adiponectin supplementation on the IEL composition, intestinal gene expression and microbiota pattern in suckling rats.
Materials and Methods
Animals
Pregnant Wistar rats (G15) were obtained from Janvier Labs (Le Genest Saint Isle, France). Dams were housed in individual cages and fed with commercial diet corresponding to the American Institute of Nutrition 93M formulation (Harlan Teklad, Madison, Wisconsin, USA) and water ad libitum. The animals were maintained under controlled temperature and humidity conditions in a 12:12 h light:dark cycle in the animal facilities of the Faculty of Pharmacy and Food Science. The gestating rats were monitored daily and allowed to deliver at term. Proportion of males and females were between 40 and 60% in each litter. The day after birth was registered as day 1 of life. Litters were unified to 9 pups per lactating dam and had free access to the breast milk and rat diet. Daily, pups were separated from their mother, to be identified, weighted, and orally administered. To avoid the influence of biological rhythms, handling was done in the same time range.
With regard to sample size estimation, because of the variability among litters, four litters were required for each group. This calculation was made by the Appraising Project Office's program from the Universidad Miguel Hernández de Elche (Alicante), used to provide statistically significant differences among groups, assuming that there is no dropout rate and considering a type I error of 0.05 (two-sided). The studies were performed in accordance with the criteria outlined by the Guide for the Care and Use of Laboratory Animals. Experimental procedures were reviewed and approved by the Ethical Committee for Animal Experimentation of the University of Barcelona and the Ethical Committee of the Generalitat de Catalunya (CEEA/UB 220/15 and DAAM: 8521).
Dietary Supplementation
Suckling rats were randomly distributed into four groups, according to the oral supplementation received: the Reference, the Leptin, the Adiponectin, and the Whey Protein Concentrate (WPC) groups. Each group was constituted by four different litters (n = 36 pups/group). Animals from the Reference group were administered with the same volume of vehicle (mineral water) as the supplemented groups (10 mL/kg/day). The Leptin group was supplemented with a solution of leptin (PeproTech®, Rocky Hill, NJ, USA) at a dose of 0.7 μg/kg/day in mineral water, the Adiponectin group was supplemented with adiponectin (PeproTech®) solution at a dose of 35 μg/kg/day in mineral water and the WPC group was supplemented with Lacprodan® MFGM-10 (Arla Foods Ingredients Group, Diby, Denmark) at a dose of 0.3 g/kg/day in mineral water. All these doses have been demonstrated in previous studies to have immunomodulatory activity (19, 20). The WPC group was used as positive control of modulation by breast milk bioactive factors. Suckling rats were daily supplemented during the whole lactating period (21 days), using low-capacity syringes (Hamilton Bonaduz, Bonaduz, Switzerland) adapted to oral 25- or 23-gauge gavage tubes and 27 mm in length (ASICO, Westmont, IL, USA), as previously described (21). To allow gastric emptying, litters were separated from their dams half an hour before oral supplementation.
Experimental Design 1
On day 10 -in the middle of the suckling period-, the functionality of the intestinal epithelial barrier was assessed on 3 rats of each litter (n = 12/group) by an in vivo permeability assay, as previously described (22). Briefly, a solution of 4 kDa-dextran conjugated to FITC (Sigma-Aldrich) was orally administered to rats using low-capacity syringes adapted to oral gavage tubes. There was an additional group of animals that was only administered with an equivalent volume of PBS (10 mL/kg) to rule out the fluorescent background of the plasma samples. After 4 h of the dextran administration, the animals were euthanized and plasma was obtained, diluted and the fluorescence emission was quantified by triplicate at an excitation wavelength of 490 nm in the Modulus™ microplate spectrophotometer (Turner Biosystems, Sunnyvale, CA, USA). Moreover, a 0.5 cm portion of the middle intestine was immediately conserved in RNAlater® (Applied Biosystems, Weiterstadt, Germany), incubated at 4°C overnight and stored at −20°C until PCR analysis.
Experimental Design 2
At the end of the suckling period (day 21), another 3 rats of each litter (n = 12/group) were anesthetized intramuscularly with ketamine (90 mg/kg) (Merial Laboratories S.A., Barcelona, Spain) and xylazine (10 mg/kg) (Bayer A.G., Leverkusen, Germany), exsanguinated and the small intestine was carefully collected. After discarding the duodenum, a 0.5 cm portion of the middle intestine was immediately conserved, as previously on day 10, until PCR analysis. The proximal 1/3 portion of the intestine was opened lengthwise along the mesenteric line and was cut into 2 cm pieces and immersed in Hanks balanced salt solution (HBSS) (Sigma-Aldrich, Madrid, Spain) supplemented with 100 IU/mL streptomycin–penicillin (Sigma-Aldrich) and 5% fetal bovine serum (FBS; Sigma-Aldrich) until further steps in IEL isolation. Moreover, cecal content was also collected and kept at −80°C for gut microbiota analysis.
Intraepithelial Lymphocyte Isolation
IEL suspensions were obtained following procedures previously established in our laboratory (23), with some modifications. Briefly, small pieces of intestine were incubated with a 1 mM 1,4-dithiothreitol (DTT) (Sigma-Aldrich) solution in HBSS with 10% FBS under continuous agitation (55 u/min, 20 min, 37°C). The first supernatants were collected by decanting the tubes. Afterwards, a 5 mM ethylenediaminetetraacetic acid (EDTA) (Sigma-Aldrich) solution in HBSS with 10% FBS was added to the remaining intestinal tissue and incubated twice under continuous agitation (55 u/min, 15 min, 37°C). The supernatants from each step were decanted from the tissue pieces, collected and then centrifuged (538 g, 5 min, 4°C). The resulting pellet containing IEL and epithelial cells from all steps was then subjected to IEL purification.
Intraepithelial Lymphocyte Purification
The pellet containing IEL was resuspended in 44% Percoll® (Sigma-Aldrich). Each cell suspension was overlaid on 67.5% Percoll® and, after centrifugation (600 g, 30 min, room temperature), viable lymphocytes were recovered from the interface. Finally, purified lymphocytes were resuspended in Roswell Park Memorial Institute (RPMI) 1640 medium (Sigma-Aldrich) enriched with 10% FBS, 100 IU/mL streptomycin–penicillin, 2 mM L-glutamine (Sigma-Aldrich) and 0.05 mM 2-β-mercaptoethanol (Merck Millipore). Cell number and viability were determined using CountessTM Automated Cell Counter (InvitrogenTM, Thermo Fisher Scientific, Barcelona, Spain).
Immunofluorescence Staining and Flow Cytometry Analysis
IEL (2 × 10⁵) were stained with anti-rat monoclonal antibodies (mAb) conjugated to fluorescein isothiocyanate (FITC), phycoerythrin (PE), peridininchlorophylla protein (PercP), allophycocyanin (APC) or APC-cyanine (Cy)7, as in previous studies (24). In this case, the mAb used were anti-CD4, anti-CD8α, anti-CD8β, anti-TCRαβ, anti-TCRγδ, anti-NKR-P1A, anti-CD25, anti-CD45RA (BD Biosciences, San Diego, USA), anti-CD62L, and anti-CD103 (Biolegend, San Diego, CA, USA). After standard procedures (20), samples were analyzed using a GalliosTM Cytometer (Beckman Coulter Inc., Miami, FL, USA) in the Scientific and Technological Centers of the University of Barcelona (CCiT-UB). The results were assessed by FlowJo version 10 software (TreeStar, Inc., Ashland, OR, USA). Lymphocyte subsets were defined as follows: Th (TCRαβ+ NKR-P1A− CD4+) cells; Tc TCRαβ+ (TCRαβ+ NKR-P1A− CD8+) cells; Tc TCRγδ+ (TCRγδ+ CD8+) cells; natural killer (NK) (NKR-P1A+ TCRαβ−) cells; NKT (NKR-P1A+ TCRαβ+) cells; CD4+ (CD4+ CD8−) cells; CD8+ (CD4− CD8+) cells; CD8αα+ (CD8α+ CD8β−); CD8αβ+ (CD8α+ CD8β+). Results are expressed as percentages of positive cells in the lymphocyte population selected according to their forward-scatter cells (FSC) and side-scatter characteristics (SSC) or in a particular selected population.
Quantification of Gene Expression in Small Intestine
For RNA isolation, small intestine samples from 6 rats/group randomly selected conserved in RNAlater® were processed as in previous studies (25). Tissue samples were homogenized in a FastPrep (MP Biomedicals, Illkirch, France) for 30 s. RNA was obtained using a RNeasy Mini Kit (Qiagen, Madrid, Spain) following the manufacturer's instructions. RNA purity and concentration were determined by NanoPhotometer (BioNova Scientific, S.L. Fremont, CA, USA). Thereafter, cDNA was obtained using TaqMan® Reverse Transcription Reagents (Applied Biosystems).
The specific PCR TaqMan® primers (Applied Biosystems) used to perform the PCR quantitative assay were: Tlr2 [Rn02133647_s1, inventoried (I)], Tlr4 (Rn00569848_m1, I), Tlr5 (Rn04219239_s1, I), Tlr7 (Rn01771083_s1, I), Tlr9 (Rn01640054_m1, I), Infg (Rn00594078_m1, I), Tnf (Rn99999017_m1, I), Il10 (Rn00563409_m1, I), Muc2 (Rn01498206_m1, I), Muc3 (Rn01481134_m1, I), Prdm1 (Rn03416161_m1, I, encoding for Blimp-1), Fcgrt (Rn00583712_m1, I, encoding for FcRn), Pigr (Rn00562362_m1, I), Cldn2 (Rn02063575_s1, I), Cldn4 (Rn01196224_s1, I), Ocln (Rn00580064_m1, I), and Tjp1 (Rn02116071_s1, I, ZO-1). Quantification of the studied genes was normalized to the Gusb (β-glucuronidase, Rn00566655_m1, I) housekeeping gene, which showed constant level of expression in our experimental conditions and a similar level of expression to the studied genes. Real-time PCR assays were performed in duplicate using an ABI Prism 7900HT sequence detection system (Applied Biosystems). The SDS software (version 2.4, Applied Biosystems) was used to analyze the expression of data.
The amount of target mRNA relative to the endogenous control expression was calculated for the three nutritional intervention groups relative to values from the Reference group, which represents 100% of the gene expression using the 2−ΔΔCt method, as previously described (26). Results are expressed as percentage of values of each supplemented group normalized to the mean value obtained for the Reference group, which was set at 100%.
DNA Extraction
Cecal DNA was extracted using the QIAamp DNA Stool Mini Kit (Qiagen), as previously described (27). The protocol from the manufacturer was followed with an addition of a bead beating step. Sterile glass beads (sized 1 mm Ø) were added together with stool lysis buffer to the samples and cell lysis was performed for 4 min at 25 Hz using a TissueLyser (Qiagen), followed by a heating step at 95°C for 5 min. After lysis, DNA-damaging substances and PCR inhibitors were neutralized using an InhibitEX tablets (provided with the kit) and the DNA was purified on QIAamp Mini spin columns.
PCR Amplification of the V4 Region of Bacterial 16S rRNA Genes
The V4 region of 16S rRNA gene was amplified by PCR with forward and reverse primers according to Kozich et al. (28), containing Illumina (Illumina Inc., San Diego, CA, USA) adapter sequences and unique dual indexes used to tag each PCR product, according to the 16S-protocol provided by Illumina. Primer sequences can be found in Table 1. Briefly, PCR was carried out in 25 μL reactions with 0.2 μM forward and reverse primers, with 12.5 ng template DNA and 12.5 μL of 2 × KAPA HiFi HotStart Ready Mix kit (KAPA Biosystems, Woburn, MA, USA). Thermal cycling consisted of initial denaturation at 95°C for 3 min followed by 25 cycles of denaturation at 95°C for 30 s, annealing at 55°C for 30 s, and extension at 72°C for 30 s, followed by a final step of 72°C for 5 min. The amplicon products were purified with Agencourt AMPureXP Kit (Beckman Coulter, Miami, FL, USA). Next, a second PCR was thereafter performed to attach Illumina adapters and unique dual indexes to each sample, followed by a clean-up step with AmPureXP Kit (Beckman Coulter). PCR amplicons were visualized using 0.1% agarose gel electrophoresis to verify the size of the amplicon. Negative extraction controls did not produce visible bands.

Table 1. Primer sequences for amplification of V4 region of 16S rRNA gene.
Amplicons Quantitation, Pooling, and Sequencing
Amplicon DNA concentrations were quantified using the Qubit4.0 Fluorometer (Life Technologies, Stockholm, Sweden). Amplicons were combined in equimolar ratios into a single tube with a final concentration of the DNA library of 4 pM. As an internal control, 5% of PhiX was added to the amplicon pool. Paired-end sequencing with a read length of 2 × 250 bp was carried out on a Miseq Instrument (Illumina) using a Miseq reagent kit v2 (Illumina).
Sequence Analysis
Sequenced data were analyzed with an open-source bioinformatics pipeline Quantitative Insights into Microbial Ecology (QIIME), which allows the analysis of high-throughput community sequencing data. Sequences were removed when lengths were <200 nucleotides, contained ambiguous bases, primer mismatches or if the homo polymer runs were in excess of six bases. After quality filtering, a total of 3,913,202 reads were obtained for the 29 samples with an average of 134,938 reads per sample (min: 64,101 and max: 232,472). Similar sequences were binned into operational taxonomic units (OTU) using UCLUST, with a minimum of 97% sequence similarity. The most abundant sequence in each OTU was chosen to represent the respective OTU. Then, representative sequences (most abundant) from each OTU were aligned using Python Nearest Alignment Space Termination (PyNAST). Taxonomy was assigned using Greengenes database (v.13_8). The heat map of the mean relative abundances of genera was also obtained from QIIME. In addition, the relative proportion of the bacteria was calculated using GraphPad Prism software (version 7.0, GraphPad Software, La Jolla, CA, USA). Finally, Venn diagrams were made by Bioinformatics and Evolutionary Genomics program from the University of Ghent.
Statistical Analysis
The software IBM Statistical Package for the Social Sciences (SPSS, version 22.0, Chicago, IL, USA) was used to perform statistical analysis. Levene's and Shapiro–Wilk tests were applied to assess variance equality and normal distribution, respectively. Conventional one-way ANOVA test was performed considering the experimental group as the independent variable. When supplementation had a significant effect on the dependent variable, Bonferroni post-hoc test was applied. Otherwise, non-parametric Kruskal–Wallis test followed by the post-hoc Mann–Whitney U-test were used in order to assess significance for independent and related samples, respectively. A parallel analysis was performed taking into account the sex of the animals as variable. As no sexual dimorphism in the variables analyzed here in the early life animal was found, animals in each group were considered together independently of sex. Significant differences were accepted when p < 0.05.
Results
Intestinal Barrier Function
To study the intestinal epithelial barrier function on day 10, when it is still in early development, an in vivo permeability assay was performed to determine the paracellular pass of the 4 kDa-dextran labeled with FITC. No effect due to any of the supplementations was found, suggesting that the compound tested do not act through the modulation of such function (Supplementary Figure 1A).
Intraepithelial Lymphocyte Composition
The percentage of the main subsets present in IEL was determined at day 21 (Figure 1). After the supplementation, during the whole suckling period, both leptin and adiponectin were able to increase the Tc TCRαβ+ and NKT proportions and to decrease NK cell percentage in IEL compared to the Reference group (p < 0.05, Figure 1). The WPC group showed the same effect (p < 0.01), indicating that the effect of the adipokines on the IEL population is in line with that of the whey protein, containing a high concentration of bioactive factors with immunomodulatory effects. No changes due to diets were observed in Th or Tc TCRγδ+.
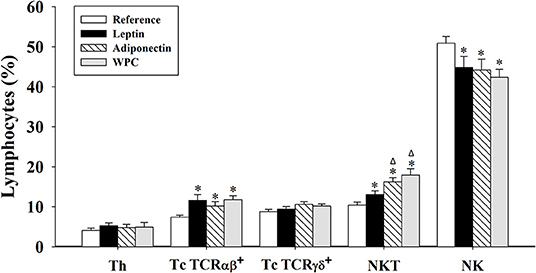
Figure 1. Main IEL subsets at day 21 from the four groups: Reference, Leptin, Adiponectin, and Whey Protein Concentrate (WPC). Lymphocyte populations were defined as follows: Th (TCRαβ+ NKR-P1A− CD4+) cells; Tc TCRαβ+ (TCRαβ+ NKR-P1A− CD8+) cells; Tc TCRγδ+ (TCRγδ+ CD8+) cells; NKT (NKR-P1A+ TCRαβ+) cells; and natural killer (NK) (NKR-P1A+ TCRαβ−) cells. Results are expressed as mean ± S.E.M. (n = 8–12 pups). Statistical differences: *p < 0.05 vs. Reference group, Δp < 0.05 vs. Leptin group.
With regard to the CD8 co-receptor, all components enhanced its presence after 21 days of supplementation (p < 0.01 vs. Reference group, Figure 2A). However, leptin and adiponectin differentially modulated CD8+ IEL development. Changes induced by leptin supplementation were associated with an increase in a more intestinal phenotype (CD8αα+) (p < 0.05 vs. Reference group), whereas adiponectin or WPC administration was related with a more peripheral phenotype (CD8αβ+, p < 0.05 vs. Reference and Leptin group, Figure 2A). These alterations caused higher CD8αα+/CD8αβ+ ratio in animals supplemented with leptin compared to reference (p < 0.05, Figure 2B).
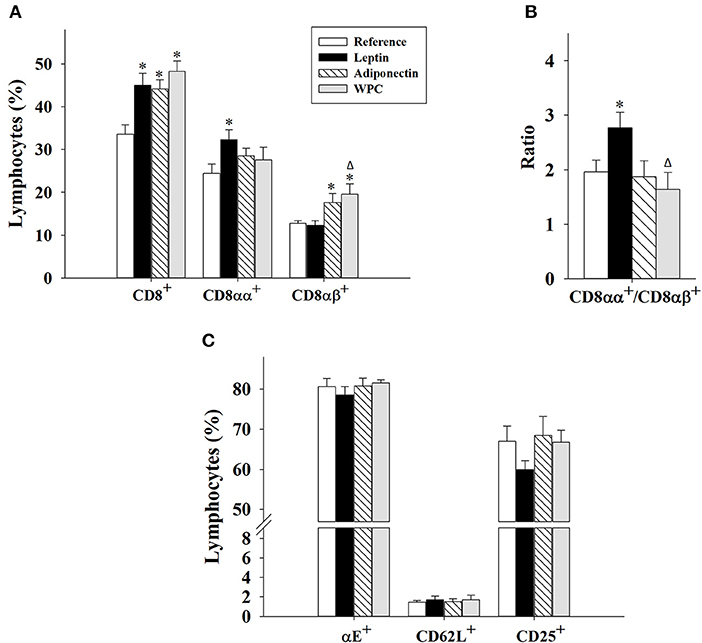
Figure 2. CD8+ IEL subsets (A,B) and surface expression of some molecules in IEL (C) at day 21 from the four groups: Reference, Leptin, Adiponectin, and Whey Protein Concentrate (WPC). Percentage of CD8+ (CD8+ CD4−); CD8αα+ (CD8α+ CD8β−); and CD8αβ+ (CD8α+ CD8β+) (A). The ratio CD8αα+/CD8αβ+ (B). Percentage of αE+ integrin (CD103+), CD62L+ selectin, and CD25+ IEL (C). Results are expressed as mean ± S.E.M. (n = 8–12 pups). Statistical differences: *p < 0.05 vs. Reference group, Δp < 0.05 vs. Leptin group.
Furthermore, the expression of intestinal homing molecules (αE integrin and CD62L selectin) and the activation marker CD25 was also studied (Figure 2C). None of the dietary interventions during 21 days was able to modify the expression of any of the three molecules.
Intestinal Gene Expression
The relative gene expression in the intestine of molecules associated with the bacteria host cell crosstalk [Toll-like receptor (TLR)-2, TLR-4, TLR-5, TLR-7, TLR-9], innate immune response [tumor necrosis factor (TNF)-α, mucin (MUC)-2, MUC-3], intestinal maturation and function [B-lymphocyte-induced maturation-protein-1 (Blimp-1), neonatal-Fc-receptor (FcRn), polymeric Ig receptor (pIgR)], and molecules related to tight junctions of the epithelial barrier [Claudin-4, Occludin, zona occludens (ZO)-1], are shown in Figure 3. Moreover, other molecules such as interferon (IFN)-γ, interleukin (IL)-10, and Claudin-2 were also studied without reaching levels of detection.
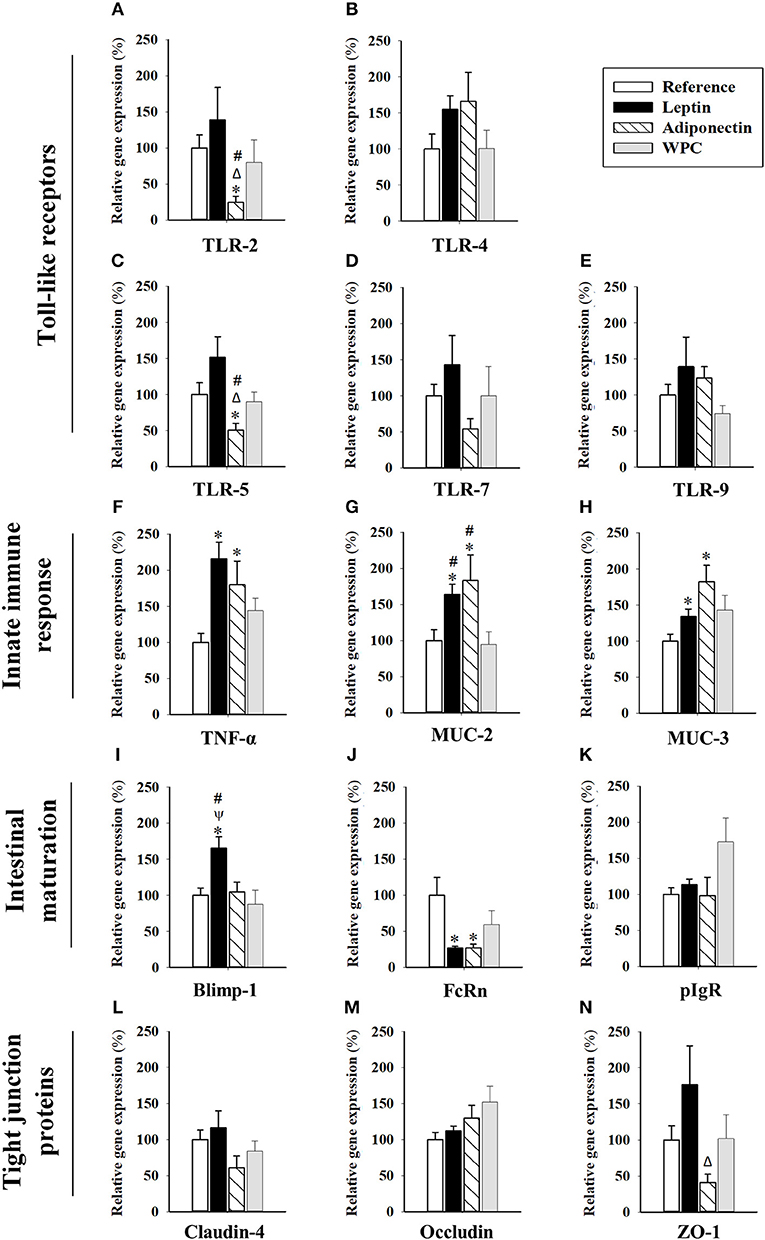
Figure 3. Gene expression in small intestinal samples from the four groups: Reference, Leptin, Adiponectin, and Whey Protein Concentrate (WPC). TLR-2 (A), TLR-4 (B), TLR-5 (C), TLR-7 (D), TLR-9 (E), TNF-α (F), MUC-2 (G), MUC-3 (H), Blimp-1 (I), FcRn (J), pIgR (K), Claudin-4 (L), Occludin (M), and ZO-1 (N). Results are expressed as mean ± S.E.M. (n = 6–12 pups). Statistical differences: *p < 0.05 vs. Reference group, Δp < 0.05 vs. Leptin group, ψp < 0.05 vs. Adiponectin group, #p < 0.05 vs. WPC group.
With regard to the TLR expression, although no changes were observed in TLR-4 and TLR-9 (Figures 3B,E, respectively), adiponectin supplementation, but not leptin, showed a tendency to decrease TLR-7 (Figure 3D) and significantly decreased TLR-2 and TLR-5 gene expression (p < 0.05 vs. Reference, Leptin and WPC groups, Figures 3A,C).
Focusing on molecules related to the intestinal innate immune response, TNF-α, MUC-2, and MUC-3, their gene expression was higher in those suckling rats supplemented with both adipokines (p < 0.05, Figures 3F–H), suggesting a role in the early development of innate immunity. These changes were already observed only for MUC-2 on day 10 (P < 0.05, Supplementary Figure 1B). In addition, leptin dietary intervention promoted intestinal maturation by means of enhancing the Blimp-1 gene expression (p < 0.01, Figure 3I). Moreover, both adipokine supplementations during 21 days lowered the expression of FcRn gene (p < 0.05, Figure 3J). On the other hand, none of the three compounds were able to modify the gene expression of pIgR (Figure 3K) Neither Blimp-1 nor FcRn gene expression was modified earlier in life due to the adipokines supplementation (day 10, Supplementary Figure 1B).
Regarding the molecules related to the tight junctions of the epithelial barrier, although no differences were detected on day 10 (Supplementary Figure 1B), the animals supplemented with adiponectin showed lower gene expression of ZO-1 (p < 0.05 vs. Leptin group, Figure 3N). However, no differences in Claudin-4 or Occludin due to adipokine supplementation were observed on both studied days (Figures 3L,N and Supplementary Figure 1B).
Gut Microbiota Composition
At the end of the study, cecal microbiota composition was established. To assess the diversity of microbial populations, Shannon-Wiener and CHAO1 indexes were calculated. None of the four groups showed any significant change in the microbiota diversity (Table 2). However, the dietary interventions influenced the microbiota composition at different taxonomic levels. The main phylum of bacteria present in the Reference group was Bacteroidetes, followed by Firmicutes, Proteobacteria and Cyanobacteria, and were approximately 47, 30, 19, and 3% of total gut microbiota, respectively (Figure 4A). The three supplementations induced lower Proteobacteria phylum proportion compared to the Reference group (p < 0.01, Figure 4A). In the Leptin group, this decrease was due to the lower abundance of Desulfovibrionaceae, Alcaligenaceae, and the unclassified family from the RF32 order (p < 0.01 vs. Reference group, Figure 4B). In the case of the Adiponectin group, this change was caused only by a lower presence of the unclassified family from the RF32 order (p < 0.01 vs. Reference group, Figure 4B) and WPC also showed less Desulfovibrionaceae and unclassified family from RF32 order than the Reference group (p < 0.01, Figure 4B). The Firmicutes/Bacteroidetes ratio was also assessed without changes observed among groups (Table 2). Although no significant changes were observed in Bacteroidetes and Firmicutes phylum proportions due to the interventions, some modifications in their respective families were observed in animals supplemented with leptin and WPC. In this sense, the Leptin group had a higher proportion of Ruminococcaceae and the unclassified family from the Clostridiales order (p < 0.01 vs. Reference group, Figure 4B). On the other hand, an increase in the Prevotellaceae and Lactobacillaceae families and a decrease in the Lachnospiraceae family proportions were observed in those animals fed with WPC compared to the Reference group (p < 0.05, Figure 4B).
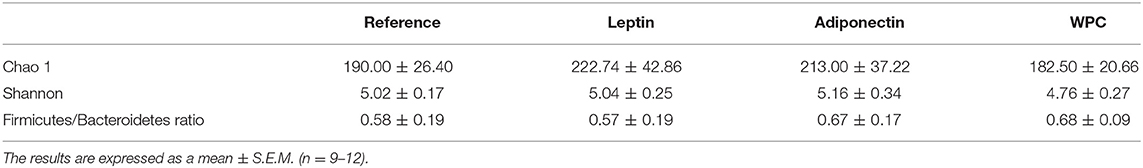
Table 2. Shannon-Wiener and CHAO1 indexes from the four groups: Reference, Leptin, Adiponectin, and Whey Protein Concentrate (WPC) at the end of the suckling period.
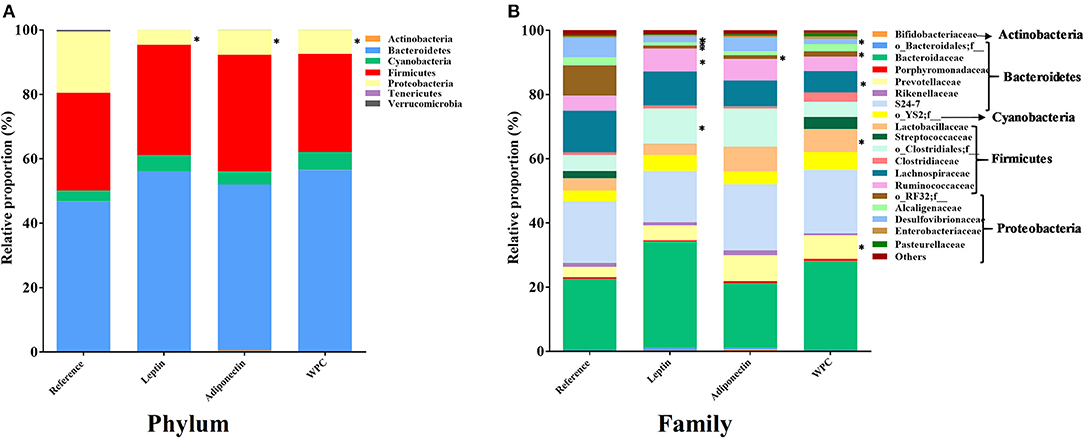
Figure 4. The relative proportion of the bacteria was calculated for phylum (A) and family (B) at day 21 from the four groups: Reference, Leptin, Adiponectin, and Whey Protein Concentrate (WPC) (n = 6–12 pups). Statistical differences: *p < 0.05 vs. Reference group.
The heatmap of Figure 5 shows the changes found at genus level. The regions with a higher presence of a particular genus are indicated in red and those with a lower presence in blue. All supplementations were able to decrease the relative abundance of Blautia genus of the cecal microbiota compared to the Reference group (p < 0.01 for the Leptin and WPC groups and p < 0.05 for the Adiponectin group, Figure 5). Moreover, some specific effects of each adipokine were observed. On the one hand, rats fed with leptin showed a higher proportion of the Clostridium and Dehalobacterium genera and a lower presence of the Holdemania and Sutterella genera (p < 0.01 vs. Reference group). On the other hand, an increase of the Enterococcus genus and a decrease in the Roseburia and Allobaculum genera abundances were observed in the Adiponectin group (p < 0.05). WPC nutritional intervention promoted the presence of the Dehalobacterium genus and reduced the relative abundance of the Anaerotruncus and Adlercreutzia genera (p < 0.05, Figure 5).
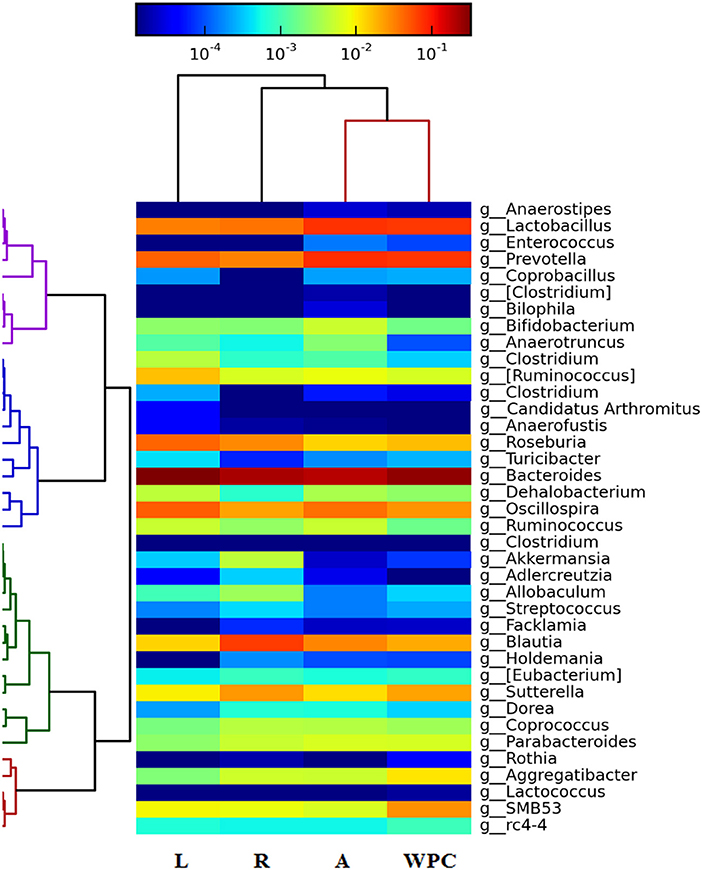
Figure 5. Heatmap showing the abundance of microbiota at genus level at day 21 from the four groups: Reference (R), Leptin (L), Adiponectin (A), and Whey Protein Concentrate (WPC) (n = 6–12 pups). Intense blue and red shades indicate lower and higher relative abundances, respectively.
In order to better understand the presence or the absence of bacterial genera found in each group, Venn diagrams were plotted (Figure 6). Among all cecal genera detected, 40 genera were present in the four groups studied. Nevertheless, the supplementation with leptin promoted the specific colonization with the Candidatus arthromitus species whereas the Lactococcus genus appeared only after the supplementation with WPC (Figure 6).
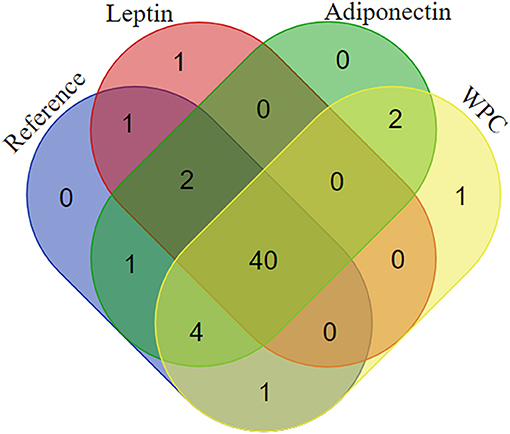
Figure 6. Venn diagram showing the distribution of the genera in the four groups: Reference, Leptin, Adiponectin, and Whey Protein Concentrate (WPC) (n = 6–12 pups).
Discussion
In previous studies, we demonstrated that a daily supplementation with leptin or adiponectin during the whole suckling period was able to enhance the immune system of pups, not only in the intestinal compartment (20), but also at systemic level (19). These results prompted us to further study the influence of the supplementation of these adipokines on the IEL subsets, as representative effector cells of GALT, intestinal gene expression and cecal microbiota composition. Moreover, as WPC has previously shown immunomodulatory effects on neonatal rats, one of the groups received it as a positive control of modulation by breast milk bioactive factors. However, a limitation of the study is the adiponectin structure used. Whereas, the most abundant form of adiponectin in human milk is the high molecular weight multimer (29), we have supplemented the rats with the monomeric form. However, and although leptin and adiponectin plasmatic levels in pups were not assessed after supplementation in this approach, their intestinal absorption in rodents has previously been described (30, 31).
First of all, on day 10 of the suckling period, the intestinal barrier function was assessed, evaluating the intestinal permeability to 4 kDa-dextran. No changes were observed due to adipokine supplementations. This result in early life rats is in contrast to that found in two different studies; in one of them an increase in intestinal permeability after an intraperitoneal injection of leptin in adult rats was found (32), and, on the contrary, in an in vitro study a reduction in permeability was observed (33). The variability in these results highlights the importance of the type of approach (in vitro vs. in vivo) but also the state of development of the animals (suckling vs. adult).
To our knowledge, this is the first study to report the effect of adipokine supplementation on IEL composition. Although no changes were observed in Th or Tc TCRγδ+ cells, the three supplemented groups showed an increase of Tc TCRαβ+ and NKT cell percentages compared with the Reference group. These changes were also observed in our previous studies in other immune compartments, where the supplementation with both adipokines was able to enhance both subsets on the spleen (19) and T TCRαβ+ cells on the mesenteric lymph nodes (MLN) (20), suggesting an enhancement of immune maturation. However, a decrease in the NK cell proportion was detected after the three nutritional interventions in comparison to the Reference group. As has been described, there is a physiological depletion in NK IEL throughout the suckling period (13), and the enhancement in the reduction could indicate a promotion of NK maturation caused by the supplementations.
Regarding the proportion of cells bearing CD8, the three supplementations were able to increase their percentage. There is no information on the effect of these adipokines or similar components in the intestinal effector lymphocytes, but previously, in leptin-supplemented rat pups, an increase of CD8+ proportion in both MLN and spleen was reported (19, 20). Moreover, adiponectin and WPC administration also increased CD8+ cells in the MLN (20) and spleen (19), respectively. Siegmund et al. observed that ob/ob mice had fewer CD8+ in the IEL population and these cells also produced less IFN-γ compared to wild-type mice (34), contributing to an increase of the infections due to their role modulating the immunity toward microbes (35). This fact together with our present and previous results, strengthens the leptin role in promoting the main effector cells in contact with the lumen (CD8+ IEL). Interestingly, both adipokines act in different ways, thus adiponectin and WPC supplementation increased the percentage of CD8αβ+ cell subset, whereas leptin raised that of CD8αα+ cell subset, leading to an increase in the CD8αα+/CD8αβ+ ratio in the Leptin group compared to the Reference group. The increase in CD8αα+ cell proportion could be beneficial because this phenotype is more characteristic at intestinal level (35), suggesting a local effect resulting from leptin supplementation. Moreover, the three dietary interventions did not modify the integrin αE+, CD62L+, or CD25+ cell percentage after 21 days of supplementation, suggesting that they do not have an impact on the intestinal homing or activation pathways.
To further understand the impact of the studied supplementations on the intestinal immune system, the intestinal gene expression of some key molecules was assessed. No effect was observed in the gene expression of the analyzed TLR due to leptin or WPC supplementation, whereas a decrease in TLR-2 and TLR-5 gene expression was observed due to adiponectin supplementation. TLR-2 has an important role in the recognition of molecules present in the membrane of multiple pathogens, such as bacteria, virus, fungi and parasites (36), whereas, TLR-5 detects the flagella of bacteria (37). Thus, the decrease of these intestinal TLR could be related to the anti-inflammatory properties attributed to adiponectin (38–40).
The TNF-α cytokine and the mucines, MUC-2, and MUC-3, present in the small intestine act as an innate defense against different pathogens, and a lack of these components result in increased bacterial adhesion (41). MUC-2 gene was responsible for the gel-forming mucins, whereas MUC-3 gene makes membrane-bound mucins (42). Moreover, TNF-α regulates the mucus layer, increasing expressions of pIgR and MUC-2; it modulates tight-junctions, increasing intestinal permeability, induces cell death, restitutes and regenerates the epithelium, increasing cell migration and proliferation and interacts with the immune system (43). The supplementation with leptin or adiponectin during 21 days was able to increase the gene expression of these three molecules compared to the Reference group, suggesting a barrier reinforcement due to adipokines in early life. The effect on MUC-2 was the only one found already in the middle of the suckling period. In line with these results, it has been described in rats that a perfusion of leptin was able to increase the expression of MUC-2 and MUC-3 and to stimulate mucus-secreting goblet cells (44, 45). However, there is no information regarding whether adiponectin affects these intestinal genes or modulates the intestinal epithelial barrier. Gene expression of pIgR, Blimp-1 and FcRn is related to intestinal function and maturation because their expression changes during the suckling period. Whereas, the intestinal pIgR is barely expressed during the suckling and increases after weaning (46), the Blimp-1 and FcRn are highly expressed in early life and decrease at weaning (47). In our study, although the adipokines supplementation did not modify the proportion of pIgR, they were able to decrease the gene expression of FcRn on day 21, suggesting an early intestinal maturation. Unexpectedly, a punctual increase on Blimp-1 mRNA levels was observed after leptin supplementation. This fact triggers an intricateness interpretation because Blimp-1 expression has been described as being differential according to the intestinal section evaluated (47).
The study of the gene expression related to tight junction molecules showed that the adipokine supplementation did not produce any significant change in any of the studied days compared to the Reference group. Supporting this result, it has been reported that, in mice, after an intraperitoneal administration of 2 μg/g of adiponectin, no change in colonic Occludin and ZO-1 protein abundance at day 10 of life was observed (33). Nevertheless, Kim et al. detected a decrease in Occludin gene expression after the addition of 100 ng/mL of leptin to Caco-2 BBe cell culture; however, it has to be taken into account that these in vitro results should be confirmed in vivo (48).
The effect of adipokine supplementation during the whole suckling period on the gut microbiota composition was also studied. The three studied components were able to decrease the Proteobacteria phylum proportion. It has been described that breast-fed infants had a lower abundance of Proteobacteria than those fed with formula (49). In addition, in overweight/obese mothers, who have high leptin concentration in their breast milk, a lower abundance of Proteobacteria phylum in the infant intestinal microbiota at 2 weeks old has also been observed (50). Those results, together with ours, suggest that leptin and adiponectin, adipokines present in breast milk, might be components involved in the growth regulation of this phylum in breast-fed infants. However, Rajala et al. described that leptin receptor deficient mice (db/db) showed lower Bacteroidetes and higher Firmicutes proportions than wild-type mice, results not detected in the present study (51). Overall, in the early life context and taking into account that in rats aged from 7 days old to 28 days old, the percentage of Proteobacteria naturally decreases (27). So here, the reduction triggered by the adipokine supplementation in this phylum could be related to an enhancement of the gut microbiota maturation. Furthermore, Proteobacteria was also related to inflammation and it is a risk factor for necrotizing enterocolitis development in infants, thus a depletion of this phylum could have a protective role against this common pediatric disease (10).
Although previous studies are focused on modifications at the phylum level, to our knowledge this is the first study to report the effect of adipokines on a deeper level of taxonomy. The decrease in the Proteobacteria phylum proportion was due to different changes at family level. The three evaluated supplementations were able to decrease the unclassified family from the RF32 order. In addition, the leptin and WPC supplementations produced a lower percentage of Desulfovibrionaceae and leptin nutritional intervention was the only one that decreased the Alcaligenaceae family. Moreover, the leptin administration during 21 days was able to increase the Ruminococcaceae proportion and also the unclassified family from the Clostridiales order. In line with these results, Zhou et al. found a positive correlation between plasmatic leptin and the Clostridiales order in male adult mice (52). On the other hand, WPC was able to increase the Prevotellaceae and Lactobacillaceae families, whereas a decrease in Lachnospiraceae was detected. In accordance with that, increased levels of Lactobacillus due to whey protein intake were observed, specifically in obese donors (53). However, another study reported in chicks, among other changes, an increase in the relative proportion of the Lachnospiraceae and Bacteroidetes families in the cecal microbiota after WPC administration (54).
Regarding the genus level, 16S rRNA gene sequencing revealed a decrease in the Blautia genus in all supplemented groups. Low levels of Blautia have been observed in children with type 1 diabetes (55) or with Crohn's disease (56, 57). Moreover, rats supplemented with leptin showed higher Clostridium and Dehalobacterium genera and lower levels of Holdemania and Sutterella. Although Queipo-Ortuño et al. described a negative correlation between serum leptin and Clostridium genus (58), a higher concentration of the Sutterella genus was observed in infants with autism (59, 60). Further studies considering endocrine-gut-brain and leptin could be conducted to better understand the role of this adipokine in this process. Moreover, the adiponectin supplementation increased the proportion of the Enterococcus genus and decreased the Roseburia and Allobacterium genera. It is known that Enterococcus is an opportunistic bacteria that has been associated with human celiac disease (61); however, this is a preclinical study and further studies are needed to shed light on this field. With regard to the WPC supplementation, it was able to reduce the percentage of the Anaerotruncus and Adlercreutzia genera and to increase the proportion of the Dehalobacterium genus. Little is known about the possible role of the Anaerotruncus genus, but Lau et al. described a bacteraemia caused by Anaerotruncus colihominis (62), so the fact that the WPC decreased this genus might suggest a protective role in the newborn. Furthermore, children with inflammatory bowel disease or patients with multiple sclerosis showed a lower presence of Adlercreutzia compared with their respective controls (63, 64).
On the other hand, other changes have been observed due to leptin supplementation, such as new bacteria colonized the cecal flora (Candidatus arthromitus) and after WPC administration the genus Lactococcus was detected.
The importance of the interaction between both the intestinal immune system and microbiota is well-described. So, some of the modifications in IEL composition or gene expression could be due to the microbiota or vice-versa. For example, in mice it has been reported that for the expansion of T cells from the TCRαβ lineage, a normal microbial colonization of the intestine is required (15). Moreover, Clostridia species showed an important role in inducing Treg in the colonic mucosa of mice (65). On the other hand, adaptive immunity seems to modulate microbiota composition, as observed in B-cell-deficient mice, where they had alterations in their microbiota, making it less diverse. In addition, secretory IgA could modulate commensal bacteria and also gut microbiota induce its secretion, this being an example of the crosstalk between both of them (66, 67). It has also been described that changes in mucin composition could alter microbiota pattern and conversely, bacteria and their metabolites could modify the mucus layer or even degrade it (68).
In addition to the composition of the microbiota, their metabolites could also affect the immune system, and some of the effects found in this work may be due to the changes in the production of microbial metabolites due to the dietary interventions with the adipokines. For example, short chain fatty acids (SCFA), the most abundant molecules produced by microbiota, have been described as being able to suppress inflammation and increase Treg cells (69). Moreover, it has been described that Lactobacilli tryptophan metabolites are ligands of the aryl hydrocarbon receptor (AhR), which is a receptor involved in the homeostasis of IEL (70). With reference to adipokines, little is known about their effect on the microbial metabolites. However, the mechanisms involved are even more difficult to interpret as it was reported that SCFA could stimulate leptin production and adiponectin expression in vitro (71, 72). Overall, after demonstrating the influence of both adipokines on microbiota composition, their metabolism should be explored in terms of their impact on IEL development.
In conclusion, this study demonstrates that both leptin and adiponectin supplementation throughout the suckling period are able to modify the IEL composition by means of increasing Tc TCRαβ+, NKT, and CD8+ lymphocyte proportions and decreasing that of NK cells. Moreover, the intestinal innate immunity was also enhanced by the increase in TNF-α, MUC-2, and MUC-3 gene expression due to leptin and adiponectin intervention. These adipokines also play a role in the maturation of the intestine by the early reduction of the FcRn expression. In addition, we have reported for the first time the effect of leptin and adiponectin on the gut microbiota composition at the end of the suckling period. Overall, this study reinforces the role of leptin and adiponectin in enhancing the development of the effector immune system and microbiota in the intestinal compartment.
Data Availability Statement
The raw data supporting the conclusions of this manuscript will be made available by the authors, without undue reservation, to any qualified researcher.
Ethics Statement
The studies were performed in accordance with the criteria outlined by the Guide for the Care and Use of Laboratory Animals. Experimental procedures were reviewed and approved by the Ethical Committee for Animal Experimentation of the University of Barcelona and the Ethical Committee of the Generalitat de Catalunya (CEEA/UB 220/15 and DAAM: 8521).
Author Contributions
AF, MC, MR-L, and FP-C conceived and designed the experiments. BG-P, SB, OP, and FF analyzed microbiota composition. BG-P wrote the initial draft of the paper. All authors carried out the experiments and the data analysis, and were involved in the interpretation of the data and critical revision of the manuscript, and have read and approved the final version of the manuscript for publication.
Funding
This work was supported by a grant from the Spanish Ministry of Economy, Industry and Competitiveness (AGL2013-48459-P). BG-P holds a fellowship from the Spanish Ministry of Economy, Industry and Competitiveness (BES-2014-068134). BG-P holds a fellowship from the Spanish Ministry of Economy, Industry and Competitiveness (EEBB-I-18-12758) for her stay at Lund University.
Conflict of Interest
The authors declare that the research was conducted in the absence of any commercial or financial relationships that could be construed as a potential conflict of interest.
Acknowledgments
The authors would like to thank Lidia Marín-Morote and Maria Guijarro for their help with the laboratory work. We also thank Dr. J. Comas and his laboratory technicians from the Centres Científics i Tecnològics from the University of Barcelona (CCiT-UB) for their expert assistance in the cytometry service.
Supplementary Material
The Supplementary Material for this article can be found online at: https://www.frontiersin.org/articles/10.3389/fimmu.2019.02369/full#supplementary-material
Supplementary Figure 1. Intestinal permeability to 4 kDa-FITC-dextran (A) and intestinal gene expression of MUC-2, MUC-3, Blimp-1, FcRn, Claudin-2, Claudin-4, ZO-1, and Occludin (B) at day 10 from the four groups: Reference, Leptin, Adiponectin, and Whey Protein Concentrate (WPC) (n = 8–12 pups). Statistical differences: *p < 0.05 vs. Reference group.
References
1. Rodríguez JM, Murphy K, Stanton C, Ross RP, Kober OI, Juge N, et al. The composition of the gut microbiota throughout life, with an emphasis on early life. Microb Ecol Heal Dis. (2015) 26:26050. doi: 10.3402/mehd.v26.26050
2. Gritz EC, Bhandari V. The human neonatal gut microbiome: a brief review. Front Pediatr. (2015) 3:17. doi: 10.3389/fped.2015.00017
3. Collado MC, Rautava S, Aakko J, Isolauri E, Salminen S. Human gut colonisation may be initiated in utero by distinct microbial communities in the placenta and amniotic fluid. Sci Rep. (2016) 6:23129. doi: 10.1038/srep23129
4. Ardissone AN, de la Cruz DM, Davis-Richardson AG, Rechcigl KT, Li N, Drew JC, et al. Meconium microbiome analysis identifies bacteria correlated with premature birth. PLoS ONE. (2014) 9:e90784. doi: 10.1371/journal.pone.0090784
5. Aagaard K, Ma J, Antony KM, Ganu R, Petrosino J, Versalovic J. The placenta harbors a unique microbiome. Sci Transl Med. (2014) 6:237ra65. doi: 10.1126/scitranslmed.3008599
6. Houghtelling PD, Walker WA. Why is initial bacterial colonization of the intestine important to the infant's and child's health? J Pediatr Gastroenterol Nutr. (2015) 60:294–307. doi: 10.1097/MPG.0000000000000597
7. Bäckhed F, Roswall J, Peng Y, Feng Q, Jia H, Kovatcheva-Datchary P, et al. Dynamics and stabilization of the human gut microbiome during the first year of life. Cell Host Microbe. (2015) 17:690–703. doi: 10.1016/j.chom.2015.04.004
8. Bergström A, Skov TH, Bahl MI, Roager HM, Christensen LB, Ejlerskov KT, et al. Establishment of intestinal microbiota during early life: a longitudinal, explorative study of a large cohort of Danish infants. Appl Environ Microbiol. (2014) 80:2889–900. doi: 10.1128/AEM.00342-14
9. Tanaka M, Nakayama J. Development of the gut microbiota in infancy and its impact on health in later life. Allergol Int. (2017) 66:515–22. doi: 10.1016/j.alit.2017.07.010
10. Arrieta MC, Stiemsma LT, Amenyogbe N, Brown EM, Finlay B. The intestinal microbiome in early life: health and disease. Front Immunol. (2014) 5:427. doi: 10.3389/fimmu.2014.00427
11. Matamoros S, Gras-Leguen C, Le Vacon F, Potel G, De La Cochetiere MF. Development of intestinal microbiota in infants and its impact on health. Trends Microbiol. (2013) 21:167–73. doi: 10.1016/j.tim.2012.12.001
12. Zimmermann P, Curtis N. Factors influencing the intestinal microbiome during the first year of life. Pediatr Infect Dis J. (2018) 37:e315–35. doi: 10.1097/INF.0000000000002103
13. Pérez-Cano FJ, Franch À, Castellote C, Castell M. The suckling rat as a model for immunonutrition studies in early life. Clin Dev Immunol. (2012) 2012:537310. doi: 10.1155/2012/537310
14. Battersby AJ, Gibbons DL. The gut mucosal immune system in the neonatal period. Pediatr Allergy Immunol. (2013) 24:414–21. doi: 10.1111/pai.12079
15. Forchielli ML, Walker WA. The role of gut-associated lymphoid tissues and mucosal defence. Br J Nutr. (2005) 93(Suppl. 1):S41–8. doi: 10.1079/BJN20041356
16. Nash MJ, Frank DN, Friedman JE. Early microbes modify immune system development and metabolic homeostasis-the “Restaurant” hypothesis revisited. Front Endocrinol. (2017) 8:349. doi: 10.3389/fendo.2017.00349
17. Palmeira P, Carneiro-Sampaio M. Immunology of breast milk. Rev Assoc Med Bras. (2016) 62:584–93. doi: 10.1590/1806-9282.62.06.584
18. Donovan SM, Wang M, Li M, Friedberg I, Schwartz SL, Chapkin RS. Host-microbe interactions in the neonatal intestine: role of human milk oligosaccharides. Adv Nutr. (2012) 3:450S−5. doi: 10.3945/an.112.001859
19. Grases-Pintó B, Abril-Gil M, Castell M, Pérez-Cano FJ, Franch À. Enhancement of immune maturation in suckling rats by leptin and adiponectin supplementation. Sci Rep. (2019) 9:1786. doi: 10.1038/s41598-018-38418-1
20. Grases-Pintó B, Abril-Gil M, Rodríguez-Lagunas MJ, Castell M, Pérez-Cano FJ, Franch À. Leptin and adiponectin supplementation modifies mesenteric lymph node lymphocyte composition and functionality in suckling rats. Br J Nutr. (2018) 119:486–95. doi: 10.1017/S0007114517003786
21. Pérez-Cano FJ, Marín-Gallén S, Castell M, Rodríguez-Palmero M, Rivero M, Franch À, et al. Bovine whey protein concentrate supplementation modulates maturation of immune system in suckling rats. Br J Nutr. (2007) 98(Suppl. 1):S80–4. doi: 10.1017/S0007114507838074
22. Grases-Pintó B, Torres-Castro P, Abril-Gil M, Castell M, Rodríguez-Lagunas MJ, Pérez-Cano FJ, et al. A preterm rat model for immunonutritional studies. Nutrients. (2019) 11:999. doi: 10.3390/nu11050999
23. Pérez-Cano FJ, Castellote C, González-Castro AM, Pelegrí C, Castell M, Franch À. Developmental changes in intraepithelial T lymphocytes and NK cells in the small intestine of neonatal rats. Pediatr Res. (2005) 58:885–91. doi: 10.1203/01.pdr.0000182187.88505.49
24. Rigo-Adrover MD, Franch À, Castell M, Pérez-Cano FJ. Preclinical immunomodulation by the probiotic Bifidobacterium breve M-16V in early life. PLoS ONE. (2016) 11:e0166082. doi: 10.1371/journal.pone.0166082
25. Abril-Gil M, Garcia-Just A, Pérez-Cano FJ, Franch A, Castell M. Development and characterization of an effective food allergy model in Brown Norway rats. PLoS ONE. (2015) 10:e0125314. doi: 10.1371/journal.pone.0125314
26. Pérez-Cano FJ, Ramírez-Santana C, Molero-Luis M, Castell M, Rivero M, Castellote C, et al. Mucosal IgA increase in rats by continuous CLA feeding during suckling and early infancy. J Lipid Res. (2009) 50:467–76. doi: 10.1194/jlr.M800356-JLR200
27. Marungruang N, Arévalo Sureda E, Lefrançoise A, Weström B, Nyman M, Prykhodko O, et al. Impact of dietary induced precocious gut maturation on cecal microbiota and its relation to the blood-brain barrier during the postnatal period in rats. Neurogastroenterol Motil. (2018) 30:e13285. doi: 10.1111/nmo.13285
28. Kozich JJ, Westcott SL, Baxter NT, Highlander SK, Schloss PD. Development of a dual-index sequencing strategy and curation pipeline for analyzing amplicon sequence data on the MiSeq Illumina sequencing platform. Appl Environ Microbiol. (2013) 79:5112–20. doi: 10.1128/AEM.01043-13
29. Savino F, Lupica MM, Benetti S, Petrucci E, Liguori SA, Cordero Di Montezemolo L. Adiponectin in breast milk: relation to serum adiponectin concentration in lactating mothers and their infants. Acta Paediatr. (2012) 101:1058–62. doi: 10.1111/j.1651-2227.2012.02744.x
30. Sánchez J, Oliver P, Miralles O, Ceresi E, Picó C, Palou A. Leptin orally supplied to neonate rats is directly uptaken by the immature stomach and may regulate short-term feeding. Endocrinology. (2005) 146:2575–82. doi: 10.1210/en.2005-0112
31. Newburg DS, Woo JG, Morrow AL. Characteristics and potential functions of human milk adiponectin. J Pediatr. (2010) 156:S41–6. doi: 10.1016/j.jpeds.2009.11.020
32. Le Dréan G, Haure-Mirande V, Ferrier L, Bonnet C, Hulin P, de Coppet P, et al. Visceral adipose tissue and leptin increase colonic epithelial tight junction permeability via a RhoA-ROCK-dependent pathway. FASEB J. (2019) 28:1059–70. doi: 10.1096/fj.13-234203
33. Zhao Q, Liu Y, Tan L, Yan L, Zuo X. Adiponectin administration alleviates DSS-induced colonic inflammation in Caco-2 cells and mice. Inflamm Res. (2018) 67:663–70. doi: 10.1007/s00011-018-1155-6
34. Siegmund B, Lehr HA, Fantuzzi G. Leptin: a pivotal mediator of intestinal inflammation in mice. Gastroenterology. (2002) 122:2011–25. doi: 10.1053/gast.2002.33631
35. Konjar Š, Ferreira C, Blankenhaus B, Veldhoen M. Intestinal barrier interactions with specialized CD8 T cells. Front Immunol. (2017) 8:1281. doi: 10.3389/fimmu.2017.01281
36. Oliveira-Nascimento L, Massari P, Wetzler LM. The role of TLR2 in infection and immunity. Front Immunol. (2012) 3:79. doi: 10.3389/fimmu.2012.00079
37. Letran SE, Lee SJ, Atif SM, Uematsu S, Akira S, McSorley SJ. TLR5 functions as an endocytic receptor to enhance flagellin-specific adaptive immunity. Eur J Immunol. (2011) 41:29–38. doi: 10.1002/eji.201040717
38. Çatli G, Olgaç Dündar N, Dündar BN. Adipokines in breast milk: an update. J Clin Res Pediatr Endocrinol. (2014) 6:192–201. doi: 10.4274/jcrpe.1531
39. Tilg H, Moschen AR. Adipocytokines: mediators linking adipose tissue, inflammation and immunity. Nat Rev Immunol. (2006) 6:772–83. doi: 10.1038/nri1937
40. Fantuzzi G. Adiponectin in inflammatory and immune-mediated diseases. Cytokine. (2013) 64:1–10. doi: 10.1016/j.cyto.2013.06.317
41. Kim JJ, Khan WI. Goblet cells and mucins: role in innate defense enteric infections. Pathogens. (2013) 2:55–70. doi: 10.3390/pathogens2010055
42. Kim YS, Ho SB. Intestinal goblet cells and mucins in health and disease: recent insights and progress. Curr Gastroenterol Rep. (2010) 12:319–30. doi: 10.1007/s11894-010-0131-2
43. Leppkes M, Roulis M, Neurath MF, Kollias G, Becker C. Pleiotropic functions of TNF-α in the regulation of the intestinal epithelial response to inflammation. Int Immunol. (2014) 26:509–15. doi: 10.1093/intimm/dxu051
44. Plaisancie P, Ducroc R, El Homsi M, Tsocas A, Guilmeau S, Zoghbi S, et al. Luminal leptin activates mucin-secreting goblet cells in the large bowel. Am J Physiol Gastrointest Liver Physiol. (2006) 290:G805–12. doi: 10.1152/ajpgi.00433.2005
45. El Homsi M, Ducroc R, Claustre J, Jourdan G, Gertler A, Estienne M, et al. Leptin modulates the expression of secreted and membrane-associated mucins in colonic epithelial cells by targeting PKC, PI3K, and MAPK pathways. Am J Physiol Gastrointest Liver Physiol. (2007) 293:G365–73. doi: 10.1152/ajpgi.00091.2007
46. Jenkins SL, Wang J, Vazir M, Vela J, Sahagun O, Gabbay P, et al. Role of passive and adaptive immunity in influencing enterocyte-specific gene expression. Am J Physiol Gastrointest Liver Physiol. (2003) 285:G714–25. doi: 10.1152/ajpgi.00130.2003
47. Arévalo Sureda E, Weström B, Pierzynowski S, Prykhodko O. Maturation of the intestinal epithelial barrier in neonatal rats coincides with decreased FcRn expression, replacement of vacuolated enterocytes and changed Blimp-1 Expression. PLoS ONE. (2016) 11:e0164775. doi: 10.1371/journal.pone.0164775
48. Kim CY, Kim KH. Curcumin prevents leptin-induced tight junction dysfunction in intestinal Caco-2 BBe cells. J Nutr Biochem. (2014) 25:26–35. doi: 10.1016/j.jnutbio.2013.08.011
49. Shin NR, Whon TW, Bae JW. Proteobacteria: microbial signature of dysbiosis in gut microbiota. Trends Biotechnol. (2015) 33:496–503. doi: 10.1016/j.tibtech.2015.06.011
50. Lemas DJ, Young BE, Baker PR 2nd, Tomczik AC, Soderborg TK, Hernandez TL, et al. Alterations in human milk leptin and insulin are associated with early changes in the infant intestinal microbiome. Am J Clin Nutr. (2016) 103:1291–300. doi: 10.3945/ajcn.115.126375.1
51. Rajala MW, Patterson CM, Opp JS, Foltin SK, Young VB, Myers MG Jr. Leptin acts independently of food intake to modulate gut microbial composition in male mice. Endocrinology. (2014) 155:748–57. doi: 10.1210/en.2013-1085
52. Zhou AL, Hergert N, Rompato G, Lefevre M. Whole grain oats improve insulin sensitivity and plasma cholesterol profile and modify gut microbiota composition in C57BL/6J mice. J Nutr. (2015) 145:222–30. doi: 10.3945/jn.114.199778
53. Sánchez-Moya T, López-Nicolás R, Planes D, González-Bermúdez CA, Ros-Berruezo G, Frontela-Saseta C. In vitro modulation of gut microbiota by whey protein to preserve intestinal health. Food Funct. (2017) 8:3053–63. doi: 10.1039/c7fo00197e
54. Pineda-Quiroga C, Camarinha-Silva A, Borda-Molina D, Atxaerandio R, Ruiz R, García-Rodríguez A. Feeding broilers with dry whey powder and whey protein concentrate affected productive performance, ileal digestibility of nutrients and cecal microbiota community. Animal. (2018) 12:692–700. doi: 10.1017/S1751731117002208
55. Murri M, Leiva I, Gomez-Zumaquero JM, Tinahones FJ, Cardona F, Soriguer F, et al. Gut microbiota in children with type 1 diabetes differs from that in healthy children: a case-control study. BMC Med. (2013) 11:46. doi: 10.1186/1741-7015-11-46
56. Wang Y, Gao X, Ghozlane A, Hu H, Li X, Xiao Y, et al. Characteristics of faecal microbiota in paediatric Crohn's disease and their dynamic changes during infliximab therapy. J Crohns Colitis. (2018) 12:337–46. doi: 10.1093/ecco-jcc/jjx153
57. Gevers D, Kugathasan S, Denson LA, Vázquez-Baeza Y, Van Treuren W, Ren B, et al. The treatment-naïve microbiome in new-onset Crohn's disease. Cell Host Microbe. (2014) 15:382–92. doi: 10.1016/j.chom.2014.02.005
58. Queipo-Ortuño MI, Seoane LM, Murri M, Pardo M, Gomez-Zumaquero JM, Cardona F, et al. Gut microbiota composition in male rat models under different nutritional status and physical activity and its association with serum leptin and ghrelin levels. PLoS ONE. (2013) 8:e65465. doi: 10.1371/journal.pone.0065465
59. Ding HT, Taur Y, Walkup JT. Gut microbiota and autism: key concepts and findings. J Autism Dev Disord. (2017) 47:480–89. doi: 10.1007/s10803-016-2960-9
60. Wang L, Christophersen CT, Sorich MJ, Gerber JP, Angley MT, Conlon MA. Increased abundance of Sutterella spp. and Ruminococcus torques in feces of children with autism spectrum disorder. Mol Autism. (2013) 4:42. doi: 10.1186/2040-2392-4-42
61. Olivares M, Walker AW, Capilla A, Benítez-Páez A, Palau F, Parkhill J, et al. Gut microbiota trajectory in early life may predict development of celiac disease. Microbiome. (2018) 6:36. doi: 10.1186/s40168-018-0415-6
62. Lau SK, Woo PC, Woo GK, Fung AM, Ngan AH, Song Y, et al. Bacteraemia caused by Anaerotruncus colihominis and emended description of the species. J Clin Pathol. (2006) 59:748–52. doi: 10.1136/jcp.2005.031773
63. Shaw KA, Bertha M, Hofmekler T, Chopra P, Vatanen T, Srivatsa A, et al. Dysbiosis, inflammation, and response to treatment: a longitudinal study of pediatric subjects with newly diagnosed inflammatory bowel disease. Genome Med. (2016) 8:75. doi: 10.1186/s13073-016-0331-y
64. Chen J, Chia N, Kalari KR, Yao JZ, Novotna M, Paz Soldan MM, et al. Multiple sclerosis patients have a distinct gut microbiota compared to healthy controls. Sci Rep. (2016) 6:28484. doi: 10.1038/srep28484
65. Palm NW, de Zoete MR, Flavell RA. Immune-microbiota interactions in health and disease. Clin Immunol. (2015) 159:122–27. doi: 10.1016/j.clim.2015.05.014
66. Geuking MB, Köller Y, Rupp S, McCoy KD. The interplay between the gut microbiota and the immune system. Gut Microbes. (2014) 5:411–18. doi: 10.4161/gmic.29330
67. Kato LM, Kawamoto S, Maruya M, Fagarasan S. The role of the adaptive immune system in regulation of gut microbiota. Immunol Rev. (2014) 260:67–75. doi: 10.1111/imr.12185
68. Sheng YH, Hasnain SZ, Florin TH, Mcguckin MA. Mucins in inflammatory bowel diseases and colorectal cancer. J Gastroenterol Hepatol. (2012) 27:28–38. doi: 10.1111/j.1440-1746.2011.06909.x
69. Levy M, Thaiss CA, Elinav E. Metabolites: messengers between the microbiota and the immune system. Genes Dev. (2016) 30:1589–97. doi: 10.1101/gad.284091.116
70. Li Y, Innocentin S, Withers DR, Roberts NA, Gallagher AR, Grigorieva EF, et al. Exogenous stimuli maintain intraepithelial lymphocytes via aryl hydrocarbon receptor activation. Cell. (2011) 147:629–640. doi: 10.1016/j.cell.2011.09.025
71. Xiong Y, Miyamoto N, Shibata K, Valasek MA, Motoike T, Kedzierski RM, et al. Short-chain fatty acids stimulate leptin production in adipocytes through the G protein-coupled receptor GPR41. Proc Natl Acad Sci USA. (2004) 101:1045–50. doi: 10.1073/pnas.2637002100
Keywords: leptin, adiponectin, suckling rat, IEL, microbiota
Citation: Grases-Pintó B, Abril-Gil M, Castell M, Rodríguez-Lagunas MJ, Burleigh S, Fåk Hållenius F, Prykhodko O, Pérez-Cano FJ and Franch À (2019) Influence of Leptin and Adiponectin Supplementation on Intraepithelial Lymphocyte and Microbiota Composition in Suckling Rats. Front. Immunol. 10:2369. doi: 10.3389/fimmu.2019.02369
Received: 01 April 2019; Accepted: 20 September 2019;
Published: 09 October 2019.
Edited by:
Jia Sun, Jiangnan University, ChinaReviewed by:
Kate J. Claycombe, United States Department of Agriculture (USDA), United StatesAnandh Babu Pon Velayutham, The University of Utah, United States
Bi E. Tan, Institute of Subtropical Agriculture (CAS), China
Copyright © 2019 Grases-Pintó, Abril-Gil, Castell, Rodríguez-Lagunas, Burleigh, Fåk Hållenius, Prykhodko, Pérez-Cano and Franch. This is an open-access article distributed under the terms of the Creative Commons Attribution License (CC BY). The use, distribution or reproduction in other forums is permitted, provided the original author(s) and the copyright owner(s) are credited and that the original publication in this journal is cited, in accordance with accepted academic practice. No use, distribution or reproduction is permitted which does not comply with these terms.
*Correspondence: Stephen Burleigh, stephen.burleigh@food.lth.se; Francisco J. Pérez-Cano, franciscoperez@ub.edu