 Cintia L. Araujo Furlan1,2
 Jimena Tosello Boari1,2
 Constanza Rodriguez1,2
 Fernando P. Canale1,2
 Facundo Fiocca Vernengo1,2Santiago Boccardo1,2
 Cristian G. Beccaria1,2
 Véronique Adoue3,4,5
 Olivier Joffre3,4,5
 Adriana Gruppi1,2Carolina L. Montes1,2
 Eva V. Acosta Rodriguez1,2*
- 1Departamento de Bioquímica Clínica, Facultad de Ciencias Químicas, Universidad Nacional de Córdoba, Córdoba, Argentina
- 2Centro de Investigaciones en Bioquímica Clínica e Inmunología, CONICET, Córdoba, Argentina
- 3Institut National de la Santé et de la Recherche Médicale, Toulouse, France
- 4Centre National de la Recherche Scientifique, Toulouse, France
- 5Centre de Physiopathologie de Toulouse Purpan, Université de Toulouse, Université Paul Sabatier, Toulouse, France
While it is now acknowledged that CD4+ T cells expressing CD25 and Foxp3 (Treg cells) regulate immune responses and, consequently, influence the pathogenesis of infectious diseases, the regulatory response mediated by Treg cells upon infection by Trypanosoma cruzi was still poorly characterized. In order to understand the role of Treg cells during infection by this protozoan parasite, we determined in time and space the magnitude of the regulatory response and the phenotypic, functional and transcriptional features of the Treg cell population in infected mice. Contrary to the accumulation of Treg cells reported in most chronic infections in mice and humans, experimental T. cruzi infection was characterized by sustained numbers but decreased relative frequency of Treg cells. The reduction in Treg cell frequency resulted from a massive accumulation of effector immune cells, and inversely correlated with the magnitude of the effector immune response as well as with emergence of acute immunopathology. In order to understand the causes underlying the marked reduction in Treg cell frequency, we evaluated the dynamics of the Treg cell population and found a low proliferation rate and limited accrual of peripheral Treg cells during infection. We also observed that Treg cells became activated and acquired a phenotypic and transcriptional profile consistent with suppression of type 1 inflammatory responses. To assess the biological relevance of the relative reduction in Treg cells frequency observed during T. cruzi infection, we transferred in vitro differentiated Treg cells at early moments, when the deregulation of the ratio between regulatory and conventional T cells becomes significant. Intravenous injection of Treg cells dampened parasite-specific CD8+ T cell immunity and affected parasite control in blood and tissues. Altogether, our results show that limited Treg cell response during the acute phase of T. cruzi infection enables the emergence of protective anti-parasite CD8+ T cell immunity and critically influences host resistance.
Introduction
Regulatory T (Treg) cells, defined by the expression of the lineage transcription factor forkhead box P3 (Foxp3), are able to suppress most immune cells (1) and their suppressive function is crucial for immune homeostasis and prevention of autoimmunity (2). In addition, Treg cells were shown to be critical mediators in the modulation of host-microbe interaction during infections and to play beneficial or deleterious roles in host resistance (3). Several chronic bacterial infections, such as tuberculosis (4) and leprosy (5) promote the accumulation and preferential migration of Treg cells to target tissues, where these cells exert regulatory effects that compromise protective responses and favor bacterial persistence (6). During viral infections, the role of this cell subset appears to be different between acute and chronic infections and even to change during the same infection with the transition from acute to chronic stages. In this way, Treg cells have been shown to coordinate early protective immunity to mucosal Herpes Simplex Virus (7, 8) and pulmonary Respiratory Syncytial Virus (9, 10), and to sustain memory CD8+ T cell immunity to West Nile virus (11). In contrast, there is by far more evidence that Treg cells accumulate during certain viral infections and dampen adaptive immune responses, specially CD8+ T cell immunity, promoting virus establishment and infection chronicity (12, 13). Thus, Treg cells seem to exert a general beneficial role by limiting exuberant immune responses and the consequent excessive inflammation and immunopathology even at the expense of reducing viral control (12, 14, 15). Similar scenarios have been reported in the course of parasitic infections (16). During leishmaniasis (17) and malaria (18), Treg cells have been shown to limit the magnitude of effector responses, resulting in failure to adequately control infection (19–21). In contrast, these cells favor host resistance during infections with S. mansoni and T. gondii by restraining collateral tissue damage caused by vigorous anti-parasite immune responses (22–24). In addition, relative or absolute reduction in Treg cell numbers during acute infections with T. gondii (23, 25), L. monocitogenes (25), vaccinia virus (25) and LCMV clone Armstrong (26) supports the emergence of CD4+ and CD8+ T cell immunity. Therefore, the impact of Treg cells in the outcome of an infection is expected to be different depending on the pathogen, timing and affected tissues, while their manipulation may open up new avenues for therapeutic strategies.
Chagas disease (American Trypanosomiasis) is a life-threatening illness caused by the protozoan parasite T. cruzi (27). Last estimates calculated an infected population of about 6 million in endemic areas of Latin America and several hundred thousand worldwide, with more than 70 million people living at risk of infection and 40,000 new cases diagnosed per year (28). Host resistance to T. cruzi depends on both innate and adaptive immune responses which are triggered early during infection (29–31). Macrophages, dendritic cells, natural killer cells and B and T lymphocytes act in concert to control parasite replication but are not able to completely eradicate the pathogen (32). In particular, parasite-specific antibodies and CD8+ T cells together with a type I response with production of IFN-γ and TNF are critical for host resistance (32). Nevertheless, exuberant production of these inflammatory cytokines has been associated with tissue damage, immunopathology and disease severity in mice and humans (33–36), supporting the notion that regulatory responses greatly impact in the final outcome of T. cruzi infection. In this context, many studies aimed to understand the role of Treg cells during the progression of this parasitic infection, reporting often contradictory results. The frequency and functionality of Treg cells were shown to be increased in the peripheral blood of infected patients that presented less severe chronic disease (37–40), suggesting a beneficial role for this cell subset during human Chagas disease. On the other hand, experimental models reported protective (41, 42), limited (43, 44) and also deleterious (45) effects for Treg cells during T. cruzi infection. However, none of these studies addressed the kinetics or the phenotypical and functional features of the regulatory response, and more importantly, all of them targeted Treg cells by non-specific approaches. These technical limitations have delayed an accurate characterization of Treg cell responses during T. cruzi infection and, therefore, prevented any rational manipulation of this subset in order to modulate the outcome of the chronic disease.
In this manuscript, we took advantage of Foxp3-EGFP reporter mice to comprehensively determine the magnitude and quality of the Treg cell response triggered by T. cruzi infection. In addition, adoptive transfer experiments of in vitro differentiated Treg cells allowed us to establish the biological role of this subset in the regulation of protective immunity and parasite control.
Materials and Methods
Mice
Mice used for experiments were sex- and age-matched. C57BL/6 and BALB/c wild type mice were obtained from School of Veterinary, La Plata National University (La Plata, Argentina). CD45.1 C57BL/6 mice (B6.SJL-Ptprca Pepcb/BoyJ), Foxp3-EGFP reporter mice (B6.Cg-Foxp3tm2Tch/J), IL-6 deficient mice (B6.129S2-Il6tm1Kopf/J) and Caspase-1/11 deficient mice (B6N.129S2-Casp1tm1Flv/J) were obtained from The Jackson Laboratories (USA). IFNAR deficient mice (Ifnar1tm1Ag) were obtained from Pasteur Institute (Paris, France) (46). Animals were bred in the animal facility of the Facultad de Ciencias Químicas, Universidad Nacional de Córdoba, and housed under a 12 h: 12 h light-dark cycle with food and water ad libitum.
Parasites and Experimental Infection
Bloodstream trypomastigotes of the Tulahuén strain of T. cruzi were maintained in BALB/c mice by serial passages each 10–11 days. For experimental infection, 7–10 weeks-old mice were inoculated intraperitoneally with 0.2 ml PBS containing 5 × 10³ trypomastigotes. Alternatively, doses of 500 and 5 × 10⁴ trypomastigotes were used as indicated.
Live T. cruzi trypomastigotes (Tulahuén) were obtained from the extracellular medium of infected monolayers of Vero cells, as previously described (47).
Quantification of Parasite Numbers in Blood and Parasite Burden in Tissues
Parasitemia was monitored by counting the number of viable trypomastigotes in blood after lysis with a 0.87% ammonium chloride buffer. Abundance of T. cruzi satellite DNA in tissues was used to determine parasite burden. Genomic DNA was purified from 50 μg of tissue (spleen and liver) using TRIzol Reagent (Life Technologies) following manufacturer's instructions. Satellite DNA from T. cruzi (GenBank AY520036) was quantified by real time PCR using specific Custom Taqman Gene Expression Assay (Applied Biosystem). Primers and probes sequences were previously described by Piron et al (48). A sample was considered positive for T. cruzi target when CT < 45. Abundance of satellite DNA from T. cruzi was normalized to GAPDH abundance (Taqman Rodent GAPDH Control Reagent, Applied Biosystem), quantified through the comparative CT method and expressed as arbitrary units.
Cell Preparation, Purification, and Culture
Blood was collected using heparin as anticoagulant. Spleens, thymi, livers and mesenteric and inguinal lymph nodes were obtained and pressed through a tissue strainer to obtain cell suspensions. Bone marrow cells were isolated by flushing femurs and tibias with PBS 2% FBS. Liver infiltrating cells were obtained after 25 min centrifugation (600 g) in a 35 and 70% bilayer of Percoll (GE Healthcare) gradient. Erythrocytes in bone marrow, spleen, thymus and liver cell suspensions were lysed for 3 min in ammonium chloride-potassium phosphate buffer. Cell numbers were counted in Turk's solution using a Neubauer chamber.
CD4+ and CD8+ T cells were isolated from pooled splenic suspensions by magnetic negative selection using EasySep™ Mouse CD4+ or CD8+ T Cell Isolation Kits, respectively (StemCell Technologies). After surface staining, Treg, Tconv and naïve CD4+ T cells were further purified from CD4+ T cell suspensions by cell sorting with a FACSAria II (BD Biosciences) using the following gating strategy: Treg cells: CD4+ Foxp3-GFP+ CD25int/hi; Tconv cells: CD4+ Foxp3-GFP− CD25−/+; and naïve CD4+ T cells: CD4+ Foxp3-GFP− CD25− CD62Lhi CD44lo. Cells were cultured in RPMI 1640 medium (Gibco, Invitrogen) supplemented with 2 mM glutamine (Gibco, Invitrogen), 55 μM 2-ME (Gibco, Invitrogen), and 40 μg/ml gentamicin (Veinfar Laboratories) containing 10% heat inactivated FBS (Gibco or Natocor).
For in vitro Treg cell differentiation, naïve CD4+ T cells or total splenocytes were stimulated at a cell density of 2 × 10⁵/well during 3–4 days in 96-well cell culture plates coated with 2 μg/mL anti-CD3 (eBioscience) and 1 μg/mL anti-CD28 (BD Biosciences), in presence or absence of a Treg cell differentiation cocktail containing 100 U/mL mrIL-2 (RandD), 5 ng/mL rTGF-β1 (eBioscence) and 13.3 nM all trans-Retinoic Acid (Sigma). In the experiments aimed to evaluate the inhibition of Treg cell induction, live T. cruzi parasites were added in different ratios as described in the corresponding legend for figure.
Biochemical Determinations and Quantification of Cytokines in Plasma
Blood was centrifuged for 8 min at 3,000 rpm and plasma was collected. Plasma samples were sent to Biocon Laboratory (Córdoba, Argentina) for quantification of GOT, GPT, LDH and CPK by UV kinetic methods, and glucose by kinetic/colorimetric method in a Dimension RXL Siemens analyzer. Plasma levels of different cytokines were determined in our laboratory using LEGENDplex™ Multi-Analyte Flow Assay Kit (Biolegend) for Mouse Th Cytokine and Inflammation Panels according to manufacturer's instructions.
Antibodies and Flow Cytometry
For surface staining, cell suspensions were incubated with fluorochrome labeled-antibodies in PBS 2% FBS for 20 min at 4°C. Flow cytometry and/or cell sorting were performed with a combination of the following antibodies: anti-CD4 APC, APC-eFluor-780 or PerCP-eFluor 710 (all clone GK1.5), anti-CD25 PE-Cy7 (P61.5), anti-CD3 PerCP-Cy5.5 (145-2C11), anti-CD8a FITC, PE, PE-Cy7 or PerCP-Cy5.5 (53-6.7), anti-CCR7 PerCP-Cy5.5 (4B2), anti-CD103 PE (2-E7), anti-CD127 PerCP-eFluor-710 (eBioSB/199), anti-CD39 eFluor-660 (24DMS1), anti-CD44 APC-Cy7 (IM7), anti-CD45.2 PerCP-Cy5.5 (104), anti-CD62L PerCP-Cy5.5 (MEL-14), anti-CD73 biotin (eBioTY/11-8), anti-CTLA-4 PE (UC10.4B9), anti-CXCR3 PE (CXCR3-173), anti-FR4 PE (eBio12a5), anti-GARP APC (YGIC86), anti-OX40 APC (OX-86) and anti-PD-1 PE (RMP1-30) from eBioscience; anti-CD4 AlexaFluor700 (GK1.5), anti-CD45.1 APC-Cy7 (A20), anti-GITR PE-Cy7 (DTA-1), anti-LAG-3 PerCP-Cy5.5 (C9B7W), anti-KLRG1 PE (2F1/KLRG) and anti-LAP PE (TW7-20B9) from Biolegend; and anti-CD127 biotin (B12-1) from BD Biosciences. To detect biotinilated antibodies, Streptavidin APC (Biolegend) or PerCP-Cy5.5 (eBioscience) were used. To identify T. cruzi specific CD8+ T cells, cell suspensions were incubated with an H-2Kb T. cruzi trans-sialidase amino acids 569-576 ANYKFTLV (TSKB20) APC-labeled Tetramer (NIH Tetramer Core Facility) for 20 min at 4°C before further surface staining with additional antibodies. Blood was directly incubated with the indicated antibodies and erythrocytes were lysed with a 0.87% NH4Cl buffer previously to acquisition. To assess apoptosis, cells were stained for Annexin V PE (Biolegend) and 7-AAD (BD Biosciences) according to the manufacturer's specifications.
For detection of transcription factors, cells were first stained on surface, washed and then fixed, permeabilized and stained with Foxp3/Transcription Factor Staining Buffers (eBioscience) according to eBioscience One-step protocol for intracellular (nuclear) proteins. The following antibodies were used for intracellular staining: anti-Foxp3 PE, PerCP-Cy5.5 or APC (FJK-16s), anti-T-bet PerCP-Cy5.5 or PE-Cy7 (eBio4B10), and anti-Ki-67 APC (SolA15) from eBioscience.
For intracellular cytokine staining, 2 × 10⁶ cells per well were cultured in 200 μL supplemented RPMI 1640 medium and stimulated during 2–5 h at 37°C with 50 ng/mL PMA and 1 μg/mL ionomycin (Sigma-Aldrich) in the presence of Brefeldin A and/or Monensin (eBioscience). After surface staining, cells were fixed and permeabilized with Intracellular Fixation & Permeabilization Buffer Set (eBioscience) or BD Cytofix/Cytoperm and Perm/Wash (BD Biosciences) following manufacturers' indications. Cells were then labeled with anti-IL-10 APC (JES5-16E3), anti-IFN-γ APC or PE (XMG1.2) and anti-IL-17A PE (eBio17B7) from eBioscience; anti-IL-10 PE (JES5-16B3) and anti-TNF PerCP-Cy5.5 (MP6-XT22) from Biolegend.
All samples were acquired on a FACSCanto II (BD Biosciences) and data were analyzed with FlowJo software.
Adoptive Cell Transfer
For in vivo pTreg cells induction experiments, Tconv cells were purified from non-infected Foxp3-EGFP CD45.2 donors as described above. Two millions cells were then intravenously injected in the retro-orbital sinus of CD45.1 recipient mice, which were simultaneously infected with the usual dose of T. cruzi. Non-infected and/or non-transferred mice were used as controls. Conversion of injected cells (Foxp3-GFP−) into Treg cells (Foxp3-GFP+) was assessed by flow cytometry in different organs 19 days after treatment.
To assess the biological relevance of reduced Treg cells frequency, 1 × 10⁶ in vitro differentiated Treg cells generated from Foxp3-EGFP mice were intravenously transferred into CD45.1 recipient mice at 11 days post-infection (dpi). The effect of Treg cell adoptive transfer was evaluated 7 days later.
RNAseq
Treg cells were purified as described above from the spleens of non-infected and 22-days infected Foxp3-EGFP mice and immediately lysed with QIAzol reagent (Qiagen). Total RNA was extracted by using the RNeasy Micro Kit (Qiagen) and its quality was assessed on a 2100 Bioanalyzer (Agilent Technologies). RNA-seq libraries were then prepared according to the TruSeq Stranded Total RNA Sample protocol (Illumina). Quality controls of the libraries were performed by standard methods, including quantification by Qubit (Thermo Fisher Scientific) and assessment of size distribution using a 2100 Bioanalyzer. Samples were indexed and sequenced on an Illumina HiSeq 3000 (paired-end reads of 150 bp). Bioinformatic analysis of sequenced Reads was performed as described elsewhere (49). P-values <0.1 (adjusted for multiple testing by Benjamini–Hochberg procedure) were considered as the cutoff for significantly differentially expressed genes. Gene Set Enrichment Analyses (GSEA) for Th1, Th2, and Th17 signature were performed using specific gene sets selected from several publications as indicated in Supplementary Table 1 and depicted in heat maps of Figure 4E. NCBI Sequence Read Archive accession code: SRP145339.
Statistics
Statistical significance of mean values comparisons was analyzed by t-test, Mann Whitney test, One-way ANOVA or Kruskal-Wallis test as indicated. According to the absolute values of r, the Spearman correlation was interpreted as strong (r = 0.7–0.9), good (r = 0.50–0.70), moderate (r = 0.30–0.50), and poor (r < 0.30) (50–52). Statistical analysis was performed using GraphPad Prism 7.0 software. P-values ≤0.05 were considered significant.
Results
Treg Cell Frequency Is Decreased During the Progression of T. cruzi Infection
As an initial step to characterize Treg cell responses, we evaluated how T. cruzi infection affected the frequency and absolute numbers of Treg cells and other immune cell subsets. Using Foxp3 reporter mice, we determined that acute T. cruzi infection resulted in a significant decrease in the percentage of Treg cells (CD4+ Foxp3-GFP+) in the spleen (Figure 1A). This decrease in the frequency of splenic Treg cells was statistically significant after 12 days post-infection (dpi) and remained low even at the end of the acute phase (76 dpi; Figure 1B, left panel). Of note, the absolute numbers of Treg cells remained unchanged or were transiently increased at low extent while the numbers of CD4+ Foxp3-GFP (Tconv) cells and total spleen leukocytes were augmented by several orders of magnitude (Figure 1B, middle panel). Consequently, the ratios between the numbers of Treg cells and Tconv cells or total cells were significantly decreased along the infection (Figure 1B, right panel). A similar picture was observed in secondary lymphoid organs, such as inguinal lymph nodes (iLN) (Figure 1C) as well as in the liver, a target tissue with intense parasite replication and immune cell infiltration during the acute phase of T. cruzi infection (53) (Figure 1D). This reduction in the frequency of Treg cells and/or the ratio of Treg cell numbers to Tconv and total cell numbers were also detected in blood and bone marrow (Supplementary Figures 1A,B). Altogether, these results indicate that, in contrast to most chronic infections (6), Treg cells do not significantly accumulate in secondary lymphoid organs or liver during T. cruzi infection.
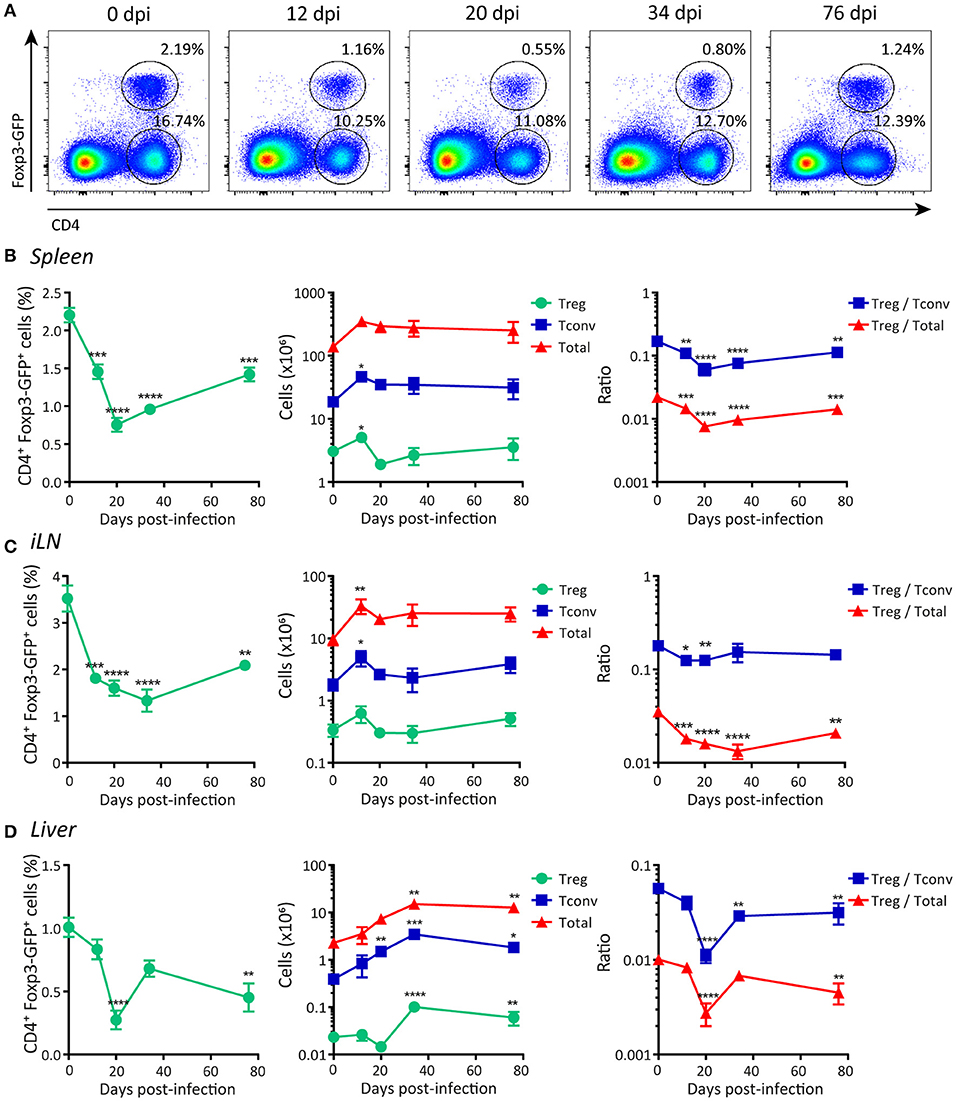
Figure 1. Frequency of Foxp3+ regulatory T cells is reduced in peripheral organs during acute T. cruzi infection. (A) Flow cytometry representative dot plots showing Foxp3-GFP expression and CD4 staining in the spleen of T. cruzi infected Foxp3-EGFP mice at different days post-infection (dpi). (B–D) Graphs showing CD4+ Foxp3-GFP+ Treg cell frequencies (left panel), absolute numbers of Treg cells, CD4+ Foxp3-GFP− (Tconv) cells and total leukocytes (middle panel), and the ratios of Treg cells to Tconv and to total cells in the spleens (B), inguinal lymph nodes (C), and liver infiltrating leucocytes (D) of T. cruzi infected Foxp3-EGFP mice at different dpi. Data are presented as mean ± SEM, n = 3–11 animals per dpi. Data are representative of at least three independent experiments. P-values were calculated by One way ANOVA with Dunnett's multiple comparisons test or Kruskal-Wallis with Dunn's correction (Tconv and total cells absolute numbers in liver only). *P ≤ 0.05, **P ≤ 0.01, ***P ≤ 0.001 and ****P ≤ 0.0001.
Next, we evaluated Treg cells frequencies and numbers in organs associated with the development of this subset, e.g., thymus and gut-associated mesenteric lymph nodes (mLN) (54). We determined that the percentage of Treg cells as well as the ratio between the numbers of this population and other cell subsets in the thymus were significantly increased during T. cruzi infection (Supplementary Figure 1C, left and right panels), likely as consequence of conserved Treg cells numbers together with a marked reduction in the number of total thymocytes (Supplementary Figure 1C, middle panel). In mLN, the numbers of Treg cells showed an initial oscillation (increase followed by decrease) after infection while the frequency and the ratio of Treg cells to Tconv numbers exhibited an early increase, but all these parameters remained unaltered afterwards (Supplementary Figure 1D).
The Frequency of Treg Cells Is Negatively Correlated With Markers of Infection Progression and the Development of Effector Immune Responses
We next aimed at studying whether the changes in the frequency of Treg cells during T. cruzi infection showed any correlation with disease progression and/or the magnitude of effector immune responses. As markers of progression in the infection by T. cruzi we evaluated parasitemia and the levels of different biochemical parameters used to assess general health and tissue damage. As depicted in Figure 2A, parasite numbers in blood were low but detectable at 12 dpi, peaked around 20 dpi, diminished by 34 dpi and became undetectable later on. Similar kinetics was observed when measuring the activity of enzymes that reflect tissue damage (i.e., GPT, LDH, GOT, and CPK; Figure 2A, middle panel; Supplementary Figure 2A). In contrast, the concentration of plasma glucose, whose decrease is generally associated with acute infection (55), was reduced alongside the progression of infection, showing the lowest level around 20 dpi and reaching normal levels afterwards (Figure 2A, right panel). Remarkably, changes in the levels of all these parameters showed statistically significant strong, good or moderate correlations with the frequencies of Treg cells in the spleen (Figure 2B; Supplementary Figure 2B). These correlations were direct for glucose concentration and inverse for parasitemia and enzymatic activity in plasma.
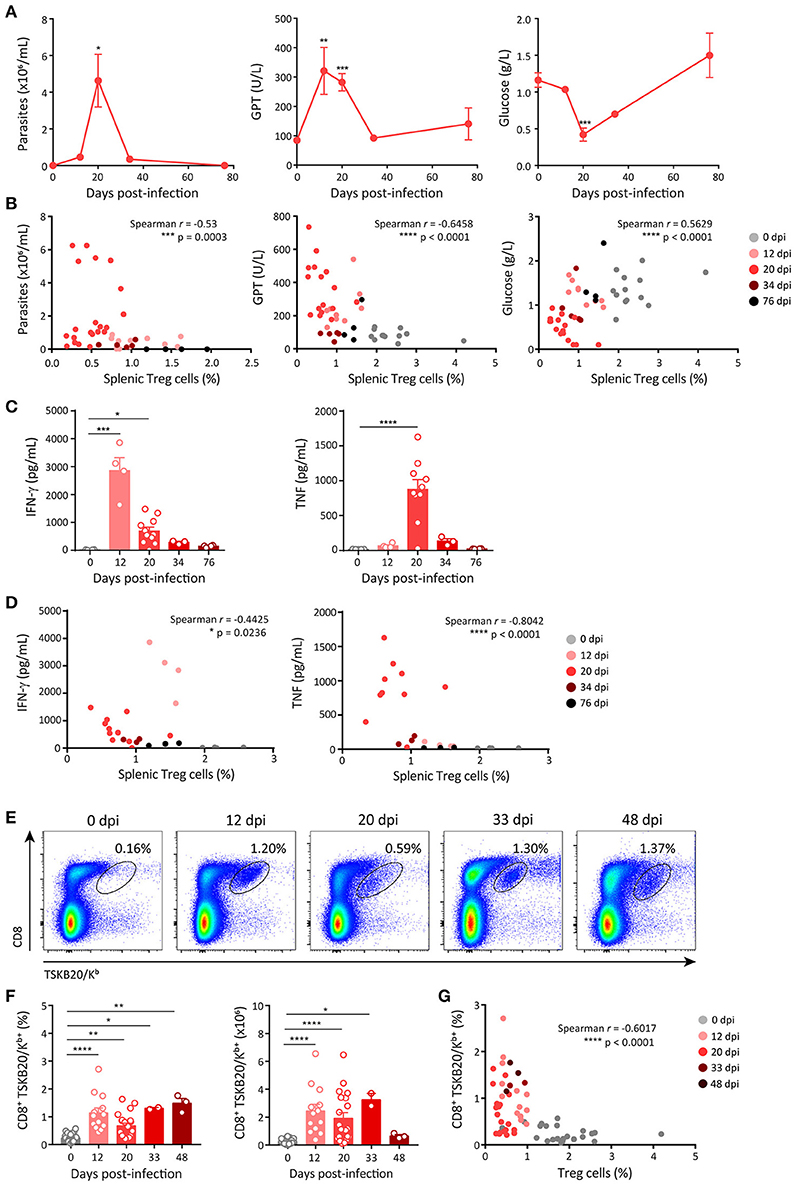
Figure 2. Frequency of Treg cells inversely correlates with markers of acute disease progression and the emergence of effector immune responses. (A) Parasitemia (left panel) in blood, activity of glutamate-pyruvate transaminase (GPT) (middle panel) and glucose concentration (right panel) in plasma of T. cruzi infected Foxp3-EGFP mice at different dpi. (B) Scatter plots showing the relation between splenic Treg cell frequencies and each of the parameters shown in (A). (C) Concentration of effector cytokines in plasma of T. cruzi infected Foxp3-EGFP mice at different dpi. (D) Scatter plots showing the relation between Treg cell frequencies in the spleen and plasma level of effector cytokines. (E) Representative dot plots for CD8 and TSKB20/Kb staining in the spleen of T. cruzi infected Foxp3-EGFP mice at different dpi. (F) Percentage (left) and absolute numbers (right) of parasite-specific CD8+ T cells in the spleen T. cruzi infected Foxp3-EGFP mice at different dpi. (G) Scatter plots showing the relation between frequencies of Treg cells and parasite-specific CD8+ T cells in the spleen of mice shown in (F). In (A) data are presented as mean ± SEM of n = 3–11 animals. In (B–D,F,G) each circle or dot represents one animal. In (C,F) the bars show the mean + SEM of each parameter. Spearman r correlation coefficient and significance of the correlation are indicated inside the corresponding graphs. Data were pooled from 1 to 6 experiments according to the dpi and the determination. P-values were calculated by One way ANOVA with Dunnett's multiple comparisons test in (A) and Kruskal-Wallis with Dunn's correction in (C,F). *P ≤ 0.05, **P ≤ 0.01, ***P ≤ 0.001 and ****P ≤ 0.0001.
To assess the effector immune response, we quantified the plasma concentration of effector cytokines known to be protective during T. cruzi infection, such as IFN-γ and TNF (32). The concentration of IFN-γ showed a marked increase by 12 dpi and diminished later on, while the kinetics of TNF production was slower, showing the peak of plasma concentration at 20 dpi (Figure 2C). In addition, we quantified other effector cytokines, such as IL-6, IL-1β, and IL-2. The concentration of IL-6 was significantly increased by 12 dpi, peaked at 20 dpi and decreased afterwards whereas the concentrations of IL-1β and IL-2 remained unchanged along the infection (Supplementary Figure 2C). The concentrations of IFN-γ, TNF and IL-6, but not those of IL-1β and IL-2, showed significant strong, good or moderate inverse correlations with the frequency of Treg cells in spleen (Figure 2D; Supplementary Figure 2D). We also evaluated the presence of parasite-specific CD8+ T cell immunity as a component of the cellular effector immune response known to be critical for parasite control (31). CD8+ T cells specific for the immunodominant T. cruzi peptide TSKB20 were identified in the spleen of T. cruzi infected mice using tetramers (Figure 2E). We found that the frequency and absolute numbers of TSKB20-specific CD8+ T cells increased between 12 and 48 dpi (Figures 2E,F). Similar to effector cytokines, the frequency of TSKB20-specific CD8+ T cells showed a good inverse correlation with the frequency of Treg cells (Figure 2G).
Limited Expansion and Reduced Accrual of Peripheral Treg Cells During Acute T. cruzi Infection
In steady state conditions, the size of the Treg cell population is maintained by a dynamic process, through a balance among development, proliferation and apoptosis (56). During infections, these events may be altered leading to the accumulation, constriction or dysfunction of Treg cells and consequently, modulating the effector immune response and the host-microbe interaction (57). In this context, we aimed to evaluate whether the reduction of Treg cell frequency during T. cruzi infection was a consequence of alterations in the mechanisms that sustain Treg cell homeostasis.
We first evaluated the proliferation of splenic Treg cells, Tconv and total leukocytes along T. cruzi infection by determining ex vivo the expression of the proliferation marker Ki-67. As depicted in the histograms in Figure 3A, the frequency of Treg cells expressing Ki-67 showed a moderate increase around 20–34 dpi that persisted at least until 76 dpi. In contrast, the frequencies of Ki-67+ Tconv and total cells were markedly augmented along the infection with a peak at 20 dpi, returning to the level of non-infected mice by 76 dpi. Thus, Treg cells showed a significantly lower proliferation rate than Tconv and total cells (Figure 3B). These differences in proliferation may account for the reduced frequency of Treg cells during the early acute phase of T. cruzi infection. Next, we evaluated whether differential cell death within each cell subset may also be involved in Treg cell frequency reduction during T. cruzi infection. Determination of the frequency of apoptotic cells by Annexin V and 7-AAD staining, and calculation of the apoptosis rate, revealed that T. cruzi infection increased cell death particularly within the Tconv population (Figures 3C,D), as previously reported (58). Therefore, an increased cell death within Treg cells was ruled out as a mechanism underlying the decrease in the frequency of this cell subset during T. cruzi infection.
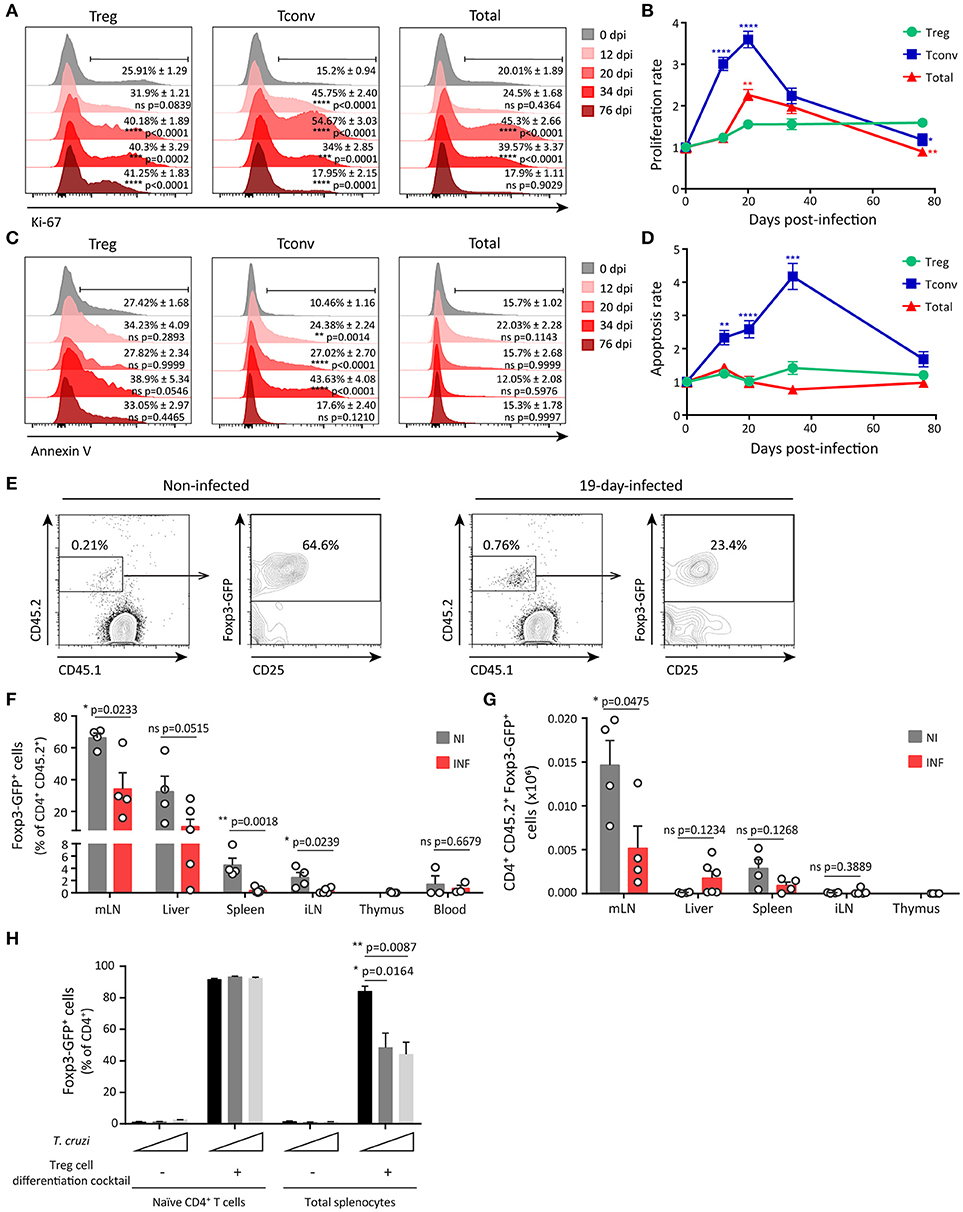
Figure 3. Limited expansion and reduced peripheral differentiation of Treg cells during acute T. cruzi infection. (A) Histograms for Ki-67 expression in Treg (CD4+ Foxp3+), Tconv (CD4+ Foxp3−) and total cells from the spleen of Foxp3-EGFP mice infected with T. cruzi at different dpi. Percentage of positive cells mean ± SEM (n = 3–6 animals) and p-values are indicated for each dpi in comparison to 0 dpi. (B) Proliferation rate of cell populations at different dpi calculated as the relation between % of Ki-67+ cells at 0 dpi and the other time points according to (A). (C) Histograms for Annexin V staining in 7-AAD− gated Treg, Tconv and total cells from the spleen of T. cruzi infected Foxp3-EGFP mice at different dpi. Percentage of positive cells mean ± SEM (n = 3–6 animals) and p-values are indicated for each dpi. (D) Apoptosis rate of cell populations at different dpi calculated as the relation between % of Annexin V+ cells at 0 dpi and the other time points according to (C). In (B,D) statistics were performed by One Way ANOVA comparing Tconv and total cells rates to Treg cells rate at each dpi (Sidak's multiple comparisons test). *P ≤ 0.05, **P ≤ 0.01, ***P ≤ 0.001, ****P ≤ 0.0001 and ns = not significant. (E–H) Tconv cells (CD4+ CD25− Foxp3-GFP−) from non-infected Foxp3-EGFP CD45.2 donors were transferred into CD45.1 recipient mice, which were simultaneously infected with T. cruzi. Nineteen days after transfer, conversion of transferred cells (GFP-) into Treg cells (GFP+) was assessed in different organs. Representative dot plots showing donor and host CD4+ cells according to CD45.2 and CD45.1 staining and Foxp3-GFP expression in CD45.2+ CD4+ donor cells in mLN from non-infected (NI) or infected (INF) hosts (E). Bar graphs depicting percentage (F) and absolute numbers (G) of Treg cells within the population of transferred cells in different organs. Each circle represents one animal. Data were pooled from two independent experiments. P-values were calculated by unpaired t-test. (H) Frequency of Treg cells (GFP+) determined within the CD4+ gate in cultures of purified naïve CD4+ T cells or total splenocytes stimulated with coated anti-CD3 and anti-CD28 in the presence or absence of the Treg cell differentiation cocktail and live parasites (at a cell:parasite ratio of 1:1 and 2:1) for 3 days. Data were pooled from two independent experiments with two technical replicates. P-values were calculated by unpaired t-test.
We next investigated whether infection with T. cruzi restrained Treg cell development and consequently, reduced Treg cell frequency in the periphery. Considering that the numbers of Treg cells are conserved in the thymus of infected mice (Supplementary Figure 1C), we speculated that thymic Treg cell development was not significantly altered during T. cruzi infection. Then, we focused on the development of peripheral Treg (pTreg) cells through an in vivo approach in order to evidence alterations triggered by T. cruzi infection. To this end, CD25− GFP− CD4+ cells were purified from the spleen of non-infected CD45.2+ Foxp3-GFP reporter mice and injected into CD45.1 WT hosts that were immediately infected. Adoptively transferred non-infected hosts were examined in parallel and used as controls. Twenty days after injection, transferred cells were identified by CD45.2 expression within different organs and the frequency of pTreg was determined according to the up-regulation of Foxp3 and CD25 expression. As illustrated in Figure 3E, mLN from non-infected and infected hosts contained a small percentage of injected cells. A high percentage (around 60%) of the injected cells within mLN from non-infected mice consisted of pTreg cells while most of the exogenous cells in mLN from infected mice were Tconv. The significant reduction in the frequency of pTreg cells originated from the injected Tconv during T. cruzi infection was observed not only in mLN that have an environment prone for pTreg cell differentiation, but also in the spleen and iLN (Figure 3F). To confirm that induction of pTreg cells was inhibited during T. cruzi infection, we calculated the absolute numbers of newly differentiated pTreg cells in the different organs. In agreement with the frequency data, the highest absolute numbers of induced pTreg cells were found in mLN in comparison to other organs (Figure 3G). Of note, the numbers of pTreg cells were significantly reduced in mLN from infected mice in comparison to non-infected controls but not in other organs. These data further support the notion that differentiation of pTreg cells is reduced during T. cruzi infection.
In order to identify mediators involved in the relative decrease of Treg cells during T. cruzi infection, we focused on particular inflammatory cytokines that are increased in the course of this parasitic infection and/or have been reported to modulate peripheral Treg cell proliferation and differentiation. Among these mediators, we selected cytokines, such as IL-6 and IL-1β that are produced during T. cruzi infection [Supplementary Figure 2C and references (59, 60)] and have been reported to restrain pTreg cell development by favoring a Th17 fate (61, 62). Also, type I interferons increase early during T. cruzi infection (63) and have been shown to limit regulatory responses by reducing Treg cell proliferation (26) and peripheral induction (64) in viral infection settings. We determined that mice with deficient production of IL-6 due to deletion of the Il6 gene (Il6−/−) or reduced IL-1β/IL-18 due to the lack of Caspase1/11 (Casp1/11−/−) exhibited a similar decrease in Treg cell frequency at 20 dpi when compared to WT mice. Similarly, infected mice deficient in IFNAR, the specific receptor for type I IFNs, also showed a relative reduction of Treg cell responses (Supplementary Figure 3A). These results highlight that IL-6, IL-1β, and type I IFN signaling were not responsible of the relative Treg cell reduction triggered by T. cruzi infection.
As the frequency of Treg cells inversely correlated with parasitemia (Figure 2B), we next speculated that parasites could influence the size of the Treg cell pool during T. cruzi infection. To gain further insights in this direction, we evaluated whether changes in parasite levels as consequence of inoculation with different parasite doses have any impact in the frequency of Treg cells in periphery. We determined that 10-fold changes in the parasite dose used for infection resulted in significant dose-dependent differences in parasitemia at 11 dpi but not at 20 dpi, when parasitemia reached a maximum that was independent on the initial infective dose (Supplementary Figure 3B). Of note, the frequency of splenic Treg cells at 11 dpi was inversely associated with parasitemia and therefore remained unchanged in mice infected with the lowest dose, that showed barely detectable parasites in blood, but were significantly and dose-dependently reduced in mice infected with the intermediate and highest infective doses. These differences in Treg cell frequency were no longer observed at 20 dpi, when all mouse groups showed the same parasitemia (Supplementary Figure 3C). In this context, we designed in vitro experiments aimed to evaluate whether T. cruzi parasites are capable of inhibiting pTreg cell induction. As shown in Figure 3H, most naïve CD4+ T cells differentiated into iTreg cells when activated in the presence of a Treg cell differentiation cocktail containing TFG-β, IL-2, and all trans retinoic acid (atRA). Of note, live trypomastigotes were unable to inhibit this differentiation. Similarly, more than 90% of the CD4+ T cells became iTreg cells when total splenocytes were activated in the presence of the Treg cell differentiation cocktail. In contrast to the lack of effect on purified CD4+ T cells, parasites significantly inhibited induction of iTreg cells in cultures of total splenocytes. These results strongly suggest that T. cruzi itself is able to actively inhibit Treg cell induction by an indirect mechanism that may depend on accessory cells present within the splenocytes rather than by a direct effect on naïve CD4+ T cells.
Phenotypical and Transcriptional Characterization of Treg Cells During T. cruzi Infection Underscore a Specialization in the Regulation of Type 1 Effector Responses
The relative deficiency in the magnitude of Treg cell responses during the course of T. cruzi infection may be compensated by the activation and enhancement of the immunosuppressive function of this subset as reported previously (65–67). To address this, we performed a comprehensive evaluation of Treg cell phenotype by flow cytometry, determining the expression of proteins associated with Treg cell activation and suppressive function, such as CD25, CTLA-4, GITR, CD39, CD73, LAG-3, OX40, PD-1, FR4, GARP, TGF-β, and IL-10 together with molecules involved in migration and effector/memory subset classification like CD103, CD127, CCR7, CD44, and CD62L. We also assessed markers of Th1 specialization including T-bet, CXCR3 and IFN-γ in these cells. In order to broadly interpret the phenotypic changes occurring in Treg cells during the progression of T. cruzi infection, we focused on changes occuring in spleen and performed multivariate analysis of all the markers evaluated. Principal component analysis (PCA) defined two principal components (PC) that accounted for around 70% of the total variance and allowed to evidence the phenotypic changes suffered by Treg cells along the different dpi (Figure 4A, left pannel). The variables included in PC1 and PC2 as well as the direction of their changes are also depicted (Figure 4A, right pannel). Interpretation of the PCA plots indicated that the phenotype of Treg cells changed progressively from 0 dpi (non-infected) until 20 dpi (maximal difference) by modifications in the variables included mainly in PC1 and at a lower extent in PC2. This analysis also established that Treg cells at 12 and 34 dpi showed a similar phenotype that is intermediate between those of cells from 0 and 20 dpi while Treg cells at 76 dpi showed features more related to the phenotype of Treg cells from non-infected mice (0 dpi).
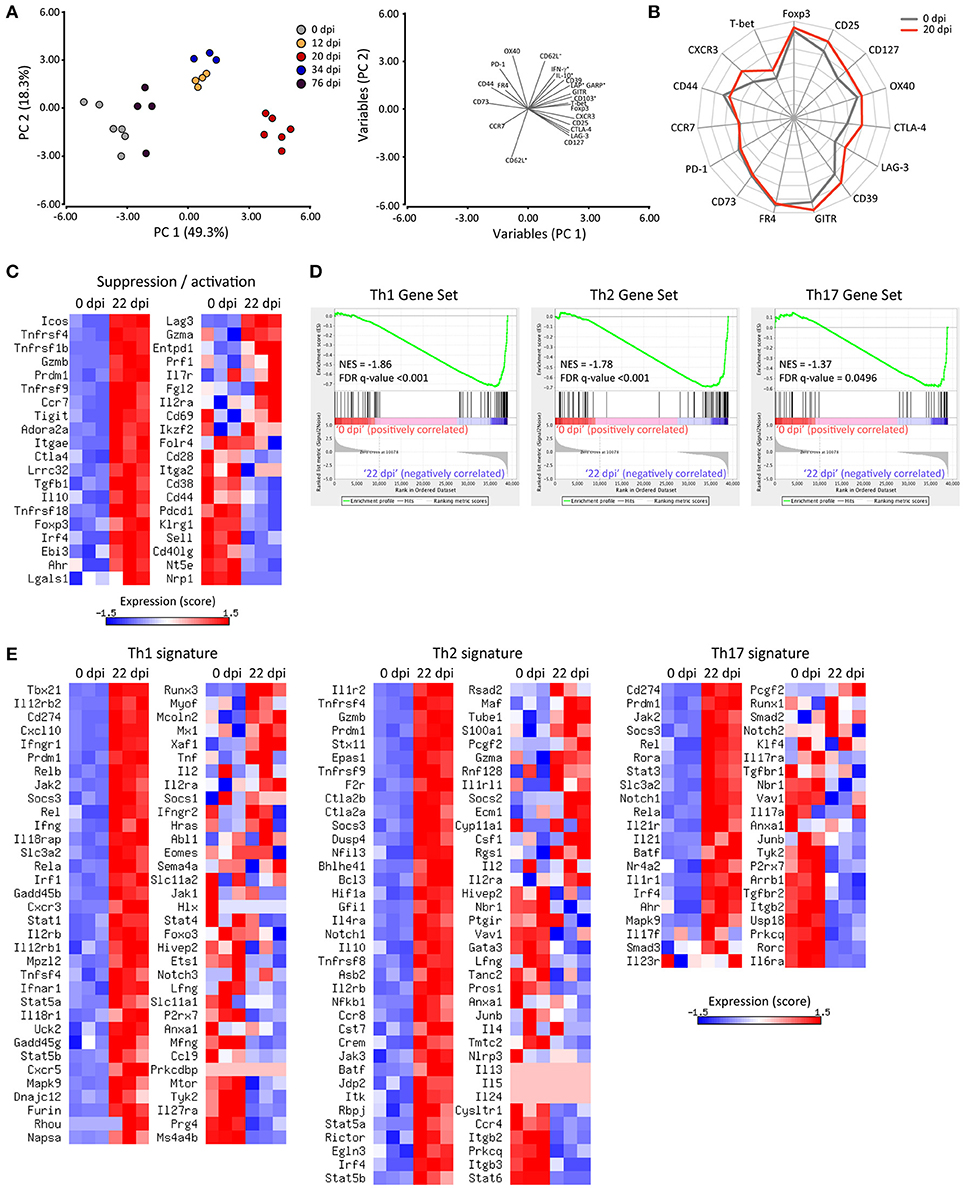
Figure 4. Treg cells show an activated phenotype and acquire a Th1-like profile during T. cruzi infection. (A) Plots of principal component analysis (PCA) for surface and intracellular markers of Treg cells from the spleens of Foxp3-EGFP mice at the indicated dpi (left panel) and the variables included in PC1 and PC2 (right panel). Each circle represents one animal. (B) Star plot displaying the expression of the indicated markers in Treg cells from non-infected (0 dpi, gray line) or infected (20 dpi, red line) mice. Each spoke of the star represents the geometric mean of fluorescence intensity for the indicated marker in a log2 scale from 1 to 16,384. The data length of a spoke is proportional to the MFI of expression of that marker in the corresponding sample. (C) Heat maps for the normalized expression scores (row mean values of 0 and variance of 1) of genes encoding suppression and/or activation markers in Treg cells (CD4+ CD25+ Foxp3-GFP+) purified from the spleen of non-infected (0 dpi) or 22-days-infected (22 dpi) Foxp3-EGFP mice. (D) Gene set enrichment analysis of the Treg cell transcriptome for Th1, Th2 and Th17 signatures using selected gene sets. (E) Heat maps for the normalized expression scores (row mean values of 0 and variance of 1) of the selected genes used in (D). RNAseq data are from one experiment with three biological replicates. The PCA plot, star plot and heat maps were created using InfoStat software, Microsoft Excel spreadsheet and Matrix2png online tool, respectively.
The kinetics of expression of each marker highlighted that Treg cells from T. cruzi infected mice exhibited phenotypic changes as early as 12 dpi, with a maximum between 20 and 34 dpi (Supplementary Figure 4A). Of note, Treg cells from 20-days infected mice showed an evident activated phenotype as demonstrated by the upregulation of activation and memory markers, such as Foxp3, CD25, OX40, CD103, and CD127 in comparison to Treg cells from non-infected mice (68). In addition, Treg cells at 20 dpi showed increased expression of molecules associated with their suppressive function including CTLA-4, GITR, CD39, and LAG-3 but not CD73, PD-1, and FR4. We also established that Treg cells increased their capacity to produce regulatory cytokines, such as TGF-β (as indicated by co-expression of GARP and LAP) and IL-10 (Supplementary Figure 4B) after 20 days of infection. Finally, we determined that Treg cells at 20 dpi upregulated CXCR3 and slightly T-bet, and increased IFN-γ production in comparison to counterparts from non-infected mice (0 dpi; Supplementary Figures 4C,D). Remarkably, T-bet and CXCR3 expression levels in Treg cells from 20 dpi were comparable and higher than those observed in Tconv cells at the same time point, respectively (Supplementary Figure 4C). The expression of several markers studied were represented in a star plot that allowed to evidence differences in the phenotypic profile of Treg cells at 0 and 20 dpi, showing that T. cruzi infection induced the up-regulation of activation and Th1-associated markers as well as immunosuppressive mediators (Figure 4B).
In order to determine the global impact of T. cruzi infection on the transcriptional program of Treg cells, we compared by RNAseq the gene expression profiles of Treg cells purified from the spleen at 0 and 20 dpi. A total of 5,175 genes were differentially expressed in Treg cells as a consequence of T. cruzi infection (data not shown). As illustrated by the heat maps in Figure 4C, Treg cells from infected mice exhibited a global increase in the levels of many transcripts encoding activation markers and suppressive mediators. In addition to those noticed by flow cytometry (CD25, CD127, CD103, GITR, CTLA-4, TGF-β, and IL-10 among others), we also detected an up-regulation of genes encoding ICOS, Granzyme B, CD137, TIGIT, Adenosin A2a receptor, EBI3, Galectin-1, among others. In agreement with their phenotypic profile, Treg cells from infected mice showed reduced amounts of transcripts encoding CD44, PD-1, CD62L, and CD73. Of note, Treg cells from infected mice showed augmented levels in the expression of Blimp-1 and IRF4, transcription factors that drive effector Treg cell differentiation (67). Altogether, this transcriptional profile reflected a clear activation of Treg cells along T. cruzi infection. Next, we aimed to determine whether Treg cells from infected mice exhibit programs that denote any functional specialization (69). To this end, we performed Gene Set Enrichment Analysis of the Treg cell transcriptome for Th1, Th2, and Th17 signatures. As shown in the enrichment plots, the transcriptome of Treg cells from infected mice are significantly enriched in the Th1, Th2, and Th17 gene sets (Figure 4D). Interestingly, Treg cells from T. cruzi infected mice up-regulated most of the genes classically associated with a Th1 specialization including Tbx21, Ifng, and Cxcr3 and also the two subunits of the IL-12 receptor (Il12rb2 and Il12rb1), Stat1, Ifngr1, and Cxcl10 while they down-regulated Il27ra (Figure 4E). Of note, Treg cells from infected mice showed increased levels of some transcripts associated with a Th2 signature, such as Il1r2, Il4ra, Il10, and Irf4 but not of other prototypical Th2 genes, such as Gata3, Il4, Il5, or Il13. Similarly, this cell subset showed increased expression of certain genes associated with a Th17 fate like Rora, Stat3, Il21r, and Ahr but not of others tightly linked to Th17 cells like Rorc and Il17a.
Adoptive Transfer of Treg Cells Suppresses Anti-Parasite Effector Response and Diminishes Parasite Control During T. cruzi Infection
Once established the features acquired by Treg cells after T. cruzi infection, we aimed at evaluating the biological role of this cell subset in the progression of the infection. Considering the results from Figure 2, we were particularly interested in addressing the relevance of the limited Treg cell response for the induction/maintenance of effector responses and immunopathology. To this end, we designed an experiment in which Treg cell numbers were increased by the injection of Treg cells differentiated in vitro (iTreg cells). iTreg cells were obtained by sorting Foxp3-GFP+ cells from cultures in which CD4+ T cells obtained from Foxp3-EGFP reporter mice were stimulated with anti-CD3 and anti-CD28 in the presence of the Treg cell differentiation cocktail (Supplementary Figure 5A). In agreement with data showing that this cocktail induced stable human iTreg cells (70), we determined that iTreg cells generated in these conditions showed immunosuppressive capacity in vitro (Supplementary Figure 5B), and failed to produce effector cytokines, such as IFN-γ and IL-17 (Supplementary Figure 5C).
As schematized in Figure 5A, adoptive transfer experiments were designed to inject iTreg cells into infected hosts at 11 dpi, the time point in which the reduction of Treg cell frequency becomes significant. Remarkably, infected hosts that received iTreg cells showed significantly augmented levels of parasites in blood and tissues in comparison to control counterparts at 18 dpi (Figure 5B). In addition, and likely as consequence of the uncontrolled parasite replication, mice injected with iTreg cells presented reduced blood glucose concentration but biochemical markers of tissue damage were not affected (Figure 5C and data not shown). In order to establish the causes of the reduced parasite control, we evaluated the magnitude of the effector immune response. Adoptive transfer of iTreg cells significantly diminished the frequency of parasite-specific CD8+ T cells in spleen and liver of infected mice (Figure 5D). Furthermore, the absolute numbers of parasite-specific CD8+ T cells and total CD8+ and CD4+ T cells were also reduced after the injection of iTreg cells in infected hosts (Figure 5E). Altogether, these results indicate that increasing Treg cell numbers during T. cruzi infection severely compromises the magnitude of protective immune responses including parasite-specific CD8+ T cell immunity and consequently, limits the control of parasite replication and host resistance to the infection.
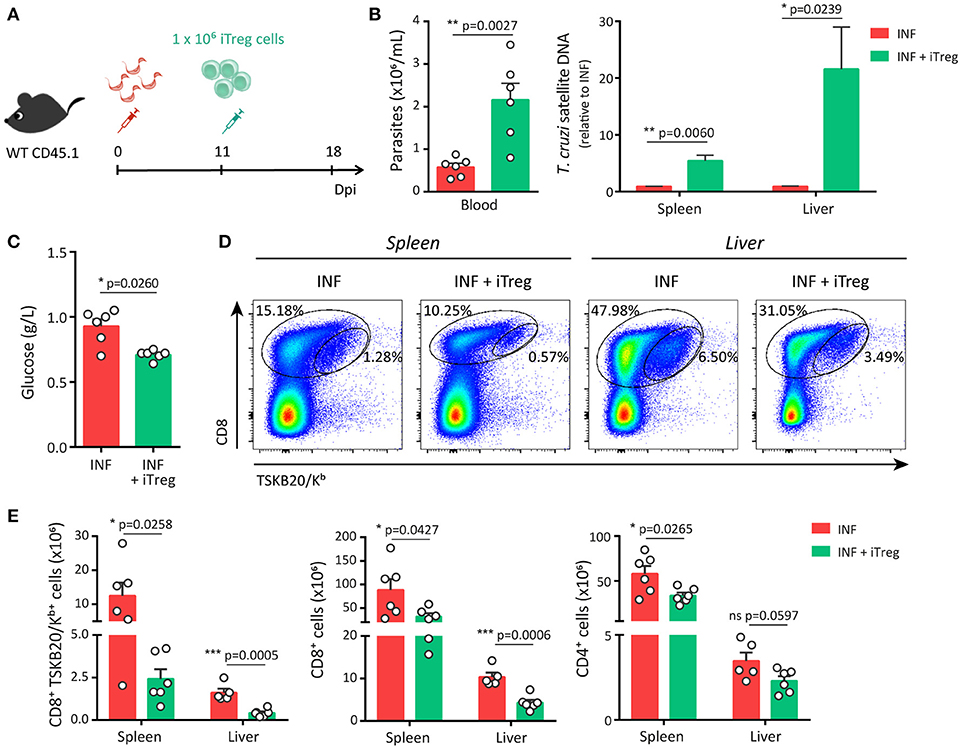
Figure 5. Adoptive transfer of Treg cells restricts the development of a robust parasite-specific CD8+ T cell response during acute T. cruzi infection. (A) CD45.1 WT mice were infected with T. cruzi and 11 days later were transferred with 1 × 10⁶ iTreg cells differentiated from Foxp3-EGFP mice. (B–C) Parasitemia [(B), left], parasite load by real time PCR in the spleen and liver [(B), right] and glucose concentration in the plasma (C) of non-transferred control (INF) and transferred (INF + iTreg) infected mice. (D–F) Dot plots (D) and graphs showing absolute numbers (E) of total and parasite-specific T cells responses in the spleen and liver of transferred and control mice. Data are presented as mean + SEM and are pooled from two independent experiments. P-values were calculated by unpaired t-test (B,E) or Mann Whitney test (C).
Discussion
The role played by Treg cells in the progression of T. cruzi infection remains controversial likely because any rational mechanistic evaluation is precluded by the limited characterization of the triggered Treg cell response. Considering this, we studied in detail the kinetics of Treg cell responses using Foxp3-EGFP reporter mice and demonstrated that frequency of Treg cells is reduced along T. cruzi infection in most peripheral organs including spleen, liver and inguinal lymph nodes. Furthermore, we showed that this relative decrease is not caused by a reduction in Treg cell absolute numbers but rather by a significant expansion of effector cells that affect the ratio of Treg cells to other immune subsets in different tissues. Thus, our results further expand and complement a recent work reporting that frequency of splenic Treg cells is significantly reduced during acute experimental T. cruzi infection likely as result of a neuroendocrine dysbalance (41). Altogether, this report and our data underscore that, differently from most chronic infections of viral, bacterial and parasitic origin which are characterized by a Treg cell accrual, T. cruzi infection associates with a significant decrease in the magnitude of the Treg cell response that is prolonged even until the early chronic phase of the infection.
After evaluating recognized mechanisms that regulate Treg cell pool size in periphery, we established that Treg cells exhibited significantly lower proliferation rate in comparison to effector immune subsets during T. cruzi infection, confirming a previous report in this direction (41). Although not surprising considering the current views on pTreg cell induction (71), we also demonstrated that the inflammatory environment triggered by T. cruzi limits the peripheral induction of Treg cells. Remarkable, infections characterized by Treg cell accumulation triggered a marked proliferation of Treg cells but not peripheral induction of this cell subset. Thus, influenza infection was shown to induce peripheral proliferation and accumulation of Ag-specific thymically derived Treg cells whereas conventional CD4+ T cells with identical specificity for the pathogen underwent little or no peripheral conversion in infected mice (72). Similarly, Treg cells expressing a pathogen-specific transgenic TCR were found to expand in response to M. tuberculosis without de novo induction of pTreg cells (73). Of note, proliferation of Ag-specific Treg cells was detected during M. tuberculosis but not L. monocytogenes infection indicating that only certain microbes are able to induce an inflammatory milieu that is conducive to the expansion of Ag-specific Treg cells (74). In this context, the results presented in our manuscript support the notion that T. cruzi infection triggers a relatively deficient Treg cell response by inducing an inflammatory context that does not support pTreg cell induction (somehow expected as discussed) but also limits Treg cell proliferation. Given that Treg cells have a high dependence on exogenous IL-2 for differentiation and proliferation, it is likely that Treg cell homeostasis may be affected by the suppressed production or increased consumption of IL-2 that occurs during T. cruzi infection (75–77). Indeed, IL-2 consumption by proliferating effector cells resulted in reduced Treg numbers in infections with Toxoplasma gondii, Listeria monocytogenes, and vaccinia virus (25). In this regard, we demonstrated that the systemic concentration of IL-2 remained unchanged during the acute phase of T. cruzi infection and that it showed no correlation with the frequency of splenic Treg cells. In addition, Gonzalez et al (41) reported that treatment with recombinant IL-2 was not sufficient to increase Treg cell frequency during this parasitic infection. These data suggest that regulation of the Treg cell pool size during T. cruzi infection is independent from IL-2 levels.
Several pro-inflammatory mediators have been reported to modulate Treg cell homeostasis during inflammatory conditions (78). Among them, IL-1β and IL-6 emerged as possible candidates to mediate the limited Treg cell response during T. cruzi infection, given their largely known function to promote a Th17 over a Treg cell fate (61, 62). We previously demonstrated that Th17 and other IL-17+ cell subsets are induced early during T. cruzi infection (79, 80) and when compared, the kinetics of the increment in Th17 cell frequencies and the relative decrease of Treg cells showed a reciprocal behavior (data not shown). Also, type I IFNs may be involved in the limited proliferation and induction of Treg cells as reported in viral infections (26, 64). However, evaluation of the magnitude of Treg cell responses in infected mice that lacked IL-6, IL-1β, and type I IFNs signaling due to genetic deletions in Il6, Caspase1/11, and Ifnar genes, respectively, ruled out a main role for these pro-inflammatory cytokines in the regulation of the Treg cell size during T. cruzi infection. Considering other possible inflammatory mediators involved in this phenomenon; we established that frequency of Treg cells showed a strong inverse correlation with the levels of parasite in blood along the infection. Furthermore, in vitro experiments indicated that live parasites are able to inhibit the induction of Treg cells by a mechanism that depends on cell populations other than CD4+ T cells themselves. Altogether, these findings strongly suggest that the T. cruzi load affects Treg cell peripheral induction and/or proliferation by indirect mechanisms that are currently under investigation in our laboratory.
Previous studies aimed at addressing the biological relevance of Treg cells in the course of T. cruzi infection reported contradictory results regarding the role of this subset in the regulation of the magnitude and functionality of effector immune responses, parasite control and development of immunopathology. Thus, Treg cell depletion by treatment with anti-CD25 depleting antibodies was reported to have a limited role in the induction of parasite-specific CD8+ T cells, and therefore, parasite control and host survival (43), but also to slightly increase host resistance to infection by favoring activation of CD4+ T cells (44). In contrast, combined injection of anti-CD25 and anti-GITR evidenced that Treg cells may be important to prevent exuberant inflammation, particularly at the heart, and increased mortality during this parasitic infection (42). More recently, early and sustained Treg cell depletion with anti-CD25 was reported to modulate Th1 and Th17 responses during T. cruzi infection, reducing cardiac parasitosis and inflammation (45). The reasons underlying these controversial data have not yet been determined but may be related to the variability in parasite and host strains, timing of Treg manipulation and the use of non-specific Treg cell depletion strategies. Considering these data and our results demonstrating a limited Treg cell response during T. cruzi infection, we reasoned that increasing Treg cell numbers may be a more rational strategy to define the role of Treg cells in this infection setting. Accordingly, we designed adoptive transfer experiments in which Treg cell numbers were manipulated by injection of in vitro differentiated Treg cells. This approach has been widely used to modulate the outcome of several pathological conditions including autoimmunity and GVHD (81). We determined that increasing Treg cells at the time when infected mice exhibited a significant reduction in the frequency of this cell subset, limited the accumulation of parasite-specific CD8+ T cells, severely compromising the control of parasite replication in tissues and host resistance to T. cruzi. These data are significant though they should be interpreted with caution as the activation status of in vitro generated Treg cells may enhance their suppressive function in comparison to endogenous Treg cells as previously reported (82). Even considering these limitations, our findings demonstrate that activated Treg cells are able to dampen specific CD8+ T cell immunity during T. cruzi infection. Furthermore, these data suggest that the natural contraction of Treg cell responses observed during the acute phase of T. cruzi infection may be critical to allow the emergence of a robust effector response aimed at controlling pathogen replication as previously reported for acute infections (25). Thus, timing and other features of the Treg cell response during this parasitic infection may evidence a particular mechanism of a chronic T. cruzi-host adaptation that allows the emergence of effector responses able to sustain partial parasite control and host resistance but preventing complete pathogen elimination. Within this conceptual framework, further research will be required to address the mechanisms involved and to determine if a precise Treg cell manipulation may represent an opportunity to potentiate anti-parasite immunity and parasite control.
It is currently known that Treg cells exert their regulatory function by deploying a plethora of immunosuppressive mechanisms that target different immune cell populations. Treg cells have been reported to modulate the activation, proliferation and/or function of CD8+ and CD4+ T cells, B cells, NK cells, monocytes and dendritic cells, among others (1). Altogether, the phenotypic, transcriptional and functional profiles of Treg cells activated during T. cruzi infection highlight the global activation of this cell subset and also evidence a marked heterogeneity in the Treg cell compartment from infected mice. Of note, even though GSEA suggests that T. cruzi infection elicit Treg cell subsets that acquire specialized programs for the regulation of Th1, Th2, and Th17 responses, these cells showed a global up-regulation of most of the genes classically associated to the Th1 signature but not of those critical for Th2 and Th17 fates, such as Gata-3 and Rorγt. Therefore, this specialized program may tailor Treg cells with a particular ability to suppress in vivo type 1 effector responses guiding Treg cells to Th1 inflammatory sites. Further studies including single-cell RNA-seq may be very helpful to precisely unravel the complexities of Treg cell responses during this infection. By potentiating the regulatory response through iTreg cell adoptive transfer, we established that Treg cells activated in the context of T. cruzi infection have the ability to suppress total and parasite-specific CD8+ T cell immunity and, at a minor extent, the polyclonal CD4+ T cell response. Whether Treg cells also influence other immune cell populations in these infectious setting remains unexplored. Although not previously reported for T. cruzi infection, Treg cell mediated suppression of CD8+ T cell immunity has been widely described during infections, particularly of viral origin (13). Treg cells are able to regulate many steps of the CD8+ T cell response through mechanisms that remain partially elucidated and involve not only the CD8+ T cells themselves but also antigen presenting cells. In this way, antigen-specific and polyclonal Treg cells impaired CD8+ T cell priming by inhibiting the early expansion of antigen-specific cells (83) and preventing the activation of antigen-presenting cells through CTLA-4 mediated inhibitory signals (84). Even more, Treg cells have been reported to directly limit CD8+ T cell proliferation (85), differentiation into effector cells (86), cytotoxic effector function (87, 88) and to sustain CD8+ T cell exhaustion (89) by mechanisms that involve IL-2 consumption, TGF-β and IL-10 production, PD-1 and CD39 expression, and many others. According to this, Treg cells activated in the context of T. cruzi infection acquired a phenotypic profile that would allow direct and indirect regulation of CD8+ T cell immunity. In this regard, a direct suppressive function is supported by the increased expression of CXCR3 in Treg cells activated during T. cruzi infection that would allow migration to inflammatory sites. In addition, a direct suppressive mechanism may be responsible for the reduction in the magnitude of the specific CD8+ T cell immunity that occur following iTreg cell adoptive transfer at 11 dpi, a time point after the emergence of the parasite-specific CD8+ T cell response. On the other hand, the fact that Treg cells activated during T. cruzi infection expressed remarkably high levels of CTLA-4 may indicate that these cells are particularly prepared for in vivo regulation of antigen-presenting cells. A detailed comprehension of the mechanisms underlying the Treg cell-mediated inhibition of CD8+ T cell immunity during this parasitic infection will be essential to design possible immune-intervention strategies aimed at improving parasite-specific immunity without enhancing infection-associated pathology.
Altogether, our data delineate a model in which infection with T. cruzi promotes activation but limits proliferation and peripheral induction of Treg cells during the acute phase. Whether these events are mediated by active mechanisms remains to be clearly established as passive pathways are not completely ruled out by our study. In any case, the Treg cell mediated regulatory response seems to exhibit a putatively improved quality but reduced quantity during T. cruzi infection. This weakened Treg cell response allows the emergence of a robust parasite-specific effector immunity, particularly of CD8+ T cells, which partially controls parasite replication favoring host resistance. Although these findings support a deleterious role for Treg cells during the acute phase of T. cruzi infection, a special attention needs to be given to timing. Indeed, we also determined that during the chronic phase, when parasite replication is limited and inflammation goes down, the frequency and phenotypic profile of Treg cells tended to return to normal conditions. This finding together with reported data in which increased Treg cell frequency and function in chagasic patients correlate with better clinical outcomes, likely as consequence of a limited chronic inflammation, proposes that Treg cell role may switch during T. cruzi infection from deleterious in the acute phase to protective during chronic Chagas disease. Further research will be required to definitively address this point in order to establish a rational framework for the design of novel treatment strategies to differentially manipulate Treg cells during different stages of T. cruzi infection.
Ethics Statement
This study was carried out in accordance with the recommendations of Guide to the care and use of experimental animals (Canadian Council on Animal Care, 1993) and Institutional Animal Care and Use Committee Guidebook (ARENA/OLAW IACUC Guidebook, National Institutes of Health, 2002). The protocol was approved by the Institutional Animal Care and Use Committee (IACUC) Facultad de Ciencias Químicas, Universidad Nacional de Córdoba (Approval Number 565/15 and 731/18) (OLAW Assurance number F16-00193-A5802-01).
Author Contributions
CA designed and performed most of the experiments, analyzed data, and wrote/commented on the manuscript. JT, CR, FC, FF, SB, and CB performed experiments and commented on the manuscript. VA and OJ participated in the execution and analysis of the RNAseq experiment and provided funding [Fondation pour la Recherche Médicale (AJE201212 to OJ), the Région Midi-Pyrénées (OJ)]. CM and AG participated in data analysis, commented on the manuscript and provided funding. EA supervised the research, designed experiments, wrote the manuscript, and provided funding.
Funding
Research reported in this publication was supported by: Agencia Nacional de Promoción Científica y Técnica (PICT 2013-0070 and PICT 2015-0127), Secretaría de Ciencia y Técnica-Universidad Nacional de Córdoba, Fundación Florencio Fiorini and the National Institute of Allergy and Infectious Diseases of the National Institutes of Health under Award Number R01AI110340. The content is solely the responsibility of the authors and does not necessarily represent the official views of the funding agencies.
Conflict of Interest Statement
The authors declare that the research was conducted in the absence of any commercial or financial relationships that could be construed as a potential conflict of interest.
The reviewer DA and handling editor declared their shared affiliation at time of review.
Acknowledgments
We thank M. P. Abadie, M. P. Crespo, F. Navarro, D. Lutti, V. Blanco, R. Villarreal, W. Requena, C. Noriega, A. Romero, L. Gatica, G. Furlán (Centro de Investigaciones en Bioquímica Clínica e Inmunología) and J. Fourquet (Centre de Physiopathologie de Toulouse Purpan) for their excellent technical assistance. We acknowledge the NIH Tetramer Core Facility for provision of the APC-labeled TSKB20/Kb tetramers. We thank the GeT-PlaGe and GenoToul bioinformatics platforms Toulouse Midi-Pyrénées for sequencing and computing resources.
Supplementary Material
The Supplementary Material for this article can be found online at: https://www.frontiersin.org/articles/10.3389/fimmu.2018.02555/full#supplementary-material
References
1. Shevach EM. Mechanisms of foxp3+ T regulatory cell-mediated suppression. Immunity (2009) 30:636–45. doi: 10.1016/j.immuni.2009.04.010
2. Sakaguchi S, Yamaguchi T, Nomura T, Ono M. Regulatory T cells and immune tolerance. Cell (2008) 133:775–87. doi: 10.1016/j.cell.2008.05.009
3. Stephen-Victor E, Bosschem I, Haesebrouck F, Bayry J. The Yin and Yang of regulatory T cells in infectious diseases and avenues to target them. Cell Microbiol. (2017) 19:e12746. doi: 10.1111/cmi.12746
4. Parkash O, Agrawal S, Madhan Kumar M. T regulatory cells: Achilles' heel of Mycobacterium tuberculosis infection? Immunol Res. (2015) 62:386–98. doi: 10.1007/s12026-015-8654-0
5. Saini C, Tarique M, Rai R, Siddiqui A, Khanna N, Sharma A. T helper cells in leprosy: an update. Immunol Lett. (2017) 184:61–6. doi: 10.1016/j.imlet.2017.02.013
6. Boer MC, Joosten SA, Ottenhoff TH. Regulatory T-cells at the interface between human host and pathogens in infectious diseases and vaccination. Front Immunol. (2015) 6:217. doi: 10.3389/fimmu.2015.00217
7. Lund JM, Hsing L, Pham TT, Rudensky AY. Coordination of early protective immunity to viral infection by regulatory T cells. Science (2008) 320:1220–4. doi: 10.1126/science.1155209
8. Soerens AG, Da Costa A, Lund JM. Regulatory T cells are essential to promote proper CD4 T-cell priming upon mucosal infection. Mucosal Immunol. (2016) 9:1395–406. doi: 10.1038/mi.2016.19
9. Fulton RB, Meyerholz DK, Varga SM. Foxp3+ CD4 regulatory T cells limit pulmonary immunopathology by modulating the CD8 T cell response during respiratory syncytial virus infection. J Immunol. (2010) 185:2382–92. doi: 10.4049/jimmunol.1000423
10. Ruckwardt TJ, Bonaparte KL, Nason MC, Graham BS. Regulatory T cells promote early influx of CD8+ T cells in the lungs of respiratory syncytial virus-infected mice and diminish immunodominance disparities. J Virol. (2009) 83:3019–28. doi: 10.1128/JVI.00036-09
11. Graham JB, Da Costa A, Lund JM. Regulatory T cells shape the resident memory T cell response to virus infection in the tissues. J Immunol. (2014) 192:683–90. doi: 10.4049/jimmunol.1202153
12. Veiga-Parga T, Sehrawat S, Rouse BT. Role of regulatory T cells during virus infection. Immunol Rev. (2013) 255:182–96. doi: 10.1111/imr.12085
13. Hasenkrug KJ, Chougnet CA, Dittmer U. Regulatory T cells in retroviral infections. PLoS Pathog. (2018) 14:e1006776. doi: 10.1371/journal.ppat.1006776
14. Luhn K, Simmons CP, Moran E, Dung NT, Chau TN, Quyen NT, et al. Increased frequencies of CD4+ CD25(high) regulatory T cells in acute dengue infection. J Exp Med. (2007) 204:979–85. doi: 10.1084/jem.20061381
15. Stross L, Gunther J, Gasteiger G, Asen T, Graf S, Aichler M, et al. Foxp3+ regulatory T cells protect the liver from immune damage and compromise virus control during acute experimental hepatitis B virus infection in mice. Hepatology (2012) 56:873–83. doi: 10.1002/hep.25765
16. Belkaid Y, Sun CM, Bouladoux N. Parasites and immunoregulatory T cells. Curr Opin Immunol. (2006) 18:406–12. doi: 10.1016/j.coi.2006.05.014
17. Peters N, Sacks D. Immune privilege in sites of chronic infection: Leishmania and regulatory T cells. Immunol Rev. (2006) 213:159–79. doi: 10.1111/j.1600-065X.2006.00432.x
18. Scholzen A, Minigo G, Plebanski M. Heroes or villains? T regulatory cells in malaria infection. Trends Parasitol. (2009) 26:16–25. doi: 10.1016/j.pt.2009.10.004
19. Belkaid Y, Piccirillo CA, Mendez S, Shevach EM, Sacks DL. CD4+CD25+ regulatory T cells control Leishmania major persistence and immunity. Nature (2002) 420:502–7. doi: 10.1038/nature01152
20. Hisaeda H, Maekawa Y, Iwakawa D, Okada H, Himeno K, Kishihara K, et al. Escape of malaria parasites from host immunity requires CD4+ CD25+ regulatory T cells. Nat Med. (2004) 10:29–30. doi: 10.1038/nm975
21. Abel S, Luckheide N, Westendorf AM, Geffers R, Roers A, Muller W, et al. Strong impact of CD4+ Foxp3+ regulatory T cells and limited effect of T cell-derived IL-10 on pathogen clearance during Plasmodium yoelii infection. J Immunol. (2012) 188:5467–77. doi: 10.4049/jimmunol.1102223
22. Hesse M, Piccirillo CA, Belkaid Y, Prufer J, Mentink-Kane M, Leusink M, et al. The pathogenesis of schistosomiasis is controlled by cooperating IL-10-producing innate effector and regulatory T cells. J Immunol. (2004) 172:3157–66. doi: 10.4049/jimmunol.172.5.3157
23. Oldenhove G, Bouladoux N, Wohlfert EA, Hall JA, Chou D, Dos Santos L, et al. Decrease of Foxp3+ Treg cell number and acquisition of effector cell phenotype during lethal infection. Immunity (2009) 31:772–86. doi: 10.1016/j.immuni.2009.10.001
24. Olguin JE, Fernandez J, Salinas N, Juarez I, Rodriguez-Sosa M, Campuzano J, et al. Adoptive transfer of CD4(+)Foxp3(+) regulatory T cells to C57BL/6J mice during acute infection with Toxoplasma gondii down modulates the exacerbated Th1 immune response. Microbes Infect. (2015) 17:586–95. doi: 10.1016/j.micinf.2015.04.002
25. Benson A, Murray S, Divakar P, Burnaevskiy N, Pifer R, Forman J, et al. Microbial infection-induced expansion of effector T cells overcomes the suppressive effects of regulatory T cells via an IL-2 deprivation mechanism. J Immunol. (2012) 188:800–10. doi: 10.4049/jimmunol.1100769
26. Srivastava S, Koch MA, Pepper M, Campbell DJ. Type I interferons directly inhibit regulatory T cells to allow optimal antiviral T cell responses during acute LCMV infection. J Exp Med. (2014) 211:961–74. doi: 10.1084/jem.20131556
27. Perez-Molina JA, Molina I. Chagas disease. Lancet (2018) 391:82–94. doi: 10.1016/S0140-6736(17)31612-4
28. Pan American Health Organization. Estimación Cuantitativa de la Enfermedad de Chagas en las Americas. OPS/HDM/CD/425-06. Washington, DC: OMS/OPS (2006).
29. Kayama H, Takeda K. The innate immune response to Trypanosoma cruzi infection. Microbes Infect. (2010) 12:511–7. doi: 10.1016/j.micinf.2010.03.005
30. Junqueira C, Caetano B, Bartholomeu DC, Melo MB, Ropert C, Rodrigues MM, et al. The endless race between Trypanosoma cruzi and host immunity: lessons for and beyond Chagas disease. Expert Rev Mol Med. (2010) 12:e29. doi: 10.1017/S1462399410001560
31. Tarleton RL. CD8+ T cells in Trypanosoma cruzi infection. Semin Immunopathol. (2015) 37:233–8. doi: 10.1007/s00281-015-0481-9
32. Cardillo F, de Pinho RT, Antas PR, Mengel J. Immunity and immune modulation in Trypanosoma cruzi infection. Pathog Dis. (2015) 73:ftv082. doi: 10.1093/femspd/ftv082
33. Savino W, Villa-Verde DM, Mendes-da-Cruz DA, Silva-Monteiro E, Perez AR, Aoki Mdel P, et al. Cytokines and cell adhesion receptors in the regulation of immunity to Trypanosoma cruzi. Cytokine Growth Factor Rev. (2007) 18:107–24. doi: 10.1016/j.cytogfr.2007.01.010
34. Holscher C, Mohrs M, Dai WJ, Kohler G, Ryffel B, Schaub GA, et al. Tumor necrosis factor alpha-mediated toxic shock in Trypanosoma cruzi-infected interleukin 10-deficient mice. Infect Immun. (2000) 68:4075–83. doi: 10.1128/IAI.68.7.4075-4083.2000
35. Hunter CA, Ellis-Neyes LA, Slifer T, Kanaly S, Grunig G, Fort M, et al. IL-10 is required to prevent immune hyperactivity during infection with Trypanosoma cruzi. J Immunol. (1997) 158:3311–6.
36. Abel LC, Rizzo LV, Ianni B, Albuquerque F, Bacal F, Carrara D, et al. Chronic Chagas' disease cardiomyopathy patients display an increased IFN-gamma response to Trypanosoma cruzi infection. J Autoimmun. (2001) 17:99–107. doi: 10.1006/jaut.2001.0523
37. Guedes PM, Gutierrez FR, Silva GK, Dellalibera-Joviliano R, Rodrigues GJ, Bendhack LM, et al. Deficient regulatory T cell activity and low frequency of IL-17-producing T cells correlate with the extent of cardiomyopathy in human Chagas' disease. PLoS Negl Trop Dis. (2012) 6:e1630. doi: 10.1371/journal.pntd.0001630
38. de Araujo FF, Correa-Oliveira R, Rocha MO, Chaves AT, Fiuza JA, Fares RC, et al. Foxp3+CD25(high) CD4+ regulatory T cells from indeterminate patients with Chagas disease can suppress the effector cells and cytokines and reveal altered correlations with disease severity. Immunobiology (2012) 217:768–77. doi: 10.1016/j.imbio.2012.04.008
39. de Araujo FF, Vitelli-Avelar DM, Teixeira-Carvalho A, Antas PR, Assis Silva Gomes J, Sathler-Avelar R, et al. Regulatory T cells phenotype in different clinical forms of Chagas' disease. PLoS Negl Trop Dis. (2011) 5:e992. doi: 10.1371/journal.pntd.0000992
40. Vitelli-Avelar DM, Sathler-Avelar R, Dias JC, Pascoal VP, Teixeira-Carvalho A, Lage PS, et al. Chagasic patients with indeterminate clinical form of the disease have high frequencies of circulating CD3+CD16-CD56+ natural killer T cells and CD4+CD25High regulatory T lymphocytes. Scand J Immunol. (2005) 62:297–308. doi: 10.1111/j.1365-3083.2005.01668.x
41. Gonzalez FB, Villar SR, Fernandez Bussy R, Martin GH, Perol L, Manarin R, et al. Immunoendocrine dysbalance during uncontrolled T. cruzi infection is associated with the acquisition of a Th-1-like phenotype by Foxp3(+) T cells. Brain Behav Immun. (2015) 45:219–32. doi: 10.1016/j.bbi.2014.11.016
42. Mariano FS, Gutierrez FR, Pavanelli WR, Milanezi CM, Cavassani KA, Moreira AP, et al. The involvement of CD4+CD25+ T cells in the acute phase of Trypanosoma cruzi infection. Microbes Infect. (2008) 10:825–33. doi: 10.1016/j.micinf.2008.04.009
43. Kotner J, Tarleton R. Endogenous CD4(+) CD25(+) regulatory T cells have a limited role in the control of Trypanosoma cruzi infection in mice. Infect Immun. (2007) 75:861–9. doi: 10.1128/IAI.01500-06
44. Sales PA, Jr., Golgher D, Oliveira RV, Vieira V, Arantes RM, Lannes-Vieira J, et al. The regulatory CD4+CD25+ T cells have a limited role on pathogenesis of infection with Trypanosoma cruzi. Microbes Infect. (2008) 10:680–8. doi: 10.1016/j.micinf.2008.03.008
45. Bonney KM, Taylor JM, Thorp EB, Epting CL, Engman DM. Depletion of regulatory T cells decreases cardiac parasitosis and inflammation in experimental Chagas disease. Parasitol Res. (2015) 114:1167–78. doi: 10.1007/s00436-014-4300-3
46. Muller U, Steinhoff U, Reis LF, Hemmi S, Pavlovic J, Zinkernagel RM, et al. Functional role of type I and type II interferons in antiviral defense. Science (1994) 264:1918–21. doi: 10.1126/science.8009221
47. Stempin CC, Rojas Marquez JD, Ana Y, Cerban FM. GRAIL and Otubain-1 are Related to T Cell Hyporesponsiveness during Trypanosoma cruzi Infection. PLoS Negl Trop Dis. (2017) 11:e0005307. doi: 10.1371/journal.pntd.0005307
48. Piron M, Fisa R, Casamitjana N, Lopez-Chejade P, Puig L, Verges M, et al. Development of a real-time PCR assay for Trypanosoma cruzi detection in blood samples. Acta Trop. (2007) 103:195–200. doi: 10.1016/j.actatropica.2007.05.019
49. Thiault N, Darrigues J, Adoue V, Gros M, Binet B, Perals C, et al. Peripheral regulatory T lymphocytes recirculating to the thymus suppress the development of their precursors. Nat Immunol. (2015) 16:628–34. doi: 10.1038/ni.3150
50. Mukaka MM. A guide to appropriate use of Correlation coefficient in medical research. Malawi Med J. (2012) 24:69–71.
51. Hazra A, Gogtay N. Biostatistics series module 6: correlation and linear regression. Indian J Dermatol. (2016) 61:593–601. doi: 10.4103/0019-5154.193662
52. Schober P, Boer C, Schwarte LA. Correlation coefficients: appropriate use and interpretation. Anesth Analg. (2018) 126:1763–8. doi: 10.1213/ANE.0000000000002864
53. Sardinha LR, Mosca T, Elias RM, do Nascimento RS, Goncalves LA, Bucci DZ, et al. The liver plays a major role in clearance and destruction of blood trypomastigotes in Trypanosoma cruzi chronically infected mice. PLoS Negl Trop Dis. (2010) 4:e578. doi: 10.1371/journal.pntd.0000578
54. Lee HM, Bautista JL, Hsieh CS. Thymic and peripheral differentiation of regulatory T cells. Adv Immunol. (2011) 112:25–71. doi: 10.1016/B978-0-12-387827-4.00002-4
55. Nagajyothi F, Kuliawat R, Kusminski CM, Machado FS, Desruisseaux MS, Zhao D, et al. Alterations in glucose homeostasis in a murine model of Chagas disease. Am J Pathol. (2013) 182:886–94. doi: 10.1016/j.ajpath.2012.11.027
56. Liston A, Gray DH. Homeostatic control of regulatory T cell diversity. Nat Rev Immunol. (2014) 14:154–65. doi: 10.1038/nri3605
57. Belkaid Y, Tarbell K. Regulatory T cells in the control of host-microorganism interactions. Annu Rev Immunol. (2009) 27:551–89. doi: 10.1146/annurev.immunol.021908.132723
58. Lopes MF, da Veiga VF, Santos AR, Fonseca ME, DosReis GA. Activation-induced CD4+ T cell death by apoptosis in experimental Chagas' disease. J Immunol. (1995) 154:744–52.
59. Gao W, Pereira MA. Interleukin-6 is required for parasite specific response and host resistance to Trypanosoma cruzi. Int J Parasitol. (2002) 32:167–70. doi: 10.1016/S0020-7519(01)00322-8
60. Paroli AF, Gonzalez PV, Diaz-Lujan C, Onofrio LI, Arocena A, Cano RC, et al. NLRP3 inflammasome and caspase-1/11 pathway orchestrate different outcomes in the host protection against Trypanosoma cruzi Acute infection. Front Immunol. (2018) 9:913. doi: 10.3389/fimmu.2018.00913
61. Korn T, Mitsdoerffer M, Croxford AL, Awasthi A, Dardalhon VA, Galileos G, et al. IL-6 controls Th17 immunity in vivo by inhibiting the conversion of conventional T cells into Foxp3+ regulatory T cells. Proc Natl Acad Sci USA. (2008) 105:18460–5. doi: 10.1073/pnas.0809850105
62. Basu R, Whitley S, Bhaumik S, Zindl C, Schoeb T, Benveniste E, et al. IL-1 signaling modulates activation of STAT transcription factors to antagonize retinoic acid signaling and control the TH17 cell-iTreg cell balance. Nat Immunol. (2015) 16:286–95. doi: 10.1038/ni.3099
63. Vaena de Avalos S, Blader IJ, Fisher M, Boothroyd JC, Burleigh BA. Immediate/early response to Trypanosoma cruzi infection involves minimal modulation of host cell transcription. J Biol Chem. (2002) 277:639–44. doi: 10.1074/jbc.M109037200
64. Bouziat R, Hinterleitner R, Brown JJ, Stencel-Baerenwald JE, Ikizler M, Mayassi T, et al. Reovirus infection triggers inflammatory responses to dietary antigens and development of celiac disease. Science (2017) 356:44–50. doi: 10.1126/science.aah5298
65. Huehn J, Siegmund K, Lehmann JC, Siewert C, Haubold U, Feuerer M, et al. Developmental stage, phenotype, and migration distinguish naive- and effector/memory-like CD4+ regulatory T cells. J Exp Med. (2004) 199:303–13. doi: 10.1084/jem.20031562
66. Tomura M, Honda T, Tanizaki H, Otsuka A, Egawa G, Tokura Y, et al. Activated regulatory T cells are the major T cell type emigrating from the skin during a cutaneous immune response in mice. J Clin Invest. (2010) 120:883–93. doi: 10.1172/JCI40926
67. Cretney E, Kallies A, Nutt SL. Differentiation and function of Foxp3(+) effector regulatory T cells. Trends Immunol. (2013) 34:74–80. doi: 10.1016/j.it.2012.11.002
68. Rosenblum MD, Way SS, Abbas AK. Regulatory T cell memory. Nat Rev Immunol. (2016) 16:90–101. doi: 10.1038/nri.2015.1
69. Campbell DJ, Koch MA. Phenotypical and functional specialization of FOXP3+ regulatory T cells. Nat Rev Immunol. (2011) 11:119–30. doi: 10.1038/nri2916
70. Wang J, Huizinga TW, Toes RE. De novo generation and enhanced suppression of human CD4+CD25+ regulatory T cells by retinoic acid. J Immunol. (2009) 183:4119–26. doi: 10.4049/jimmunol.0901065
71. Lee W, Lee GR. Transcriptional regulation and development of regulatory T cells. Exp Mol Med. (2018) 50:e456. doi: 10.1038/emm.2017.313
72. Bedoya F, Cheng GS, Leibow A, Zakhary N, Weissler K, Garcia V, et al. Viral antigen induces differentiation of Foxp3+ natural regulatory T cells in influenza virus-infected mice. J Immunol. (2013) 190:6115–25. doi: 10.4049/jimmunol.1203302
73. Shafiani S, Tucker-Heard G, Kariyone A, Takatsu K, Urdahl KB. Pathogen-specific regulatory T cells delay the arrival of effector T cells in the lung during early tuberculosis. J Exp Med. (2010) 207:1409–20. doi: 10.1084/jem.20091885
74. Shafiani S, Dinh C, Ertelt JM, Moguche AO, Siddiqui I, Smigiel KS, et al. Pathogen-specific Treg cells expand early during mycobacterium tuberculosis infection but are later eliminated in response to Interleukin-12. Immunity (2013) 38:1261–70. doi: 10.1016/j.immuni.2013.06.003
75. Tarleton RL. Trypanosoma cruzi-induced suppression of IL-2 production. II. Evidence for a role for suppressor cells. J Immunol. (1988) 140:2769–73.
76. Tarleton RL. Trypanosoma cruzi-induced suppression of IL-2 production. I. Evidence for the presence of IL-2-producing cells. J Immunol. (1988) 140:2763–8.
77. Briceno L, Mosca W. Defective production of interleukin 2 in patients with Chagas' disease. Purified IL-2 augments in vitro response in patients with chagasic cardiomyopathy. Mem Inst Oswaldo Cruz (1996) 91:601–7. doi: 10.1590/S0074-02761996000500011
78. Smigiel KS, Srivastava S, Stolley JM, Campbell DJ. Regulatory T-cell homeostasis: steady-state maintenance and modulation during inflammation. Immunol Rev. (2014) 259:40–59. doi: 10.1111/imr.12170
79. Tosello Boari J, Amezcua Vesely MC, Bermejo DA, Ramello MC, Montes CL, Cejas H, et al. IL-17RA Signaling reduces inflammationand mortality during Trypanosoma cruzi infection by recruiting suppressive IL-10-producing neutrophils. PLoS Pathog. (2012) 8:e1002658. doi: 10.1371/journal.ppat.1002658
80. Bermejo DA, Jackson SW, Gorosito-Serran M, Acosta-Rodriguez EV, Amezcua-Vesely MC, Sather BD, et al. Trypanosoma cruzi trans-sialidase initiates a program independent of the transcription factors RORgammat and Ahr that leads to IL-17 production by activated B cells. Nat Immunol. (2013) 14:514–22. doi: 10.1038/ni.2569
81. Singer BD, King LS, D'Alessio FR. Regulatory T cells as immunotherapy. Front Immunol. (2014) 5:46. doi: 10.3389/fimmu.2014.00046
82. Nguyen TL, Makhlouf NT, Anthony BA, Teague RM, DiPaolo RJ. In vitro induced regulatory T cells are unique from endogenous regulatory T cells and effective at suppressing late stages of ongoing autoimmunity. PLoS ONE (2014) 9:e104698. doi: 10.1371/journal.pone.0104698
83. Chappert P, Leboeuf M, Rameau P, Lalfer M, Desbois S, Liblau RS, et al. Antigen-specific Treg impair CD8(+) T-cell priming by blocking early T-cell expansion. Eur J Immunol. (2010) 40:339–50. doi: 10.1002/eji.200839107
84. Matheu MP, Othy S, Greenberg ML, Dong TX, Schuijs M, Deswarte K, et al. Imaging regulatory T cell dynamics and CTLA4-mediated suppression of T cell priming. Nat Commun. (2015) 6:6219. doi: 10.1038/ncomms7219
85. Zelinskyy G, Dietze KK, Husecken YP, Schimmer S, Nair S, Werner T, et al. The regulatory T-cell response during acute retroviral infection is locally defined and controls the magnitude and duration of the virus-specific cytotoxic T-cell response. Blood (2009) 114:3199–207. doi: 10.1182/blood-2009-03-208736
86. McNally A, Hill GR, Sparwasser T, Thomas R, Steptoe RJ. CD4+CD25+ regulatory T cells control CD8+ T-cell effector differentiation by modulating IL-2 homeostasis. Proc Natl Acad Sci USA. (2011) 108:7529–34. doi: 10.1073/pnas.1103782108
87. Chen ML, Pittet MJ, Gorelik L, Flavell RA, Weissleder R, von Boehmer H, et al. Regulatory T cells suppress tumor-specific CD8 T cell cytotoxicity through TGF-beta signals in vivo. Proc Natl Acad Sci USA. (2005) 102:419–24. doi: 10.1073/pnas.0408197102
88. Zelinskyy G, Werner T, Dittmer U. Natural regulatory T cells inhibit production of cytotoxic molecules in CD8(+) T cells during low-level Friend retrovirus infection. Retrovirology (2013) 10:109. doi: 10.1186/1742-4690-10-109
Keywords: regulatory T (Treg) cells, Trypanosoma cruzi, immunity, CD8 cytotoxic T cells+, pathogenesis
Citation: Araujo Furlan CL, Tosello Boari J, Rodriguez C, Canale FP, Fiocca Vernengo F, Boccardo S, Beccaria CG, Adoue V, Joffre O, Gruppi A, Montes CL and Acosta Rodriguez EV (2018) Limited Foxp3+ Regulatory T Cells Response During Acute Trypanosoma cruzi Infection Is Required to Allow the Emergence of Robust Parasite-Specific CD8+ T Cell Immunity. Front. Immunol. 9:2555. doi: 10.3389/fimmu.2018.02555
Received: 06 July 2018; Accepted: 17 October 2018;
Published: 05 November 2018.
Edited by:
María Fernanda Pascutti, Sanquin Diagnostic Services, NetherlandsReviewed by:
Ana Rosa Pérez, Consejo Nacional de Investigaciones Científicas y Técnicas (CONICET), ArgentinaDerk Amsen, Sanquin Research, Netherlands
Jose M. Alvarez, Universidade de São Paulo, Brazil
Copyright © 2018 Araujo Furlan, Tosello Boari, Rodriguez, Canale, Fiocca Vernengo, Boccardo, Beccaria, Adoue, Joffre, Gruppi, Montes and Acosta Rodriguez. This is an open-access article distributed under the terms of the Creative Commons Attribution License (CC BY). The use, distribution or reproduction in other forums is permitted, provided the original author(s) and the copyright owner(s) are credited and that the original publication in this journal is cited, in accordance with accepted academic practice. No use, distribution or reproduction is permitted which does not comply with these terms.
*Correspondence: Eva V. Acosta Rodriguez, eacosta@fcq.unc.edu.ar