 Dawn Jensen1,2*†
 Jiayu Chen1,3†
 Jessica A. Turner1,4†
 Julia M. Stephen5†
 Yu-Ping Wang6†
 Tony W. Wilson7†
 Vince D. Calhoun1,2,3,5,8†
 Jingyu Liu1,3†
- 1Tri-Institutional Center for Translational Research in Neuroimaging and Data Science (TReNDS), Georgia State University, Georgia Institute of Technology, Emory University, Atlanta, GA, United States
- 2Neuroscience Institute, Georgia State University, Atlanta, GA, United States
- 3Department of Computer Science, Georgia State University, Atlanta, GA, United States
- 4Wexnar Medical Center, Department of Psychiatry and Behavioral Health, Ohio State University, Columbus, OH, United States
- 5The Mind Research Network, Albuquerque, NM, United States
- 6Department of Biomedical Engineering, Tulane University, New Orleans, LA, United States
- 7Institute for Human Neuroscience, Boys Town National Research Hospital, Omaha, NE, United States
- 8Psychology Department and Neuroscience Institute, Georgia State University, Atlanta, GA, United States
Introduction: Adolescence, a critical phase of human neurodevelopment, is marked by a tremendous reorganization of the brain and accompanied by improved cognitive performance. This development is driven in part by gene expression, which in turn is partly regulated by DNA methylation (DNAm).
Methods: We collected brain imaging, cognitive assessments, and DNAm in a longitudinal cohort of approximately 200 typically developing participants, aged 9–14. This data, from three time points roughly 1 year apart, was used to explore the relationships between seven cytosine–phosphate–guanine (CpG) sites in genes highly expressed in brain tissues (GRIN2D, GABRB3, KCNC1, SLC12A9, CHD5, STXBP5, and NFASC), seven networks of grey matter (GM) volume change, and scores from seven cognitive tests.
Results: The demethylation of the CpGs as well as the rates of change in DNAm were significantly related to improvements in total, crystalized, and fluid cognition scores, executive function, episodic memory, and processing speed, as well as several networks of GM volume increases and decreases that highlight typical patterns of brain maturation.
Discussion: Our study provides a first look at the DNAm of genes involved in myelination, excitatory and inhibitory receptors, and connectivity, how they are related to the large-scale changes occurring in the brain structure as well as cognition during adolescence.
Introduction
Epigenetic regulation of gene expression occurs through a variety of mechanisms that include modification of histone, DNA methylation, and noncoding RNA regulation. These mechanisms modulate the accessibility of chromatin to transcriptional machinery, leading to altered expression of genes (Moore et al., 2013; Perri et al., 2017; Mangiavacchi et al., 2023). Methylation of the DNA, the more well-studied of these epigenetic processes, occurs when a methyl group attaches to a cytosine pyrimidine (CpG) ring, causing either an increase or decrease in gene expression, as well as alternative splicing during transcription of genes (Dupont et al., 2009). This intricate orchestration of gene expression and regulation is extremely plastic and sensitive to developmental cues (Dupont et al., 2009). While there has been extensive research demonstrating the strong impact methylation (DNAm), in particular, has on fetal brain development in humans (Schneider et al., 2016), the invasive nature of harvesting brain tissue for analysis has precluded the study of its role in neurodevelopment during human adolescence (Wheater et al., 2020). Recent developments have made it possible to use peripheral tissue samples such as saliva to assess DNAm changes non-invasively (Walton et al., 2016; Lin et al., 2018; Proskovec et al., 2020), affording researchers the opportunity to explore these molecular underpinnings of brain development beyond the post-natal stage.
Animal studies have shown that during adolescence, a period of neural maturation, there are large scale epigenomic changes occurring (Mychasiuk and Metz, 2016). While studies of normal development are few, a cross-sectional study in adolescent rats demonstrated that epigenetic regulators of specific genes, such as stress responders (Hsp10), cellular regulators, (Sirt1), growth factors (brain-derived neurotrophic factor), and glial-specific genes (Gfap), were expressed differentially, with greater overall expression in females than males and increased levels of expression of these regulators found in the prefrontal cortex compared to the hippocampus (Mychasiuk et al., 2011). A longitudinal study in rats showed adolescence-related reductions in the expression of dopamine receptors in cortical output neurons ranging from the prefrontal cortex to the nucleus accumbens (Shaw et al., 2006).
Recent research has shown that DNA methylation biomarkers gathered from peripheral tissue samples like blood and saliva have relationships with aspects of structural and functional measures of the brain (Walton et al., 2016; Lin et al., 2018; Proskovec et al., 2020). One study collected resected brain tissue in conjunction with saliva, blood, and buccal samples from 27 subjects undergoing neurosurgery for intractable epilepsy to calculate within and between subject correlations of DNA methylation of CpGs between peripheral tissue and brain. This study found that the correlation between saliva and brain epigenome-wide profiles is as high as r = 0.90 and 15.1% of individual CpGs in saliva correlated to brain at a nominally significant level (Braun et al., 2019).
Since the use of DNAm biomarkers gathered from peripheral tissue have made studying epigenetic mechanisms without harvesting brain tissue possible, there have been a few longitudinal studies looking at the changes occurring during human adolescence (Sanders et al., 2022). A study published in 2019 investigated the pre- and post-adolescent changes in DNAm, finding that between the ages of 10–18 years of age, roughly 15 k CpGs showed significant changes in DNAm (Han et al., 2019). Another study published in 2021 found that DNAm mediated the relationship between childhood adversity and the symptoms of depression across adolescence (Smith et al., 2021). Yet, there is little existing research regarding epigenetic influences on normal cognitive and brain development during adolescence (Wheater et al., 2020).
The neural development that occurs during human adolescence has been well-researched. Repeated longitudinal structural magnetic resonance imaging (sMRI) studies, where grey matter (GM) density and volume are measured as an indirect reflection of neuronal, dendritic and synaptic processes, glia and vasculature in the brain, consistently demonstrate that typical human brain development involves a birth-to-adolescence increase in GM volume that is then followed by a decrease during adolescence (10–25 years of age) that stabilizes in early adulthood (25 years of age and up) (Gogtay et al., 2004; Krongold et al., 2017; Tamnes et al., 2017). This reduction in GM volume that is seen throughout adolescence is widespread in the brain, but with regional variability as age increases. In general, lower-order regions are first to mature and then the higher-order association areas follow (Gogtay et al., 2004). This reorganization of the structure of the brain is accompanied by behavioral changes that manifest as overall improvement across a broad spectrum of cognitive measures that include improved attention, increased inhibition and control, improved memory and metacognition, continued development of cognitive self-regulation, increased speed of processing capacity, as well as more nuanced calibration of risk and reward (Steinberg, 2005).
Our study will take advantage of the recent advances in DNAm analysis to model the interactions between DNAm, GM volume changes, and cognitive development during human adolescence. To do this, we have used the Developmental Chronnecto-Genomics (Dev-CoG): A Next-Generation Framework for Quantifying Brain Dynamics and Related Genetic Factors in Childhood, a longitudinal cohort of roughly 200 typically developing subjects aged 9–14. This project collected brain imaging, cognitive assessments, DNA genetics and methylation data over three time points, with roughly 1 year between each (Stephen et al., 2021). With this data, we will identify CpGs sites where DNAm changed significantly over that time, and assess the relationship of DNAm change with the GM volume and cognitive performance changes. We will also investigate the relationships between the rates of changes between DNAm and the rates of GM volume change and cognitive performance respectively. Based on the current understanding of neural development and cognitive improvement during adolescence, we expect to see changes in DNAm in genes that play a role in GM volume changes and improved cognitive function over time.
Methods
Cohort
All data were collected as part of the Dev-CoG study (Stephen et al., 2021) and shared through an agreement with the project leaders. Subjects were recruited by the Mind Research Network (MRN) and the University of Nebraska Medical Center (UNMC). Approval from the relevant institutional review board at each data collection site (Advarrra IRB—MRN and UNMC IRB—Nebraska) and data sharing across study sites was written into the consent forms and the study protocols (Stephen et al., 2021). Images, saliva samples, and cognitive tests were collected from 200 male and female subjects between the ages of 9–14 over three time points, roughly a year between each collection. The inclusion criteria for the study were: English speaking, age 9–14 years at enrollment and both child and parent were able and willing to assent/consent to the study. The exclusion criteria for the study were: current pregnancy, unable to consent/assent, history of developmental delays or disorders (or an individual education plan indicative of a developmental delay/disorder), history of epilepsy or other neurological disorders, parental history of major psychiatric or neurological disorders, self-reported prenatal exposure to alcohol or drugs, medication use, contraindication to MRI (MRI screening form was reviewed), or metal orthodontia (e.g., braces or spacers) (Stephen et al., 2021). The mean age at enrollment was 11.3 years old (full range 9–14) for the entire group. In the repeated measure analysis reported below, 106 subjects were analyzed (48 girls, 58 boys), who had a mean baseline age of 11.75 years old. The multivariate analysis of difference maps included 138 subjects for deltaT1 (mean baseline age 11.83 years old, 67 females, 71 males) and 81 subjects for deltaT2 (35 females, 46 males). The sample size differences between the repeated measures and multivariate analyses are due to the flexibility of the linear mixed-effects model when dealing with missing data (Gabrio et al., 2022). See Table 1 for more demographic information.
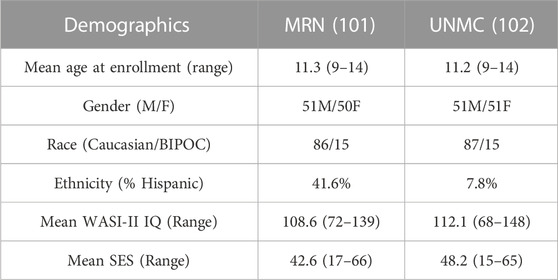
TABLE 1. General Demographic information: MRN - Mind Research Network, UNMC - University of Nebraska Medical College, BIPOC - Black, Indigenous, and People Of Color, WASI II IQ - Wechsler Abbreviated Scale of Intelligence, a general IQ test, a score between 90–102 is considered average, SES - Socioeconomic Score.
DNAm preprocessing
Saliva DNAm was assessed for each subject using the Illumina HumanMethylation850 (850 k) microarray, which measures CpG methylation across ∼850,000 probes covering 99% of gene promoters. Standardized quality control procedures and quantile normalization was performed using the minfi Bioconductor package in R (version 3.6.2) (Aryee et al., 2014). Red and green channel intensities were mapped to the methylated and unmethylated status, with average intensities used to check for low quality samples. Beta values reflect the degree of methylation, (from 0–1) and were calculated for each CpG, for each subject. Principal component analyses (PCA) were performed on the beta values to identify any samples more than three standard deviations away from the median on any of the first four components. These were considered outliers and removed. Samples where the genetically determined sex differed from the self-reported value were also removed. 20 duplicate DNA samples were included in each batch to ensure measurement reliability. Samples processed in different batches were merged at this stage. Stratified quantile normalization was then applied across sample, using the minfi PreprocessQuantile function. The cell proportions for each DNAm sample were calculated by implementing the estimateCellCounts function in minfi, using a combined reference of five types of blood cells (B cells, CD8T and CD4T cells, NK-LGL cells, monocytes, and granulocytes), as well as epithelial cells (GSE46573) (Aryee et al., 2014). In this cohort, the proportion of B cells, CD8T, CD4T, monocytes, and NK-LGL cells were zero. The estimated proportion of granulocytes and epithelial cells was 70 percent and 30 percent respectively. The cell type effect was regressed out from all the samples to account for the change of cell proportion over time. Batch effects were corrected by using the R package Combat, which assumes normalized data and equalizes the mean from all batches, making negative values possible (Johnson et al., 2007).
CpG selection
At this stage, there were approximately 750K CpG sites retained per subject, per time point. We kept only CpG sites with a sample standard deviation of 0.1 or higher at the first time point, to ensure that baseline variability across subjects exceeded measurement variability (Duan et al., 2021). This reduced the number of CpG sites to 2414. Since we were primarily interested in CpG sites whose DNAm values were changing over the three time points of data collected, the CpG sites were further filtered by keeping the sites that had changed significantly in methylation between time points, using paired t-tests. After FDR correction for multiple testing (Benjamini and Hochberg, 2000), 54 CpG sites during deltaT1 (time point 2 - time point 1) and 465 CpGs during deltaT2 (time point 3 - time points 2) were identified as changing significantly, and 54 CpGs were in common. The Infinium MethylationEPIC Manifest file (Hansen, 2016) was used to identify the annotated genes of these 54 CpGs. Cross-referencing these genes with the Human Protein Atlas (Uhlén et al., 2015), seven of these CpGs were found to be located on genes highly expressed in the brain. Refer to Figure 1A for a diagram of the filtering process. The subsequent analyses focused on these seven CpG sites. See Table 2 for detailed results. A post hoc gene set enrichment analysis (GSEA) was performed using the GENE2FUNC function in FUMA (https://fuma.ctglab.nl/) (Watanabe et al., 2017). Correction for multiple testing was done using the Benjamini–Hochberg method. To further confirm tissue specificity, genes regulated by these seven CpGs were also tested for enrichment in specific human tissues FUMA. See Supplementary Table S2 for complete results.
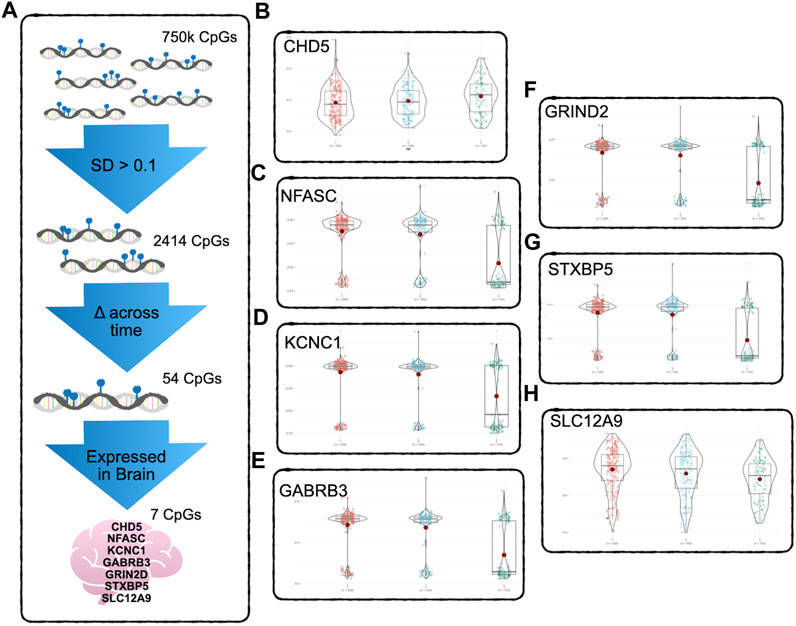
FIGURE 1. DNAm Filtering Process and Results - (A) Starting with 750k CpGs after preprocessing and QC, only CpGs above the 0.1 standard deviation of variability were kept, reducing the number of CpGs to 2414. A pairwise t-test was used to detect CpGs with significant change across time points (FDR corrected for multiple testing). Only 54 CpGs showed significant change across all three timepoints. Of these, seven were found to be regulating genes that according to the Human Protein Atlas are expressed in the brain. (B–H) show the significant change across all three timepoints. The CpG regulating CHD5 (B) was the only one of the seven to show significant increase in methylation, the other six CpGs decreased in methylation over time. See Table 2 for detailed results.
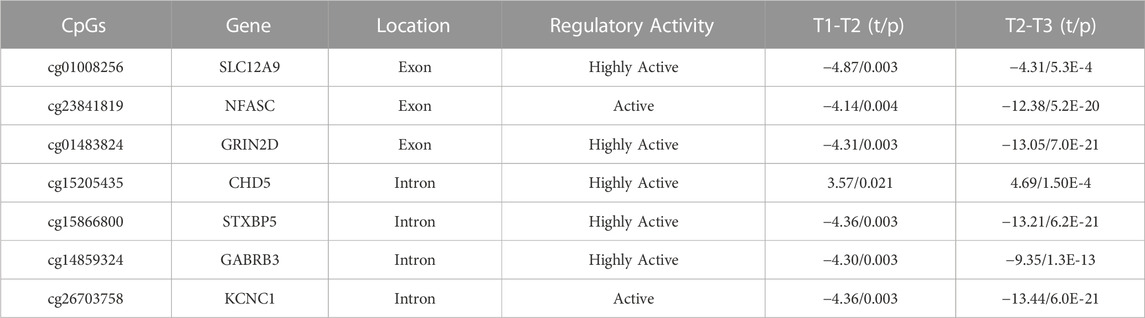
TABLE 2. Identification of the seven CpGs and change in DNAm over time: These CpGs regulate genes identified by the Infinium MethylationEPIC Manifest file, cross-referenced by the Human Protein Atlas, and verified through FUMA tissue expression analysis as being highly expressed in the brain. TP1-TP2, n = 163, TP2-TP3, n = 103. All p-values are FDR-corrected for multiple tests.
sMRI data
T1-weighted structural MRI images were collected at the MRN site on a Siemens 3T TrioTim scanner, and at UNMC site on a Siemens 3T Magnetom Skyra and Prisma scanners, all with a 32-channel radio frequency coil. Scanning parameters were equilibrated as much as possible. The sMRI images were reoriented and registered to a cohort specific template, created using the ANTS multivariate template generator, and resampled to 2 mm × 2 mm × 2 mm (Andersson et al., 2007a; Andersson et al., 2007b; Avants et al., 2008; Sanchez et al., 2012). Using FAST in FSL, a high-dimensional normalization pipeline, the non-brain tissues was removed, and the grey matter, white matter, and cerebral spinal fluid segmented, leaving normalized, modulated, Jacobian-scaled grey matter images (Zhang et al., 2001) that were smoothed by a 4 mm × 4 mm x 4 mm full width at half maximum Gaussian kernel (Smith and Brady, 1997). The resultant grey matter images then had scanner differences regressed out using a simple linear regression with age and sex as covariates. Two subjects were removed due to movement (framewise displacement from rs-fMRI) above 3 standard deviations from the mean of the group.
To calculate the rate and direction of change across time points, grey matter volumes from TP1 were subtracted from TP2 to create the deltaT1 difference map for each individual, and TP2 was subtracted from TP3 to create the deltaT2 difference map. An independent component analysis (ICA) built in the GIFT toolbox (SBM v1.0b) (Xu et al., 2009) was then applied to the difference maps to extract components/brain networks, where distributed brain regions showed covarying patterns of GM volume changes. The components’ associated loadings reflect these brain regions’ variation across subjects. Using the minimum description length (MDL) criterion (Calhoun and Adali, 2009), seven components were extracted from the GM volume changes of deltaT1, identifying our brain networks of interest for this study. The direction of the ICA loadings were confirmed through a voxel-based morphometry (VBM) analysis in FSL (Smith et al., 2004), where positive loadings indicate increases in GM volume and negative loadings indicate decreases in GM volume. The spatial maps of these seven components were projected onto the subjects’ deltaT2 GM images, as well as to the subjects’ GM images at each time point to ensure uniformity of comparison.
Cognitive data
The age-uncorrected standard scores from the following NIH cognitive toolbox tests (Denboer et al., 2014) were collected from each subject: the Picture Sequence Memory (TBPSM) test for 8+ (episodic memory), the Pattern Comparison Processing Speed (PCPS) test for 7+ (processing speed), the Flanker Inhibitory Control and Attention (TBFICA) test for 8+ (executive function), the Dimensional Change Card Sort (TBDCCS) for 8+ (executive function). The Cognition Total Composite Score (COGTC), the Cognition Fluid Composite Score (COGFC) reflecting capacity for new learning, and the Cognition Crystallized Composite Score (COGCC) reflecting past learning were computed. Age-uncorrected scores were used to preserve the sensitivity to differences in age. Scores were corrected for site differences using a linear regression with age and sex as covariates. Linear mixed-effects repeated measures model (Baayen et al., 2008) with age and sex as covariates were performed using the lme4 package in R (version 4.1.2) (Bates et al., 2015) on all seven measures to confirm the expected significant improvements in cognitive performance over time. (Steinberg, 2005). To calculate the rate of change across time points, scores from TP1 were subtracted from TP2 to create the deltaT1 difference map, and TP2 was subtracted from TP3 to create the deltaT2 difference map.
Statistical tests
DNAm and GM
A repeated measures mixed effects model (Baayen et al., 2008) was used to test the relationships between each of the seven CpGs and each of the seven GM networks across all three time points using the lme4 package in R (version 4.1.2) (Bates et al., 2015). The subjects’ GM network loadings (representing the networks’ variation across subjects and across time) were the dependent variables, the DNAm measures of the seven CpGs were the independent variables, while sex and baseline age were covariates. Initially, a family variable was added as a random effect to account for the impact of siblings within the study, but then removed from the model because it did not account for a significant amount of variance. Similarly, the differing time intervals between subjects’ data collection was also included as a possible confounder and ruled out. The results were Bonferroni corrected to control for Type I error at 5% for 49 tests (Emerging Infectious Diseases, 2015).
To further explore the multivariate relationships between the rates of change within the DNAm and GM networks, a MANCOVA analysis was performed using the jmv package in R (version 4.1.2) (R: MANCOVA) on data from deltaT1 and deltaT2 separately. The subjects’ loadings from the seven GM networks of the difference maps were the dependent variables, and the DNAm changes in seven CpG sites were the independent variables, with sex and baseline age as the covariates. Significant associations between GM networks and CpG sites were further tested individually for potential interactions with sex using the emmeans package in R (version 4.1.2) (RDocumentation).
DNAm and cognitive tests
Similarly, a repeated measures mixed effects model was used to test the relationships between each of the seven CpGs and each of the cognitive tests across all time points. In this model, the score from each cognitive test was the dependent variable and the DNAm of each CpG was the independent variable, while sex and baseline age were covariates. To further explore the multivariate relationships between the rate and direction of change in the DNAm and cognitive measures, a MANCOVA analysis was also performed on the changes in seven cognitive scores (dependent variables) and DNAm changes in seven CpG sites (independent variables) using data from deltaT1 and deltaT2 separately, with sex and baseline age as covariates.
GM and cognitive tests
In the same way a repeated measures mixed effects model was used to test the relationships between each of the seven networks of GM volume (the independent variable) and each of the cognitive tests across (the dependent variable) across all three time points, while sex and baseline age were covariates. A MANCOVA analysis was performed on the changes of cognitive scores (dependent variables) and GM networks (independent variables) using data from deltaT1 and deltaT2 separately.
Results
DNAm generally decreased over time
To determine which CpGs were experiencing significant change over time, a paired t-test was performed. The results showed that the DNAm of six of the seven CpG sites, located on SLC12A9, NFASC, GRIN2D, STXBP5, GABRB3, and KCNC1, all decreased in methylation across the three time points. The CpG site located on CHD5 was the only CpG that increased in methylation significantly. All seven CpGs were located in active or highly active regulatory regions of their genes, indicating a role in regulating gene expression (Moore et al., 2013). There were no significant differences between the changes in methylation over time for these CpGs related to sex. Figures 1B–H shows the changes of the DNAm of these seven genes over time. A noticeable bimodal distribution in the DNAm of GABRB3, NFASC, GRIN2D, STXBP5, and KCNC1 is likely due to genetic regulation from a proximal single nucleotide polymorphism (SNP): SNP allele type modulates methylation value of CpG site (Dupont et al., 2009). See Table 2 for detailed results. With the exception of CHD5, DNAm decreased over time.
Cognitive performance improved over time
A repeated measures linear mixed effects analysis was used to verified the expected significant improvement across all cognitive measures (Bonferroni threshold: p < 0.007), although TBFICA and TBDCCS only showed significant improvement between TP2 and TP3. See Table 3 for a summary of the results. The following cognitive measures also showed significant baseline age effects: COGTC (t = 3.5, p < 0.0006), PCPS (t = 4.11, p < 7E-5), and TBDCCS (t = 3.48, p < 0.0007), where increased age is associated with increased cognitive performance. Figure 2A shows an example of the overall improvement seen in Total Cognition (COGTC) along the three timepoints.
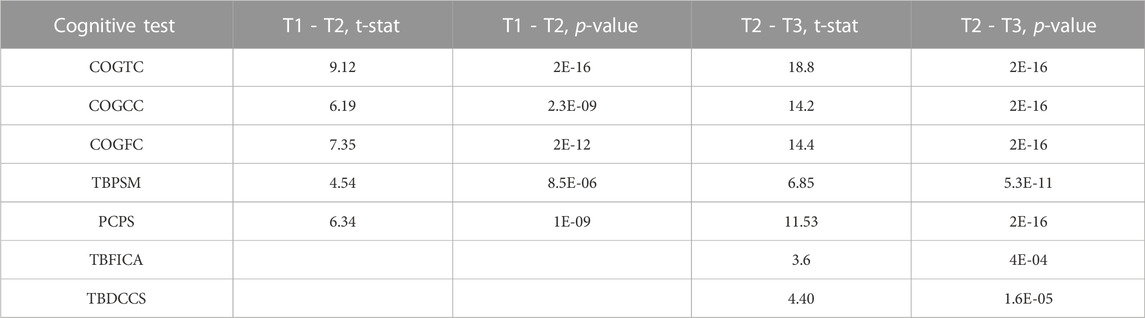
TABLE 3. Cognitive Improvement over time: Summary of the significant results from the linear mixed effects models of cognition over time. Bonferroni corrected for multiple tests (uncorrected p < 0.001).
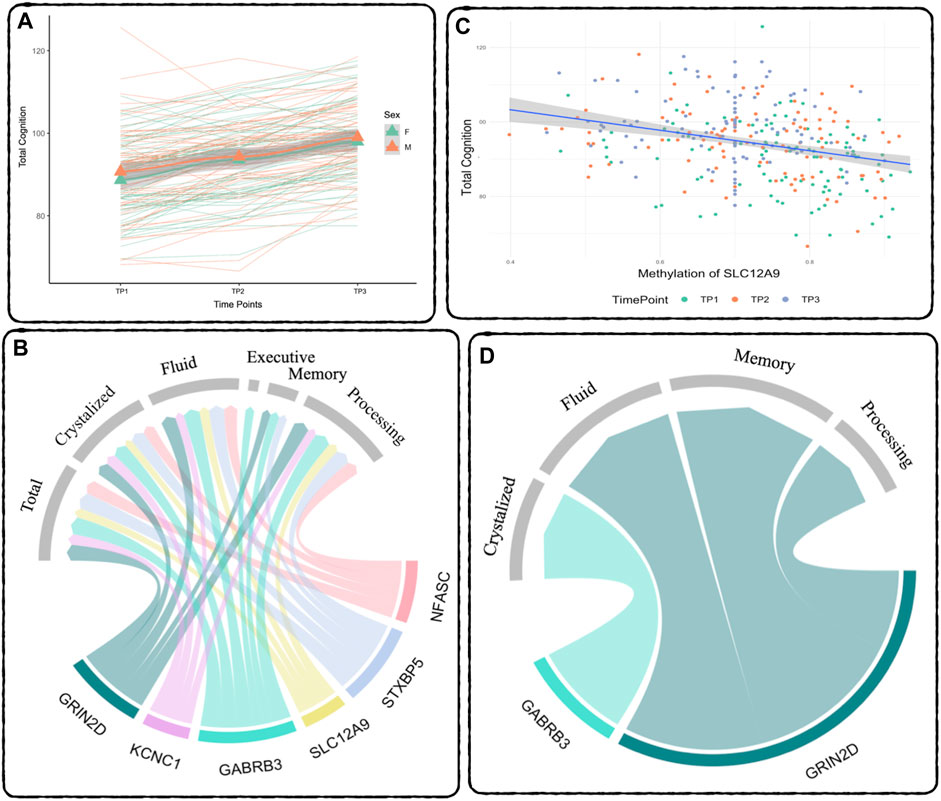
FIGURE 2. Relationship between DNAm and Cognition - (A) Cognition over time: Total Cognition (COGTC) across all three timepoints. The thick lines represent the mean for each sex, green is females, orange is males, the triangles are the mean at each timepoint. The thin lines represent each subject’s individual slope across time. Results of the repeated measures mixed effects model: between TP1 and TP2: t = 9.12, p < 2E-16, between TP2 and TP3: t = 18.80, p < 2E-16. (B) Repeated Measures Results: Summary of the significant relationships between DNAm and Cognitive Performance across all three time points. The width of the links corresponds to the effect size (t-statistic) of the relationship. (C) Demethylation of SLC12A9 Related to Increase in Total Cognition: The decrease in DNAm of SLC12A9 across all three time points was significantly related to the increase in total cognition (t = −3.76, p < 0.0002). (D) MANCOVA Results: Summary of the significant relationships between the rate of decrease in DNAm and the rate of improvement in cognitive performance. Cognitive measure labels: Total - COGTC, Crystalized - COGCC, Fluid - COGFC, Executive - TBDCCS, Memory - TBPSM, and Processing - PCPS. See Tables 4, 5 for complete results.
Decreases in DNAm were associated with improved cognitive performance
A separate repeated measures linear mixed effect analysis showed that DNAm decreases in SLC12A9, NFASC, GRIN2D, STXBP5, GABRB3, and KCNC1 were related to improvement in many of the cognitive measures, after Bonferroni correction for multiple testing. There were no significant relationships between the DNAm of CHD5, which was the only CpG to show an increase in methylation, and any of the cognitive measures. Figure 2B summarizes the significant linear relationships between DNAm and cognition. Figure 2C highlights the relationship between the decrease in DNAm of SLC12A9 and the improvement in COGTC. The MANCOVA analysis revealed that the rate of DNAm decrease of GABRB3 and was related to the improvements in COGCC during deltaT1. The rate of decrease in methylation of GRIN2D was associated with the rate of improvement in COGFC, TBPSM, and PCPS during deltaT2. There were main effects of sex (multivariate F = 4.63, p < 0.01) and baseline age (multivariate F = 4.73, p < 0.01) with regard to the rates of change in COGCC (univariate F = 6.94, p < 0.009 and F = 7.37, p < 0.008 respectively) in deltaT1. Females had a greater rate of improvement in their crystallized cognition composite score than males. Adolescents who were older at the initial assessment had a greater rate of improvement in their crystalized cognition composite score than those who were younger. Figure 2D summarizes the significant multivariate relationships between the rate of decrease in DNAm and the rate of improvement in cognition. See Tables 4, 5 for detailed results. Decreases in DNAm at six of the CpGs was significantly related to the improvements seen in total, crystalized, and fluid cognition as well as improvements in executive function, episodic memory, and processing speed.
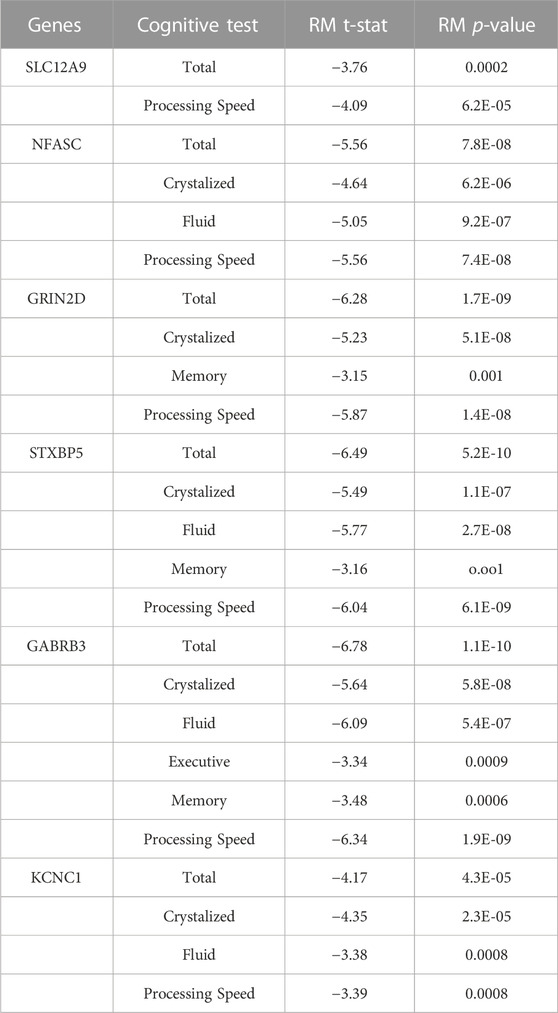
TABLE 4. Complete Repeated Measures (RM) Results between DNAm and Cognition - The decrease in DNAm at the CpGs on these genes showed significant relationships with the improvement seen in the cognitive measures across all three timepoints. Threshold for Bonferroni corrections due to multiple testing was p < 0.001. Cognitive measure labels: Total - COGTC, Crystalized - COGCC, Fluid - COGFC, Executive - TBDCCS, Memory - TBPSM, and Processing - PCPS.
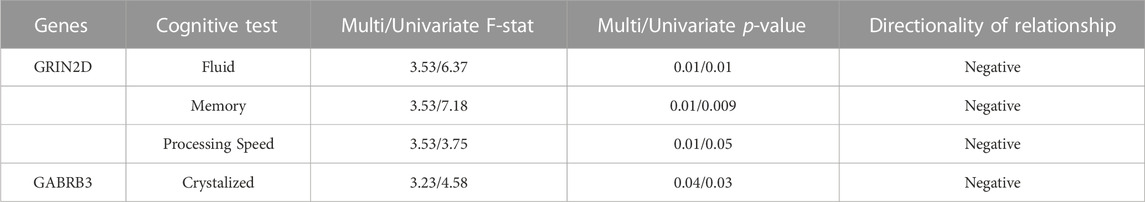
TABLE 5. Complete MANCOVA Results between DNAm and Cognition - The rate of decrease in DNAm at CpGs on these genes was related to the rate of improvement in cognitive performance in deltaT2. Multi/Univariate - Multivariate and univariate F-statistic and p-values listed. Cognitive measure labels: Crystalized - COGCC, Fluid - COGFC, Memory - TBPSM, and Processing - PCPS. Directionality of the relationships determined through linear regression.
GM volume decreased across networks of parietal regions while the cerebellum and ventral pre-frontal cortex still show increased GM volume
The ICA performed on the subject’s GM scans identified seven brain networks (referred to as components in Figure 3A) highlighting covarying regions of GM change within the subjects’ brains over time. These regions were identified using the Harvard-Oxford cortical and subcortical structural atlases (Frazier et al., 2005; Desikan et al., 2006; Makris et al., 2006; Goldstein et al., 2007) and the probabilistic cerebellar atlas (Diedrichsen et al., 2009). The first component (Comp1) highlights increases in cerebellar volume, including right and left crus I-II, left VI and VIIb, and vermiss VI, VIIIa-b, and vermiss crus II. The second (Comp2) highlights increases in the ventral prefrontal cortex. The third component (Comp3) consists of a network of increased GM volume in the cerebellum, thalamus, insula, and posterior cingulate gyrus covarying with decreases in GM volume in the anterior cingulate gyrus, lingual gyrus, and paracingulate gyrus The fourth component (Comp4) is a network of cerebellar increases covarying with decreases in the inferior frontal gyrus, the paracingulate gyrus, the temporal pole, the frontal pole, and left caudate. The fifth component (Comp5) comprises a network of increasing GM volume in the temporal occipital fusiform gyrus, the inferior temporal and middle temporal gyrus covarying with decreases in the posterior fusiform cortex, the lateral frontal orbital cortex, temporal pole, hippocampus, and middle frontal gyrus. The sixth component (Comp6) highlights a network of increasing cerebellar GM volume covarying with decreasing GM volume in the frontal operculum cortex and temporal pole. The seventh component (Comp7) consists of a network of increasing GM volume in the orbital frontal cortex and subcallosal cortex covarying with decreases in the superior frontal gyrus, the anterior cingulate gyrus, the frontal pole, the paracingulate gyrus, and the pars operculum of the inferior frontal gyrus. See Supplementary Table S1 for a detailed listing of the brain regions.
FIGURE 3. Relationship between DNAm and GM across time - (A) GM ICA results: Components 1–7, thresholded from −7 < z < −3 (blue to green) and from 3 < z < 7 (red to yellow), highlighting covarying differences in GM volume between TP1 and TP2. Blue - green are areas of GM volume decrease over time, red - yellow are areas of GM volume increase. See Supplementary Table S1 for a comprehensive list of regions. (B) MANCOVA Results Overview: Pictured are the significant relationships between the rates of change in DNAm and GM. The width of the links corresponds to the effect size (F-ratio) of the relationship. See Table 6 for complete results.
The rate of DNAm decrease were associated with the rates of GM volume loss in several networks
To assess the relationships between the rates of change between DNAm and GM volume, a MANCOVA analysis of the respective difference maps was performed. The rate of decrease in DNAm of NFASC and KCNC1 were related to the rate of decreases in the GM volume in three GM networks (Comp3, Comp4, and Comp6). Additionally, the rate of demethylation of KCNC1 was related to decreases in Comp7. In contrast to this trend, the rate of increase in the DNAm of CHD5 was related to the rate of decrease in GM volume in Comp2 and the rate of increase in GM volume in Comp5. Figure 3B summarizes the multivariate results between the rates of DNAm change and GM volume changes. The relationship between the rate of change between the DNAm of KCNC1 and Comp1 had a significant interaction with sex (t = −4.768, p < 0.0001). In females, the rate of decrease of DNAm of KCNC1 is related to the rate of increase in GM volume in Comp1. In males, the rate of decrease of DNAm of KCNC1 is related to the rate of decrease in GM volume in Comp1. This interaction between sex and the rate of DNAm of KCNC1 in the cerebellum is highlighted in Supplementary Figure S2. See Table 6 for detailed results. Decreases in the rates of demthylation of NFASC and KCNC1 were associated with the rates of change in GM volume across varied regions of the brain, mostly associated with GM volume loss. The rate of increase of DNAm of CHD5 was associated with the rate of change in GM networks that highlighted areas of GM volume increase.
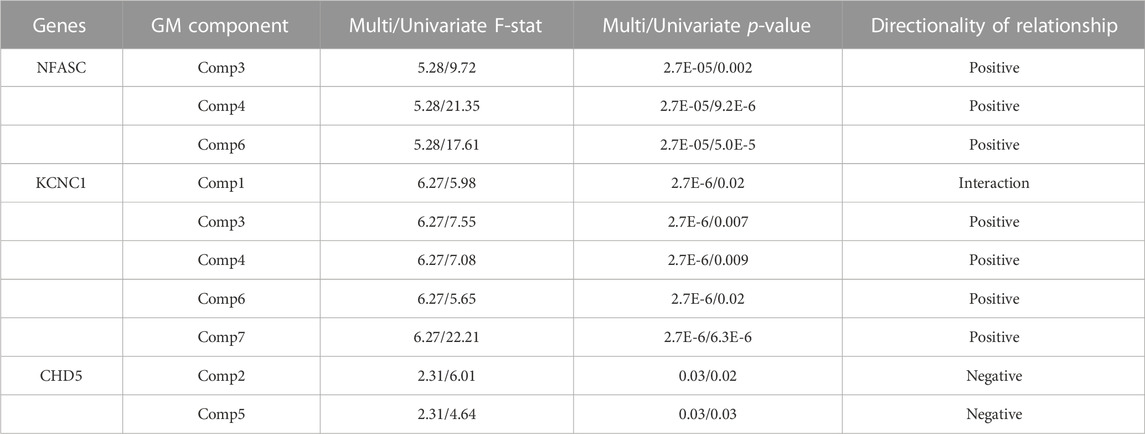
TABLE 6. Complete MANCOVA Results between DNAm and GM volume - The rate of decrease in DNAm at CpGs on these genes was related to networks of GM change in the listed GM components. Multi/Univariate - Multivariate and univariate F-statistic and p-values listed. Directionality of the relationships determined through linear regression.
Decreases in DNAm and improvement in cognition weakly associated with GM volume decreases
To test the direct relationships between DNAm and GM volume over time, a repeated measures linear mixed-effects analysis was performed. The results did not survive correction for multiple testing, they did highlight a pattern of associations between networks of GM volume loss in Components 3, 4, and 6 with decreases in DNAm as well as improvements in cognition across time, which was very similar to the multivariate results between the rates of change in demethylation and networks of GM volume change. A summary of these results can be found in Supplementary Figure S1.
Discussion
Investigation of the changes of DNAm in these seven genes and those relationships with GM volume and cognition across time in this adolescent cohort have given us a first look at some of the molecular underpinnings that may be partly responsible for driving the dynamic and profound changes associated with adolescence. The function and roles of these genes in the brain are highlighted in Table 7. The post hoc pathway analysis (see Supplementary Table S2) found significant pathways annotated to molecular-level functioning within the neuron, synapse, axon, and transporter complexes (Watanabe et al., 2017). Tissue enrichment from the FUMA analysis also confirmed elevated expression of these gene-enrichment pathways exclusively within the brain (Watanabe et al., 2017). More specifically, SLC12A9, NFASC, GRIN2D, STXBP5, and CHD5 are all expressed throughout the brain, while GABRB3 is expressed differentially in the following regions of the brain: cerebral cortex, hippocampus, cerebellum, thalamus, olivary body, and piriform cortex, and KCNC1 is expressed in neurons that fire at high frequency, including neurons in the cerebellum, globus pallidus, subthalamic nucleus, substantia nigra, reticular thalamic nuclei, cortical and hippocampal interneurons (Uhlén et al., 2015). The location of these CpGs further support their role in regulating gene expression. The CpGs on SLC12A9, NFASC, and GRIN2D were located on the exons of the gene, which is associated with alternative splicing of the gene (Shayevitch et al., 2018). The CpGs of CHD5, STXBP5, GABRB3, and KCNC1 were located on the introns of the genes, which is associated with changes in gene expression (Anastasiadi et al., 2018).
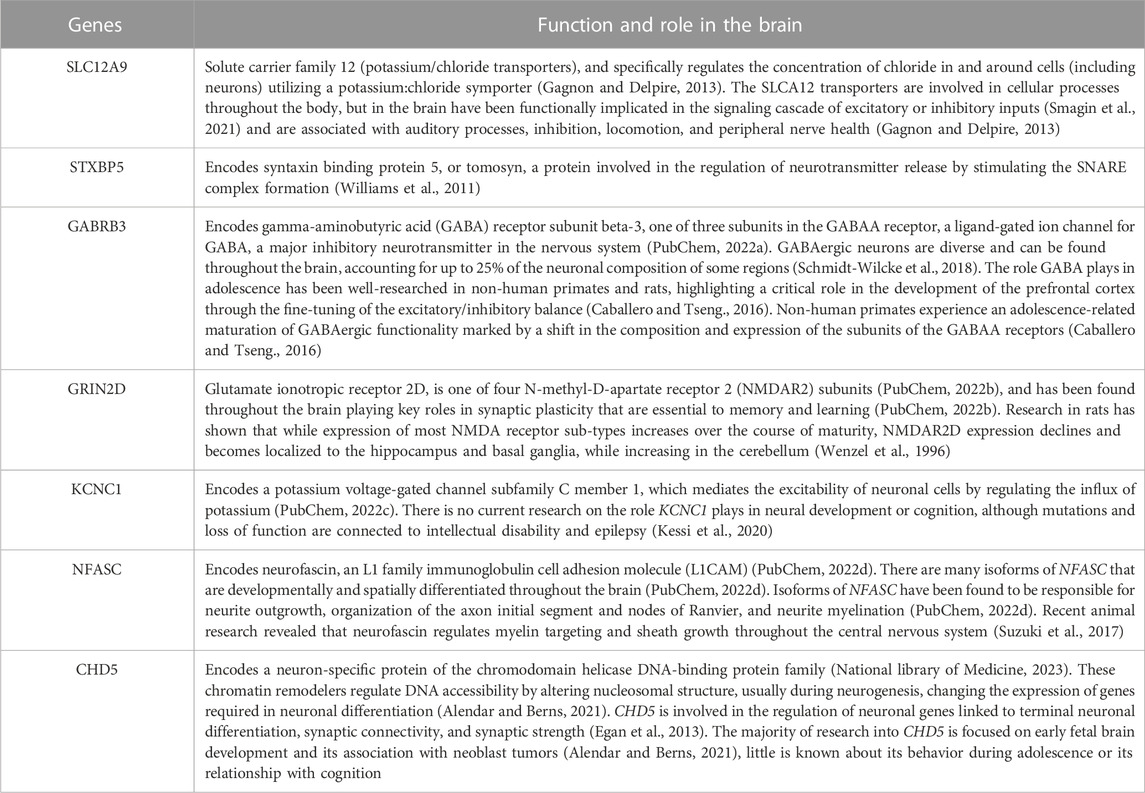
TABLE 7. Function and Role of the Genes - Listed are the function and role in the brain of the seven genes regulated by the seven CpGs selected in this study. Expression of these genes in the brain was cross-referenced using the Human Protein Atlas and verified through FUMA tissue expression analysis.
In our study, six genes, SLC12A9, NFASC, GRIN2D, STXBP5, GABRB3, and KCNC1, experienced a sharp decrease in methylation between TP2 and TP3. This dramatic rate of change was not matched by the changes seen in GM volume or cognitive performance, which showed more consistent decreases and increases respectively over time. To rule out that this difference in the rates of changes was caused by a batch effect within the methylation data, subsamples of subjects with methylation data of all three timepoints within the same batch were analyzed. The same precipitous drop in methylation between the last two timepoints was observed. This suggests a biological mechanism, maybe related to puberty status, worthy of future study.
The demethylation of these six genes which all play, to some degree or another, a role in the regulation of the excitatory and inhibitory signaling of the brain (Debanne and Poo, 2010; Arain et al., 2013; Morris, 2013; Smagin et al., 2021), were significantly related to the adolescents’ improvement in general, fluid, and crystalized cognition, as well as processing speed. Additionally, the demethylation of GRIN2D, GABRB3, and STXBP5, which are more directly involved in neurotransmission, was related to improvements of episodic memory over time. Current research shows that maturation of the GABAergic network plays a role in the restructuring of the hippocampus during adolescence (Caballero and Tseng, 2016). The demethylation of GABRB3 was also related to improvement in executive function, consistent with research showing increased maturation of GABAergic networks is linked to improvements in executive function (Caballero and Tseng, 2016).
The CpG site on CHD5 is the only one with increased methylation over time. The rate of change in CHD5 was related to the rates of GM volume increases in the prefrontal cortex, and in a network of the temporal regions, as well as the rate of improvement in executive function. These influences could be due to the role this gene plays in the development of neural plasticity (Arain et al., 2013).
The networks of GM volume change from this cohort were consistent with existing research. At this stage of adolescence, the cerebellum and prefrontal cortex are typically increasing in volume (Tiemeier et al., 2010) while frontal and occipital poles, as well as dorsal parietal cortices, begin showing the maturation-related GM volume loss (Gogtay et al., 2004). The demethylation of NFASC, KCNC1, GRIN2D, GABRB3, and STXBP5 across time were related, although not strongly (not surviving multiple comparison corrections) to the patterns in GM networks in components 3, 4, and 6 (Supplementary Figure S1), highlighting cerebellar increases covarying with decreases across the temporal, occipital, and frontal poles. These promising relationships coupled with the significant associations between the rates of DNAm and GM changes (Figure 3, the MANCOVA analysis) suggest a concurrent rather than causal association, particularly in light of recent research suggesting that GM volume loss measured in healthy adolescents is actually cortical thinning due to an increase in axon myelination (Natu et al., 2019). This is also supported by the significant relationships seen between the rates of GM volume “loss” and the rate of change in the demethylation of NFASC, which regulates myelination (Klingseisen et al., 2019). The rate of change of DNAm of KCNC1 was also related to rates of GM volume change in various brain networks, possibly related to the increased excitability of adolescent brains (Debanne and Poo, 2010; Zanini et al., 2016), but more research would be needed to confirm this. Networks of GM volume changes across time also had trending relationships with the cognitive changes in crystallized and fluid cognition, as well as episodic memory and attention/inhibitory control. These relationships could also be due to the coincidental association of GM volume “loss” during adolescence happening in parallel to the changes in cognition, rather than driving them.
In addition to the strengths of this exploratory longitudinal study, there were some limitations. There was no measure for the stage of puberty for any time points. Future studies of methylation, brain development, and cognition should include this measure to further refine the model and take important hormonal changes into account. Attrition of subjects by the third time point created an imbalance between the deltaT1 and deltaT2 analyses, as well as limiting the number of subjects with complete data. While still very informative despite this limitation, this study should be seen as a preliminary glance at the interaction of dynamic changes in methylation, brain development, and cognition in adolescence. Replicating these results with more subjects should be undertaken.
There is also a scarcity of research on the exact impact the increases and decreases of methylation at these CpG sites have on the expression of the genes they regulate. Increases in methylation generally decreases gene expression, and decreases in methylation generally increases gene expression (Dupont et al., 2009), but not universally. This study provides a spotlight for further research into these particular CpGs and their effects on gene regulation within the brain, particularly during adolescence. Future work will also include looking at this same cohort using an epigenome-wide analysis, as well as include white matter and resting-state fMRI measures to capture a more complete picture of the influence of methylation on adolescent brain development and cognition.
Conclusion
This small sample of seven CpGs highlight the dynamics of methylation and how they are related to some of the large-scale changes occurring in adolescence, such as the fine-tuning of the excitatory/inhibitory balance through shifts in the receptor subunits of GRIN2D and GABRB3, or the changes in synaptic strength and connectivity possibly driven by the changes in the regulation of CHD5, STXBP5, or KCNC1, or even the thinning of GM associated with changes in methylation of NFASC. The changes in cognition would also be supported by changes in synaptic connectivity, excitability, maturation of the excitatory and inhibitory networks, as well as the thickening of myelination that could be occurring in response to the changes in gene expression regulated by these CpGs. The findings of this study offer many new directions from which we can develop a more detailed understanding of the molecular underpinnings of these dynamics in the adolescent brain.
Data availability statement
The raw data supporting the conclusion of this article will be made available by the authors, without undue reservation.
Ethics statement
The studies involving human participants were reviewed and approved by Advarrra IRB—Mind Research Network UNMC IRB—University of Nebraska Medical Center. Written informed consent to participate in this study was provided by the participant’s legal guardian/next of kin.
Author contributions
All authors listed have made a substantial, direct, and intellectual contribution to the work and approved it for publication.
Funding
This research was supported by grants R01-MH121101, P20-GM144641, P30-GM122734, P50-AA22534, R56-MH124925, and R01-MH118695 from the National Institutes of Health and grants 1539067 and 2112455 from the National Science Foundation. The funders had no role in study design, data collection, analysis, decision to publish, or manuscript preparation.
Acknowledgments
We want to thank the participants for volunteering to participate in the study and our staff and local collaborators for contributing to the work.
Conflict of interest
The authors declare that the research was conducted in the absence of any commercial or financial relationships that could be construed as a potential conflict of interest.
Publisher’s note
All claims expressed in this article are solely those of the authors and do not necessarily represent those of their affiliated organizations, or those of the publisher, the editors and the reviewers. Any product that may be evaluated in this article, or claim that may be made by its manufacturer, is not guaranteed or endorsed by the publisher.
Supplementary material
The Supplementary Material for this article can be found online at: https://www.frontiersin.org/articles/10.3389/fgene.2023.1222619/full#supplementary-material
SUPPLEMENTARY FIGURE S1 | Repeated Measures Results: GM, DNAm, and Cognition - Pictured are the relationships between DNAm, GM volume, and Cognitive Performance across all three time points that trended toward significant, but did not survive Bonferroni correction (p < 0.001). The width of the links corresponds to the effect size (t-statistic) of the relationship. Components (Comp 3, 4, 5, 6, and 7 from bottom to top respectively) were thresholded from |z| > 3. Blue - green are areas of GM volume decrease over time, red - yellow are areas of GM volume increase. Cognitive measure labels: Crystalized - COGCC, Fluid - COGFC, Memory - TBPSM, and Attention - TBFICA.
SUPPLEMENTARY FIGURE S2 | Interaction plot between methylation of KCNC1 and cerebellar volume - In females, the rate of decrease seen in methylation of KCNC1 is associated with the rate of increase in GM volume, as opposed to males, where the rate of decrease in methylation over time is associated with rate of decrease in GM volume. This divergence in the relationship between changes in methylation and changes in GM volume by sex was significant (t-ratio = −4.768, p < 0.0001). See Table 6 for complete results.
SUPPLEMENTARY TABLE S1 | Comprehensive list of GM ICA results - Brain regions results of the ICA highlighting covarying regions of GM change within the subjects’ brains over time. These regions were identified by the MNI coordinates and the Harvard-Oxford cortical and subcortical structural atlases as well as the probabilistic cerebellar atlas.
SUPPLEMENTARY TABLE S2 | FUMA Results - details of the enrichment analysis conducted using FUMA.
References
Alendar, A., and Berns, A. (2021). Sentinels of chromatin: Chromodomain helicase DNA-binding proteins in development and disease. Genes. and Dev. 35 (21–22), 1403–1430. doi:10.1101/gad.348897.121
Anastasiadi, D., Esteve-Codina, A., and Piferrer, F. (2018). Consistent inverse correlation between DNA methylation of the first intron and gene expression across tissues and species. Epigenetics Chromatin 11 (1), 37. doi:10.1186/s13072-018-0205-1
Andersson, J. L. R., Jenkinson, M., and Smith, S. Non-linear optimisation. FMRIB technical report TR07JA1. Available at: https://www.fmrib.ox.ac.uk/datasets/techrep/tr07ja1/tr07ja1.pdf (Accessed June 28, 2007).
Andersson, J. L. R., Jenkinson, M., and Smith, S. Non-linear registration, aka Spatial normalisation FMRIB technical report TR07JA2. Available at:https://www.fmrib.ox.ac.uk/datasets/techrep/tr07ja2/tr07ja2.pdf (Accessed June 28, 2007).
Arain, M., Haque, M., Johal, L., Mathur, P., Nel, W., Rais, A., et al. (2013). Maturation of the adolescent brain. Neuropsychiatric Dis. Treat. 9, 449–461. doi:10.2147/NDT.S39776
Aryee, M. J., Jaffe, A. E., Corrada-Bravo, H., Ladd-Acosta, C., Feinberg, A. P., Hansen, K. D., et al. (2014). Minfi: A flexible and comprehensive bioconductor package for the analysis of Infinium DNA methylation microarrays. Bioinformatics 30 (10), 1363–1369. doi:10.1093/bioinformatics/btu049
Avants, B. B., Epstein, C. L., Grossman, M., and Gee, J. C. (2008). Symmetric diffeomorphic image registration with cross-correlation: Evaluating automated labeling of elderly and neurodegenerative brain. Med. Image Anal. 12 (1), 26–41. doi:10.1016/j.media.2007.06.004
Baayen, R. H., Davidson, D. J., and Bates, D. M. (2008). Mixed-effects modeling with crossed random effects for subjects and items. J. Mem. Lang. 59 (4), 390–412. doi:10.1016/j.jml.2007.12.005
Bates, D., Mächler, M., Bolker, B., and Walker, S. (2015). Finding patients before they crash: The next major opportunity to improve patient safety. J. Stat. Softw. 67 (1), 1–3. doi:10.1136/bmjqs-2014-003499
Benjamini, Y., and Hochberg, Y. (2000). On the adaptive control of the false discovery rate in multiple testing with independent statistics. J. Educ. Behav. Statistics 25 (1), 60–83. doi:10.2307/1165312
Braun, P. R., Han, S., Hing, B., Nagahama, Y., Gaul, L. N., Heinzman, J. T., et al. (2019). Genome-wide DNA methylation comparison between live human brain and peripheral tissues within individuals. Transl. Psychiatry 9 (1), 47–10. doi:10.1038/s41398-019-0376-y
Caballero, A., and Tseng, K. Y. (2016). GABAergic function as a limiting factor for prefrontal maturation during adolescence. Trends Neurosci. 39 (7), 441–448. doi:10.1016/j.tins.2016.04.010
Calhoun, V. D., and Adali, T. (2009). Feature-based fusion of medical imaging data. IEEE Trans. Inf. Technol. Biomed. 13 (5), 711–720. doi:10.1109/TITB.2008.923773
Debanne, D., and Poo, M.-M. (2010). Spike-timing dependent plasticity beyond synapse—pre- and post-synaptic plasticity of intrinsic neuronal excitability. Front. Synaptic Neurosci. 2, 21. doi:10.3389/fnsyn.2010.00021
Denboer, J. W., Nicholls, C., Corte, C., and Chestnut, K. (2014). National Institutes of Health toolbox cognition battery. Archives Clin. Neuropsychology 29 (7), 692–694. doi:10.1093/arclin/acu033
Desikan, R. S., Ségonne, F., Fischl, B., Quinn, B. T., Dickerson, B. C., Blacker, D., et al. (2006). An automated labeling system for subdividing the human cerebral cortex on MRI scans into gyral based regions of interest. Neuroimage 31 (3), 968–980. doi:10.1016/j.neuroimage.2006.01.021
Diedrichsen, J., Balster, J. H., Cussans, E., and Ramnani, N. (2009). A probabilistic MR atlas of the human cerebellum. Neuroimage 46, 39–46. doi:10.1016/j.neuroimage.2009.01.045
Duan, K., Mayer, A. R., Shaff, N. A., Chen, J., Lin, D., Calhoun, V. D., et al. (2021). DNA methylation under the major depression pathway predicts pediatric quality of life four-month post-pediatric mild traumatic brain injury. Clin. Epigenetics 13 (1), 140. doi:10.1186/s13148-021-01128-z
Dupont, C., Armant, D. R., and Brenner, C. A. (2009). Epigenetics: Definition, mechanisms and clinical perspective. Seminars Reproductive Med. 27 (5), 351–357. doi:10.1055/s-0029-1237423
Egan, C. M., Nyman, U., Skotte, J., Streubel, G., Turner, S., O’Connell, D. J., et al. (2013). CHD5 is required for neurogenesis and has a dual role in facilitating gene expression and polycomb gene repression. Dev. Cell. 26 (3), 223–236. doi:10.1016/j.devcel.2013.07.008
Emerging Infectious Diseases (2015). Etymologia: Bonferroni correction. Emerg. Infect. Dis. 21 (2), 289. doi:10.3201/eid2102.ET2102
Frazier, J. A., Chiu, S., Breeze, J. L., Makris, N., Lange, N., Kennedy, D. N., et al. (2005). Structural brain magnetic resonance imaging of limbic and thalamic volumes in pediatric bipolar disorder. Am. J. Psychiatry 162 (7), 1256–1265. doi:10.1176/appi.ajp.162.7.1256
Gabrio, A., Plumpton, C., Banerjee, S., and Leurent, B. (2022). Linear mixed models to handle missing at random data in trial-based economic evaluations. Health Econ. 31 (6), 1276–1287. doi:10.1002/hec.4510
Gagnon, K. B., and Delpire, E. (2013). Physiology of SLC12 transporters: Lessons from inherited human genetic mutations and genetically engineered mouse knockouts. Am. J. Physiology - Cell. Physiology 304 (8), C693–C714. doi:10.1152/ajpcell.00350.2012
Gogtay, N., Giedd, J. N., Lusk, L., Hayashi, K. M., Greenstein, D., Vaituzis, A. C., et al. (2004). Dynamic mapping of human cortical development during childhood through early adulthood. Proc. Natl. Acad. Sci. 101 (21), 8174–8179. doi:10.1073/pnas.0402680101
Goldstein, J. M., Seidman, L. J., Makris, N., Ahern, T., O'Brien, L. M., Caviness, V. S., et al. (2007). Hypothalamic abnormalities in schizophrenia: Sex effects and genetic vulnerability. Biol. Psychiatry 61 (8), 935–945. doi:10.1016/j.biopsych.2006.06.027
Han, L., Zhang, H., Kaushal, A., Rezwan, F. I., Kadalayil, L., Karmaus, W., et al. (2019). Changes in DNA methylation from pre-to post-adolescence are associated with pubertal exposures. Clin. Epigenetics 11 (1), 176. doi:10.1186/s13148-019-0780-4
Hansen, K. D. (2016). IlluminaHumanMethylationEPICmanifest: Manifest for Illumina's EPIC methylation arrays. R package version 0.3.0. Available at: https://bitbucket.com/kasperdanielhansen/Illumina_EPIC.
Johnson, W. E., Li, C., and Rabinovic, A. (2007). Adjusting batch effects in microarray expression data using empirical Bayes methods. Biostatistics 8 (1), 118–127. doi:10.1093/biostatistics/kxj037
Kessi, M., Chen, B., Peng, J., Tang, Y., Olatoutou, E., He, F., et al. (2020). Intellectual disability and potassium channelopathies: A systematic review. Front. Genet. 11, 614. doi:10.3389/fgene.2020.00614
Klingseisen, A., Ristoiu, A.-M., Kegel, L., Sherman, D. L., Rubio-Brotons, M., Almeida, R. G., et al. (2019). Oligodendrocyte neurofascin independently regulates both myelin targeting and sheath growth in the CNS. Dev. Cell. 51 (6), 730–744.e6. doi:10.1016/j.devcel.2019.10.016
Krongold, M., Cooper, C., and Bray, S. (2017). Modular development of cortical gray matter across childhood and adolescence. Cereb. Cortex 27 (2), 1125–1136. doi:10.1093/cercor/bhv307
Lin, D., Chen, J., Perrone-Bizzozero, N., Bustillo, J. R., Du, Y., Calhoun, V. D., et al. (2018). Characterization of cross-tissue genetic-epigenetic effects and their patterns in schizophrenia. Genome Med. 10 (1), 13. doi:10.1186/s13073-018-0519-4
Makris, N., Goldstein, J. M., Kennedy, D., Hodge, S. M., Caviness, V. S., Faraone, S. V., et al. (2006). Decreased volume of left and total anterior insular lobule in schizophrenia. Schizophr. Res. 83 (2-3), 155–171. doi:10.1016/j.schres.2005.11.020
Mangiavacchi, A., Morelli, G., and Orlando, V. (2023). Behind the scenes: How RNA orchestrates the epigenetic regulation of gene expression. Front. Cell. Dev. Biol. 11, 1123975. doi:10.3389/fcell.2023.1123975
Moore, L., Le, T., and Fan, G. (2013). DNA methylation and its basic function. Neuropsychopharmacology 38, 23–38. doi:10.1038/npp.2012.112
Morris, R. G. M. (2013). NMDA receptors and memory encoding. Neuropharmacology 74, 32–40. doi:10.1016/j.neuropharm.2013.04.014
Mychasiuk, R., Gibb, R., and Kolb, B. (2011). Prenatal stress produces sexually dimorphic and regionally-specific changes in gene expression in hippocampus and frontal cortex of developing rat offspring. Dev. Neurosci. 33 (6), 531–538. doi:10.1159/000335524
Mychasiuk, R., and Metz, G. A. S. (2016). Epigenetic and gene expression changes in the adolescent brain: What have we learned from animal models? Neurosci. Biobehav. Rev. 70, 189–197. doi:10.1016/j.neubiorev.2016.07.013
National library of Medicine (2023). CHD5 chromodomain helicase DNA binding protein 5 [Homo sapiens (human)]—gene—Ncbi. Available at: https://www.ncbi.nlm.nih.gov/gene/26038 (Accessed June 21, 2023).
Natu, V. S., Gomez, J., Barnett, M., Jeska, B., Kirilina, E., Jaeger, C., et al. (2019). Apparent thinning of human visual cortex during childhood is associated with myelination. Proc. Natl. Acad. Sci. 116 (41), 20750–20759. doi:10.1073/pnas.1904931116
Perri, F., Longo, F., Giuliano, M., Sabbatino, F., Favia, G., Ionna, F., et al. (2017). Epigenetic control of gene expression: Potential implications for cancer treatment. Crit. Rev. Oncology/Hematology 111, 166–172. doi:10.1016/j.critrevonc.2017.01.020
Proskovec, A. L., Rezich, M. T., O'Neill, J., Morsey, B., Wang, T., Ideker, T., et al. (2020). Association of epigenetic metrics of biological age with cortical thickness. JAMA Netw. Open 3 (9), e2015428. doi:10.1001/jamanetworkopen.2020.15428
PubChem (2022a). GABRB3—gamma-aminobutyric acid type A receptor subunit beta3 (human). Available at:https://pubchem.ncbi.nlm.nih.gov/gene/GABRB3/human (Accessed October 12, 2022).
PubChem (2022b). GRIN2D - glutamate ionotropic receptor NMDA type subunit 2D (human). Available at:https://pubchem.ncbi.nlm.nih.gov/gene/GRIN2D/human (Accessed October 13, 2022).
PubChem (2022c). KCNC1—potassium voltage-gated channel subfamily C member 1 (human). Available at:https://pubchem.ncbi.nlm.nih.gov/gene/KCNC1/human (Accessed October 13, 2022).
PubChem (2022d). Nfasc - neurofascin (human). Available at: https://pubchem.ncbi.nlm.nih.gov/gene/NFASC/human (Accessed October 13, 2022).
RDocumentation Emmeans function—RDocumentation. Available at: https://www.rdocumentation.org/packages/emmeans/versions/1.8.2/topics/emmeans.
Sanchez, C. E., Richards, J. E., and Almli, C. R. (2012). Age-specific MRI templates for pediatric neuroimaging. Dev. Neuropsychol. 37 (5), 379–399. doi:10.1080/87565641.2012.688900
Sanders, F., Baltramonaityte, V., Donohoe, G., Davies, N. M., Dunn, E. C., Cecil, C. A. M., et al. (2022). Associations between methylation age and brain age in late adolescence. Available at: https://www.biorxiv.org/content/10.1101/2022.09.08.506972v1.full (Accessed September 10, 2022).
Schmidt-Wilcke, T., Fuchs, E., Funke, K., Vlachos, A., Müller-Dahlhaus, F., Puts, N. A. J., et al. (2018). GABA—From inhibition to cognition: Emerging concepts. Neurosci. 24 (5), 501–515. doi:10.1177/1073858417734530
Schneider, E., Dittrich, M., Böck, J., Nanda, I., Müller, T., Seidmann, L., et al. (2016). CpG sites with continuously increasing or decreasing methylation from early to late human fetal brain development. Gene 592 (1), 110–118. doi:10.1016/j.gene.2016.07.058
Shaw, P., Greenstein, D., Lerch, J., Clasen, L., Lenroot, R., Gogtay, N., et al. (2006). Intellectual ability and cortical development in children and adolescents. Nature 440 (7084), 676–679. doi:10.1038/nature04513
Shayevitch, R., Askayo, D., Keydar, I., and Ast, G. (2018). The importance of DNA methylation of exons on alternative splicing. RNA 24 (10), 1351–1362. doi:10.1261/rna.064865.117
Smagin, D. A., Babenko, V. N., Redina, O. E., Kovalenko, I. L., Galyamina, A. G., and Kudryavtseva, N. N. (2021). Reduced expression of slc genes in the VTA and NAcc of male mice with positive fighting experience. Genes. 12 (7), 1099. doi:10.3390/genes12071099
Smith, B. J., Lussier, A. A., Cerutti, J., Simpkin, A. J., Smith, A. D. A. C., Suderman, M. J., et al. (2021). DNA methylation partially mediates the relationship between childhood adversity and depressive symptoms in adolescence. Available at: https://www.medrxiv.org/content/10.1101/2021.06.28.21259426v1 (Accessed July 3, 2021).
Smith, S. M., Jenkinson, M., Woolrich, M. W., Beckmann, C. F., Behrens, T. E., Johansen-Berg, H., et al. (2004). Advances in functional and structural MR image analysis and implementation as FSL. NeuroImage 23 (1), S208–S219. doi:10.1016/j.neuroimage.2004.07.051
Smith, S. M., and Brady, J. M. (1997). SUSAN—a new approach to low level image processing. Int. J. Comput. Vis. 23 (1), 45–78. doi:10.1023/a:1007963824710
Steinberg, L. (2005). Cognitive and affective development in adolescence. Trends Cognitive Sci. 9 (2), 69–74. doi:10.1016/j.tics.2004.12.005
Stephen, J. M., Solis, I., Janowich, J., Stern, M., Frenzel, M. R., Eastman, J. A., et al. (2021). The developmental chronnecto-genomics (Dev-CoG) study: A multimodal study on the developing brain. NeuroImage 225, 117438. doi:10.1016/j.neuroimage.2020.117438
Suzuki, S., Ayukawa, N., Okada, C., Tanaka, M., Takekoshi, S., Iijima, Y., et al. (2017). Spatio-temporal and dynamic regulation of neurofascin alternative splicing in mouse cerebellar neurons. Sci. Rep. 7 (1), 11405. doi:10.1038/s41598-017-11319-5
Tamnes, C. K., Herting, M. M., Goddings, A.-L., Meuwese, R., Blakemore, S.-J., Dahl, R. E., et al. (2017). Development of the cerebral cortex across adolescence: A multisample study of inter-related longitudinal changes in cortical volume, surface area, and thickness. J. Neurosci. 37 (12), 3402–3412. doi:10.1523/JNEUROSCI.3302-16.2017
Tiemeier, H., Lenroot, R. K., Greenstein, D. K., Tran, L., Pierson, R., and Giedd, J. N. (2010). Cerebellum development during childhood and adolescence: A longitudinal morphometric MRI study. NeuroImage 49 (1), 63–70. doi:10.1016/j.neuroimage.2009.08.016
Uhlén, M., Fagerberg, L., Hallström, B. M., Lindskog, C., Oksvold, P., Mardinoglu, A., et al. (2015). Proteomics. Tissue-based map of the human proteome. Science 347 (6220), 1260419. doi:10.1126/science.1260419
Walton, E., Hass, J., Liu, J., Roffman, J. L., Bernardoni, F., Roessner, V., et al. (2016). Correspondence of DNA methylation between blood and brain tissue and its application to schizophrenia research. Schizophr. Bull. 42 (2), 406–414. doi:10.1093/schbul/sbv074
Watanabe, K., Taskesen, E., van Bochoven, A., and Posthuma, D. (2017). Functional mapping and annotation of genetic associations with FUMA. Nat. Commun. 8, 1826. doi:10.1038/s41467-017-01261-5
Wenzel, A., Villa, M., Mohler, H., and Benke, D. (1996). Developmental and regional expression of NMDA receptor subtypes containing the NR2D subunit in rat brain. J. Neurochem. 66 (3), 1240–1248. doi:10.1046/j.1471-4159.1996.66031240.x
Wheater, E. N. W., Stoye, D. Q., Cox, S. R., Wardlaw, J. M., Drake, A. J., Bastin, M. E., et al. (2020). DNA methylation and brain structure and function across the life course: A systematic review. Neurosci. Biobehav. Rev. 113, 133–156. doi:10.1016/j.neubiorev.2020.03.007
Williams, A. L., Bielopolski, N., Meroz, D., Lam, A. D., Passmore, D. R., Ben-Tal, N., et al. (2011). Structural and functional analysis of tomosyn identifies domains important in exocytotic regulation. J. Biol. Chem. 286 (16), 14542–14553. doi:10.1074/jbc.M110.215624
Xu, L., Groth, K. M., Pearlson, G., Schretlen, D. J., and Calhoun, V. D. (2009). Source-based morphometry: The use of independent component analysis to identify gray matter differences with application to schizophrenia. Hum. Brain Mapp. 30 (3), 711–724. doi:10.1002/hbm.20540
Zanini, S., Martucci, L., Del Piero, I., and Restuccia, D. (2016). Cortical hyper-excitability in healthy children: Evidence from habituation and recovery cycle phenomena of somatosensory evoked potentials. Dev. Med. Child Neurology 58 (8), 855–860. doi:10.1111/dmcn.13072
Keywords: adolescent development, grey matter, methylation, neuroimaging epigenetics, cognition, sMRI
Citation: Jensen D, Chen J, Turner JA, Stephen JM, Wang Y-P, Wilson TW, Calhoun VD and Liu J (2023) Epigenetic associations with adolescent grey matter maturation and cognitive development. Front. Genet. 14:1222619. doi: 10.3389/fgene.2023.1222619
Received: 17 May 2023; Accepted: 30 June 2023;
Published: 17 July 2023.
Edited by:
Daniele Bertoglio, University of Antwerp, BelgiumReviewed by:
Xiguang Xu, Virginia Tech, United StatesCandace R. Lewis, Arizona State University, United States
Laurel Raffington, Max Planck Institute for Human Development, Germany
Copyright © 2023 Jensen, Chen, Turner, Stephen, Wang, Wilson, Calhoun and Liu. This is an open-access article distributed under the terms of the Creative Commons Attribution License (CC BY). The use, distribution or reproduction in other forums is permitted, provided the original author(s) and the copyright owner(s) are credited and that the original publication in this journal is cited, in accordance with accepted academic practice. No use, distribution or reproduction is permitted which does not comply with these terms.
*Correspondence: Dawn Jensen, djensen2@student.gsu.edu
†These authors have contributed equally to this work