 Hocheol Kim1Ji Hyun Yang1
 Danilo E. Bustamante2Martha S. Calderon3Andres Mansilla3
 Christine A. Maggs4Gayle I. Hansen5
 Hwan Su Yoon1*
- 1Department of Biological Sciences, Sungkyunkwan University, Suwon, South Korea
- 2Instituto de Investigación para el Desarrollo Sustentable de Ceja de Selva (INDES-CES), Universidad Nacional Toribio Rodríguez de Mendoza, Chachapoyas, Peru
- 3Laboratorio de Macroalgas Antárticas y Subantárticas, Universidad de Magallanes, Punta Arenas, Chile
- 4School of Biological Sciences, Queen’s University Belfast, Belfast, United Kingdom
- 5Marine Algal Biodiversity Research, Newport, OR, United States
The agarophyte Ahnfeltia (Ahnfeltiales, Rhodophyta) is a globally widespread genus with 11 accepted species names. Two of the most widespread species in this genus, A. plicata and A. fastigiata, may have diverged genetically due to past geographic changes and subsequent geographic isolation. To investigate this genomic and genetic diversity, we generated new plastid (ptDNAs) and mitochondrial genomes (mtDNAs) of these Ahnfeltia species from four different regions (A. plicata - Chile and UK and A. fastigiata - Korea and Oregon). Two architecture variations were found in the Ahnfeltia genomes: in ptDNA of A. fastigiata Oregon, the hypothetical pseudogene region was translocated, likely due to recombination with palindromic repeats or a gene transfer from a red algal plasmid. In mtDNA of A. fastigiata Korea, the composition of the group II intronic ORFs was distinct from others suggesting different scenarios of gain and loss of group II intronic ORFs. These features resulted in genome size differences between the two species. Overall gene contents of organelle genomes of Ahnfeltia were conserved. Phylogenetic analysis using concatenated genes from ptDNAs and mtDNAs supported the monophyly of the Ahnfeltiophycidae. The most probable individual gene trees showed that the Ahnfeltia populations were genetically diversified. These trees, the cox1 haplotype network, and a dN/dS analysis all supported the theory that these Ahnfeltia populations have diversified genetically in accordance with geographic distribution.
Introduction
The Florideophyceae is a species-rich (ca. 6,700 spp.) red algal class that has been divided into five subclasses: the Hidenbrandiophycidae, Nemaliophycidae, Corallinophycidae, Rhodymeniophycidae, and Ahnfeltiophycidae (Yoon et al., 2016). Among the five subclasses, the Ahnfeltiophycidae are unique in having a heteromorphic life cycle and cylindrical pit plugs without cap layers (Maggs and Pueschel, 1989). In molecular phylogenies, this subclass is the closest sister group to the taxon-rich Rhodymeniophycidae (Yang et al., 2016; Yoon et al., 2016), but the Ahnfeltiophycidae consists of only two genera: Ahnfeltia and the recently added microscopic Pihiella (Huisman et al., 2003; Kamiya et al., 2017; Guiry and Guiry, 2021). Species of Ahnfeltia live on intertidal and shallow sublittoral bedrock and form tangled branching tufts. Their thin and wiry branches are dark red or dark brown in color and divide in an irregularly dichotomous pattern (Rayment, 2004).
Ahnfeltia, the subject of this study, is commercially important as it is a valuable agarophyte, known for high-quality agar production with a low sulfate ratio (Chapman and Chapman, 1980; Truus et al., 2006; Zhang et al., 2019). The sulfate ratio of agar from Ahnfeltia plicata is less than half of that of the well-known agarophytes, Gelidium amansii and Gracilariopsis lemaneiformis (Zhang et al., 2019). Commercial production of agar from Ahnfeltia occurs in both Russia and Japan, and the agar is known as Itani agar in Japan and Sakhalin agar in Russia. In particular, 170,000–230,000 wet tons of Ahnfeltia are reported to be harvested annually in Russia (Titlyanov et al., 1999; Truus et al., 2006).
Allopatric divergence and speciation in populations is known to occur when geographic barriers such as mountains, rivers, and oceans block gene flow causing reproductive isolation. Numerous phylogeographic studies on macroalgal species have shown that divergence of these marine organisms is related to past climate and tectonic changes (Maggs et al., 2008; Yang et al., 2009; Boo et al., 2019; Bringloe et al., 2019; Yang et al., 2020). Repeated glaciation and deglaciation during the glacial periods are considered to be one of the main factors for macroalgal divergence (Maggs et al., 2008; Bringloe et al., 2019). For example, Bringloe and Saunders (2019) found that the trans-Arctic speciation of several red algae, including Ahnfeltia, occurred following range extensions from the North Pacific to the North Atlantic during the Pleistocene after the opening of the Bering Strait.
Past geographic events and subsequent geographic isolation during the glacial period may also have accelerated the genomic and genetic divergence of Ahnfeltia. The Ahnfeltiophycidae is estimated to have diverged around 500 million years ago (Mya) and speciation events took place 2-5 Mya (Yang et al., 2016; Bringloe and Saunders, 2019). Ahnfeltia plicata is a cold temperate species distributed in both the North Atlantic and the South Pacific including Australia and Chile (Maggs and Pueschel, 1989; Milstein and Saunders, 2012). After deglaciation, the equator appears to have acted as a geographic barrier since high temperatures are not favorable for the growth of Ahnfeltia (Lüning and Freshwater, 1988; Mansilla et al., 2014). Ahnfeltia fastigiata is distributed along the coasts of the Northeast (NE) and Northwest (NW) Pacific (Lee and Kang, 2001; Milstein and Saunders, 2012). In East Asia, several places appear to be macroalgal refugia, isolated due to tectonic events and changes in current circulation patterns after glacial periods (Yang et al., 2009; Hu et al., 2011; Boo et al., 2019; Yang et al., 2020). This may have affected the genomic diversity of A. fastigiata in these areas.
Studies that cover population genomics, taxonomy, phylogenomics, and evolution often require large datasets. Recently, these have been greatly facilitated by the methods used for next generation sequencing (NGS) since these methods can examine and analyze extensive arrays of data. This is particularly useful for data obtained from organelle genomes (Smith and Keeling, 2015). In previous studies, mitochondrial (Yang et al., 2015) and plastid (Lee et al., 2016a) genomes from a number of diverse red algal orders were assembled and used to elucidate the complete evolutionary history of these lineages. However, only one plastid genome (ptDNA—NC_031145) and one mitochondrial genome (mtDNA—NC_026054) of A. plicata from Chile have been available in the NCBI database (Yang et al., 2015; Lee et al., 2016a). In order to add to this dataset and begin to test our geographic theories, we generated new ptDNAs and mtDNAs for both A. plicata and A. fastigiata, each from two different remote geographic regions. This gave us the opportunity to analyze and evaluate the influence of geographic isolation on the genomic and genetic divergence of Ahnfeltia organelle genomes.
Materials and Methods
Sample Collection and Preparation
Four populations of fresh Ahnfeltia thalli were sampled by snorkeling or collecting from tidepools in intertidal zones in the following regions. A. plicata populations were sampled from Seno Skyring, Magallanes, Chile (52°32′45.1″S 71°56′46.3″W), and Freshwater West, Pembrokeshire, Wales, UK (51°39′35.9″N 5°03′52.2″W). A. fastigiata samples were collected from Baeknyeong island in Yellow Sea, Republic of Korea (37°59′01.3″N 124°41′54.0″E), and Seal Rock, Oregon, USA (44°29′48.5″N 124°05′07.5″W) (Figure 1A). The collected samples were placed in seawater in plastic bags or 50 ml conical tubes (SPL Life Sciences, Gyeonggi-do, South Korea) and stored in an icebox for transfer to the laboratory. Attached eukaryote contaminants such as small barnacles and other epiphytes were manually removed with forceps. Samples were then wiped using a brush and washed with sterilized seawater to prevent further contamination.
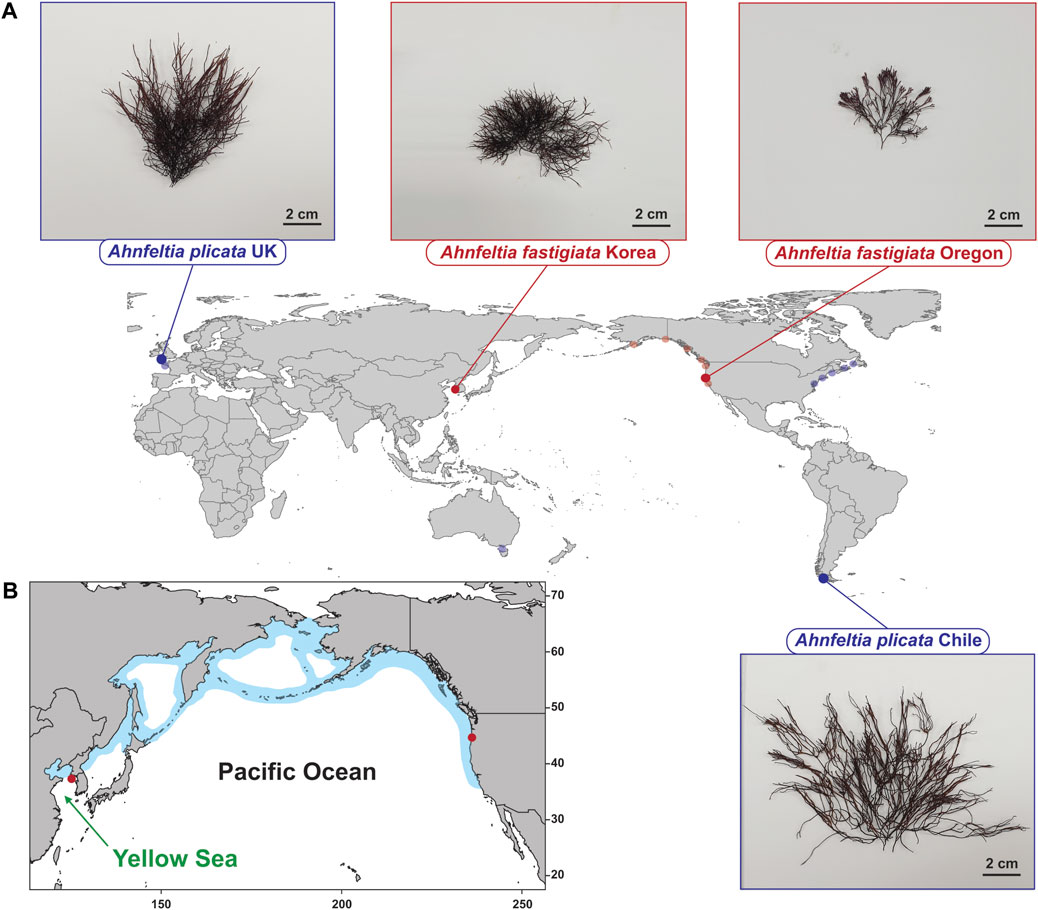
FIGURE 1. (A) Collection sites of Ahnfeltia. A. plicata were collected in Seno Skyring, Magallanes, Chile and Freshwater West, Pembrokeshire, Wales, UK to compare the genetic and genomic diversity between the Northern hemisphere and Southern hemisphere strains. A. fastigiata were collected in Baeknyeong island, Korea and Seal Rock, Oregon, USA to compare the NE Pacific and the NW Pacific strains. Translucent dots represent sampling sites of rbcL and cox1 data from NCBI database and Milstein and Saunders’ study (2012) that were used for rbcL phylogeny and cox1 haplotype network in this study. (B) Distribution of A. fastigaiata based on Algaebase information (Guiry and Guiry, 2021).
DNA Extraction and Species Identification Using rbcL Phylogeny
Total genomic DNAs of each population were extracted with a modified cetyltrimethylammonium bromide (CTAB) protocol (Doyle and Doyle., 1987). To confirm the species, rbcL genes were determined before genome sequencing. The rbcL marker, which encodes the ribulose-1,5-bisphosphate carboxylase large subunit, is the most widely used in species identification in the red algae (Saunders and Moore, 2013). The rbcL primers were F57 and rbcLrevNew described in Freshwater and Rueness (1994) and Saunders and Moore (2013). Amplified DNAs were purified using the LaboPass™ PCR Purification Kit (COSMO Genetech, Seoul, Republic of Korea). PCR products were sent for sequencing to Macrogen (Seoul, Republic of Korea). After a quality check, the forward and reverse sequences were merged using Geneious prime 2020.0.4 (https://www.geneious.com). For phylogenetic analysis, published rbcL sequences of Rhodymeniophycidae and Ahnfeltia were obtained from NCBI (see accession number of each taxon in Supplementary Table S1), and alignments for all sequences were conducted with MAFFT v7.310 (Katoh and Standley, 2013). A maximum likelihood (ML) phylogenetic tree was reconstructed by IQ-TREE v.1.6.8 with 1,000 ultrafast bootstrap replications (-bb 1000) and model test option (-m TEST) (Nguyen et al., 2015).
Whole Genome Sequencing, Genome Assembly, and Gene Annotation
Approximately 30 μg of genomic DNA from each population were sent to DNA-link Inc. (Seoul, Republic of Korea) for whole genome sequencing. PacBio Sequel I (Pacific Biosciences, Inc., Menlo Park, CA, USA) and Illumina Nova Seq 6000 (Illumina, San Diego, USA) platforms were used to generate long- and short-read raw data, respectively. Organelle genome assembly for each population was conducted with two methods using short and long reads data. Before using Illumina data, low-quality reads were eliminated using Trimmomatic v0.39 (Bolger et al., 2014). NOVOPlasty assembler was used for organelle assembly using short reads (Dierckxsens et al., 2017). Flye assembler was used for long reads (Kolmogorov et al., 2019). To complete partially assembled organelle genomes and check the accuracy of assembled organelle genomes, initial assembled genomes and contigs from NOVOPlasty were compared with results from Flye assembler using Geneious prime 2020.0.4 (https://www.geneious.com). Assembled genomes were corrected by Pilon (Walker et al., 2014). Primary gene annotation was conducted on GeSeq server, which provides the annotation for organelle genomes based on published genomes (Tillich et al., 2017). Protein coding genes (CDS) were manually double-checked by blasting primary annotated CDSs on NCBI and comparing them to CDSs of published ptDNA (NC_031145) and mtDNA (NC_026054) of A. plicata (Yang et al., 2015; Lee et al., 2016a). Annotated tRNAs were double-checked on the ARAGORN website (Laslett and Canback, 2004). rRNAs were searched on the RNAmmer 1.2 website and compared with published genomes (Lagesen et al., 2007).
Genome Correction for ptDNA of A. plicata NC_031145
Both short and long read assembly results showed that the direction of the small single copy (SSC) region of ptDNAs was opposite to the published ptDNA of A. plicata (NC_031145). Because the published A. plicata ptDNA was based on a collection from Magallanes, Chile, and generated based on the short-read Ion Torrent PGM platform (Lee et al., 2016a) by this research group, we investigated an assembly error in the published A. plicata ptDNA (NC_031145). The direction of the SSC region was confirmed by PCR and Sanger sequencing. Specific primers were manually produced using Geneious prime 2020.0.4 (https://www.geneious.com). Detailed information on PCR locations and primers for IR regions is provided in the supplementary information (Supplementary Table S2). PCRs were carried out using the KOD DNA polymerase (TOYOBO, Osaka, Japan). Isoforms that are different in the direction of the SSC region between inverted regions (IRs) caused by flip-flop recombination have been reported in the ptDNA of green algae and land plants (Stein et al., 1986; Day and Madesis, 2007; Turmel et al., 2017; Kim et al., 2019). However, we were not able to find “flip-flop” forms in Ahnfeltia (Supplementary Figure S1).
Phylogenetic Analyses
To construct phylogenetic trees with concatenated genes from organelle genomes, ptDNAs and mtDNAs genes were collected from Ahnfeltia genomes as well as all available organelle genomes of Florideophyceae and Bangiophyceae as an outgroup (see accession number for each genome in Supplementary Tables S6, S7). 130 plastid protein coding genes from 149 ptDNAs and 11 mitochondrial protein coding genes from 103 mtDNAs were used for the phylogenomic analysis following a method described in Lee et al. (2016a). Translated protein sequences of genes were aligned with MAFFT v7.310 (Katoh and Standley, 2013). ML phylogenetic trees were constructed with IQ-TREE v1.6.8 with 1,000 ultrafast bootstrap replications (-bb 1000) and the test model (-m TEST) (Nguyen et al., 2015).
Since different compositions of group II intronic ORFs in mtDNAs were found in the Ahnfeltia populations, we conducted a phylogenetic analysis with ML phylogenetic trees to find the origin. Homologous group II intronic ORFs were obtained from the NCBI protein database (nrDB) using MMseqs2 (Steinegger and Söding, 2017). Mitochondrial group II intronic ORFs were aligned using MAFFT v7.310 (Katoh and Standley, 2013). ML trees were constructed with IQ-TREE v1.6.8 with 1,000 ultrafast bootstrap replications (-bb 1000) and the test model option (-m TEST) (Nguyen et al., 2015).
Plastid and Mitochondrial Genome Analyses
Assembled organelle genome maps were drawn using the OGDRAW v1.3.1 server (Greiner et al., 2019). Results of OGDRAW were manually modified to clearly compare locations of group II intronic ORFs in mtDNAs. The comparison of ptDNAs was conducted with the progressiveMauve algorithm of Mauve v2.3.1 (Darling et al., 2010). The visualization of backbone files and tree files was performed using genoplotR (Guy et al., 2010). Tandem repeat analysis was conducted on the REPuter server (Kurtz et al., 2001). Tandem repeats were collected over 20 base pairs. The visualization of repeats with assembled ptDNAs was conducted with CIRCOS (Krzywinski et al., 2009) and DNAplotter (Carver et al., 2009). The red algal plasmid network was constructed using EGN (Halary et al., 2013) and Cytoscape (Shannon et al., 2003) with results of BLASTx searches for hypothetical genes in A. plicata and hypothetical pseudogenes in A. fastigiata.
dN/dS Analysis
Non-synonymous substitutions (dN), synonymous substitutions (dS), and dN/dS ratio were calculated to estimate the evolutionary selection pressure on CDSs in organelle genomes of Ahnfeltia. CDSs from each genome were extracted using a python script. These were then aligned using MAFFT v7.310 (Katoh and Standley, 2013). Aligned fasta files were converted to AXT files using a perl script (parseFastaIntoAXT.pl), and KaKs calculator 2.0 was used for dN, dS, and dN/dS calculation (Wang et al., 2010). Calculated values were plotted using ggplot2 in R (Wickham, 2016). Outliers in boxplots were eliminated following the IQR rule.
Evaluation of Gene Tree Conflicts and cox1 Haplotype Network
To check for incomplete lineage sorting and gene tree conflict, we compared all possible individual gene trees from ptDNAs and mtDNAs with the species tree from the concatenated gene dataset. Based on Smith et al. (2015), basic steps were followed as Matt Johnson described at a Kew Royal Botanic Gardens workshop (https://github.com/mossmatters/KewHybSeqWorkshop). All individual gene trees were first constructed with the outgroup Rhodymeniophycidae using IQ-TREE v1.6.8 with 1,000 fast bootstrap replications (-b 1000) and model test option (-m TEST) (Nguyen et al., 2015). A coalescent tree was generated using ASTRAL-II (Mirarab and Warnow, 2015) and pie charts were constructed using phyparts (Smith et al., 2015). Lastly, gene trees were cut off if they had under 80% bootstrap support.
We also constructed a cox1 haplotype network to evaluate genetic variation based on geographic distribution. We compared cox1 sequences of the four new Ahnfeltia populations with the COI-5P results of Milstein and Saunders (2012), which used 99 sequences of A. plicata and 30 sequences of A. fastigiata. Alignment was conducted with MAFFT v7.310 (Katoh and Standley, 2013), and the haplotype network was constructed using PopART with integer neighbor-joining networks (Leigh and Bryant, 2015).
Results
Our studies revealed a wide array of similarities and differences between the species and the geographic populations.
General Feature of ptDNAs
The genome sizes of the four assembled ptDNAs of Ahnfeltia were 191–194 kb. Specifically, the ptDNA of A. plicata Chile was 191,622 bp, A. plicata UK was 191,647 bp, A. fastigiata Korea was 194,202 bp, and A. fastigiata Oregon was 193,253 bp. The ptDNAs of A. fastigiata were larger than those of A. plicata (Table 1). Overall GC contents of each genome were almost the same: 32.2–32.7%. The number of rRNA, tmRNA, and introns were also the same: 6, 1, and 1, respectively. There were 205 and 204 CDSs in A. plicata and A. fastigiata, respectively, the difference being the result of having one additional hypothetical protein in A. plicata, which was pseudogenized with a nonsense mutation in A. fastigiata. There were 33 tRNAs in A. plicata Chile, A. plicata UK, and A. fastigiata Korea but 32 in A. fastigiata Oregon due to one missing tRNA (trnI-GAU) between 16S rRNA (rrn16) and 23S rRNA (rrn23) in an inverted repeat region.
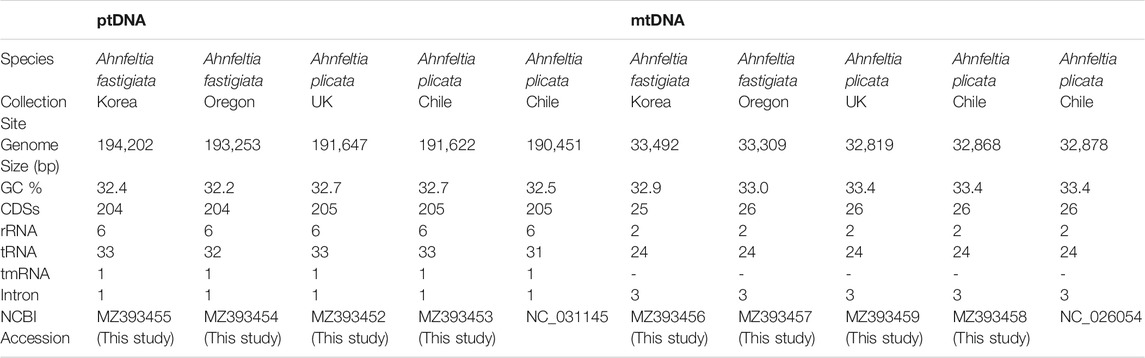
TABLE 1. General genomic feature of ptDNAs and mtDNAs of Ahnfeltia.
Translocation and Genome Expansion in ptDNAs of A. fastigiata
Plastid genome architectures of the Ahnfeltia samples were almost identical, but one regional difference was found in A. fastigiata Oregon. In the Mauve whole genome alignment, the hypothetical protein pseudogene was translocated to the LSC region in A. fastigiata Oregon but was located in the SSC region in other strains. Figure 2A shows the comparative ptDNA structure with the translocations from the original position 1 to the new position 3 in A. fastigiata Oregon. In addition, genome expansion mainly occurred around the hypothetical protein pseudogene regions in A. fastigiata (Figures 2A, D). Palindromic tandem repeats were accumulated around hypothetical protein pseudogene regions in A. fastigiata (Figure 2B). Sequences from this region were homologous with red algal plasmids and they were particularly close to Agarophyton plasmids (Figure 2C).
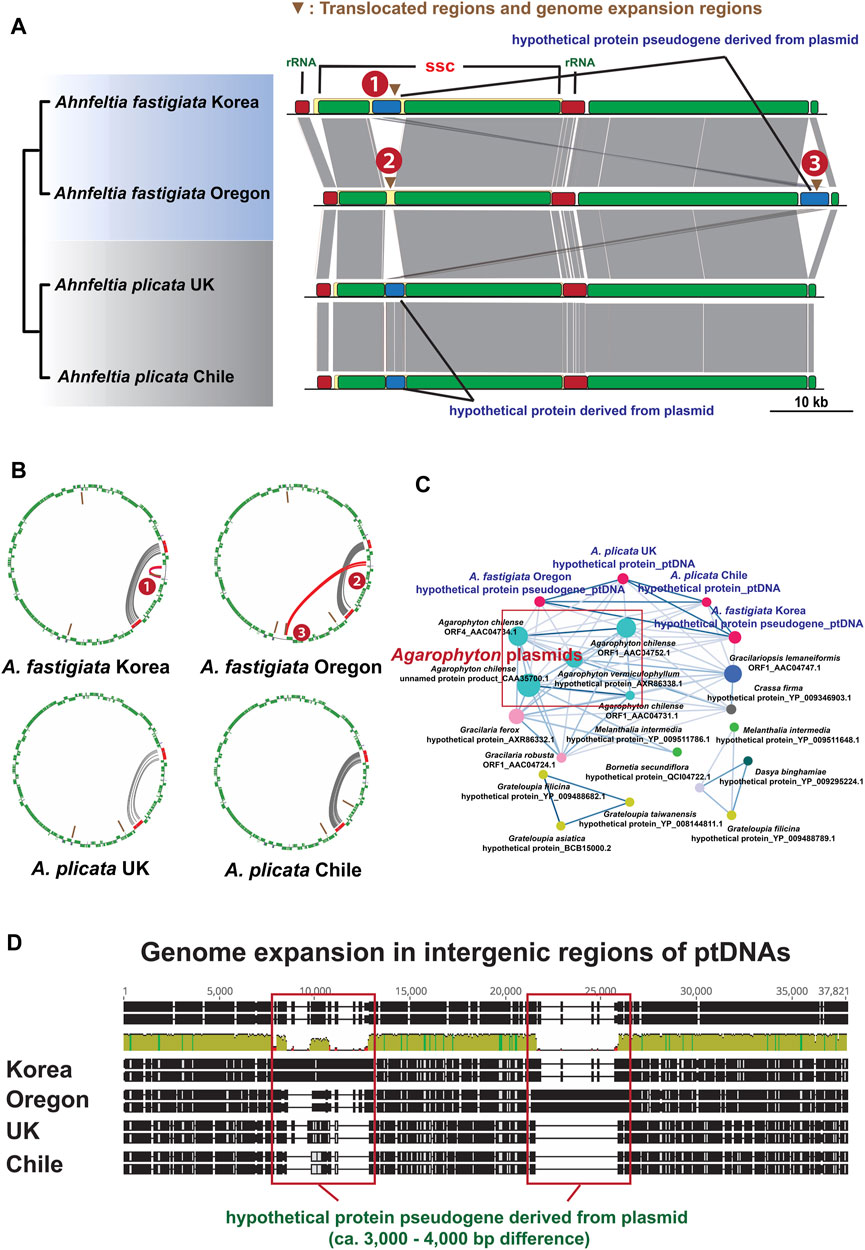
FIGURE 2. (A) Mauve alignment of ptDNAs of Ahnfeltia. Hypothetical protein pseudogene region in SSC region was translocated in A. fastigiata Oregon (From 1 to 3) and genome expansion also occurred in this region. (B) Tandem repeat analysis results and circular plot showing that tandem repeats were mainly accumulated in inverted ribosomal operon regions (IRs; Grey lines) as well as in the translocated regions of A. fastigiata (Red lines). (C) Cytoscape network of hypothetical protein genes in A. plicata and hypothetical protein pseudogene in A. fastigiata. All genes and pseudogene had a homology with red algal plasmids such as Agarophyton plasmids. (D) Alignments of intergenic regions of ptDNAs showing genome extended regions. About 3,000–4,000 base pairs were different around hypothetical protein pseudogene regions in ptDNAs, which made the ptDNA sizes of A. fastigiata larger than those of A. plicata.
General Feature of mtDNAs
The mtDNAs size of Ahnfeltia were 32–33 kb: 32,868 bp (A. plicata Chile), 32,819 bp (A. plicata UK), 33,492 bp (A. fastigiata Korea), and 33,309 bp (A. fastigiata Oregon). The number of CDSs was 26 in A. plicata Chile, A. plicata UK, and A. fastigiata Oregon, but there were only 25 CDSs in A. fastigiata Korea due to a pseudogenized intronic ORF in cox1 (orf780 in this study). GC contents were very similar, 32.9–33.4%. The numbers of rRNA, tRNA, and introns were the same in all taxa, 2, 24, and 3, respectively (Table 1).
Different Group II Intron Composition in mtDNA
A distinct difference among the mtDNAs of Ahnfeltia was in the group II intronic ORF composition in 23S rRNA (rrn23) and cox1. In A. plicata Chile, A. plicata UK, and A. fastigiata Oregon, a group II intronic ORF, a maturase, existed in rrn23, and another group II intronic ORF, orf729, was present in cox1. In contrast, in A. fastigiata Korea, the maturase was absent in rrn23, but two group II intronic ORFs, orf729 and orf780, existed in cox1. Additionally, there was genome expansion in cox1 group II intronic ORF (orf729) in both A. fastigiata Oregon and Korea. The nonsense mutation was found in orf780 in cox1 of A. fastigiata Korea (Figure 3A). To trace the origin of group II intronic ORFs, we conducted a phylogenetic analysis, which revealed that group II intronic ORFs in mtDNAs had three different origins. Maturases showed a close relationship to cyanobacteria, while orf729 and orf780 were close to the bacteria but in different clades. Furthermore, orf780 had a monophyletic relationship with group II intronic ORF of the Bangiophyceae (Supplementary Figure S2).
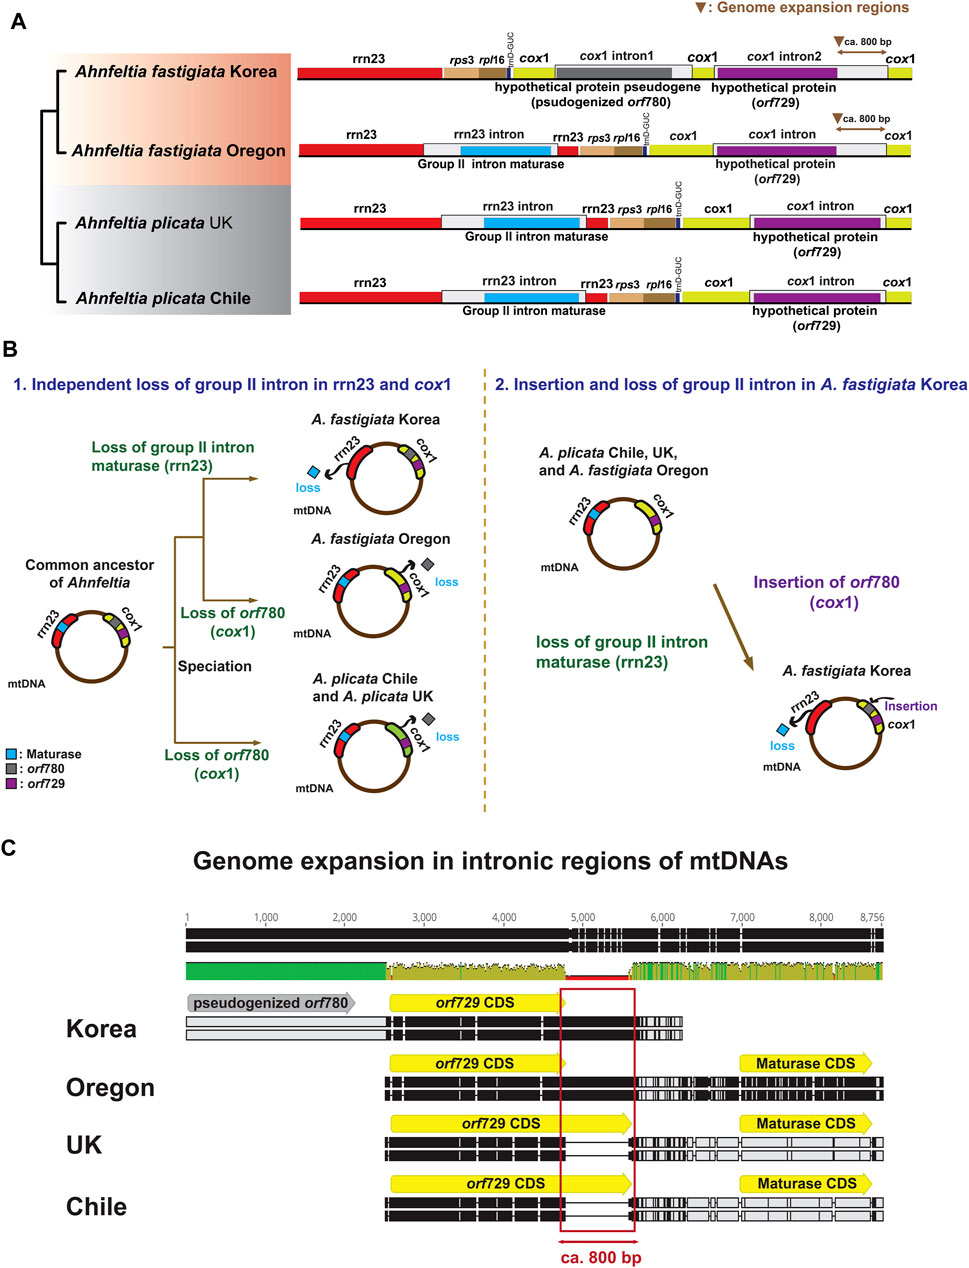
FIGURE 3. (A) OGDRAW plots of group II intronic ORF in mtDNAs of Ahnfeltia. A maturase existed in 23S rRNA (rrn23) and orf729 was present in cox1 in A. plicata Chile, A. plicata UK, and A. fastigiata Oregon. Two group II intronic ORFs orf729 (cox1) and orf780 (cox1) existed in cox1 in A. fastigiata Korea. Genome expansion occurred in orf729 (cox1) in A. fastigiata. (B) Two scenarios for different group II intronic ORFs composition in mtDNAs of Ahnfeltia. In first scenario, from a common ancestor, three groups might have lost the maturase and orf780, independently. In second scenario, A. fastigiata Korea might have lost the maturase and gained orf780. (C) Alignments of intronic regions of mtDNAs showing genome extended regions. About 800 base pairs were different in orf729s, which made the mtDNA sizes of A. fastigiata larger than those of A. plicata.
Phylogenetic Relationships and cox1 Haplotype Network
Three separate clades (i.e., A. borealis, A. fastigiata, and A. plicata) were supported in the rbcL gene phylogeny with the currently available six sequences in the NCBI database. Within the A. fastigiata clade, there was distinct rbcL divergence between sequences from Korea and Oregon (Figure 4A). The cox1 haplotype network also showed that genetic divergence occurred among the four Ahnfeltia populations. In the A. fastigiata haplotype network, A. fastigiata Korea had an independent haplotype segregated from the NE Pacific haplotype groups. In the A. plicata haplotype network, A. plicata Chile and A. plicata UK were in two different haplotype groups (Figure 4B). Phylogenetic trees with concatenated genes from ptDNAs and mtDNAs were congruent with each other and supported currently accepted phylogenetic relationships among the five subclasses in the Florideophyceae (i.e., Hildenbrandiophycidae, Nemaliophycidae, Corallinophycidae, Ahnfeltiophycidae, and Rhodymeniophycidae) (see Supplementary Figures S3, S4). Within the Ahnfeltia clade, concatenated gene trees of both ptDNAs and mtDNAs showed a clear separation between A. plicata and A. fastigiata. To test if the individual gene trees support the concatenated tree, we compared all possible individual gene trees; 197 genes of ptDNA and 23 genes of mtDNA were tested. 180 ptDNA genes and 22 mtDNA genes supported the monophyly of Ahnfeltiophycidae, while 108 and 72 ptDNA genes supported the monophyly of A. plicata and A. fastigiata, respectively. In addition, 14 and 13 mtDNA genes supported the monophyly of A. plicata and A. fastigiata, respectively (Figure 4C).
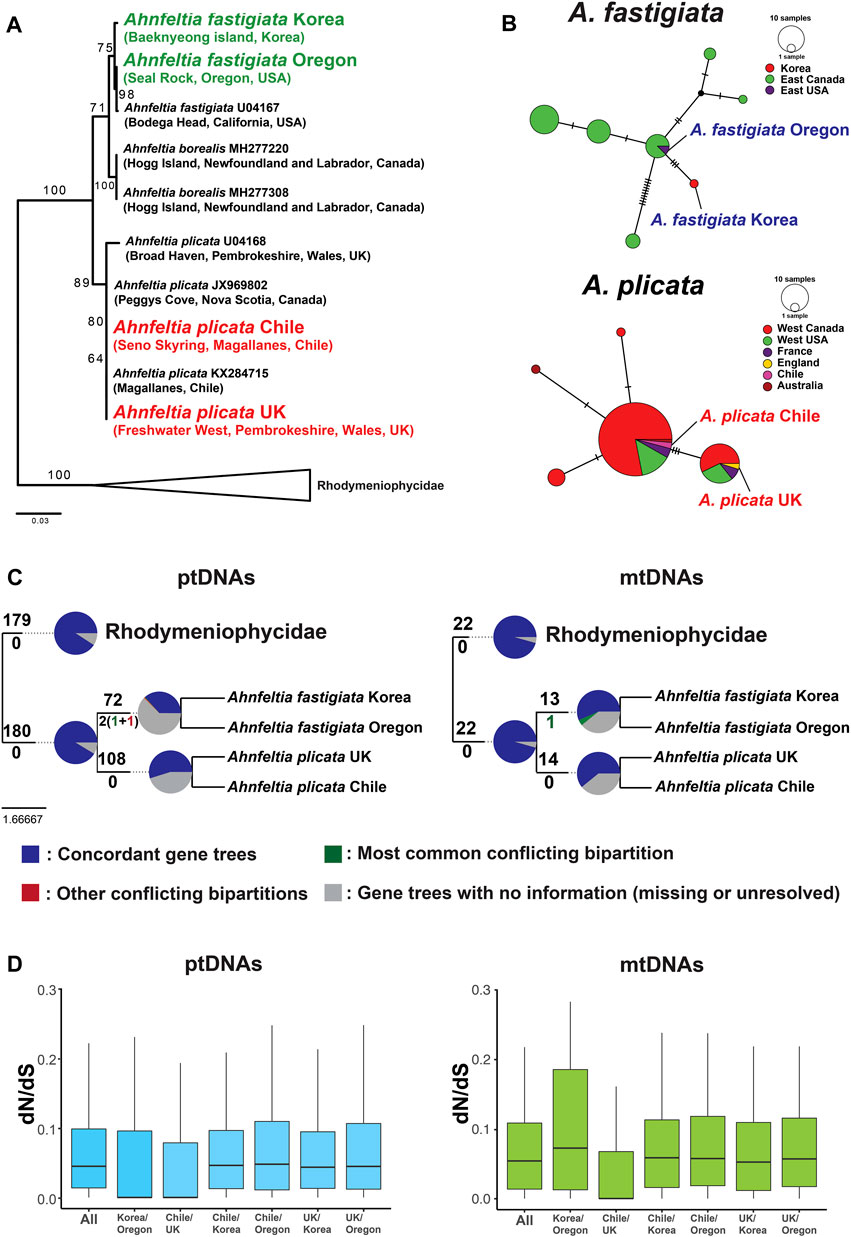
FIGURE 4. (A)rbcL phylogeny using currently available rbcL sequence of Ahnfeltia on NCBI database. Maximum likelihood (ML) bootstrap values (≥50%) are shown at each node. (B)cox1 haplotype network with COI-5P data of Milstein and Saunders (2012). (C) Result of gene tree conflict analysis using ptDNA genes and mtDNA genes of Ahnfeltia. In pie charts at each node, the proportion of concordant genes trees within the clade defined by the node is marked in blue and the proportion of discordant gene trees within the clade are marked in green and red. The proportion of main alternatives for the clade are green and the proportion of all other alternatives for the clade are red. The proportion of homologs with less than 80% bootstrap support are grey. (D) Boxplots of the average of dN/dS values of ptDNA genes and mtDNA genes. The average of dN/dS of intraspecies appeared to be lower than that of interspecies, but all results were not statistically significant.
Non-Synonymous Substitution (dN) and Synonymous Substitution (dS) Ratio
Generally, dN/dS ratios of ptDNA genes were similar to those of mtDNA genes (Figure 4D). dN/dS values from the interspecific comparison were higher than those from the intraspecific comparisons, but they were not statistically significant. dN/dS of most genes from ptDNAs and mtDNAs showed a purifying selection (dN/dS < 1). Several genes had likely undergone positive selection in dN/dS analysis (e.g., atpG, ftrB, ntcA, psaD, psaE, psaI, rpl36, etc.). However, in most cases, the outliers likely resulted from biases caused by their short sequence length (e.g., psaI, rpl36 rpoZ, ycf33, etc.) and the highly conserved genes within species (e.g., atpG, ntcA, psaD, etc.). In contrast, psaE showed a strong positive selection (dN/dS > 1) (Supplementary Table S4). Synonymous substitution (dS) genes occurred more frequently than non-synonymous substitutions (dN) in ptDNAs and mtDNAs of the four Ahnfeltia strains (Supplementary Figure S5). Overall dN and dS values of mtDNA genes were higher than those of ptDNA genes, indicating that mtDNA genes have diversified more dynamically than ptDNA genes (Supplementary Figure S5, Supplementary Tables S4, S5). dN and dS of ptDNA genes in A. fastigiata were generally higher than those in A. plicata, but not statistically significant than those in A. plicata (Supplementary Figures S5C, S5E).
Discussion
Variations of Organelle Genome Architecture
Our study showed that two events of genome architecture variation happened in Ahnfeltia: the translocation of the pseudogenized hypothetical protein region in ptDNA of A. fastigiata Oregon, and the different composition of group II intronic ORF in mtDNA of A. fastigiata Korea. These genomic variations were distinct features of the organelle genomes of Ahnfeltia, but variations in organelle genome structures did not occur between the two Ahnfeltia species, A. fastigiata and A. plicata. This suggested a relatively recent speciation event perhaps 2-5 Mya (Bringloe and Saunders, 2019). In contrast, structures of ptDNAs and mtDNAs in A. fastigiata from two different populations (i.e., A. fastigiata Korea and Oregon) were different, suggesting different intraspecific selection pressures on different organelles. Based on these results, we postulate that geographic distribution in the North Pacific may have strongly influenced the divergence of organelle genomes of A. fastigiata. Several biogeographic studies have revealed high genetic diversity of marine organisms in the North Pacific and have shown a deep genetic separation within amphi-North Pacific taxa (Kai et al., 2011; Yang et al., 2020). In particular, Yang et al. (2020) showed a clear genetic diversity between the NE Pacific and NW Pacific Gloiopeltis furcata strains. They also suggested that East Asia in the NW Pacific is a genetic diversity hotspot.
A. fastigiata Korea was collected only from the westernmost island of South Korea in the Yellow Sea between the Western Korean peninsula and Eastern China. This island appeared to be acting as a refugium, possibly enabling the divergence of A. fastigiata after a marine transgression to the North Yellow Sea after the last glacial maximum in the late Pleistocene. Since Ahnfeltia is adapted to colder water (Lüning and Freshwater, 1988; Mansilla et al., 2014), the warm Kuroshio and Yellow Sea currents may have acted as an environmental barrier to isolate the Yellow Sea A. fastigiata population (Figure 1B). This geographic isolation may have led to the differentiation of the genomic architecture of A. fastigiata. Several studies have reported that marine organisms in the Yellow Sea have distinct genetic diversity compared to organisms in other East Asian regions, perhaps due to the past fluctuation of sea level during glacial periods and present-day geographic barriers including warm currents and freshwater inflow (Yang et al., 2009; Hu et al., 2011; Boo et al., 2019). A phylogeographic study of Phoca largha (spotted seals) revealed a distinct genetic signature in populations from the Yellow Sea and Japan (Li et al., 2010). The spotted seal shows an isolated discontinuous distribution similar to that seen in populations of A. fastigiata in the northern Yellow Sea and along the NE Pacific coast (Park et al., 2010). To clarify this postulation, further phylogeographic study on A. fastigiata is needed in future.
Putative Translocation Mechanism of ptDNAs
To find out why and how translocation happened in A. fastigiata Oregon, we first investigated repeat elements around the translocated regions of four Ahnfeltia ptDNAs. Translocation of organelle genomes or organelle genome recombination has frequently happened in many organisms including algae (Kawata et al., 1997; Lin et al., 2015; Choi et al., 2020). Palindromic tandem repeats are thought to function as a hotspot for genome recombination, because they can form hairpin structures following the recombination of complementary sequences (Kawata et al., 1997; Day and Madesis, 2007). Here, palindromic repeats were found to accumulate around translocated regions (Figure 2B). Therefore, it is probable that the translocation of pseudogenized hypothetical protein regions in A. fastigiata Oregon was mediated by palindromic repeats.
Another possible explanation for translocated regions of ptDNAs in A. fastigiata Oregon relates to red algal plasmids. Plasmids are mobile elements that carry DNA fragments that are involved in organelle genome recombination (Day and Madesis, 2007; Wiedenbeck and Cohan, 2011; Bhattacharya et al., 2018). Lee et al. (2016b) reported several cases of plasmid-mediated horizontal gene transfer, which were found in the organelle genomes of red algae. The hypothetical protein genes in A. plicata and the complementary pseudogenized hypothetical protein in A. fastigiata are both homologous to the red algal plasmid genes (Figure 2C). Thus, it can be assumed that these hypothetical protein genes were derived from red algal plasmids, followed by pseudogenization in A. fastigiata. An interesting point was that intergenic regions of different lengths were found around the hypothetical protein genes and pseudogenes. In A. plicata strains, short extra sequences were found around the conserved hypothetical protein genes. In contrast, the hypothetical protein genes in A. fastigiata strains had a long extended intergenic region (ca. 3,000–4,000 bp) with a nonsense mutation. This suggests that a hypothetical protein was horizontally introduced by plasmids into the ancestor of the two species; then, the extension of the intergenic region (including homologous tandem repeat copies) in A. fastigiata led to the translocation of the hypothetical proteins in A. fastigiata Oregon. These sudden plasmid-mediated events are distinguished from conventional cumulative mutations (e.g., haplotype variations of Ascophyllum nodosum between the east and west Atlantic, Olsen et al., 2010).
Gene Gain and Loss Scenarios of Group II Intron in mtDNA
Group II introns, which have been reported in bacteria and organelle genomes, are known to be catalytic ribozymes and mobile elements that enable self-splicing (Lambowitz and Zimmerly, 2004; Zimmerly and Semper, 2015). Group II introns generally include hypothetical proteins (ORF) and maturase in their organelle genomes (Janouškovec et al., 2013; Lee et al., 2016b). Group II intronic ORFs are proliferated in plastid and mitochondrial genomes of green algae and land plants (Del Vasto et al., 2015; Brouard et al., 2016; Repetii et al., 2020) as well as in many red algae (Perrineau et al., 2015; Yang et al., 2015). However, it still remains unclear how intronic ORFs originated and how they degenerate.
In our study, three different group II intronic ORFs were annotated in mtDNAs: orf729 and orf780 in cox1, and maturase in rrn23 (Figure 3A). The phylogenetic analysis revealed that these three group II intronic proteins were independently derived (Supplementary Figure S2). Phylogenetic analysis indicated that Ahnfeltia had an independent gene gain or loss in group II intron regions during diversification. Based on these analyses, we suggest two scenarios for intronic ORFs evolution in mtDNAs (Figure 3B).
The first scenario is three independent losses of maturase and orf780 (Figure 3B-1). A common ancestor that contained maturase, orf729, and orf780 (in the group II introns in rrn23 and in cox1, respectively) could have lost maturase from rrn23 group II introns of A. fastigiata Korea, and then also had a minimum of two independent orf780 gene losses in cox1 (i.e., one in A. fastigiata Oregon, the other in the ancestor of A. plicata). Most group II introns in organelle genomes have lost their self-splicing ability because of the accumulation of nonsense transcripts (Zimmerly and Semper, 2015; Bateman, 2020). Thus, if settled group II introns had lost their self-splicing ability in the common ancestor of Ahnfeltia, it is more plausible that the redundant group II introns gene loss happened through a differently operated DNA repair system rather than acquisition of introns from external sources.
The second scenario is one gain and one loss in A. fastigiata Korea (Figure 3B-2). In this scenario, we can speculate that A. fastigiata Korea independently gained orf780 in cox1 and lost maturase in rrn23, while the other Ahnfeltia population retained maturase in rrn23. This scenario is a common explanation based on the mobility of the group II intron (Lambowitz and Zimmerly, 2004; Doolittle, 2014; Zimmerly and Semper, 2015). Because the phylogeny of the intronic ORFs showed that orf780 was grouped with Bangia and Pyropia species (Bangiophyceae) (Supplementary Figure S4), gene transfer could have occurred from epiphytic Bangiophycean species living on the surface of other red algae. This second scenario of two evolutionary events is more parsimonious than the first scenario of three evolutionary events.
Organelle Genome Expansion and Variation
Assembled organelle genomes of Ahnfeltia revealed that genome sizes of both ptDNAs and mtDNAs in A. fastigiata are a bit larger than those in A. plicata. One clear point is that the genome size difference of Ahnfeltia is due to lengths of intergenic regions of the ptDNAs and intronic regions of the mtDNAs (Supplementary Table S2). For the first time, we investigated tandem repeat elements because repeat elements are often considered the main factor for genome expansion (Del Vasto et al., 2015; Repetii et al., 2020; Smith, 2020). Even though they contribute to overall genome expansion, tandem repeats themselves cannot solely explain the genome size difference between the two species (Supplementary Figure S6). We also aligned intergenic and intronic regions of the genomes. The alignment of ptDNAs clearly showed that pseudogenized hypothetical protein regions derived from red algal plasmids in A. fastigiata were ca. 3,000–4,000 bp larger than homologous regions in A. plicata (Figure 2D). Moreover, the alignment of mtDNAs revealed that the sequence of cox1 group II intronic ORF (orf729) of A. fastigiata remained ca. 800 bp longer than that of A. plicata (Figure 3C). Thus, these differences resulted in genome size variation between two species.
Organelle genome expansion in non-coding regions (i.e., intronic and intergenic regions) has been reported from diverse algal lineages (Smith et al., 2010; Del Vasto et al., 2015; Repetii et al., 2020). Organelle genome variation and expansion in non-coding regions have been explained by neutral mutation and random genetic drift rather than natural selection (Kimura, 1968; Smith, 2016). In particular, the mutational hazard hypothesis (MHH) suggests that excess DNA can be a mutational liability that accounts for the accumulation of hazardous DNA sequence in genomes of organisms with a low mutation rate (μ) and small effective population size (Ne) (Lynch et al., 2006; Smith, 2016). Moreover, (Christensen, 2013; Christensen, 2014) suggests that different DNA repair mechanisms function between coding regions and neutral mutated non-coding regions after double-strand break DNA, which can induce genomic expansion and rearrangement. Therefore, organelle genome differences in Ahnfeltia might have occurred since the neutral mutation (following the MHH hypothesis) had occurred in sequences that originated externally in non-coding regions. Then the repair system operated differently in each taxon when they speciated and diversified. The finding of plasmid-derived hypothetical protein pseudogenes in ptDNAs and pseudogenized group II intronic-derived ORF (orf780) in mtDNAs of A. fastigiata also indicates that the exotic genes will be degraded in organelle genomes.
Genetic Divergence of Coding Genes
The coding gene contents of Ahnfeltia mtDNAs and ptDNAs were relatively conserved compared to their genome architecture variation. In dN/dS analysis, most coding genes were under purifying selection as synonymous substitution (dS) rates were higher than those of non-synonymous substitution (dN) (Supplementary Figure S5). One case, psaE, appeared to be under positive selection with a high dN/dS ratio (1.253) (Table S2). psaE is a short gene coding for one of the subunits of the photosystem I complex (PSI), consisting of 62 amino acids. PsaE subunit joins the docking of ferredoxin and flavodoxin on the stromal side of the membrane (Fromme et al., 2003). It has a strong interaction with several subunits including PsaA and PsaB, suggesting that this interaction is important for the interaction of PSI with the phycobilisomes (Fromme et al., 2003; Vanselow et al., 2009). Therefore, the positive selection of the psaE gene suggests differentiation of photosynthetic ability in different populations. In red algae, the psaE gene is in the plastid genome (Lee et al., 2016a), while it is located in the nuclear genome of land plants (Rivas et al., 2002; Wicke et al., 2011; Moghaddam and Kazempour-Osaloo, 2020), suggesting a differential evolution of PSI subunits in photosynthetic organisms (Rivas et al., 2002).
Although gene contents were conserved in organelle genomes, there was genetic diversity between different biogeographic regions. The rbcL gene phylogeny and cox1 haplotype network indicated that regional genetic diversification had occurred in the four Ahnfeltia populations (Figures 4A,B). In the cox1 haplotype network (including all published Ahnfeltia cox1 sequence data), A. plicata Chile and UK belonged to two different haplotypes separated by three haplotype steps, and A. fastigiata Korea and Oregon showed a similar genetic distance between two different haplotypes. Tree topology analysis using individual genes also indicated that Ahnfeltiophycidae is highly conserved and most of the ptDNAs and mtDNAs genes supported this subclass as an independent lineage. Around half of ptDNA genes and mtDNA genes supported the topology of this tree with >80% bootstrap supports, although some genes contradicted the relationship (especially in the two populations of A. fastigiata) (Figure 4C).
Conclusion
Our primary genomic study of Ahnfeltia clearly demonstrates that Ahnfeltia organelle genomes have been dynamically changing, and genetic divergence of Ahnfeltia has enabled it to adapt to factors encountered during its global expansion. Widely separated populations of both A. fastigiata and A. plicata showed numerous genetic adaptations. The amphi-North Pacific species A. fastigiata showed more genomic divergence than the bipolar species, A. plicata. In A. fastigiata, genome structure variations were present. In the Oregon population, tandem repeats and a plasmid-mediated translocation event in ptDNA had occurred; in the Korean population, a different group II intron ORFs composition in mtDNA was present. On the other hand, stable genomic structures were shown in two A. plicata populations: Chile and UK. Overall, our data suggests that geographic distribution has affected the genomic and genetic characteristics of Ahnfeltia. To further confirm our geographic theory, a future whole-genomic study at the population-level is needed that incorporates more extensive worldwide sampling along with comparisons of both historic and present day geological and ecological data in each area.
Data Availability Statement
The datasets presented in this study can be found in online repositories. The names of the repository/repositories and accession number(s) can be found below: Newly sequenced ptDNAs of A. plicata Chile (MZ393453), A. plicata UK (MZ393452), A. fastigiata Korea (MZ393455) and A. fastigiata Oregon (MZ393454), and mtDNAs of A. plicata Chile (MZ393458), A. plicata UK (MZ393459), A. fastigiata Korea (MZ393456) and A. fastigiata Oregon (MZ393457) have been deposited in the NCBI GenBank database.
Author Contributions
HK analyzed the data and conducted experiments with JY. DB, MC, AM, CM, and GH provided materials. HY, AM, CM, and GH designed the research. HY supervised the research. All authors have read and approved the manuscript.
Funding
This study was supported by the Collaborative Genome Program of the Korea Institute of Marine Science and Technology Promotion (KIMST) funded by the Ministry of Oceans and Fisheries (MOF) (20180430), the National Research Foundation of Korea (NRF-2017R1A2B3001923, 2020R1I1A1A01074092). AM was supported by Fondecyt 1180433. MC was supported by Fondecyt 3180539.
Conflict of Interest
The authors declare that the research was conducted in the absence of any commercial or financial relationships that could be construed as a potential conflict of interest.
Publisher’s Note
All claims expressed in this article are solely those of the authors and do not necessarily represent those of their affiliated organizations, or those of the publisher, the editors and the reviewers. Any product that may be evaluated in this article, or claim that may be made by its manufacturer, is not guaranteed or endorsed by the publisher.
Acknowledgments
The authors thank to Fabio Mendez, Juan Pablo Rodriguez, Sebastian Rosenfeld for assistance in samplings.
Supplementary Material
The Supplementary Material for this article can be found online at: https://www.frontiersin.org/articles/10.3389/fgene.2021.724734/full#supplementary-material
References
Bateman, A. (2020). Division of Labour in a Matrix, rather Than Phagocytosis or Endosymbiosis, as a Route for the Origin of Eukaryotic Cells. Biol. Direct 15, 8. doi:10.1186/s13062-020-00260-9
Bhattacharya, D., Qiu, H., Lee, J., Su Yoon, H., Weber, A. P. M., and Price, D. C. (2018). When Less Is More: Red Algae as Models for Studying Gene Loss and Genome Evolution in Eukaryotes. Crit. Rev. Plant Sci. 37, 81–99. doi:10.1080/07352689.2018.1482364
Bolger, A. M., Lohse, M., and Usadel, B. (2014). Trimmomatic: a Flexible Trimmer for Illumina Sequence Data. Bioinformatics 30, 2114–2120. doi:10.1093/bioinformatics/btu170
Boo, G. H., Qiu, Y. X., Kim, J. Y., Ang, P. O., Bosch, S., De Clerck, O., et al. (2019). Contrasting Patterns of Genetic Structure and Phylogeography in the marine agarophytes Gelidiophycus divaricatus and G. freshwateri (Gelidiales, Rhodophyta) from East Asia. J. Phycol. 55, 1319–1334. doi:10.1111/jpy.12910
Bringloe, T. T., Macaya, E. C., and Saunders, G. W. (2019). The Phylogeographic History of Amphitropical Callophyllis Variegata (Florideophyceae, Rhodophyta) in the Pacific Ocean. Algae 34, 91–97. doi:10.4490/algae.2019.34.5.26
Bringloe, T. T., and Saunders, G. W. (2019). Trans‐Arctic Speciation of Florideophyceae (Rhodophyta) since the Opening of the Bering Strait, with Consideration of the "species Pump" Hypothesis. J. Biogeogr. 46, 694–705. doi:10.1111/jbi.13504
Brouard, J.-S., Turmel, M., Otis, C., and Lemieux, C. (2016). Proliferation of Group II Introns in the Chloroplast Genome of the green alga Oedocladium carolinianum (Chlorophyceae). PeerJ 4, e2627. doi:10.7717/peerj.2627
Carver, T., Thomson, N., Bleasby, A., Berriman, M., and Parkhill, J. (2009). DNAPlotter: Circular and Linear Interactive Genome Visualization. Bioinformatics 25, 119–120. doi:10.1093/bioinformatics/btn578
Chapman, V. J., and Chapman, D. J. (1980). Seaweeds and Their Uses. 3rd edn. London: Chapman & Hall, 334.
Choi, J. W., Graf, L., Peters, A. F., Cock, J. M., Nishitsuji, K., Arimoto, A., et al. (2020). Organelle Inheritance and Genome Architecture Variation in Isogamous Brown Algae. Sci. Rep. 10, 2048. doi:10.1038/s41598-020-58817-7
Christensen, A. C. (2014). Genes and Junk in Plant Mitochondria-Repair Mechanisms and Selection. Genome Biol. Evol. 6, 1448–1453. doi:10.1093/gbe/evu115
Christensen, A. C. (2013). Plant Mitochondrial Genome Evolution Can Be Explained by DNA Repair Mechanisms. Genome Biol. Evol. 5, 1079–1086. doi:10.1093/gbe/evt069
Darling, A. E., Mau, B., and Perna, N. T. (2010). progressiveMauve: Multiple Genome Alignment with Gene Gain, Loss and Rearrangement. PLoS One 5, e11147. doi:10.1371/journal.pone.0011147
Day, A., and Madesis, P. (2007). “DNA Replication, Recombination, and Repair in Plastids,” in Cell and Molecular Biology of Plastids. Editor R. Bock (Berlin, Heidelberg: Springer Berlin Heidelberg), 65–119. doi:10.1007/4735_2007_0231
Del Vasto, M., Figueroa-Martinez, F., Featherston, J., González, M. A., Reyes-Prieto, A., Durand, P. M., et al. (2015). Massive and Widespread Organelle Genomic Expansion in the green Algal Genus Dunaliella. Genome Biol. Evol. 7, 656–663. doi:10.1093/gbe/evv027
Dierckxsens, N., Mardulyn, P., and Smits, G. (2017). NOVOPlasty: De Novo Assembly of Organelle Genomes from Whole Genome Data. Nucleic Acids Res. 45, e18. doi:10.1093/nar/gkw955
Doolittle, W. F. (2014). The Trouble with (Group II) Introns. Proc. Natl. Acad. Sci. 111, 6536–6537. doi:10.1073/pnas.1405174111
Doyle, J. J., and Doyle, J. L. (1987). A Rapid DNA Isolation Procedure for Small Quantities of Fresh Leaf Tissue. Phytochem. Bull. 19, 11–15.
Freshwater, D. W., and Rueness, J. (1994). Phylogenetic Relationships of Some European Gelidium (Gelidiales, Rhodophyta) Species, Based on rbcL Nucleotide Sequence Analysis. Phycologia 33, 187–194. doi:10.2216/i0031-8884-33-3-187.1
Fromme, P., Melkozernov, A., Jordan, P., and Krauss, N. (2003). Structure and Function of Photosystem I: Interaction with its Soluble Electron Carriers and External Antenna Systems. FEBS Lett. 555, 40–44. doi:10.1016/s0014-5793(03)01124-4
Greiner, S., Lehwark, P., and Bock, R. (2019). Organellar Genome DRAW (OGDRAW) Version 1.3.1: Expanded Toolkit for the Graphical Visualization of Organellar Genomes. Nucleic Acids Res. 47, W59–W64. doi:10.1093/nar/gkz238
Guiry, M. D., and Guiry, G. M. (2021). AlgaeBase. World-wide Electronic Publication. Galway: National University of Ireland. searched on 01 June 2021 https://www.algaebase.org.
Guy, L., Roat Kultima, J., and Andersson, S. G. E. (2010). genoPlotR: Comparative Gene and Genome Visualization in R. Bioinformatics 26, 2334–2335. doi:10.1093/bioinformatics/btq413
Halary, S., Mcinerney, J. O., Lopez, P., and Bapteste, E. (2013). EGN: a Wizard for Construction of Gene and Genome Similarity Networks. BMC Evol. Biol. 13, 146. doi:10.1186/1471-2148-13-146
Hu, Z.-M., Uwai, S., Yu, S.-H., Komatsu, T., Ajisaka, T., and Duan, D.-L. (2011). Phylogeographic Heterogeneity of the Brown Macroalga Sargassum Horneri (Fucaceae) in the Northwestern Pacific in Relation to Late Pleistocene Glaciation and Tectonic Configurations. Mol. Ecol. 20, 3894–3909. doi:10.1111/j.1365-294x.2011.05220.x
Huisman, J. M., Sherwood, A. R., and Abbott, I. A. (2003). Morphology, Reproduction, and the 18S rRNA Gene Sequence of Pihiella liagoraciphila Gen. ET SP. NOV. (Rhodophyta), the so-Called ʿMonosporangial Discs' Associated With Members of the Liagoraceae (Rhodophyta), and Proposal of the Pihiellales ORD. NOV. J. Phycology 39, 978–987. doi:10.1046/j.1529-8817.2003.03047.x
Janouškovec, J., Liu, S. L., Martone, P. T., Carré, W., Leblanc, C., Collén, J., et al. (2013). Evolution of Red Algal Plastid Genomes: Ancient Architectures, Introns, Horizontal Gene Transfer, and Taxonomic Utility of Plastid Markers. PLoS One 8, e59001. doi:10.1371/journal.pone.0059001
Kai, Y., Orr, J. W., Sakai, K., and Nakabo, T. (2011). Genetic and Morphological Evidence for Cryptic Diversity in the Careproctus Rastrinus Species Complex (Liparidae) of the North Pacific. Ichthyol. Res. 58, 143–154. doi:10.1007/s10228-010-0202-2
Kamiya, M., Lindstrom, S. C., Nakayama, T., Yokoyama, A., Lin, S. M., Guiry, M. D., et al. (2017). Rhodophyta. In: Syllabus of Plant Families Part 2/2: Photoautotrophic Eukaryotic Algae Editors W. Frey, pp. [i]–xii. Stuttgart: Borntraeger Science Publishers. ISBN 978-3-443-01094-2.
Katoh, K., and Standley, D. M. (2013). MAFFT Multiple Sequence Alignment Software Version 7: Improvements in Performance and Usability. Mol. Biol. Evol. 30, 772–780. doi:10.1093/molbev/mst010
Kawata, M., Harada, T., Shimamoto, Y., Oono, K., and Takaiwa, F. (1997). Short Inverted Repeats Function as Hotspots of Intermolecular Recombination Giving Rise to Oligomers of Deleted Plastid DNAs (ptDNAs). Curr. Genet. 31, 179–184. doi:10.1007/s002940050193
Kim, D., Lee, J., Choi, J. W., Yang, J. H., Hwang, I.-K., and Yoon, H. S. (2019). Flip-flop Organization in the Chloroplast Genome of Capsosiphon Fulvescens (Ulvophyceae, Chlorophyta). J. Phycol. 55, 214–223. doi:10.1111/jpy.12811
Kimura, M. (1968). Evolutionary Rate at the Molecular Level. Nature 217, 624–626. doi:10.1038/217624a0
Kolmogorov, M., Yuan, J., Lin, Y., and Pevzner, P. A. (2019). Assembly of Long, Error-Prone Reads Using Repeat Graphs. Nat. Biotechnol. 37, 540–546. doi:10.1038/s41587-019-0072-8
Krzywinski, M., Schein, J., Birol, I., Connors, J., Gascoyne, R., Horsman, D., et al. (2009). Circos: An Information Aesthetic for Comparative Genomics. Genome Res. 19, 1639–1645. doi:10.1101/gr.092759.109
Kurtz, S., Choudhuri, J. V., Ohlebusch, E., Schleiermacher, C., Stoye, J., and Giegerich, R. (2001). REPuter: the Manifold Applications of Repeat Analysis on a Genomic Scale. Nucleic Acids Res. 29, 4633–4642. doi:10.1093/nar/29.22.4633
Lagesen, K., Hallin, P., Rødland, E. A., Stærfeldt, H.-H., Rognes, T., and Ussery, D. W. (2007). RNAmmer: Consistent and Rapid Annotation of Ribosomal RNA Genes. Nucleic Acids Res. 35, 3100–3108. doi:10.1093/nar/gkm160
Lambowitz, A. M., and Zimmerly, S. (2004). Mobile Group II Introns. Annu. Rev. Genet. 38, 1–35. doi:10.1146/annurev.genet.38.072902.091600
Laslett, D., and Canback, B. (2004). ARAGORN, a Program to Detect tRNA Genes and tmRNA Genes in Nucleotide Sequences. Nucleic Acids Res. 32, 11–16. doi:10.1093/nar/gkh152
Lee, J., Cho, C. H., Park, S. I., Choi, J. W., Song, H. S., West, J. A., et al. (2016a). Parallel Evolution of Highly Conserved Plastid Genome Architecture in Red Seaweeds and Seed Plants. BMC Biol. 14, 75. doi:10.1186/s12915-016-0299-5
Lee, J., Kim, K. M., Yang, E. C., Miller, K. A., Boo, S. M., Bhattacharya, D., et al. (2016b). Reconstructing the Complex Evolutionary History of mobile Plasmids in Red Algal Genomes. Sci. Rep. 6, 23744. doi:10.1038/srep23744
Lee, Y., and Kang, S. (2001). A Catalogue of the Seaweeds in Korea, 8. Jeju: Cheju National University Press, 1–662. [in Korean].
Leigh, J. W., and Bryant, D. (2015). Popart : Full‐feature Software for Haplotype Network Construction. Methods Ecol. Evol. 6, 1110–1116. doi:10.1111/2041-210x.12410
Li, X., Tzika, A. C., Liu, Y., Van Doninck, K., Zhu, Q., and Milinkovitch, M. C. (2010). Preliminary Genetic Status of the Spotted Seal Phoca largha in Liaodong Bay (China) Based on Microsatellite and Mitochondrial DNA Analyses. Trends Ecol. Evol. 2, e6. doi:10.4081/eb.2010.e6
Lin, C.-S., Chen, J. J. W., Huang, Y.-T., Chan, M.-T., Daniell, H., Chang, W.-J., et al. (2015). The Location and Translocation of Ndh Genes of Chloroplast Origin in the Orchidaceae Family. Sci. Rep. 5, 9040. doi:10.1038/srep09040
Lüning, K., and Freshwater, W. (1988). Temperature Tolerance of Northeast Pacific marine Algae. J. Phycol. 24, 310–515. doi:10.1111/j.1529-8817.1988.tb00178.x
Lynch, M., Koskella, B., and Schaack, S. (2006). Mutation Pressure and the Evolution of Organelle Genomic Architecture. Science 311, 1727–1730. doi:10.1126/science.1118884
Maggs, C. A., Castilho, R., Foltz, D., Henzler, C., Jolly, M. T., Kelly, J., et al. (2008). Evaluating Signatures of Glacial Refugia for North Atlantic Benthic marine Taxa. Ecology 89, S108–S122. doi:10.1890/08-0257.1
Maggs, C. A., and Pueschel, C. M. (1989). Morphology and Development of Ahnfeltia plicata (Rhodophyta): Proposal of Ahnfeltiales Ord. Nov. J. Phycol. 25, 333–351. doi:10.1111/j.1529-8817.1989.tb00131.x
Mansilla, A., Rodriguez, J. P., Souza, J. M. C., Rosenfeld, S., Ojeda, J., and Yokoya, N. S. (2014). Growth Responses to Temperature, Salinity and Nutrient Variations, and Biomass Variation and Phenology of Ahnfeltia Plicata (Rhodophyta, Ahnfeltiales): a Commercially Interesting Agarophyte from the Magellanic Region, Chile. J. Appl. Phycol. 26, 1133–1139. doi:10.1007/s10811-013-0150-0
Milstein, D., and Saunders, G. W. (2012). DNA Barcoding of Canadian Ahnfeltiales (Rhodophyta) Reveals a New Species - Ahnfeltia borealis sp. nov. Phycologia 51, 247–259. doi:10.2216/11-40.1
Mirarab, S., and Warnow, T. (2015). ASTRAL-II: Coalescent-Based Species Tree Estimation with many Hundreds of Taxa and Thousands of Genes. Bioinformatics 31, i44–i52. doi:10.1093/bioinformatics/btv234
Moghaddam, M., and Kazempour-Osaloo, S. (2020). Extensive Survey of the Ycf4 Plastid Gene throughout the IRLC Legumes: Robust Evidence of its Locus and Lineage Specific Accelerated Rate of Evolution, Pseudogenization and Gene Loss in the Tribe Fabeae. PLoS One 15, e0229846. doi:10.1371/journal.pone.0229846
Nguyen, L.-T., Schmidt, H. A., Von Haeseler, A., and Minh, B. Q. (2015). IQ-TREE: a Fast and Effective Stochastic Algorithm for Estimating Maximum-Likelihood Phylogenies. Mol. Biol. Evol. 32, 268–274. doi:10.1093/molbev/msu300
Olsen, J. L., Zechman, F. W., Hoarau, G., Coyer, J. A., Stam, W. T., Valero, M., et al. (2010). The Phylogeographic Architecture of the Fucoid seaweed Ascophyllum nodosum: an Intertidal 'marine Tree' and Survivor of More Than One Glacial-Interglacial Cycle. J. Biogeogr. 37, 842–856. doi:10.1111/j.1365-2699.2009.02262.x
Park, T.-G., An, Y.-R., Moon, D.-Y., Choi, S.-G., and Kim, Z.-G. (2010). Distribution of the Spotted Seal, Phoca largha, along the Coast of Baekryongdo. Korean J. Fish. Aquat. Sci. 43, 659–664. doi:10.5657/kfas.2010.43.6.659
Perrineau, M.-M., Price, D. C., Mohr, G., and Bhattacharya, D. (2015). Recent Mobility of Plastid Encoded Group II Introns and Twintrons in Five Strains of the Unicellular Red alga Porphyridium. PeerJ 3, e1017. doi:10.7717/peerj.1017
Rayment, W. J. (2004). Ahnfeltia plicata, A Red Seaweed. In Marine Life Information Network: Biology and Sensitivity Key Information Reviews, [on-Line]. Editors H. Tyler-Walters, and K. Hiscock Plymouth: Marine Biological Association of the United Kingdom. doi:10.17031/marlinsp.1656.1
Repetti, S. I., Jackson, C. J., Judd, L. M., Wick, R. R., Holt, K. E., and Verbruggen, H. (2020). The Inflated Mitochondrial Genomes of Siphonous green Algae Reflect Processes Driving Expansion of Noncoding DNA and Proliferation of Introns. PeerJ 8, e8273. doi:10.7717/peerj.8273
Rivas, J. D. L., Lozano, J. J., and Ortiz, A. R. (2002). Comparative Analysis of Chloroplast Genomes: Functional Annotation, Genome-Based Phylogeny, and Deduced Evolutionary Patterns. Genome Res. 12, 567–583. doi:10.1101/gr.209402
Saunders, G. W., and Moore, T. E. (2013). Refinements for the Amplification and Sequencing of Red Algal DNA Barcode and RedToL Phylogenetic Markers: a Summary of Current Primers, Profiles and Strategies. Algae 28, 31–43. doi:10.4490/algae.2013.28.1.031
Shannon, P., Markiel, A., Ozier, O., Baliga, N. S., Wang, J. T., Ramage, D., et al. (2003). Cytoscape: a Software Environment for Integrated Models of Biomolecular Interaction Networks. Genome Res. 13, 2498–2504. doi:10.1101/gr.1239303
Smith, D., Lee, R. W., Cushman, J. C., Magnuson, J. K., Tran, D., and Polle, J. E. (2010). The Dunaliella salina Organelle Genomes: Large Sequences, Inflated with Intronic and Intergenic DNA. BMC Plant Biol. 10, 83. doi:10.1186/1471-2229-10-83
Smith, D. R. (2020). Common Repeat Elements in the Mitochondrial and Plastid Genomes of green Algae. Front. Genet. 11, 465. doi:10.3389/fgene.2020.00465
Smith, D. R., and Keeling, P. J. (2015). Mitochondrial and Plastid Genome Architecture: Reoccurring Themes, but Significant Differences at the Extremes. Proc. Natl. Acad. Sci. U.S.A. 112, 10177–10184. doi:10.1073/pnas.1422049112
Smith, D. R. (2016). The Mutational hazard Hypothesis of Organelle Genome Evolution: 10 Years on. Mol. Ecol. 25, 3769–3775. doi:10.1111/mec.13742
Smith, S. A., Moore, M. J., Brown, J. W., and Yang, Y. (2015). Analysis of Phylogenomic Datasets Reveals Conflict, Concordance, and Gene Duplications with Examples from Animals and Plants. BMC Evol. Biol. 15, 150. doi:10.1186/s12862-015-0423-0
Stein, D. B., Palmer, J. D., and Thompson, W. F. (1986). Structural Evolution and Flip-Flop Recombination of Chloroplast DNA in the Fern Genus Osmunda. Curr. Genet. 10, 835–841. doi:10.1007/bf00418530
Steinegger, M., and Söding, J. (2017). MMseqs2 Enables Sensitive Protein Sequence Searching for the Analysis of Massive Data Sets. Nat. Biotechnol. 35, 1026–1028. doi:10.1038/nbt.3988
Tillich, M., Lehwark, P., Pellizzer, T., Ulbricht-Jones, E. S., Fischer, A., Bock, R., et al. (2017). GeSeq - Versatile and Accurate Annotation of Organelle Genomes. Nucleic Acids Res. 45, W6–W11. doi:10.1093/nar/gkx391
Titlyanov, E. A., Cherbadgy, I. I., and Chapman, D. J. (1999). A review of the biology, productivity and economic potential of the agar-containing red alga, Ahnfeltia tobuchiensis (Kanno et Matsub.) Makijenko, in the seas of the far east of Russia. Inter. J. Algae 1, 28–67. doi:10.1615/interjalgae.v1.i4.30
Truus, K., Tuvikene, R., Vaher, M., Kailas, T., Toomik, P., and Pehk, T. (2006). Structural and Compositional Characteristics of Gelling Galactan from the Red Alga Ahnfeltia tobuchiensis (Ahnfeltiales, the Sea of Japan). Carbohydr. Polym. 63, 130–135. doi:10.1016/j.carbpol.2005.08.029
Turmel, M., Otis, C., and Lemieux, C. (2017). Divergent Copies of the Large Inverted Repeat in the Chloroplast Genomes of Ulvophycean green Algae. Sci. Rep. 7, 994. doi:10.1038/s41598-017-01144-1
Vanselow, C., Weber, A. P. M., Krause, K., and Fromme, P. (2009). Genetic Analysis of the Photosystem I Subunits from the Red Alga, Galdieria Sulphuraria. Biochim. Biophys. Acta (Bba) - Bioenerg. 1787, 46–59. doi:10.1016/j.bbabio.2008.10.004
Walker, B. J., Abeel, T., Shea, T., Priest, M., Abouelliel, A., Sakthikumar, S., et al. (2014). Pilon: An Integrated Tool for Comprehensive Microbial Variant Detection and Genome Assembly Improvement. PLoS One 9, e112963. doi:10.1371/journal.pone.0112963
Wang, D., Zhang, Y., Zhang, Z., Zhu, J., and Yu, J. (2010). KaKs_Calculator 2.0: A Toolkit Incorporating Gamma-Series Methods and Sliding Window Strategies. Genomics, Proteomics. Bioinformatics 8, 77–80. doi:10.1016/s1672-0229(10)60008-3
Wicke, S., Schneeweiss, G. M., Depamphilis, C. W., Müller, K. F., and Quandt, D. (2011). The Evolution of the Plastid Chromosome in Land Plants: Gene Content, Gene Order, Gene Function. Plant Mol. Biol. 76, 273–297. doi:10.1007/s11103-011-9762-4
Wickham, H. (2016). ggplot2: Elegant Graphics for Data Analysis. New York: Springer-Verlag. 978-3-319-24277-4.
Wiedenbeck, J., and Cohan, F. M. (2011). Origins of Bacterial Diversity through Horizontal Genetic Transfer and Adaptation to New Ecological Niches. FEMS Microbiol. Rev. 35, 957–976. doi:10.1111/j.1574-6976.2011.00292.x
Yang, E. C., Boo, S. M., Bhattacharya, D., Saunders, G. W., Knoll, A. H., Fredericq, S., et al. (2016). Divergence Time Estimates and the Evolution of Major Lineages in the Florideophyte Red Algae. Sci. Rep. 6, 21361. doi:10.1038/srep21361
Yang, E. C., Kim, K. M., Kim, S. Y., Lee, J., Boo, G. H., Lee, J.-H., et al. (2015). Highly Conserved Mitochondrial Genomes Among Multicellular Red Algae of the Florideophyceae. Genome Biol. Evol. 7, 2394–2406. doi:10.1093/gbe/evv147
Yang, E. C., Lee, S. Y., Lee, W. J., and Boo, S. M. (2009). Molecular Evidence for Recolonization of Ceramium japonicum (Ceramiaceae, Rhodophyta) on the West Coast of Korea after the Last Glacial Maximum. Bot. Mar. 52, 307–315. doi:10.1515/bot.2009.005
Yang, M. Y., Yang, E. C., and Kim, M. S. (2020). Genetic Diversity Hotspot of the Amphi-Pacific Macroalga Gloiopeltis furcata sensu lato (Gigartinales, Florideophyceae). J. Appl. Phycol. 32, 2515–2522. doi:10.1007/s10811-019-02017-y
Yoon, H. S., Nelson, W., Lindstrom, S. C., Boo, S. M., Pueschel, C., Qiu, H., et al. (2016). “Rhodophyta,” in Handbook of the Protists. Editors J. M. Archibald, A. G. B. Simpson, C. H. Slamovits, L. Margulis, M. Melkonian, D. J. Chapmanet al. (Cham: Springer International Publishing), 1–45. doi:10.1007/978-3-319-32669-6_33-1
Zhang, Y., Fu, X., Duan, D., Xu, J., and Gao, X. (2019). Preparation and Characterization of agar, Agarose, and Agaropectin from the Red Alga Ahnfeltia plicata. J. Ocean. Limnol. 37, 815–824. doi:10.1007/s00343-019-8129-6
Keywords: plastid genome, mitochondrial genome, genome architecture variation, Ahnfeltia, genetic diversity, phylogeograhy
Citation: Kim H, Yang JH, Bustamante DE, Calderon MS, Mansilla A, Maggs CA, Hansen GI and Yoon HS (2021) Organelle Genome Variation in the Red Algal Genus Ahnfeltia (Florideophyceae). Front. Genet. 12:724734. doi: 10.3389/fgene.2021.724734
Received: 14 June 2021; Accepted: 09 September 2021;
Published: 27 September 2021.
Edited by:
Naihao Ye, Chinese Academy of Fishery Sciences (CAFS), ChinaReviewed by:
Muhammad Azhar Nadeem, Sivas University of Science and Technology, TurkeyXiaojun Nie, Northwest A and F University, China
Copyright © 2021 Kim, Yang, Bustamante, Calderon, Mansilla, Maggs, Hansen and Yoon. This is an open-access article distributed under the terms of the Creative Commons Attribution License (CC BY). The use, distribution or reproduction in other forums is permitted, provided the original author(s) and the copyright owner(s) are credited and that the original publication in this journal is cited, in accordance with accepted academic practice. No use, distribution or reproduction is permitted which does not comply with these terms.
*Correspondence: Hwan Su Yoon, hsyoon2011@skku.edu