 Guiying Wang1†
 Chengfu Su
- 1College of Agronomy, Qingdao Agricultural University, Qingdao, China
- 2Shandong Provincial Key Laboratory of Dryland Farming Technology, Qingdao Agricultural University, Qingdao, China
Kernel size is an important agronomic trait for grain yield in maize. The purpose of this study is to map QTLs and predict candidate genes for kernel size in maize. A total of 199 F2 and its F2:3 lines from the cross between SG5/SG7 were developed. A composite interval mapping (CIM) method was used to detect QTLs in three environments of F2 and F2:3 populations. The result showed that a total of 10 QTLs for kernel size were detected, among which were five QTLs for kernel length (KL) and five QTLs for kernel width (KW). Two stable QTLs, qKW-1, and qKL-2, were mapped in all three environments. Three QTLs, qKL-1, qKW-1, and qKW-2, were overlapped with the QTLs identified from previous studies. In order to validate and fine map qKL-2, near-isogenic lines (NILs) were developed by continuous backcrossing between SG5 as the donor parent and SG7 as the recurrent parent. Marker-assisted selection was conducted from BC2F1 generation with molecular markers near qKL-2. A secondary linkage map with six markers around the qKL-2 region was developed and used for fine mapping of qKL-2. Finally, qKL-2 was confirmed in a 1.95 Mb physical interval with selected overlapping recombinant chromosomes on maize chromosome 9 by blasting with the Zea_Mays_B73 v4 genome. Transcriptome analysis showed that a total of 11 out of 40 protein-coding genes differently expressed between the two parents were detected in the identified qKL-2 interval. GRMZM2G006080 encoding a receptor-like protein kinase FERONIA, was predicted as a candidate gene to control kernel size. The work will not only help to understand the genetic mechanisms of kernel size of maize but also lay a foundation for further fine mapping and even cloning of the promising loci.
Introduction
Maize is an important agricultural crop. It can be served as food, animal feed, and industrial materials (Li et al., 2017) and plays a special role in food security (Liu et al., 2014). High grain yield has always been the most important goal of maize breeding. But most yield traits are quantitative traits controlled by multiple genes (Lynch and Walsh, 1998; Xu, 2010). KL and KW are both considered to be important yield traits (Doebley et al., 2006). Kernel size traits, especially KW, has been revealed to be significantly correlated with grain yield of maize (Li et al., 2013). The improvement of kernel size is therefore of great significance in maize breeding.
To date, numerous studies on maize grain yield traits have been reported at phenotypic levels (Rafiq et al., 2010; Nzuve et al., 2014). However, the genetic architecture and molecular mechanisms underlying natural quantitative variation in kernel yield have not been completely elucidated (Chen et al., 2016). Along with the first genetic linkage map of maize, published in 1986 (Helentjaris et al., 1986), molecular markers based on polymerase chain reaction (PCR) technology have greatly developed and applied for constructing genetic maps. Then, increasing QTLs controlling important agronomic traits in maize were detected by analyzing phenotypic value based on constructed genetic maps. These identified QTLs were distributed on all 10 maize chromosomes (Qiu et al., 2011). Many QTL mapping or fine mapping works for kernel size or weight have been carried out in recent years (Liu et al., 2014; Zhang et al., 2014; Chen et al., 2016). Till now, more than 150 QTLs for kernel size or weight have been identified by using different maize populations (Gramene QTL database). Liu et al. (2020) detected 50 QTLs for kernel size traits in the intermated B73 × Mo17 (IBM) Syn10 doubled haploid (DH) population, of which eight were repetitively identified in at least three environments. A total 55 and 28 QTL for kernel traits were identified by using composite interval mapping (CIM) for single-environment analysis and mixed linear model-based CIM for joint analysis, respectively, with 270 F2:3 families derived from the cross between V671 (large kernel) × Mc (small kernel)in five environments (Liu et al., 2014). It is critically important that QTLs should be validated and fine mapped for applying in further marker assisted breeding process. The near-isogenic line (NIL) is one of the most widely accepted populations commonly used for QTL fine mapping. NILs have been successfully used in confirming and fine-mapping QTLs in many species, such as rice (Lin et al., 2003; Li et al., 2004; Xie et al., 2006) and wheat (Xue et al., 2013; Zheng et al., 2015). In maize, a major QTL qkrnw4 associated with kernel row number was mapped by using a NIL population (Nie et al., 2019). Gao et al. (2019) mapped qLRI4, which conferred leaf rolling index by using NIL populations. Yang et al. (2018) mapped a major QTL qkc7.03 to a 416.27 kb physical interval for kernel cracking with NILs developed.
Great achievements in QTL mapping or isolating underlying genes for kernel size have been made in many species such as rice (Wan et al., 2006; Song et al., 2007; Li et al., 2011; Qiu et al., 2012; Kang et al., 2018), Arabidopsis thaliana (Xia et al., 2013; Du et al., 2014), soybean (Xu et al., 2011; Han et al., 2012), and wheat (Sun et al., 2009; Ramya et al., 2010). In particular, genes controlling rice kernel size or weight, such as GS3 (Fan et al., 2006), GS5 (Li et al., 2011), qGL3 (Zhang et al., 2012), GW2 (Song et al., 2007), GW8 (Wang et al., 2012), GS2 (Hu et al., 2015), qGW7/GL7 (Wang et al., 2015), have been successfully cloned. The study of identifying and cloning kernel-size-related genes has lagged in maize. To a certain extent, the reason for this might be due to the genome of maize is large and complicated for many transposable elements and repetitive sequences exist (Gaut et al., 2000; Feuillet and Eversole, 2009). In addition, most complex traits, such as kernel yield and kernel size, are controlled by many genes with small effects (Edwards et al., 1987; Tian et al., 2011). QTLs identified in different genetic backgrounds across multiple environments have a higher chance of being positionally cloned (Chen et al., 2016).
Based on previous studies, the purposes of this study were as follows: (1) to map QTLs for kernel size in three environments by using F2 and F2:3 populations from the same cross SG5/SG7; (2) to validate and fine map the identified major QTL qKL-2 by using BC3F1NILs; and (3) to reveal differently expressed genes (DEGs) between SG5 and SG7 by RNA-seq technology and predict candidate genes responsible for KL. In the study, we constructed an F2 and an F2:3 populations using two maize inbred lines SG5 and SG7 and evaluated them in three environments for mapping QTLs for kernel size. Furthermore, we finely mapped a major QTL by using the NILs from the cross of SG5 and SG7 and used RNA-seq technology to reveal the DEGs between parental lines SG5 and SG7. Finally, the candidate genes for qKL-2 were predicted.
Results
Phenotype Evaluation for Segregation Populations
Two kernel size traits, i.e., KL and KW were estimated. The trait values of F2 population were investigated in 2016, while the phenotypic values of F2:3 populations were collected in 2018 and 2019, and these were recorded as F2:3-2018 and F2:3-2019, respectively. Table 1 presents the mean values of KL and KW investigated from F2 and F2:3 populations. The two inbred lines SG5 and SG7 were significantly different in both KL and KW traits. KL showed extremely significantly different between SG5 and SG7 (P < 0.01, Figures 3A,B). The data of two kernel size traits both emerged on normal distribution (Supplementary Figure 1). The two traits correlated positively with each other, with Pearson’s correlation coefficient being 0.20, 0.25, and 0.24 in F2-2016, F2:3-2018, and F2:3-2019, respectively.
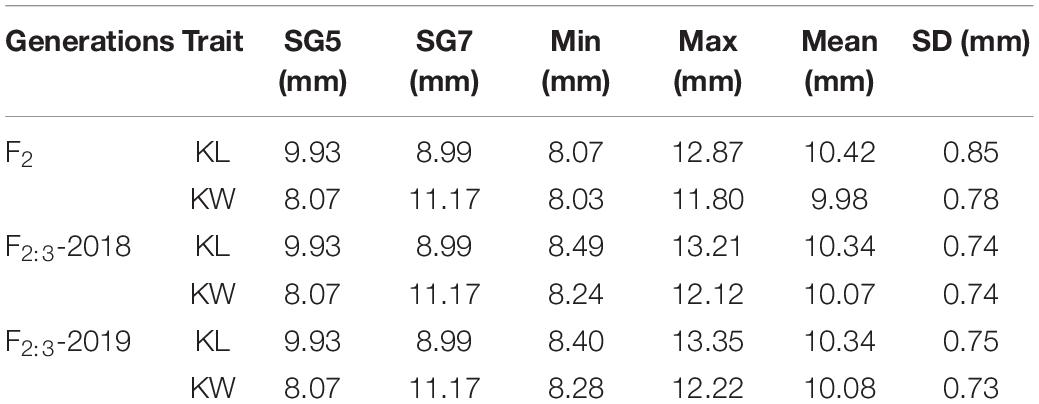
Table 1. Descriptive statistics of KL and KW traits in the F2 and F2:3 mapping populations of maize derived from the cross between SG5 and SG7.
QTL Mapping
CIM procedure was applied to map QTLs conferring KL and KW. Manhattan plots were shown in Figure 1. A total of 10 QTLs were mapped in total for KL and KW from F2 and F2:3 populations. The information is summarized in Table 2. For KL, two major QTLs were mapped on maize chromosome 9 in F2 population. A total four QTLs were mapped on chromosomes 3, 7, and 9 in F2:3-2018 population while three QTLs were mapped on chromosomes 7 and 9 in F2:3-2019 population. For KW, three QTLs were mapped on maize chromosomes 3 and 8. A total three QTLs were mapped on maize chromosomes 3 and 8 in both F2:3-2018 and F2:3-2019 populations, respectively. The phenotypic variation explained by these QTLs ranged from 8.4 to 23.0%, with a mean value of 14.25 and 14.46%, 14.03 and 12.97%, and 10.83 and 13.67% for KL and KW in F2-2016, F2:3-2018, and F2:3-2019, respectively. The LOD score ranges from 4.0 for qKL-7 to 9.5 for qKW-1. Among the 10 QTLs, qKL-2 for KL, and qKW-1 for KW were detected in all the three environments (Figure 2, highlighted in green color circle). That is, they were stable QTLs in the study. Four QTLs (qKW-2, qKL-7, qKW-3, and qKL-10) were detected in two environments, highlighted in blue color circle in Figure 2. In addition, three QTLs, qKL-1, qKW-1, and qKW-2, overlapped with the QTLs identified from the metaQTL analysis (Chen et al., 2017).
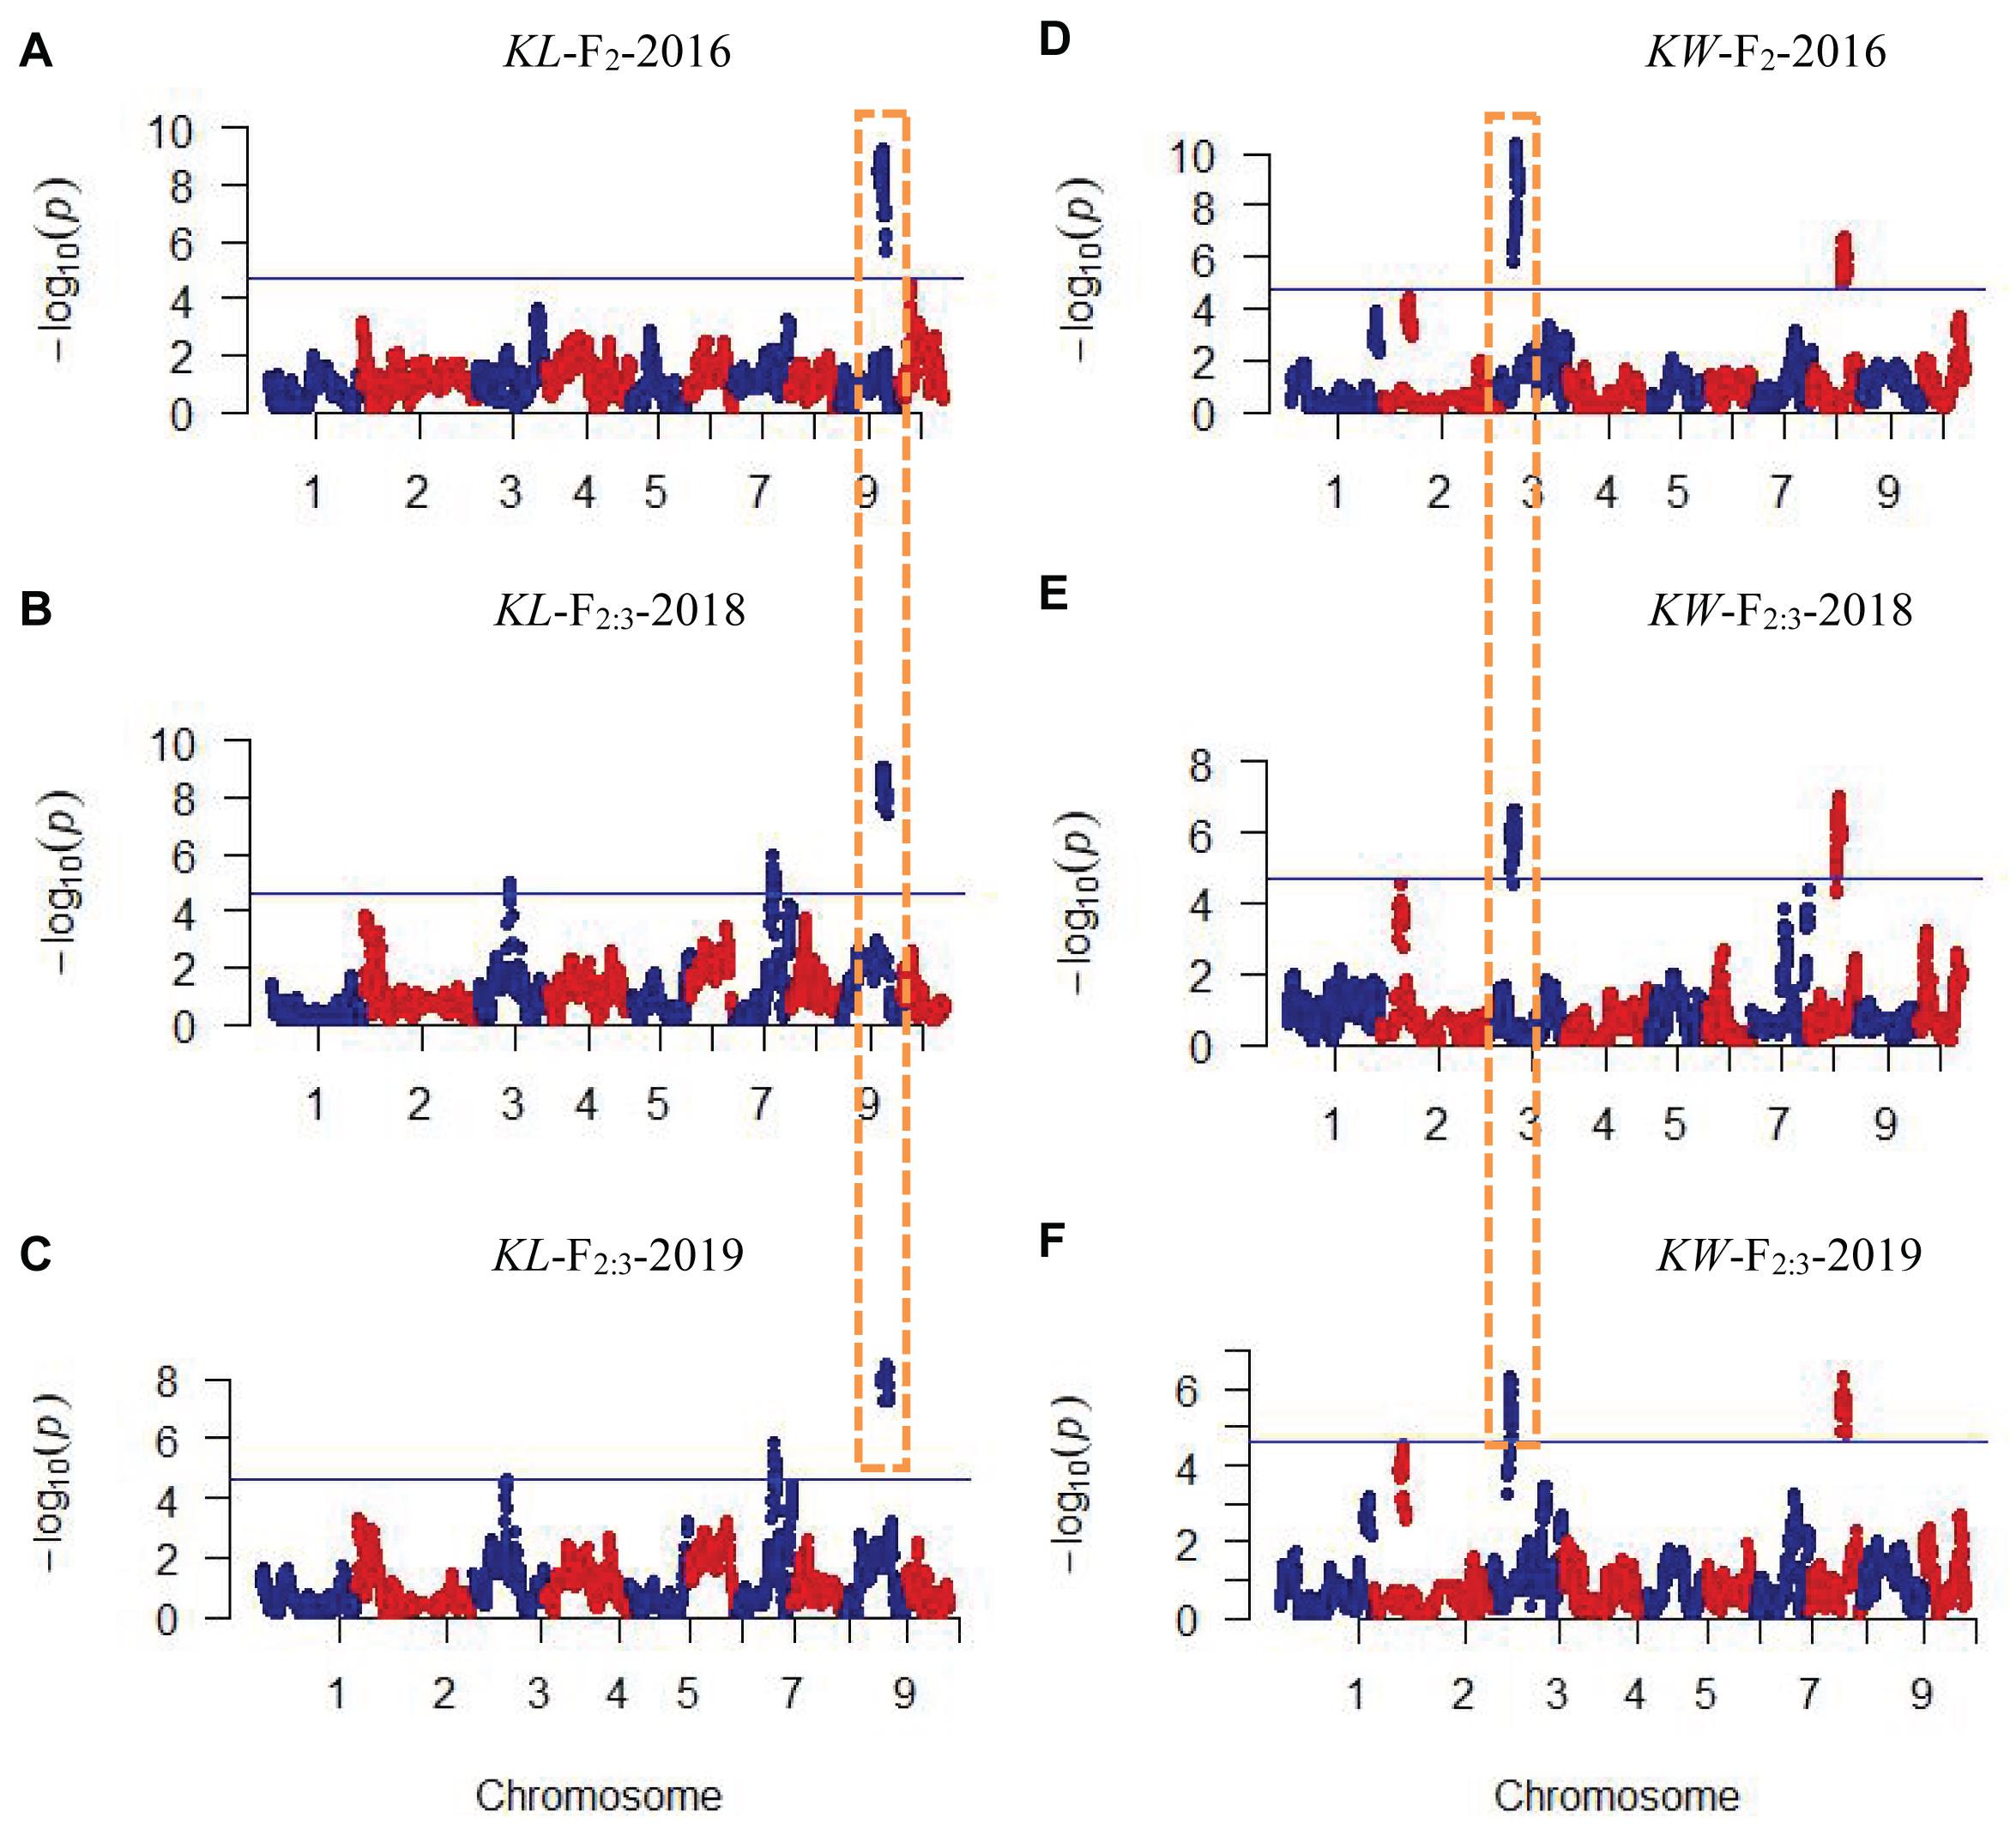
Figure 1. Plots of test statistic−Log10(p) against genome location for KL and KW traits in maize using the CIM method. The horizontal blue line of each panel is the critical value of the test statistic generated from 1,000 permuted samples. (A–C) Indicate KL mapping results in three environments while (D–F) indicate KW mapping results in three environments. Dotted rectangles with orange color indicate these QTLs were mapped repeatedly in all three environments.
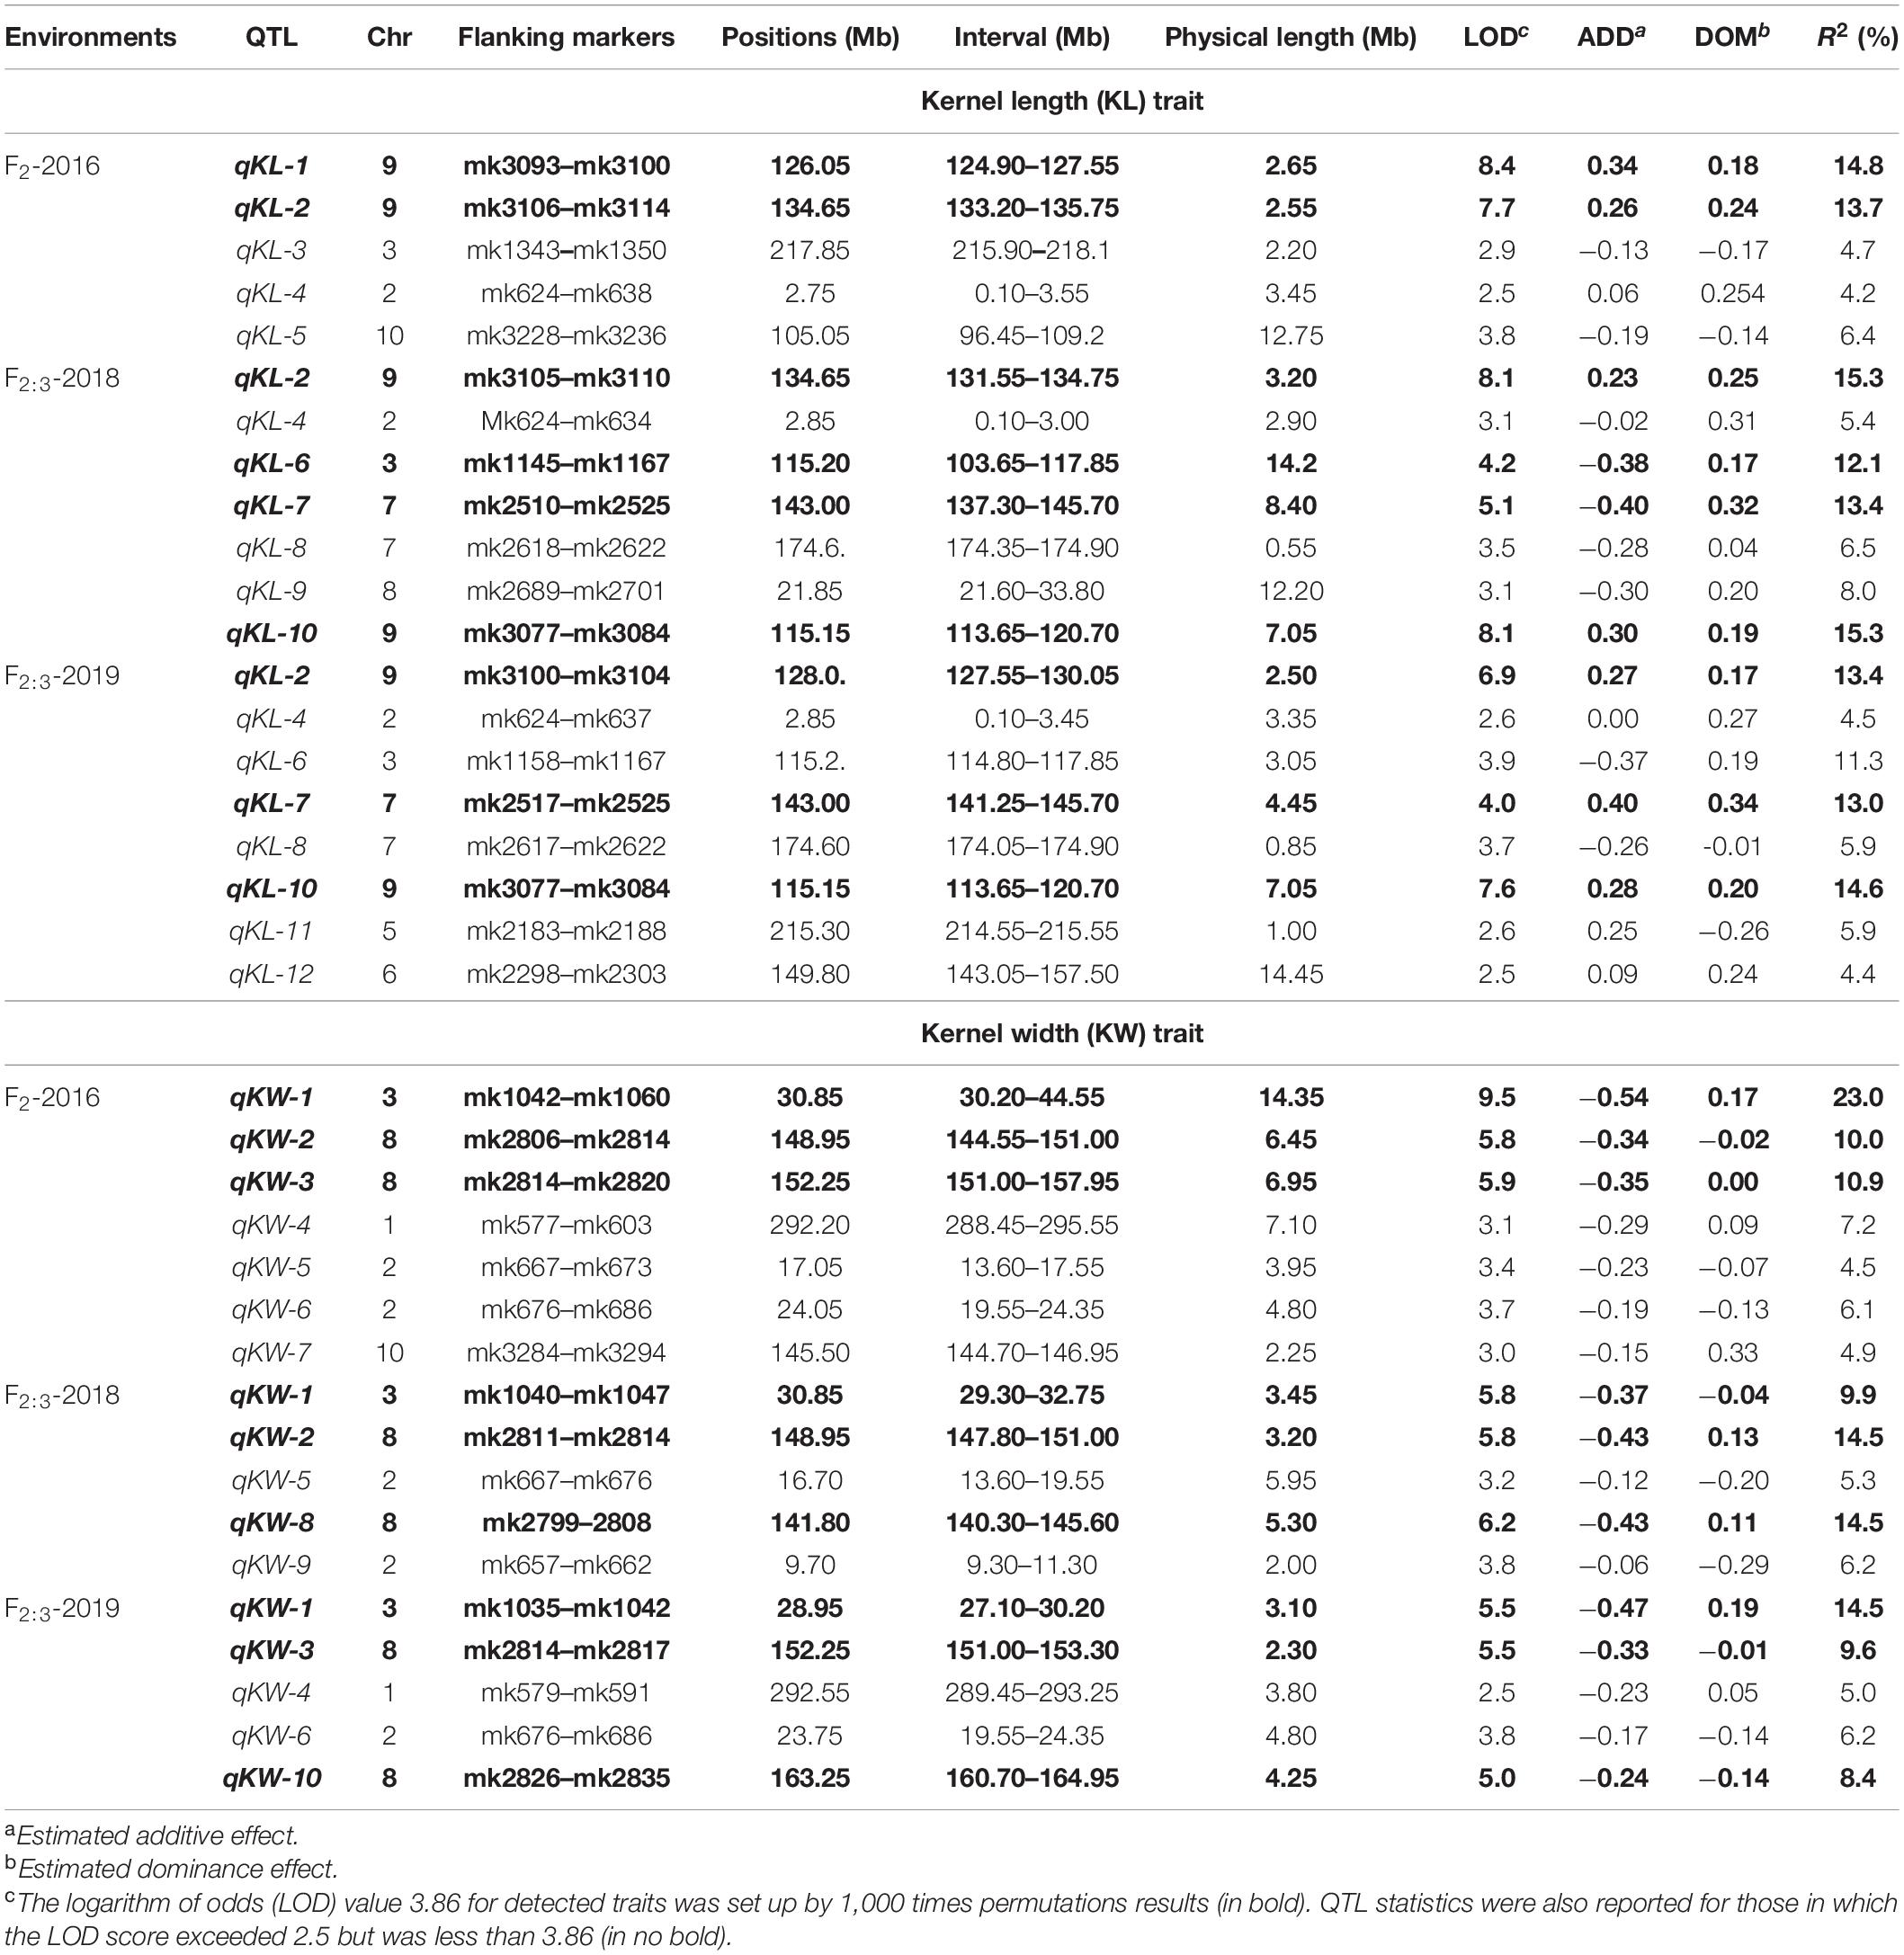
Table 2. QTL identified for KL and KW traits of maize using high-density SNP bin-map from composite interval mapping (CIM).
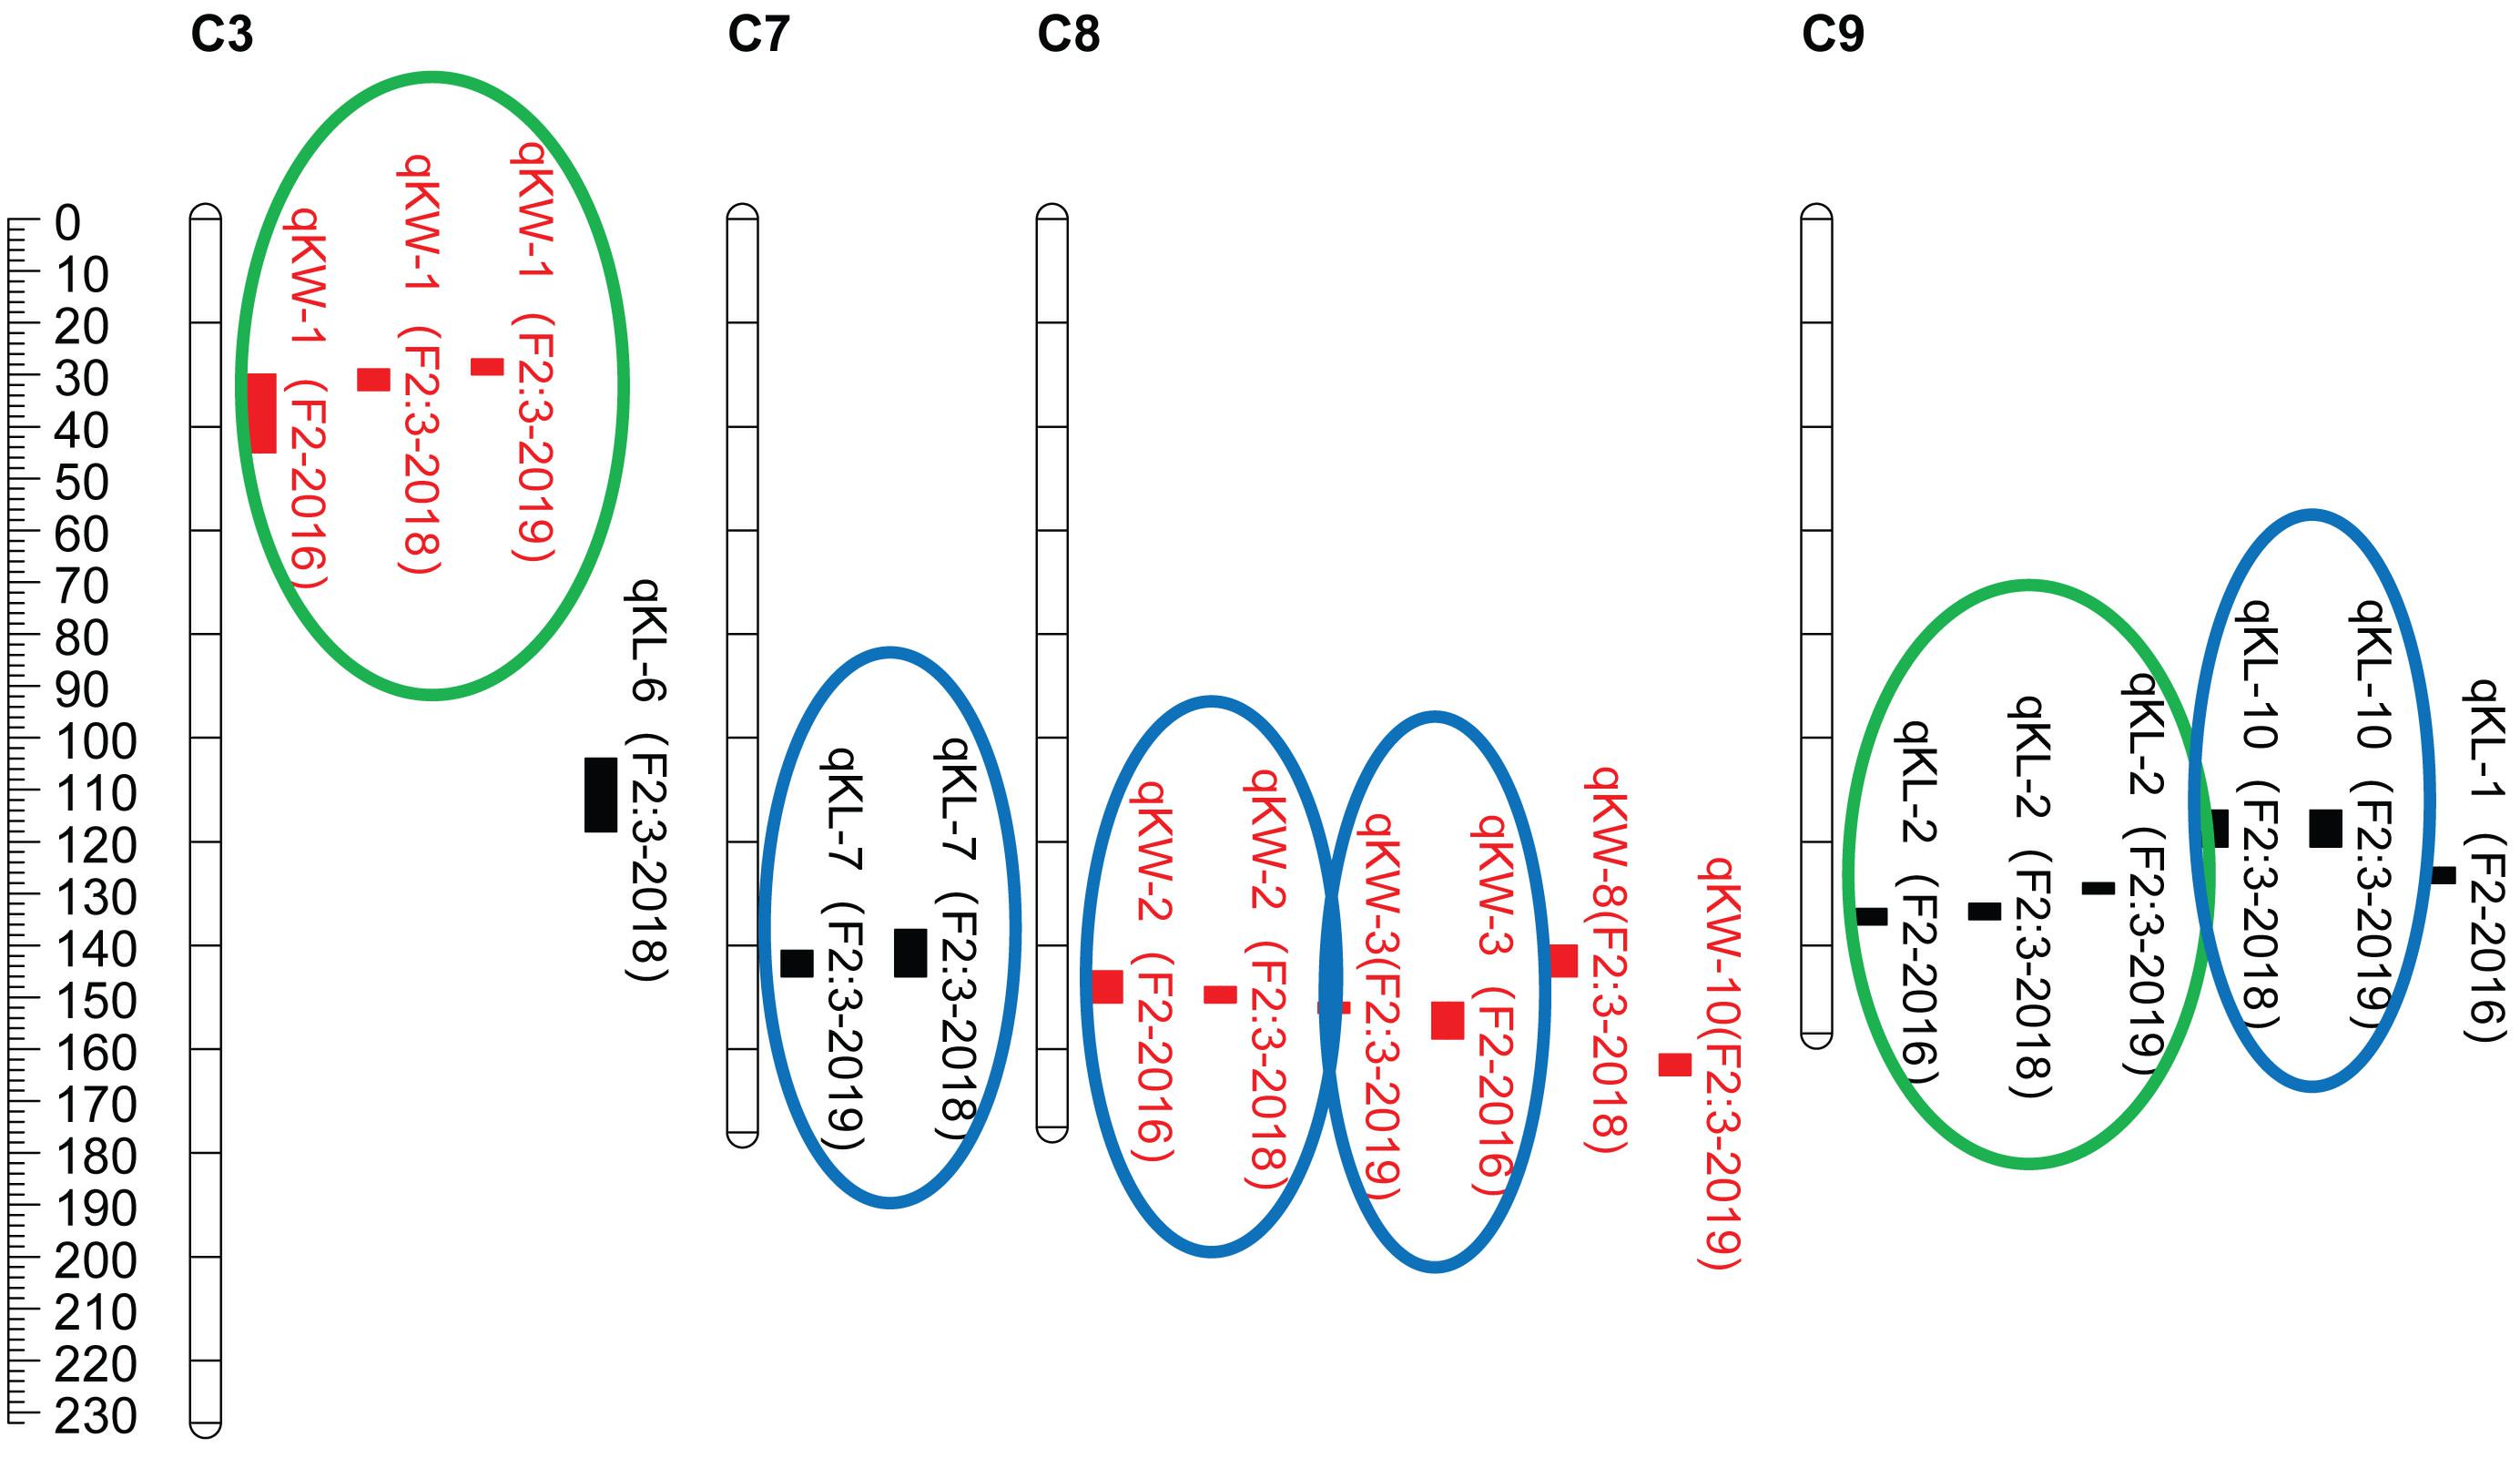
Figure 2. QTL locations for KL and KW traits studied in the F2 and F2:3 populations from cross SG5/SG7. QTLs were represented in different colors for kernel size traits including red for KW (kernel width, mm), black for KL (kernel length, mm) on maize chromosomes 3, 7, 8, and 9. QTLs represented by bars are shown on the right of the linkage groups close to their corresponding markers. Supported intervals for each QTL are indicated by the length of vertical bars. The QTLs circled in green were stably detected in three environments while QTLs circled in blue were repeatedly detected in two environments.
Fine Mapping qKL-2 With NILs
From 2017 to 2019, a NIL population, consisting of 998 BC3F1 lines, was developed by introgressing the qKL-2 genomic region of SG5 into the SG7 genetic background. A secondary linkage map with six markers (Supplementary Table 1) around qKL-2 was generated. The six markers were located at 115.23, 130.51, 133.34, 135.29, 139.75, and 153.88 Mb on chromosome 9 by blasting maize B73 RefGen_v4 (Figure 3C). The secondary linkage map was 43.35 cM in length, and the genetic distances between every two adjacent markers were 16.75, 8.39, 0.80, 5.67, and 11.74 cM.
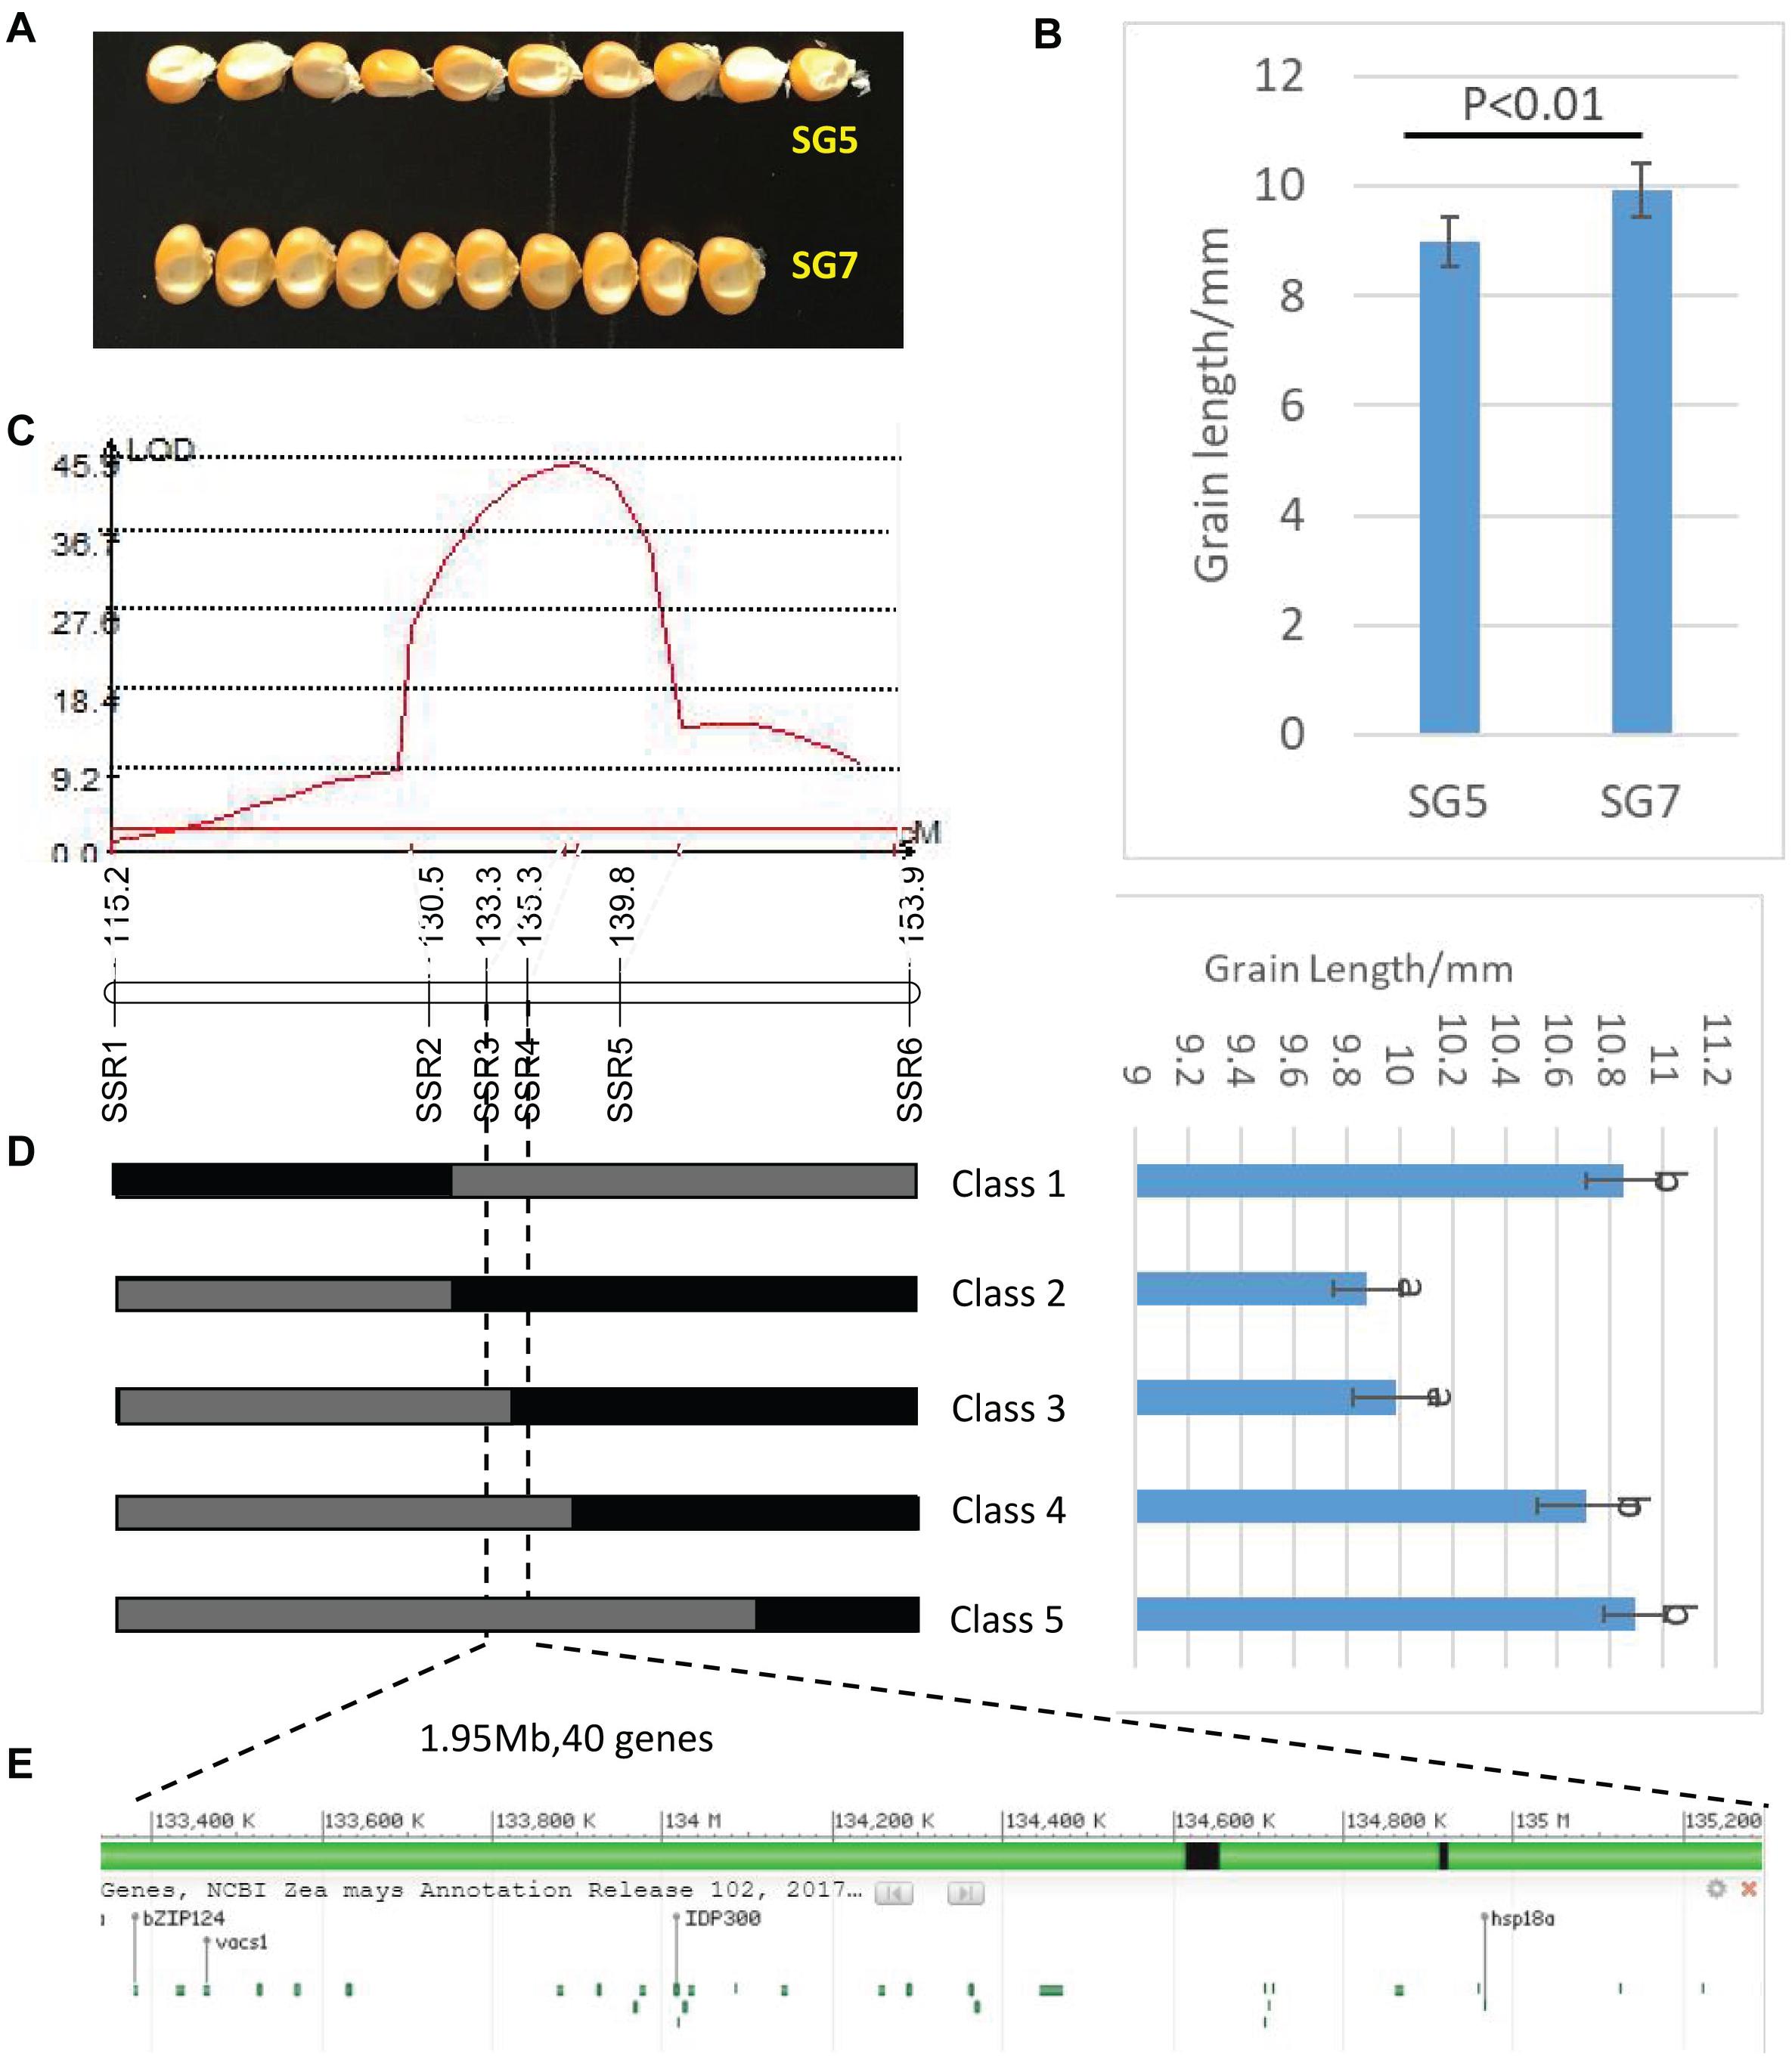
Figure 3. (A) Grain length difference between SG5 and SG7. (B) Significance test of difference between SG5 and SG7, P < 0.01 means that difference was extremely significant between SG5 and SG7. (C) LOD profile of qKL-2, which was identified in the BC3F1 populations. (D) Major QTLqKL-2 was mapped in SSR3 and SSR5interval by using 998 BC3F1 plants. Class 1–Class 5 indicates the recombinants with different recombination types. Graphical genotypes and their phenotypic values of recombinant lines separated in BC3F1. Black bars and gray bars represent the chromosomal segments for the homozygous SG7 and heterozygous alleles, respectively. The progeny test of homozygous segregants indicated that qKL-2 was located at an interval of 1.95 Mb and flanked by SSR3 and SSR4. Different letters indicate significant difference at the 0.05 level. (E) Physical positions of the 40 protein coding genes in the mapped 1.95 Mb region (B73 RefGen_v4).
Then the major QTL qKL-2 was detected with the secondary linkage map of NILs by CIM method in QTL Cartographer v2.5. The qKL-2 had an additive effect of 0.97 mm and explained 16% of phenotypic variation. The LOD peak indicated that qKL-2 was most likely located between SSR3 and SSR5, the LOD peak position was located between SSR3 and SSR4 (Figure 3C). To confirm the narrowed qKL-2 interval, five recombinant types, namely, Class 1–Class 5, were selected from 998 NILs. Class 1 indicates that 28 recombinants with SSR1 and SSR2 homozygous and SSR3–SSR6 heterozygous. Class 2 indicates 33 recombinants with SSR1 and SSR2 heterozygous and SSR3–SSR6 homozygous. Class 3 indicates three recombinants with SSR1–SSR3 heterozygous and SSR4–SSR6 homozygous. Class 4 indicates 20 recombinants with SSR1–SSR4 heterozygous and SSR5–SSR6 homozygous. Class 5 indicates 47 recombinants with SSR1–SSR5 heterozygous and SSR6 homozygous. At SSR3 and SSR4 loci, Classes 2 and 3 were homozygous while Classes 1, 4, and 5 were heterozygous. There was significantly difference in phenotypic values between the two set of recombinants Classes 2 and 3 and Classes 1, 4, and 5 (Figure 3D). The progeny test of homozygous segregants indicated that qKL-2 was located in an interval of 1.95 Mb (133.34–135.29) and flanked by SSR3 and SSR4 physical interval (Table 3). The selected overlapping recombinant chromosomes also supported the location of qKL-2.
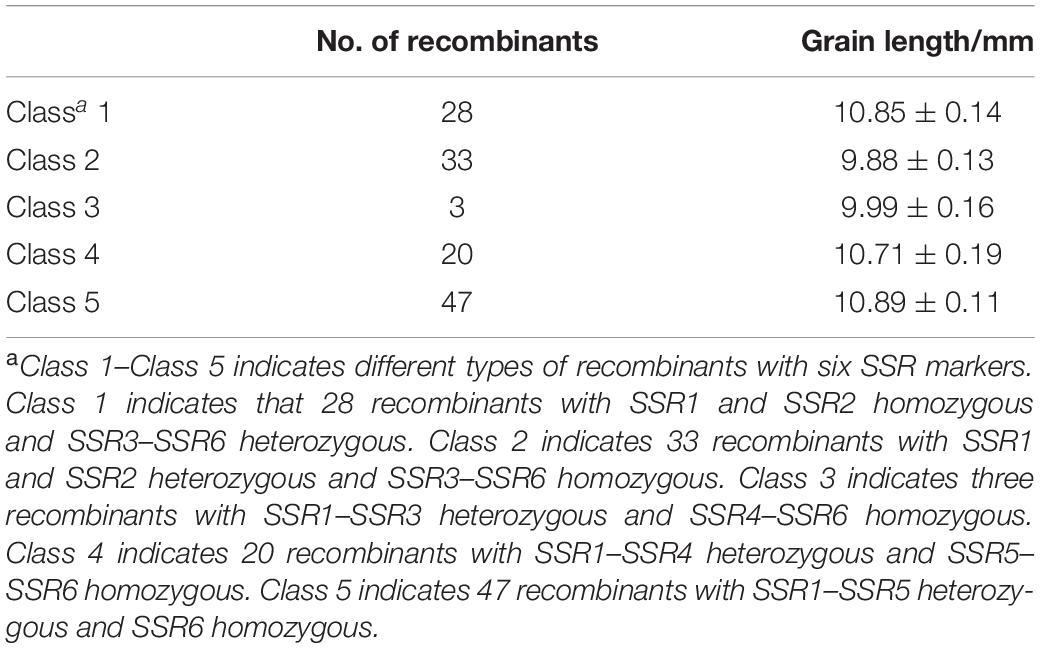
Table 3. Statistical analysis of phenotypic values from different types of recombinants in NILs around the qKL-2 region.
Candidate Genes for qKL-2 Prediction
RNA-seq procedure was conducted for 18 RNA grain samples at different developmental stages. Results showed that the 1.95 Mb physical intervals of qKL-2 encompassed 40 protein coding genes (Figure 3E). After DEGs analysis, a total of 11 protein coding genes differently expressed and left in the qKL-2 physical intervals (Table 4). Previous studies indicated that FERONIA receptor kinase controls seed size in Arabidopsis thaliana (Yu et al., 2014). GRMZM2G006080 encodes receptor-like protein kinase FERONIA and was predicted as a candidate gene of qKL-2, which is most likely responsible for KL.
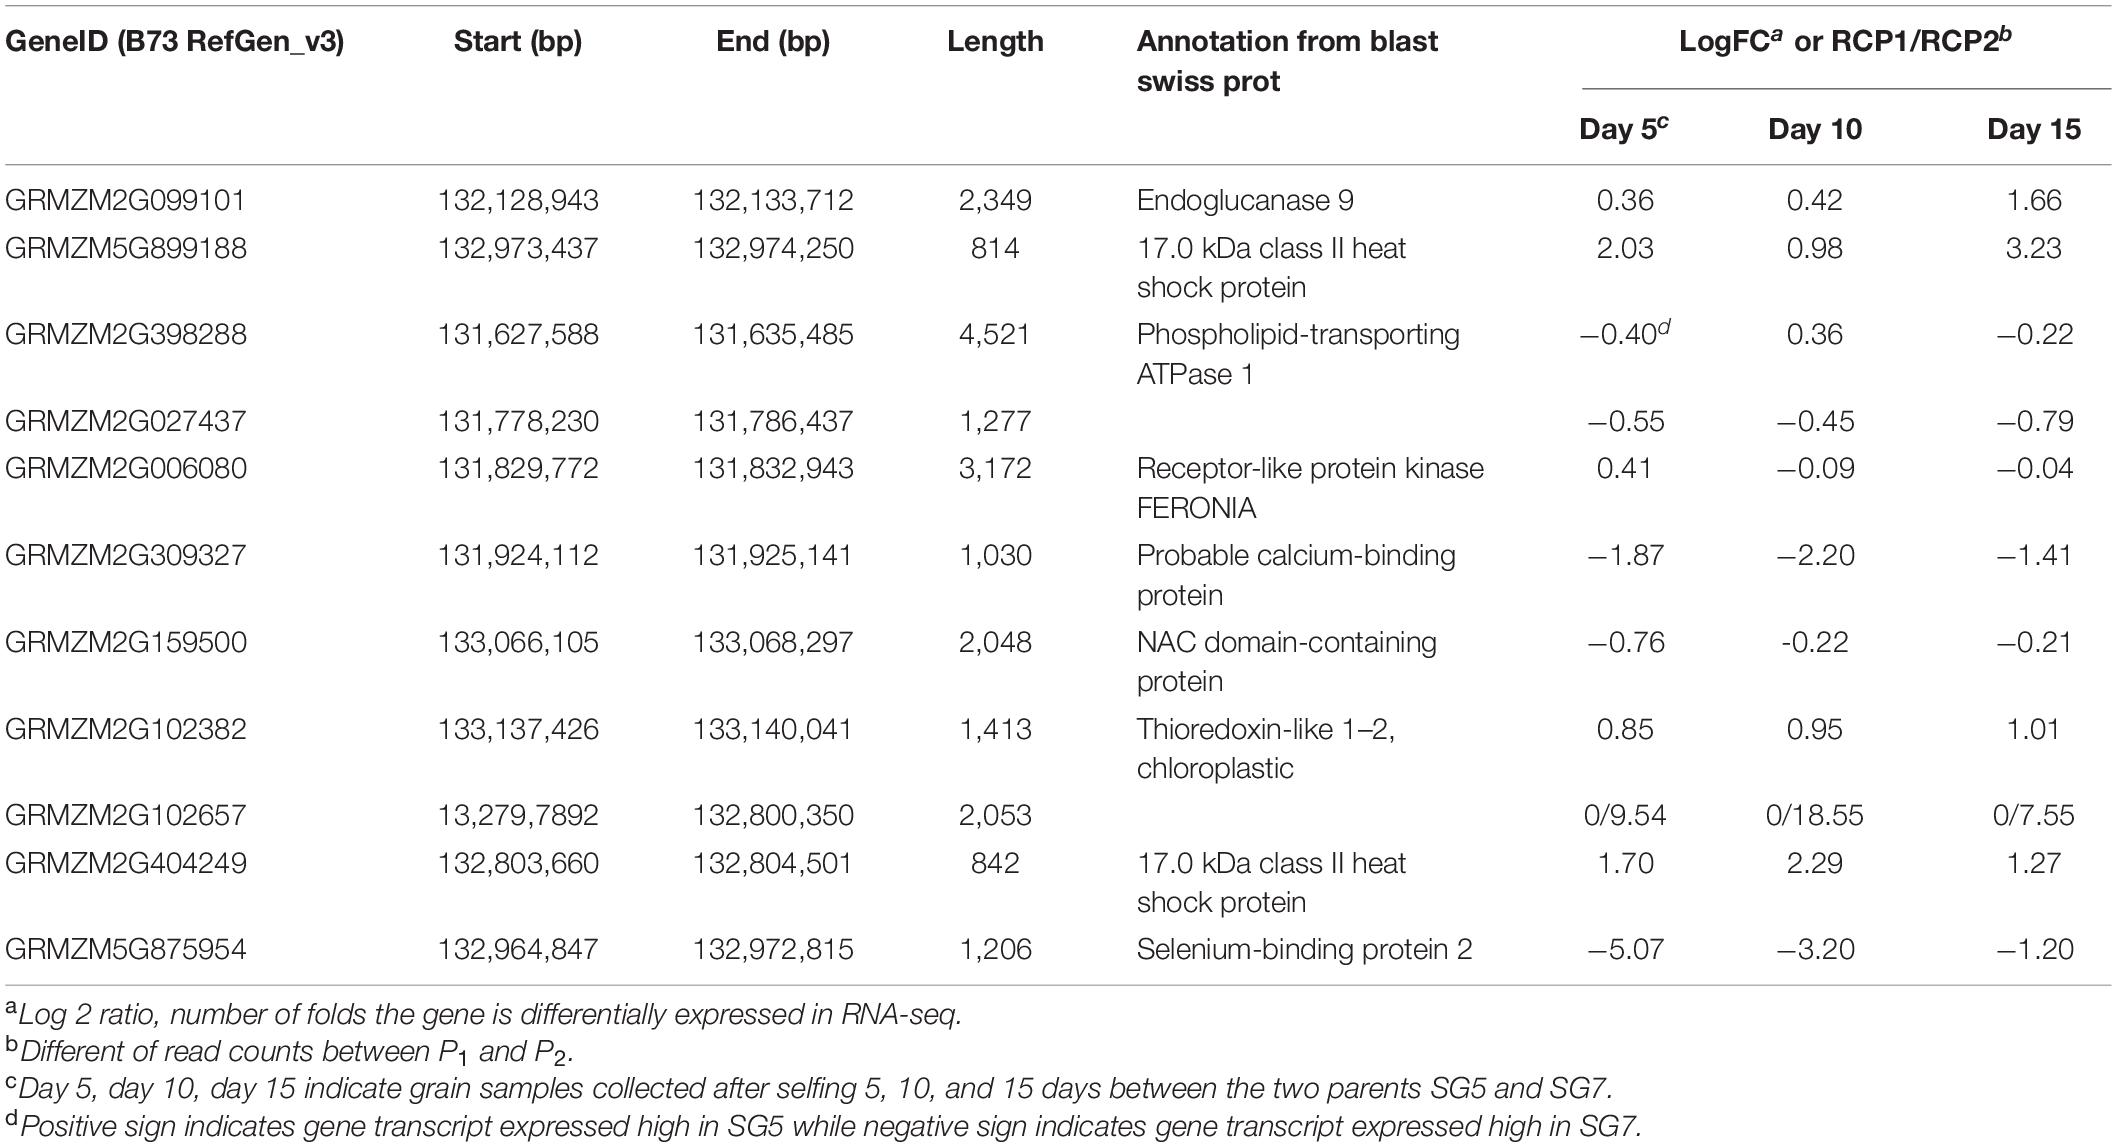
Table 4. Differentially expressed genes out of 40 protein coding genes in 1.95 Mb physical interval on chromosome 9 and candidate gene predicted for qKL-2.
Discussion
Kernel size controlled by multiple genes is an important component of grain yield in maize. Grain yield was influenced significantly by kernel size, especially KL (Li et al., 2009, 2013). Stable QTLs are of great significance for marker-assisted breeding, while false positive QTLs are of no use. Normally, two steps, i.e., primary mapping and fine mapping, are needed for QTL analysis unless experiments were conducted in multiple environments with as many as sample size and marker numbers. In this study, primary mapping was carried out in three environments, and two kernel-size QTLs, qKL-2, and qKW-1, detected in all three environments were stable. The two QTLs could be benefit for further marker assisted breeding. Chen et al. (2017) conducted metaQTL analysis based on collecting information on QTLs conferring maize yield-related traits from 33 published studies. A total of 76 MQTLs for maize yield and its related traits were identified across the whole genome, with the number per chromosome ranging from four on chromosome 4–10 on chromosome 5 (Chen et al., 2017). After comparing with the metaQTL analysis results, qKL-1, qKW-1, and qKW-2 detected in this study all overlapped with those MQTLs for kernel-related traits but with more decreased physical intervals (Table 2).
For qKL-2 locus, primary mapping results showed that the physical intervals were 133.20–135.75, 131.55–134.75, and 127.55–130.05 Mb on chromosome 9, respectively, in three environments. In order to confirm and fine map qKL-2, a NIL population was developed by continuous backcross with markers assisted selection for confirming and fine mapping qKL-2. Finally, qKL-2 was mapped in a 1.95 Mb (133.34–135.29 Mb) interval on maize chromosome 9. Compared with metaQTL analysis results from Chen et al. (2017), MQTL-66, which includes 16 QTLs related to grain yield, ear-related traits, and kernel-related traits located in 120.2–133.6 physical interval on chromosome 9. There was only 0.26 Mb physical distance overlap for qKL-2 (133.34–135.29 Mb) and MQTL-66 (120.2–133.6 Mb). It is very likely that qKL-2 was a new locus to control KL.
It is of critical importance that the less genes the better in target QTL interval for map-based cloning. In this study, RNA-seq technology was applied for transcriptomic analyzing DEGs between SG5 and SG7 grains in different developmental stages. DEGs identified were located in the qKL-2 interval. After DEGs analysis, only 11 protein coding genes were left in the QTL qKL-2 intervals (Table 4). The potential functional genes in QTLs physical intervals decreased significantly after DEGs analysis. According to gene annotation from Blast swiss prot, the function of 11 genes include endoglucanase, 17.0 kDa class II heat shock protein, phospholipid-transporting ATPase 1, receptor-like protein kinase FERONIA, calcium-binding protein, selenium-binding protein 2, NAC domain-containing protein, and thioredoxin-like 1–2, chloroplastic. Further comparative genomics analysis was applied for predicting candidate genes. The evidence on studies of rice or Arabidopsis thaliana showed that kernel size was regulated by multiple signaling pathways, including ubiquitin-proteasome degradation (Verma et al., 2004), the transcription factor pathway, the phytohormone signaling pathway, and the G protein independent pathway. Yu et al. (2014) concluded that receptor kinase FERONIA involved in a signaling pathway negatively regulated the elongation of integument cells and then controlled the seed size in A. thaliana. Based on the above function analysis of 11 protein coding genes, GRMZM2G006080, which encodes receptor-like protein kinase FERONIA, was predicted as a candidate gene of kernel size. The predicted candidate gene will not only be helpful for underlying genetic mechanism for kernel size but also provides a basis for improving kernel size traits in maize.
Materials and Methods
Segregation Population Development and Phenotypic Evaluation
Two maize inbred lines, SG5 and SG7, were used in the study. The seeds were provided by the Institute of Grain and Oil, Liupanshui Academy of Agricultural Sciences, Liupanshui, China. We developed an F2 population by crossing SG5 and SG7 in Liupanshui, Guizhou province of China in the summer of 2013 and 2014. A total of 199 F2 individuals were planted at the Panxian Maize Breeding Station in Sanya, China, in the winter of 2014. Then, an F2:3 segregation population containing 199 lines was developed by selfing each F2 individuals. The F2:3 population was planted at the Panxian Maize Breeding Station in Sanya for kernel size evaluation in the summer of 2018 and 2019. Field experiment was performed in a randomized block design with three replications. Single-row plots with row spacing of 50 cm were adopted, and each plot grew 15 plants with plant spacing of 35 cm. Kernel size traits, including KL and KW, were investigated in both F2 and F2:3 populations after corns were harvested and dried naturally. For F2 generation, the traits were estimated by the mean value of three repeats including 10 kernels of an ear. For F2:3, kernel size evaluation was based on eight ears from the middle part of each plot. KL and KW were estimated by mean value of three repeats including 10 kernels randomly selected from bulked kernels of eight ears. The measured kernels were all sampled from the middle part of an ear.
Young leaves were collected from each F2 individual for DNA extraction. The methods of genomic DNA extraction, genotype sequencing, and grouping, single nucleotide polymorphisms (SNPs) identification, and high-density linkage map construction were presented in our previous study (Su et al., 2017). The forward regression model of CIM method in QTL Cartographer v2.5 was applied for QTL mapping with walking speed of 1 cM. The likelihood of odds (LOD) value 3.86 was used to declare a QTL, which was based upon 1,000 times permutations analysis. QTL statistics were also reported for those in which the LOD score exceeded 2.5. LOD peaks were used for determining the position of a significant QTL on chromosomes. The positive additive effect value of a QTL indicates that the increase in phenotypic value is provided by SG5 alleles while negative value indicates the decrease in phenotypic value is provided by SG7 alleles. MapChart 2.32 software (Voorrips, 2002) was used for the graphical presentation of QTLs. The QTLs that are mapped in F2 and F2:3 populations were compared, and the consistent one will be regarded as stable QTL.
NILs Development and qKL-2 Fine Mapping
NILs for the qKL-2 locus were developed by using continuous backcrossing combined with marker-assisted selection methods. The SSR molecular markers that are near qKL-2 and are polymorphic between donor parent SG5 and recurrent parent SG7 were used for marker-assisted selection of the BC2F1 generation. These SSR markers, based on resequencing maize genome results, were all developed by Xu et al. (2013). We choose SSRs that are near qKL-2 position with high polymorphism information content (PIC) values. These SSRs were used for screening polymorphism between our parental lines SG5 and SG7. SSRs with clearly bands of polyacrylamide gel electrophoresis (PAGE) and polymorphism between SG5 and SG7 were selected for developing secondary linkage map and further fine mapping works. Phenotypic value for BC3F1 lines was investigated in the same way as for the F2 population. Young healthy leaves were collected from each of the 998 BC3F1 line for genomic DNA extraction. Plant Genomic DNA Kit (TIANGEN, Beijing, China) were used and the manufacturer’s protocols were followed. DNA purity was checked by 1% agarose gel and NanoPhotometer R spectrophotometer (IMPLEN, CA, United States). DNA concentration was then measured using an Qubit R DNA Assay Kit in Qubit R 2.0 Flurometer (Life Technologies, CA, United States).
The secondary linkage map around qKL-2 was generated by JoinMap 3.0 software (Van Ooijen and Voorrips, 2001). QTL Cartographer v2.5 was applied for QTL mapping with the CIM method, walking speed 1 cM, and a LOD threshold of 10.0.
Candidate Gene for qKL-2 Prediction
Grains of SG5 and SG7 were sampled on the 5th, 10th, and 15th days after selfing three biological replicates. All collected samples were immediately frozen in liquid nitrogen and then transferred to a −80°C environment before RNA extraction. We finally got 18 grain samples in total. All the samples were sequenced at the Illumina NovaSeq platform. Raw reads with fastq format were firstly handled by in-house perl scripts. Clean reads were then obtained after deleting reads containing adapters and ploy-N and removing reads of a low quality in raw data. In the meantime, the GC content and Q20 and Q30 of the clean reads were calculated. High-quality clean data were then carried out for further downstream analyzing. Reference genome was downloaded directly from genome website1, and correlated files of gene annotation were also downloaded from the same website. Bowtie v2.2.3 was used for building reference genome index and TopHat v2.0.12 (Trapnell et al., 2013) was used for aligning paired-end clean reads to the reference genome. The number of reads mapped to each gene was counted by HTSeq v0.6.1. For each gene, the expected number of fragments per kilobase of transcript sequence per millions base pairs (FPKM) was calculated by analyzing the gene length and reads mapped to the gene. FPKM is a widely accepted method currently to evaluate levels of gene expression based on considering sequencing depth effect and gene length of the read count simultaneously (Trapnell et al., 2010). The DEGSeq R package (1.20.0) was applied for analyzing differential expression between two conditions. The P-values adjusted by using the Benjamini and Hochberg method were used. The threshold of corrected P-value 0.005 and log 2 (Fold change) of 1 (absolute value) were considered as significantly differential expression. More information about the methods for reference genome index construction, paired-end clean reads alignment and count, FPKM calculation and DEGs analysis referred to our previous study (Zhao and Su, 2019).
Through analyzing DEGs between SG5 and SG7, the DEGs that were overlaid on to a physical interval of qKL-2 were considered as candidate genes for kernel size in maize. The detected DEGs were further annotated from Blast Swiss Prot database.
Data Availability Statement
The datasets generated for this study can be found in NCBI BioProject PRJNA673992, https://www.ncbi.nlm.nih.gov/bioproject/PRJNA673992/. We have uploaded our SNP sequencing data to FigShare repository https://doi.org/10.6084/m9.figshare.13120322.v1.
Author Contributions
GW and YZ developed the F2, F2:3, and BC3F1 population. WM and XM performed the phenotype investigation. CS developed the genotyping of F2:3 progeny, analyzed the data, and drafted the manuscript. All authors read and approved the final manuscript.
Funding
This work was supported by the National Natural Science Foundation of China (Grant #31460359), Research Foundation for Advanced Talents of Qingdao Agricultural University (Grant #6631118035), the Natural Science Foundation of Guizhou Province of China [Grant #Qian Kehe J word (2014)2155 and Grant #Qian Kehe LH word (2015)7605].
Conflict of Interest
The authors declare that the research was conducted in the absence of any commercial or financial relationships that could be construed as a potential conflict of interest.
Acknowledgments
This manuscript has been released as a pre-print at ResearchSquare (Wang et al., 2020).
Supplementary Material
The Supplementary Material for this article can be found online at: https://www.frontiersin.org/articles/10.3389/fgene.2020.603920/full#supplementary-material
Footnotes
- ^ ftp://ftp.ensemblgenomes.org/pub/plants/release-29/fasta/zea_mays/dna/Zea_mays.AGPv3.29.dna.toplevel.fa.gz
References
Chen, L., An, Y., Li, Y., Li, C., Shi, Y., Song, Y., et al. (2017). Candidate loci for yield-related traits in maize revealed by a combination of metaQTL analysis and regional association mapping. Front. Plant Sci. 8:2190. doi: 10.3389/fpls.2017.02190
Chen, L., Li, Y-X, Li, C., Wu, X., Qin, W., Li, X., et al. (2016). Fine-mapping of qGW4. 05, a major QTL for kernel weight and size in maize. BMC Plant Biol. 16:81. doi: 10.1186/s12870-016-0768-6
Doebley, J. F., Gaut, B. S., and Smith, B. D. (2006). The molecular genetics of crop domestication. Cell 127, 1309–1321.
Du, L., Li, N., Chen, L., Xu, Y., Li, Y., Zhang, Y., et al. (2014). The ubiquitin receptor DA1 regulates seed and organ size by modulating the stability of the ubiquitin-specific protease UBP15/SOD2 in Arabidopsis. Plant Cell 26, 665–677. doi: 10.1105/tpc.114.122663
Edwards, M., Stuber, C., and Wendel, J. (1987). Molecular-marker-facilitated investigations of quantitative-trait loci in maize. I. Numbers, genomic distribution and types of gene action. Genetics 116, 113–125.
Fan, C., Xing, Y., Mao, H., Lu, T., Han, B., Xu, C., et al. (2006). GS3, a major QTL for grain length and weight and minor QTL for grain width and thickness in rice, encodes a putative transmembrane protein. Theoret. Appl. Genet. 112, 1164–1171. doi: 10.1007/s00122-006-0218-1
Feuillet, C., and Eversole, K. (2009). Solving the maze. Science 326, 1071–1072. doi: 10.1126/science.1183463
Gao, L., Yang, G., Li, Y., Fan, N., Li, H., Zhang, M., et al. (2019). Fine mapping and candidate gene analysis of a QTL associated with leaf rolling index on chromosome 4 of maize (Zea mays L.). TAG. Theor. Appl. Genet. 132, 3047–3062. doi: 10.1007/s00122-019-03405-1
Gaut, B. S., D’ennequin, M. L. T., Peek, A. S., and Sawkins, M. C. (2000). Maize as a model for the evolution of plant nuclear genomes. Proc. Natl. Acad. Sci. 97, 7008–7015. doi: 10.1073/pnas.97.13.7008
Han, Y., Li, D., Zhu, D., Li, H., Li, X., Teng, W., et al. (2012). QTL analysis of soybean seed weight across multi-genetic backgrounds and environments. Theoret. Appl. Genet. 125, 671–683. doi: 10.1007/s00122-012-1859-x
Helentjaris, T., Slocum, M., Wright, S., Schaefer, A., and Nienhuis, J. (1986). Construction of genetic linkage maps in maize and tomato using restriction fragment length polymorphisms. Theoret. Appl. Genet. 72, 761–769. doi: 10.1007/bf00266542
Hu, J., Wang, Y., Fang, Y., Zeng, L., Xu, J., Yu, H., et al. (2015). A rare allele of GS2 enhances grain size and grain yield in rice. Mol. Plant 8, 1455–1465. doi: 10.1016/j.molp.2015.07.002
Kang, Y.-J., Shim, K.-C., Lee, H.-S., Jeon, Y.-A., Kim, S.-H., Kang, J.-W., et al. (2018). Fine mapping and candidate gene analysis of the quantitative trait locus gw8. 1 associated with grain length in rice. Genes Genom. 40, 389–397. doi: 10.1007/s13258-017-0640-6
Li, C., Li, Y., Sun, B., Peng, B., Liu, C., Liu, Z., et al. (2013). Quantitative trait loci mapping for yield components and kernel-related traits in multiple connected RIL populations in maize. Euphytica 193, 303–316. doi: 10.1007/s10681-013-0901-7
Li, H., Yang, Q., Fan, N., Zhang, M., Zhai, H., Ni, Z., et al. (2017). Quantitative trait locus analysis of heterosis for plant height and ear height in an elite maize hybrid zhengdan 958 by design III. BMC Genet 18:36. doi: 10.1186/s12863-017-0503-9
Li, J., Thomson, M., and McCouch, S. R. (2004). Fine mapping of a grain-weight quantitative trait locus in the pericentromeric region of rice chromosome 3. Genetics 168, 2187–2195. doi: 10.1534/genetics.104.034165
Li, Y., Fan, C., Xing, Y., Jiang, Y., Luo, L., Sun, L., et al. (2011). Natural variation in GS5 plays an important role in regulating grain size and yield in rice. Nat. Genet. 43:1266. doi: 10.1038/ng.977
Li, Y., Wang, Y., Shi, Y., Song, Y., Wang, T., and Li, Y. (2009). Correlation analysis and QTL mapping for traits of kernel structure and yield components in maize. Sci. Agricult. Sin. 42, 408–418.
Lin, H., Liang, Z.-W., Sasaki, T., and Yano, M. (2003). Fine mapping and characterization of quantitative trait loci Hd4 and Hd5 controlling heading date in rice. Breed. Sci. 53, 51–59. doi: 10.1270/jsbbs.53.51
Liu, M., Tan, X., Yang, Y., Liu, P., Zhang, X., Zhang, Y., et al. (2020). Analysis of the genetic architecture of maize kernel size traits by combined linkage and association mapping. Plant Biotechnol. J. 18, 207–221. doi: 10.1111/pbi.13188
Liu, Y., Wang, L., Sun, C., Zhang, Z., Zheng, Y., and Qiu, F. (2014). Genetic analysis and major QTL detection for maize kernel size and weight in multi-environments. Theoret. Appl. Genet. 127, 1019–1037. doi: 10.1007/s00122-014-2276-0
Nie, N., Ding, X., Chen, L., Wu, X., An, Y., Li, C., et al. (2019). Characterization and fine mapping of qkrnw4, a major QTL controlling kernel row number in maize. TAG. Theor. Appl. Genet. 132, 3321–3331. doi: 10.1007/s00122-019-03427-9
Nzuve, F., Githiri, S., Mukunya, D., and Gethi, J. (2014). Genetic variability and correlation studies of grain yield and related agronomic traits in maize. J. Agricult. Sci. 6, 166–176.
Qiu, L., Guo, Y., Li, Y., Wang, X., Zhou, G., Liu, Z., et al. (2011). Novel gene discovery of crops in China: status, challenging, and perspective. Acta Agronom. Sin. 37, 1–17. doi: 10.3724/sp.j.1006.2011.00001
Qiu, X., Gong, R., Tan, Y., and Yu, S. (2012). Mapping and characterization of the major quantitative trait locus qSS7 associated with increased length and decreased width of rice seeds. Theoret. Appl. Genet. 125, 1717–1726. doi: 10.1007/s00122-012-1948-x
Rafiq, C. M., Rafique, M., Hussain, A., and Altaf, M. (2010). Studies on heritability, correlation and path analysis in maize (Zea mays L.). J. Agricult. Res. 48, 35–38.
Ramya, P., Chaubal, A., Kulkarni, K., Gupta, L., Kadoo, N., Dhaliwal, H., et al. (2010). QTL mapping of 1000-kernel weight, kernel length, and kernel width in bread wheat (Triticum aestivum L.). J. Appl. Genet. 51, 421–429. doi: 10.1007/bf03208872
Song, X.-J., Huang, W., Shi, M., Zhu, M.-Z., and Lin, H.-X. (2007). A QTL for rice grain width and weight encodes a previously unknown RING-type E3 ubiquitin ligase. Nat. Genet. 39, 623. doi: 10.1038/ng2014
Su, C., Wang, W., Gong, S., Zuo, J., Li, S., and Xu, S. (2017). High density linkage map construction and mapping of yield trait QTLs in maize (Zea mays) using the genotyping-by-sequencing (GBS) technology. Front. Plant Sci. 8:706. doi: 10.3389/fpls.2017.00706
Sun, X.-Y., Wu, K., Zhao, Y., Kong, F.-M., Han, G.-Z., Jiang, H.-M., et al. (2009). QTL analysis of kernel shape and weight using recombinant inbred lines in wheat. Euphytica 165:615. doi: 10.1007/s10681-008-9794-2
Tian, F., Bradbury, P. J., Brown, P. J., Hung, H., Sun, Q., Flint-Garcia, S., et al. (2011). Genome-wide association study of leaf architecture in the maize nested association mapping population. Nat. Genet. 43, 159–162. doi: 10.1038/ng.746
Trapnell, C., Hendrickson, D. G., Sauvageau, M., Goff, L., Rinn, J. L., and Pachter, L. (2013). Differential analysis of gene regulation at transcript resolution with RNA-seq. Nat. Biotechnol. 31, 46–53. doi: 10.1038/nbt.2450
Trapnell, C., Williams, B. A., Pertea, G., Mortazavi, A., Kwan, G., Van Baren, M. J., et al. (2010). Transcript assembly and quantification by RNA-Seq reveals unannotated transcripts and isoform switching during cell differentiation. Nat. Biotechnol. 28, 511–515. doi: 10.1038/nbt.1621
Van Ooijen, J., and Voorrips, R. (2001). Software for the calculation of genetic linkage maps. Netherlands: Plant Research International Wageningen.
Verma, R., Oania, R., Graumann, J., and Deshaies, R. J. (2004). Multiubiquitin chain receptors define a layer of substrate selectivity in the ubiquitin-proteasome system. Cell 118, 99–110. doi: 10.1016/j.cell.2004.06.014
Voorrips, R. (2002). MapChart: software for the graphical presentation of linkage maps and QTLs. J. Heredity 93, 77–78. doi: 10.1093/jhered/93.1.77
Wan, X., Wan, J., Jiang, L., Wang, J., Zhai, H., Weng, J., et al. (2006). QTL analysis for rice grain length and fine mapping of an identified QTL with stable and major effects. Theoret. Appl. Genet. 112, 1258–1270. doi: 10.1007/s00122-006-0227-0
Wang, G., Zhao, Y., Zhu, Z., Zhang, X., Jiang, M., Cheng, M., et al. (2020). QTL analysis and fine mapping of a major QTL conferring kernel size in maize (Zea mays). ResearchSquare doi: 10.21203/rs.3.rs-20357/v1
Wang, S., Li, S., Liu, Q., Wu, K., Zhang, J., Wang, S., et al. (2015). The OsSPL16-GW7 regulatory module determines grain shape and simultaneously improves rice yield and grain quality. Nat. Genet. 47:949. doi: 10.1038/ng.3352
Wang, S., Wu, K., Yuan, Q., Liu, X., Liu, Z., Lin, X., et al. (2012). Control of grain size, shape and quality by OsSPL16 in rice. Nat. Genet. 44:950. doi: 10.1038/ng.2327
Xia, T., Li, N., Dumenil, J., Li, J., Kamenski, A., Bevan, M. W., et al. (2013). The ubiquitin receptor DA1 interacts with the E3 ubiquitin ligase DA2 to regulate seed and organ size in Arabidopsis. Plant Cell 25, 3347–3359. doi: 10.1105/tpc.113.115063
Xie, X., Song, M.-H., Jin, F., Ahn, S.-N., Suh, J.-P., Hwang, H.-G., et al. (2006). Fine mapping of a grain weight quantitative trait locus on rice chromosome 8 using near-isogenic lines derived from a cross between Oryza sativa and Oryza rufipogon. Theoret. Appl. Genet. 113, 885–894. doi: 10.1007/s00122-006-0348-5
Xu, J., Liu, L., Xu, Y., Chen, C., Rong, T., Ali, F., et al. (2013). Development and characterization of simple sequence repeat markers providing genome-wide coverage and high resolution in maize. DNA Res. 20, 497–509. doi: 10.1093/dnares/dst026
Xu, Y., Li, H.-N., Li, G.-J., Wang, X., Cheng, L.-G., and Zhang, Y.-M. (2011). Mapping quantitative trait loci for seed size traits in soybean (Glycine max L. Merr.). Theoret. Appl. Genet. 122, 581–594. doi: 10.1007/s00122-010-1471-x
Xue, S., Xu, F., Li, G., Zhou, Y., Lin, M., Gao, Z., et al. (2013). Fine mapping TaFLW1, a major QTL controlling flag leaf width in bread wheat (Triticum aestivum L.). Theoret. Appl. Genet. 126, 1941–1949. doi: 10.1007/s00122-013-2108-7
Yang, M., Chen, L., Wu, X., Gao, X., Li, C., Song, Y., et al. (2018). Characterization and fine mapping of qkc7.03: a major locus for kernel cracking in maize. TAG. Theor. Appl. Genet. 131, 437–448. doi: 10.1007/s00122-017-3012-3
Yu, F., Li, J., Huang, Y., Liu, L., Li, D., Chen, L., et al. (2014). FERONIA receptor kinase controls seed size in Arabidopsis thaliana. Mol. Plant 7, 920–922. doi: 10.1093/mp/ssu010
Zhang, X., Wang, J., Huang, J., Lan, H., Wang, C., Yin, C., et al. (2012). Rare allele of OsPPKL1 associated with grain length causes extra-large grain and a significant yield increase in rice. Proc. Natl. Acad. Sci. 109, 21534–21539. doi: 10.1073/pnas.1219776110
Zhang, Z., Liu, Z., Hu, Y., Li, W., Fu, Z., Ding, D., et al. (2014). QTL analysis of kernel-related traits in maize using an immortalized F2 population. PLoS One 9:e89645. doi: 10.1371/journal.pone.0089645
Zhao, Y., and Su, C. (2019). Mapping quantitative trait loci for yield-related traits and predicting candidate genes for grain weight in maize. Sci. Rep. 9, 1–10.
Keywords: candidate gene, maize, fine mapping, kernel size, NILs
Citation: Wang G, Zhao Y, Mao W, Ma X and Su C (2020) QTL Analysis and Fine Mapping of a Major QTL Conferring Kernel Size in Maize (Zea mays). Front. Genet. 11:603920. doi: 10.3389/fgene.2020.603920
Received: 08 September 2020; Accepted: 05 November 2020;
Published: 27 November 2020.
Edited by:
Jian Ma, Sichuan Agricultural University, ChinaReviewed by:
Zhi Zheng, Plant Industry (CSIRO), AustraliaBaohua Wang, Nantong University, China
Yanru Cui, University of California, Riverside, United States
Copyright © 2020 Wang, Zhao, Mao, Ma and Su. This is an open-access article distributed under the terms of the Creative Commons Attribution License (CC BY). The use, distribution or reproduction in other forums is permitted, provided the original author(s) and the copyright owner(s) are credited and that the original publication in this journal is cited, in accordance with accepted academic practice. No use, distribution or reproduction is permitted which does not comply with these terms.
*Correspondence: Chengfu Su, chfsu2008@163.com
†These authors have contributed equally to this work