 Ying Lin
 Shiva Afshar
 Anjali M. Rajadhyaksha
 James B. Potash
 Shizhong Han
- 1Department of Industrial Engineering, University of Houston, Houston, TX, United States
- 2Division of Pediatric Neurology, Department of Pediatrics, Weill Cornell Medicine, New York, NY, United States
- 3Feil Family Brain & Mind Research Institute, Weill Cornell Medicine, New York, NY, United States
- 4Weill Cornell Autism Research Program, Weill Cornell Medicine, New York, NY, United States
- 5Department of Psychiatry and Behavioral Sciences, Johns Hopkins School of Medicine, Baltimore, MD, United States
- 6Lieber Institute for Brain Development, Baltimore, MD, United States
Autism spectrum disorder (ASD) is a complex neurodevelopmental condition with a strong genetic basis. The role of de novo mutations in ASD has been well established, but the set of genes implicated to date is still far from complete. The current study employs a machine learning-based approach to predict ASD risk genes using features from spatiotemporal gene expression patterns in human brain, gene-level constraint metrics, and other gene variation features. The genes identified through our prediction model were enriched for independent sets of ASD risk genes, and tended to be down-expressed in ASD brains, especially in frontal and parietal cortex. The highest-ranked genes not only included those with strong prior evidence for involvement in ASD (for example, NBEA, HERC1, and TCF20), but also indicated potentially novel candidates, such as, MYCBP2 and CAND1, which are involved in protein ubiquitination. We also showed that our method outperformed state-of-the-art scoring systems for ranking curated ASD candidate genes. Gene ontology enrichment analysis of our predicted risk genes revealed biological processes clearly relevant to ASD, including neuronal signaling, neurogenesis, and chromatin remodeling, but also highlighted other potential mechanisms that might underlie ASD, such as regulation of RNA alternative splicing and ubiquitination pathway related to protein degradation. Our study demonstrates that human brain spatiotemporal gene expression patterns and gene-level constraint metrics can help predict ASD risk genes. Our gene ranking system provides a useful resource for prioritizing ASD candidate genes.
Introduction
Autism spectrum disorder (ASD) is a neurodevelopmental condition characterized by impaired social interaction and communication, as well as repetitive behavior. While its etiology is complex, ASD has a strong genetic basis (Hallmayer et al., 2011; Jeste and Geschwind, 2014; Colvert et al., 2015). The role of de novo mutations in ASD has been firmly established through candidate gene (Wang et al., 2016; Stessman et al., 2017), whole exome (Iossifov et al., 2012, 2014; Sanders et al., 2012; Ronemus et al., 2014), and whole genome sequencing studies (Ryan et al., 2017; Turner et al., 2017). Although the list of risk genes implicated by de novo mutations is growing, it is still very likely far from complete, with an estimated full set of ASD genes ranging from several hundred to more than 1,000 (Iossifov et al., 2014). In the search for additional de novo mutations, sequencing studies continue to be an important approach, but the current sequencing cost is still very high, especially for large samples. As an alternative strategy, advanced analytical approaches, which leverage previously implicated genes and prior knowledge, have the potential to enhance risk gene discovery in an efficient and cost-effective manner (Asif et al., 2018; Gök, 2018; Brueggeman et al., 2020).
One approach is based on the concept of guilt-by-association, i.e., assuming that genes that confer risk for ASD are likely to be functionally related, and that they thus converge on molecular networks and biological pathways implicated in disease (Gandhi et al., 2006; Xu and Li, 2006). For example, one study showed that ASD genes with de novo mutations converged on pathways related to chromatin remodeling and synaptic function (Krumm et al., 2014). To leverage these functional relationships, several studies have explored integrating known risk genes using a protein-protein interaction (PPI) network to identify novel genes involved in ASD (Gilman et al., 2011; Li et al., 2014; Hormozdiari et al., 2015; Liu et al., 2015). However, a PPI network is built upon general PPIs without reference to tissue or cell type specificity, and this approach may not fully capture the brain-centric functional relationships among ASD genes. Accordingly, a brain-specific network-based approach, which considered relationships within the context of the brain, was proposed to predict ASD genes (Krishnan et al., 2016; Duda et al., 2018). Studies employing this paradigm, however, did not consider the dynamic patterns of gene relationships during brain development, thereby limiting their potential for discovery, given the possibility that genes might only be functionally related within a specific developmental stage. Evidence for this comes from Willsey et al. (2013) who showed, using spatiotemporal gene expression data from human brain, that co-expression patterns of ASD risk genes varied by spatiotemporal windows, with the strongest co-expression patterns observed in the prefrontal and primary motor–somatosensory cortical regions during midfetal development, suggesting an important convergence of risk gene activity in particular places at a particular time.
In addition to having functional relationships, ASD genes affected by de novo mutations tend to be intolerant of variations (Samocha et al., 2014; Iossifov et al., 2015). With the availability of sequencing data from large samples, recent work has developed measures to quantify the sensitivity of genes to disruptive functional variations (Petrovski et al., 2013; Lek et al., 2016). Utilizing exome data on more than 60,000 individuals from the Exome Aggregation Consortium (ExAC), a gene-level constraint metric–the probability of being loss-of-function (LoF) intolerant (pLI)–was created, which separates genes into LoF intolerant or LoF tolerant (Lek et al., 2016). Kosmicki et al. (2017) further demonstrated that the excess of de novo mutations in ASD individuals was primarily driven by LoF-intolerant genes, but not LoF-tolerant genes.
We reasoned that ASD risk genes show expression patterns that are clustered in specific brain regions and developmental stages critical to disease development, and that high resolution spatiotemporal gene expression patterns in human brain can help distinguish genes that cause disease from those that do not. In addition, because ASD genes affected by de novo mutations are sensitive to mutational changes, we reasoned that gene-level constraint metrics can further differentiate ASD genes from normal ones. The objective of this study was to employ a machine learning-based approach to predict ASD risk genes using human brain spatiotemporal gene expression signatures, gene-level constraint metrics, and other gene variation features. We compared the performance of our method with five other state-of-the-art scoring systems for ranking ASD candidate genes, and evaluated the risk genes from our prediction model using independent sets of risk genes and differential gene expression (DGE) evidence. Gene Ontology (GO) enrichment analysis was also performed to understand the biology underlying ASD risk genes.
Materials and Methods
Gene Set
To train the gene prediction model, we used labeled genes curated by Duda et al. (2018) as described in detail elsewhere. Briefly, the labeled genes contained 143 true positive genes and 1,145 true negative ones. The true positives came from the high confidence genes in the Simons Foundation Autism Research Initiative (SFARI) resource1 (Category 1, Category 2, and syndromic genes) and the 65 reported genes in Sanders et al. (2015). The true negative genes were selected from the non-ASD gene list created by Krishnan et al. (2016), which were genes associated with non-mental health diseases, as annotated in OMIM. Among these genes we focused on those that had both gene expression data from the BrainSpan atlas and gene-level constraint metrics available, so that our final training gene set included 121 true positive genes and 963 true negatives.
Prediction Feature Sets
The feature sets in our prediction task included spatiotemporal gene expression patterns in human brain, network features, gene-level constraint metrics, and other gene variation features. Supplementary Table S1 provides a summary of all features. We provide details below for each feature set.
Spatiotemporal Gene Expression
We downloaded RNA-Seq data (version 10), summarized to Gencode v20 gene-level reads per kilobase per million mapped reads (RPKM) values, from the BrainSpan website2. Detailed information on tissue processing, experimental and bioinformatics procedures related to the RNA-Seq data is available at the BrainSpan website. The BrainSpan dataset includes 524 gene-level expression features for each gene across 13 developmental stages in 31 brain regions from 524 brain samples spanning a variety of developmental stages and brain regions. Gene expression values were log-transformed (log2 [RPKM + 1]) and were used to predict autism genes.
To capture the functional relationships among genes, we built a weighted network for genes with both gene co-expression and PPI evidence from InWeb (Rossin et al., 2011). Specifically, the co-expression level between a gene pair was assessed by the Fischer z-transformed Pearson correlation between their spatiotemporal gene expression values. The genes with PPIs were connected and their edges were weighted by their co-expression levels. We extracted a set of network features that characterized the network topologies using igraph package in R. Specifically, we measured the node centralities using node degrees, clones centralities, betweenness centralities, Bonacich power centralities, eigenvector centralities, and alpha centralities (Bonacich, 1987). We captured the modules in functional relationship networks using the principle component decomposition and K-core decomposition (Batagelj and Zaversnik, 2003). The loading of the 1st principle component, hub score and coreness were obtained for each node. The importance of each node was further measured using the PageRank algorithm (Brin and Page, 1998), which counts the number and weight of links to each node. In total, 10 network features were extracted from the weighted gene network and were used for autism risk gene prediction. For genes appeared in BrainSpan but not in PPI network, we imputed their network features using the k-Nearest Neighbor algorithm.
Gene-Level Constraint Metrics and Other Gene Variation Features
We used gene-level constraint metrics developed from the exome data of more than 60,000 individuals from the ExAC to quantify the sensitivity of genes to variations (25). We considered six gene-level constraint metrics, including Z scores for synonymous (syn_z), missense (mis_z), and LoF variants (lof_z), the pLI, the probability of being intolerant of homozygous but not heterozygous LoF variants (pRec), and the probability of being tolerant of both heterozygous and homozygous LoF variants (pNull). A higher Z score or pLI indicates that the gene is more intolerant of variation (more constrained). We also included 10 general gene features, including the number of coding base pairs (bp), probabilities of mutations across the transcript for synonymous (mu_syn), missense (mu_mis), and LoF variants (mu_lof), number of rare variants (n_syn, n_mis, n_lof), and depth adjusted number of expected rare variants (exp_syn, exp_mis, exp_lof). Gene-level constraint metrics and general gene features were downloaded from the ExAC website3. Wilcoxon rank sum test was used to compare the group differences in above features between known ASD risk and non-risk genes.
Autism Risk Gene Prediction
We used machine learning methods to predict autism risk genes from their spatiotemporal expression signatures, network topology features, gene-level constraint metrics, and other general gene features. We applied four machine learning methods ranging from ones that are regression based [logistic regression and support vector machines (SVM) with Gaussian kernel] to others that are tree based (random forest and gradient boosted trees). The gradient boosted trees model ensembles a set of trees for prediction bias reduction and was trained in the XGBoost package (Chen et al., 2015). The optimal tuning parameters in each model were selected by a nested grid-search, and model performances were evaluated by five-fold cross validation (CV) on training data. The prediction accuracy was measured by the area under the receiver-operator curve (AUC-ROC) on the hold-out set for each fold of the CV. As the training data is unbalanced with small number of autism risk genes, we further considered the area under precision-recall curve (AUC-PRC) to measure the prediction accuracy.
Based on the average prediction accuracy over five folds, the gradient boosted trees model (BTree) was selected as the optimal algorithm. The final prediction model was built by applying the gradient boosted trees algorithm (with optimally tuned parameters) on all training genes and stored to predict over 17,000 unlabeled genes. For each labeled gene, the risk score was computed by prediction model that left the gene in the hold-out set in each CV.
Autism Risk Gene Validation Using Differential Gene Expression Evidence
Based on our gene ranking system, we classified genes into risk and non-risk genes using a threshold of risk score of 0.22 (resulting in 1,109 predicted ASD genes). We chose the risk score threshold of 0.22 because it gave the highest prediction accuracy (F1 score = 0.59) on training data. Genes with a risk score higher than the threshold were predicted as risk genes and the remaining genes were predicted as non-risk genes. We validated the classification performance by examining whether our predicted risk genes show DGE evidence for ASD. Specifically, we obtained DGE summary statistics (beta and p-values) for ASD from RNA-Seq datasets for four major cortical lobes (frontal, temporal, parietal, and occipital) and their average from Supplementary Table S1 of a previous study (Gandal et al., 2018), as well as the summary statistics for a non-psychiatric disorder inflammatory bowel disease (IBD) and two psychiatric disorders (bipolar disorder and schizophrenia) that we employed as negative controls from the same study (Gandal et al., 2018). The DGE summary statistics for IBD was derived using a linear mixed-effect model from meta-analysis of two published gene-expression microarray studies. The DGE summary statistics for ASD, bipolar disorder and schizophrenia were calculated using limma (Ritchie et al., 2015) with empiric Bayes moderated t-statistics from RNA-Seq analyses of post-mortem brain samples. The details for each datasets and DGE analyses were provided in the original study (Gandal et al., 2018). We used simulation-based approach to estimate the enrichment statistics of predicted risk genes in DGE evidence. We first generated a background distribution from 100,000 random gene sets, while matching for gene size found in predicted risk genes. The enrichment fold was estimated by the ratio of the observed number of risk genes with DGE evidence (p < 0.05) to the average number of that from random gene sets. The p-value for enrichment was then the proportion of random gene sets with the same or a greater number of genes with DGE evidence, as compared to the number found for predicted risk genes. To investigate whether the enrichment of DGE evidence was specific to ASD, we also performed the same enrichment analysis for IBD, bipolar disorder, and schizophrenia.
Autism Risk Gene Validation in Independent Sequencing Studies
We further evaluated our gene ranking system utilizing genes targeted by de novo LoF mutations from two studies, including one that performed whole exome sequencing of 2,517 families in the Simons Simplex Collection (SSC) cohort (Iossifov et al., 2014) and another that performed whole genome sequencing of the MSSNG cohort (Ryan et al., 2017). To get independent lists of genes for validation, we excluded candidate genes from the two validation cohorts that overlapped the true positive genes in the training sample. For the SSC cohort, after excluding genes not included in BrainSpan, we compiled a list of 346 singleton LoF de novo mutations in probands, and 170 LoF de novo mutations in the unaffected siblings as negative controls. From the study of the MSSNG cohort, we created a list of 212 de novo LoF mutations in probands, 58 statistically significant de novo LoF or missense mutations, and 18 statistically significant de novo LoF or missense mutations that were not previously reported. For each of the five gene lists, we tested whether a larger proportion of genes were observed in the first decile of our gene ranking system than expected using a binomial test. The expected proportion (0.166) was determined using the percentage of genes with synonymous de novo mutations in the unaffected siblings of the SSC cohort.
Comparison With Other Ranking Systems
We compared our predictions with five autism gene prediction scores, including the ExAC score (pLI) (Lek et al., 2016), Iossifov probability score (Iossifov et al., 2015), Krishnan probability score (Krishnan et al., 2016), Zhang D score (Zhang and Shen, 2017), and Duda score (Duda et al., 2018). The former two (Iossifov et al., 2015; Lek et al., 2016) were based on measures of gene intolerance to disruptive variations, and the later three (Krishnan et al., 2016; Zhang and Shen, 2017; Duda et al., 2018) were based on machine learning methods that utilize brain-specific network features or cell-type specific gene expression signatures from mouse. Different gene scoring systems were compared in terms of ranking 173 curated candidate genes, including 130 genes with suggestive evidence from the SFARI Gene database (Category 3) and 43 recurrent de novo LoF genes discovered in recent studies (Wang et al., 2016; Li et al., 2017; Ryan et al., 2017; Stessman et al., 2017). We compared the overall ranking of candidate risk genes for different gene scoring systems, with a higher ranking (smaller number) indicating a greater likelihood of being ASD risk genes. We also compared the enrichment of candidate genes in the first decile of different gene scoring systems.
Gene Ontology Enrichment Analysis
We performed GO enrichment analysis to examine whether predicted risk genes were clustered into specific biological processes. Fisher’s exact test was used to test the enrichment of risk genes in GO terms compared to non-risk genes. GO terms were chosen from the GO ontology of biological processes in MSigDB (v5.2) (Subramanian et al., 2005). To facilitate interpretation of the results, we included 2,758 GO terms that overlapped at least 20, but not more than 2,000 genes with our tested genes. Bonferroni correction was applied for multiple testing correction. Because GO terms were often highly overlapping in genes, we used hierarchical clustering to group significant gene sets into clusters based on similarity of their gene profiles (Chen et al., 2014). We first defined a gene overlapping matrix by counting the number of overlapping genes for each pair of gene sets. The Pearson correlation coefficient R was then calculated for each pair of gene sets based on their overlap profiles. The distance matrix for hierarchical clustering was then 1 - R. Hierarchical clustering was performed using the “ward” method implemented in the R function “hclust.” The dendrogram and heatmap were plotted using the R function “heatmap.2.”
Results
An Overview of Study
An overview of study is provided in Figure 1. The basic premise is that ASD risk genes tend to show distinguishing features, including spatial-temporal gene expression patterns in human brain, gene network features, and gene-level constraint metrics. We reason that machine learning models utilizing those features can differentiate ASD genes from normal ones. To evaluate the performance of our prediction model, we examined if predicted ASD genes were enriched for DGE evidence and independent sets of ASD risk genes. We further performed GO enrichment analysis to understand the biology of predicted ASD genes.
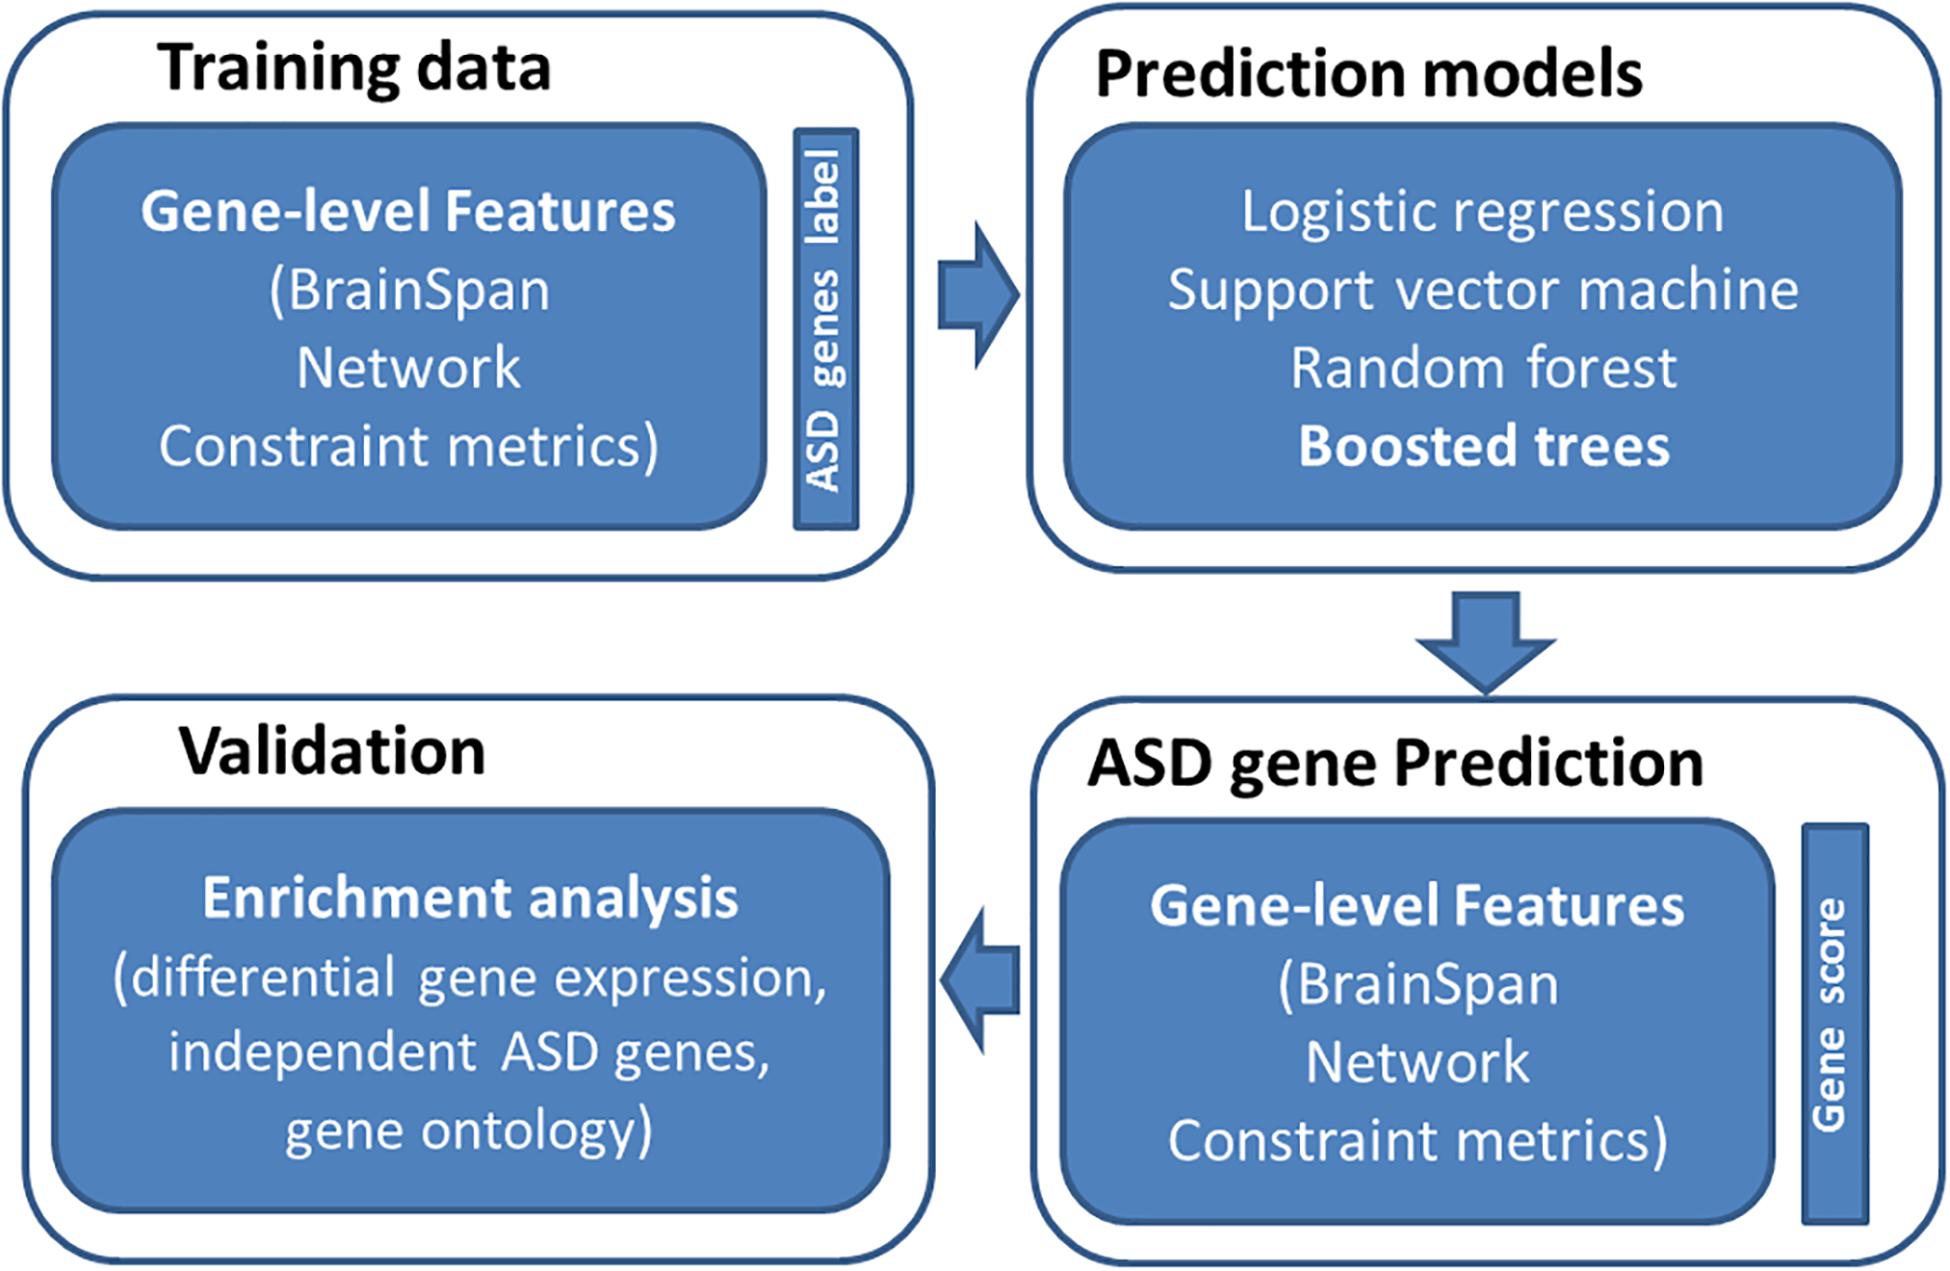
Figure 1. Overview of study design. We first collected training data of labeled genes (121 true positive genes and 963 true negatives) and their associated features (spatiotemporal gene expression values from BrainSpan, network features, and gene-level constraint metrics). We then applied four machine learning algorithms to predict ASD genes, including logistic regression, support vector machine, random forest, and boosted trees. The boosted trees achieved the best prediction performance and was employed to predict ASD risk genes across the genome. We further evaluated predicted risk genes through enrichment analyses.
Genome-Wide Prediction of Autism Risk Genes
We visualized gene expression patterns for 1,084 training genes across various regions and developmental stages of human brain (Supplementary Figure S1). There was a trend for known autism risk genes (left gene panel, red rows) to have higher expression levels than non-risk genes (left gene panel, blue rows). We further tested expression level differences between known risk and non-risk genes for each specific brain region and developmental stage (Supplementary Figure S2). The known autism risk genes showed significantly higher expression levels on average than non-risk genes for all tested brain regions and developmental stages (p < 0.05). Of note, the difference was stronger for early to middle prenatal stages, ranging from 12 to 21 postconceptional weeks (pcw).
We compared known autism risk and non-risk genes in their sensitivity to mutational changes and other gene variation features. As shown in Supplementary Figure S3, compared to non-risk genes, autism risk genes were more intolerant of missense (mis_z, p = 7 × 10–16) and LoF mutations (lof_z, p = 2 × 10–23; pLI, p = 2 × 10–20), were less likely intolerant of homozygous, but not heterozygous LoF variants (pRec, p = 5 × 10–21), and had a lower probability of being tolerant of both heterozygous and homozygous LoF variants (pNull, p = 3 × 10–24). Autism risk genes had longer coding base pairs (p = 4 × 10–29), a higher probability of mutation across the transcript (mu_syn, p = 1 × 10–16; mu_mis, p = 2 × 10–18; mu_lof, p = 4 × 10–19), and a larger number of rare synonymous or missense variants (n_syn, p = 4 × 10–16; n_mis, p = 1 × 10⁻⁶), but less number of LoF variants (n_lof, p = 3 × 10⁻⁴).
We compared the prediction accuracy of four machine learning algorithms across five-fold CV. The gradient boosted trees (BTree) model achieved the best prediction accuracy for autism risk genes with AUC-ROC value of 0.86 and AUC-PRC value of 0.55 (Figure 2). The effects of different features on the boosted trees model were further explored by comparing the prediction accuracy under different feature sets (Supplementary Figure S4). We found that using the spatiotemporal gene expression features alone achieved an AUC-ROC (AUC-PRC) greater than 0.8 (0.4), and that the prediction accuracy was further improved by including either gene network features or gene-level constraint metrics, with the highest accuracy observed when all feature sets were included. We further evaluated the importance of individual features in the optimal BTree model. The feature importance was quantified as the average gain, i.e., improvement in node purity, of the feature when it was used in trees. Supplementary Figure S5 illustrates the top 30 important features, including 28 spatiotemporal expression features and two gene-level constraint metrics (pLI and pNull). It was notable that pLI was the most predictive feature among all features used.
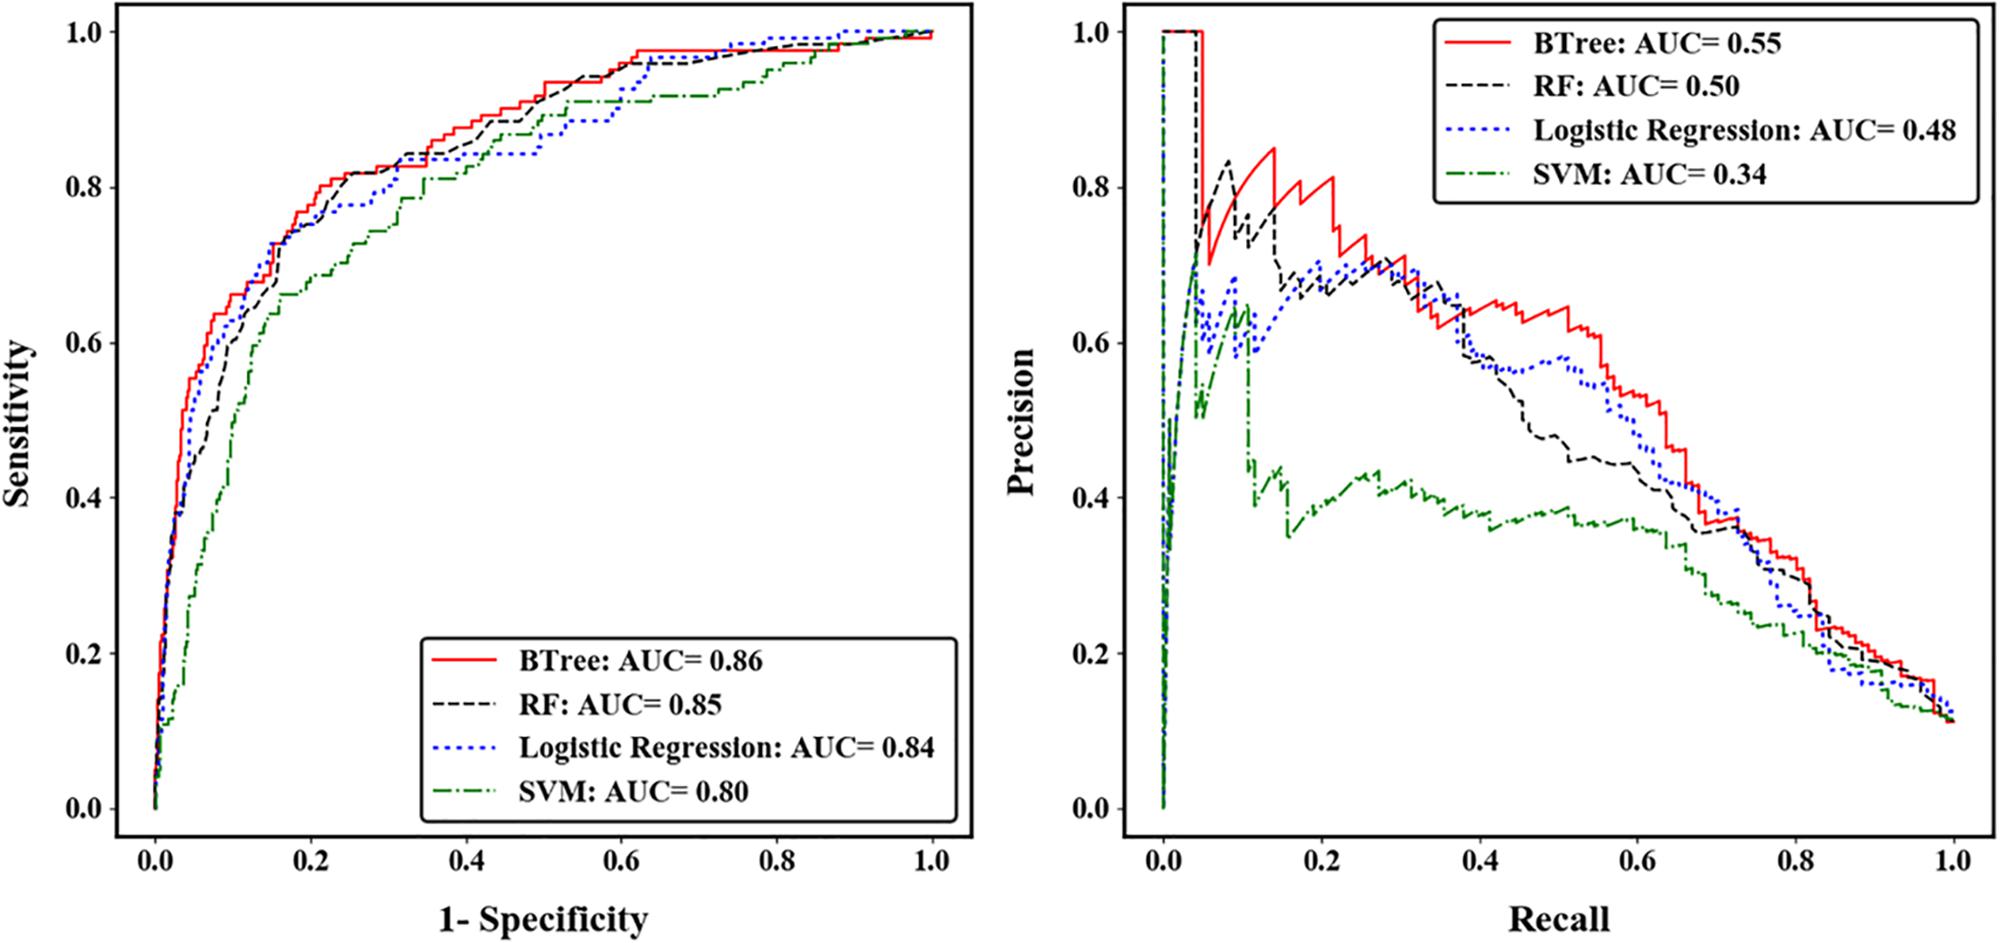
Figure 2. Performance of four machine learning algorithms across five-fold cross validation. The left was measured by the area under receiver operating characteristic curve (ROC), and the right was measured by the area under precision-recall curve (PRC).
Autism Risk Gene Validation Using Differential Gene Expression Evidence
We predicted 1,109 risk genes using our gene ranking system under the threshold of risk score > 0.22, which generates the highest prediction accuracy measured by F1 score on training data. We then examined whether those predicted risk genes were enriched for DGE evidence for ASD. We found that the predicted risk genes tended to be down-expressed in ASD brains, especially in frontal (fold = 1.7, p < 1.0 × 10⁻⁵) and parietal cortex (fold = 1.7, p < 1.0 × 10⁻⁵) (Figure 3). We did not see any significant enrichment of DGE evidence for IBD, bipolar disorder and schizophrenia, suggesting that the enriched DGE in our predicted genes was specific to ASD.
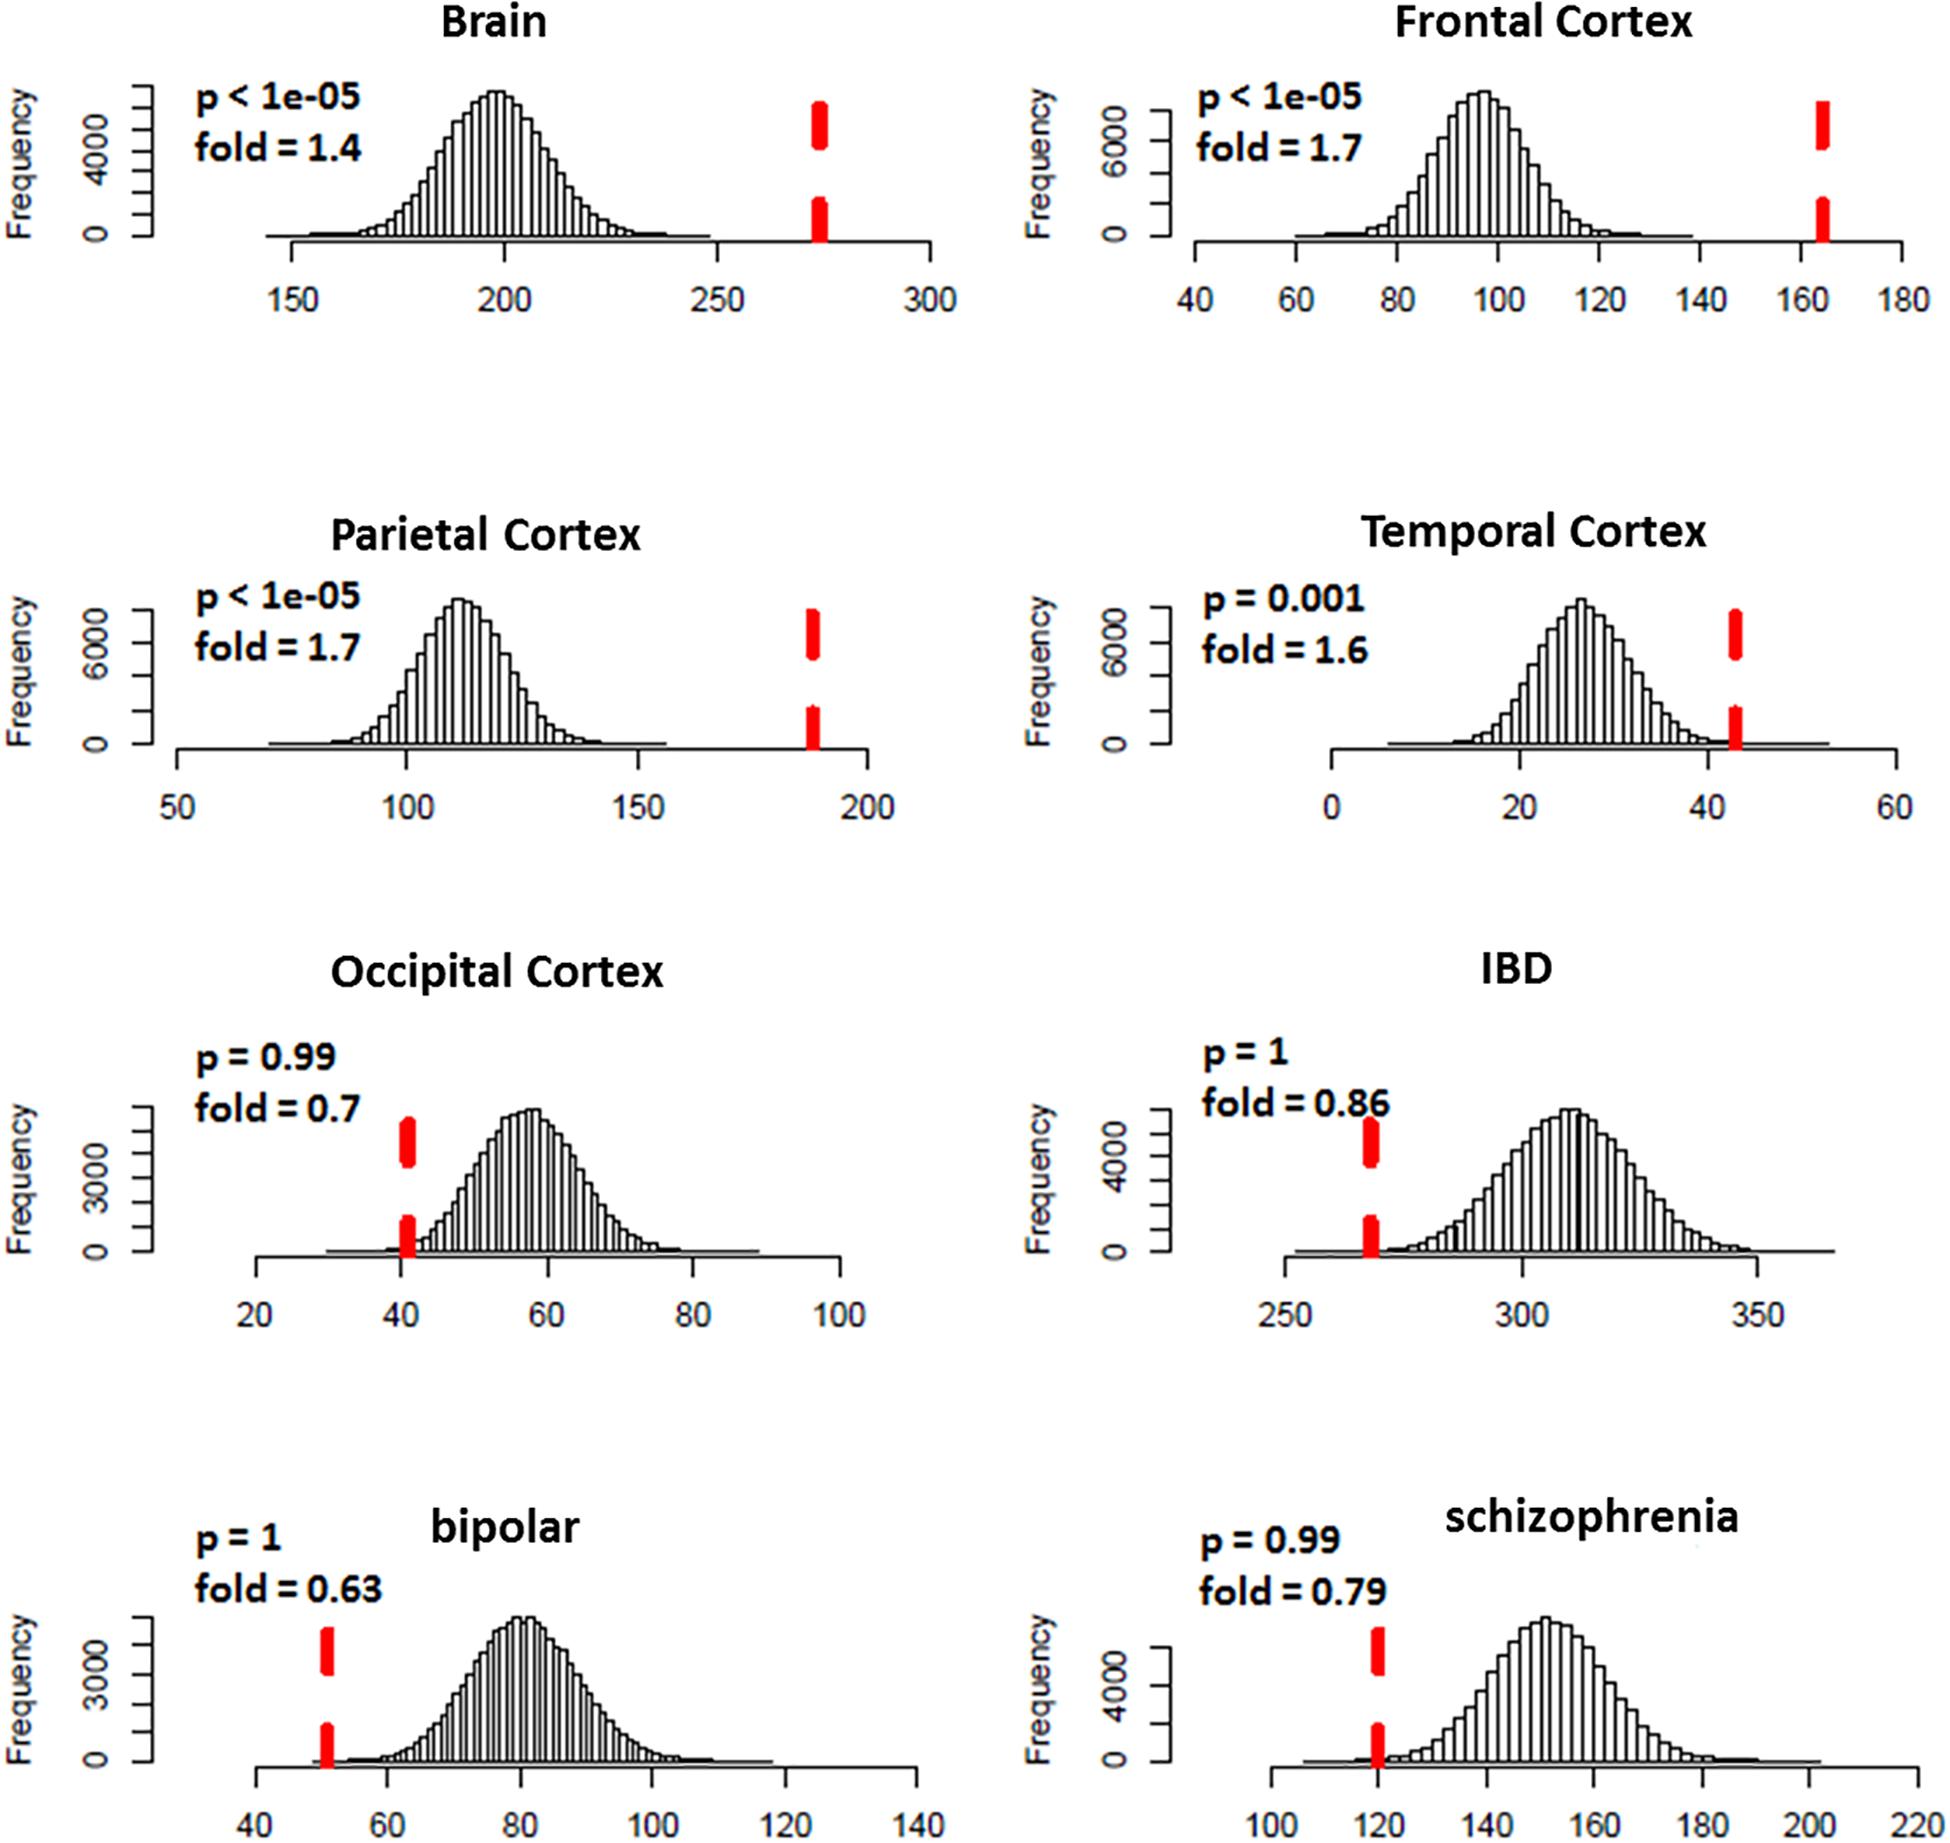
Figure 3. Enrichment analysis of differential expression evidence for predicted ASD risk genes. The histogram shows the distribution for the number of genes with DGE evidence (p < 0.05) from random gene sets. The vertical dotted red line indicates the number of genes with DGE evidence from predicted ASD risk genes. Predicted risk genes tended to be down-expressed in brains of ASD, but not for disorders of negative control (IBD, bipolar disorder, and schizophrenia).
Autism Risk Gene Validation in Sequencing Studies
We further evaluated our gene ranking system using two sequencing studies (Figure 4). For the risk genes identified from the SSC cohort, our top decile genes were significantly enriched with de novo LoF mutations in probands. Specifically, genes in the first decile of our ranking system included 32% (88 of 273, p = 6.8 × 10⁻⁹) of de novo LOF mutations in probands. In contrast, we did not observe significant enrichment of genes with de novo LOF mutations in the unaffected siblings (p = 0.65). Similarly, for risk genes identified from the MSSNG cohort, we found significant enrichment for all three gene lists, including the de novo LOF mutations in probands (29%, p = 2 × 10⁻⁴), the 25 genes that reached genome-wide significance (72%, p = 4.4 × 10⁻⁹), and the 18 novel genes (67%, p = 6.6 × 10⁻⁶).
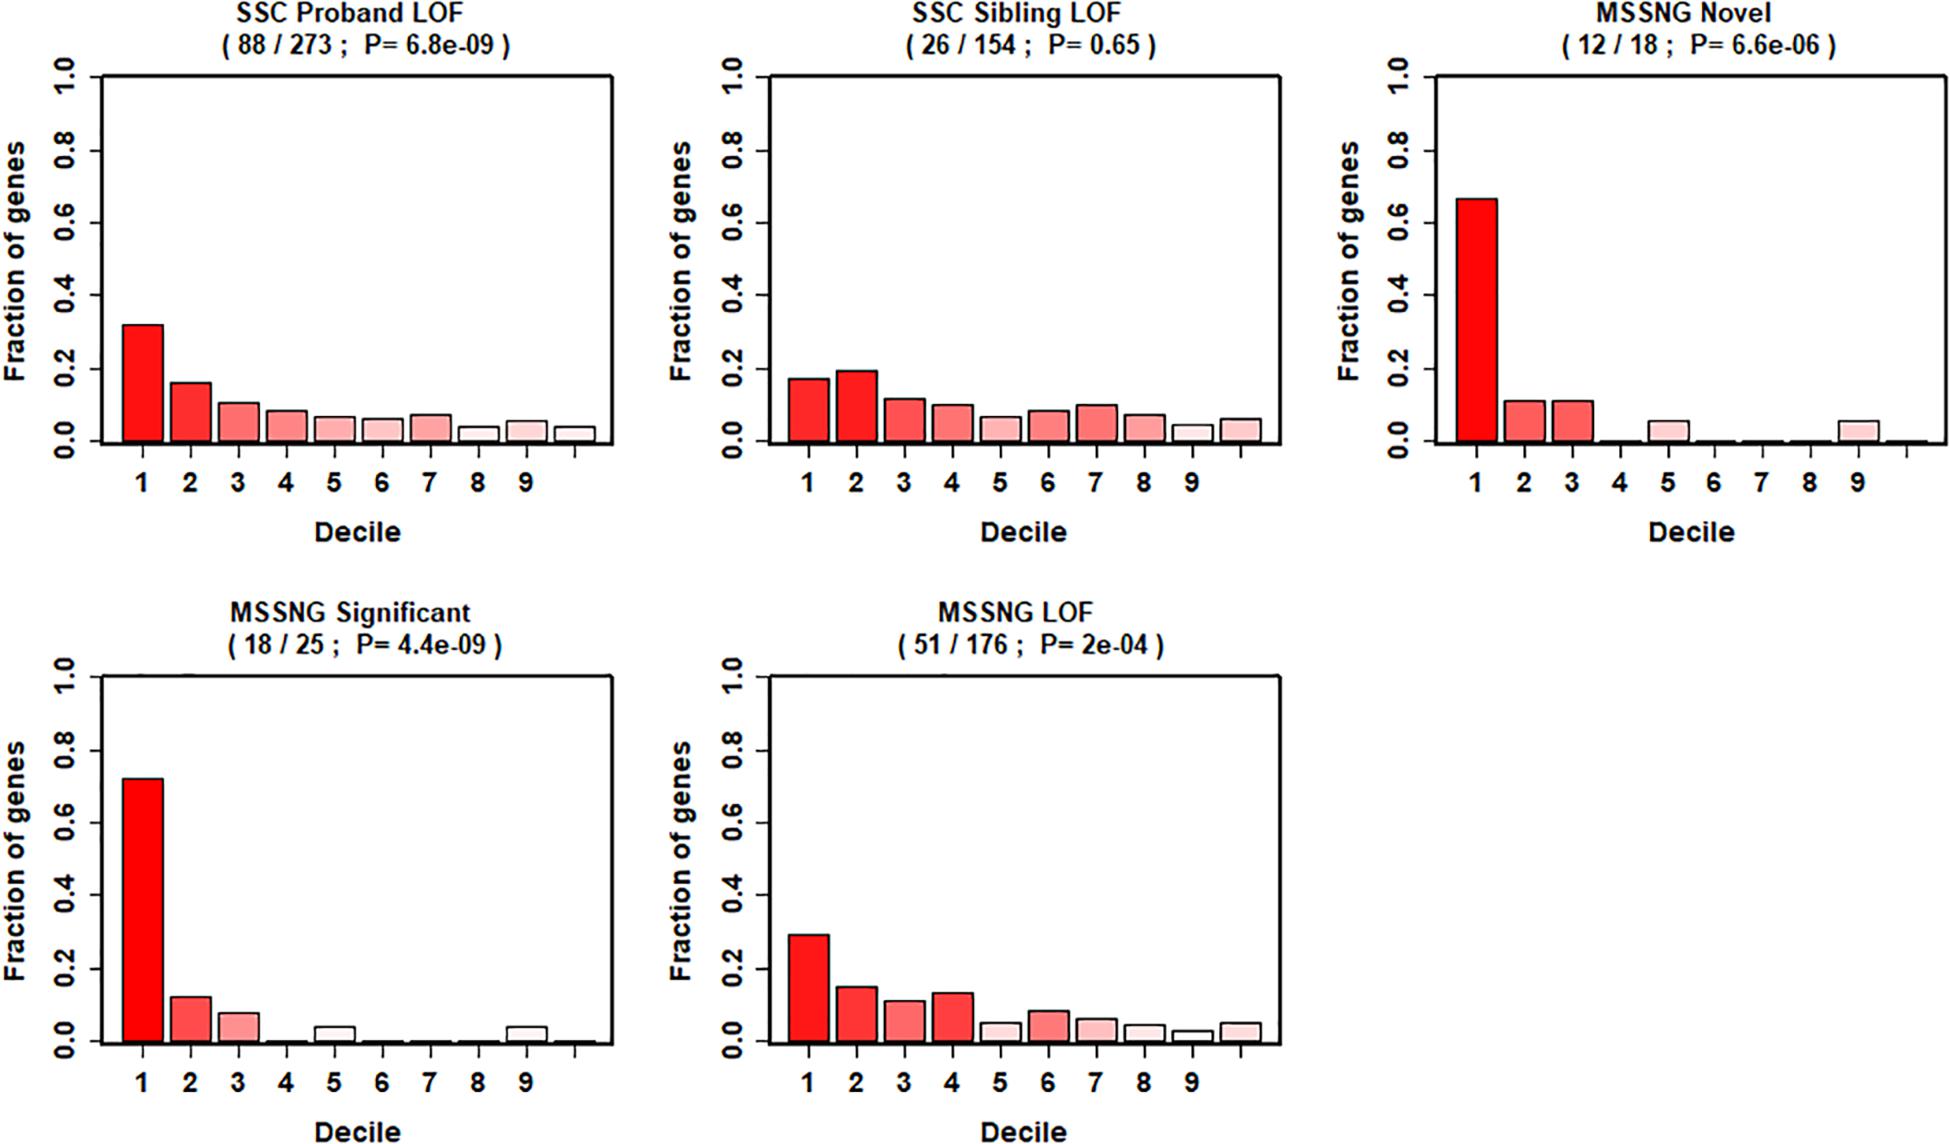
Figure 4. Decile enrichment of de novo mutations from two independent cohorts in our gene ranking system.
Comparison With Other Ranking Systems
We compared the performance of our ranking system (BTree) with five other gene scoring systems in their ability to rank curated candidate genes. When we examined the rank of an independent set of 173 autism candidate genes, our method outperformed other methods, because our method had the smallest median ranking (indicating the greatest likelihood of the set containing autism risk genes) (Supplementary Figure S6). We further compared the enrichment of 173 candidate genes in the first decile of each gene ranking system (Supplementary Figure S7). We observed the highest proportion of candidate genes in the first decile of our ranking system (52%), which was higher than the Duda score (40%), ExAC score (44%), Iossifov probability score (23%), Krishnan probability score (38%), and Zhang D score (30%). The superior performance of our method might be attributable to the human brain spatiotemporal gene expression features that were not considered in other methods.
Gene Ontology Enrichment Analysis
We conducted GO enrichment analysis to examine whether predicted 1,109 risk genes (score > 0.22) were clustered into specific biological processes. The full results of this analysis are shown in Supplementary Table S2. There were 179 GO terms that remained significant after Bonferroni correction (pcorrected < 0.05). Significant GO terms were grouped into five major clusters using hierarchical clustering (Supplementary Figure S8). These clusters included GO terms related to neuronal signaling (orange), neurogenesis (blue and black), chromatin remodeling (green), and transcriptional regulation (red). Table 1 shows details for the top 10 enriched GO terms in enrichment fold that were particularly interesting, as they included GO terms involved in ionotropic glutamate receptor signaling, motor neuron axon guidance, and regulation of histone methylation.
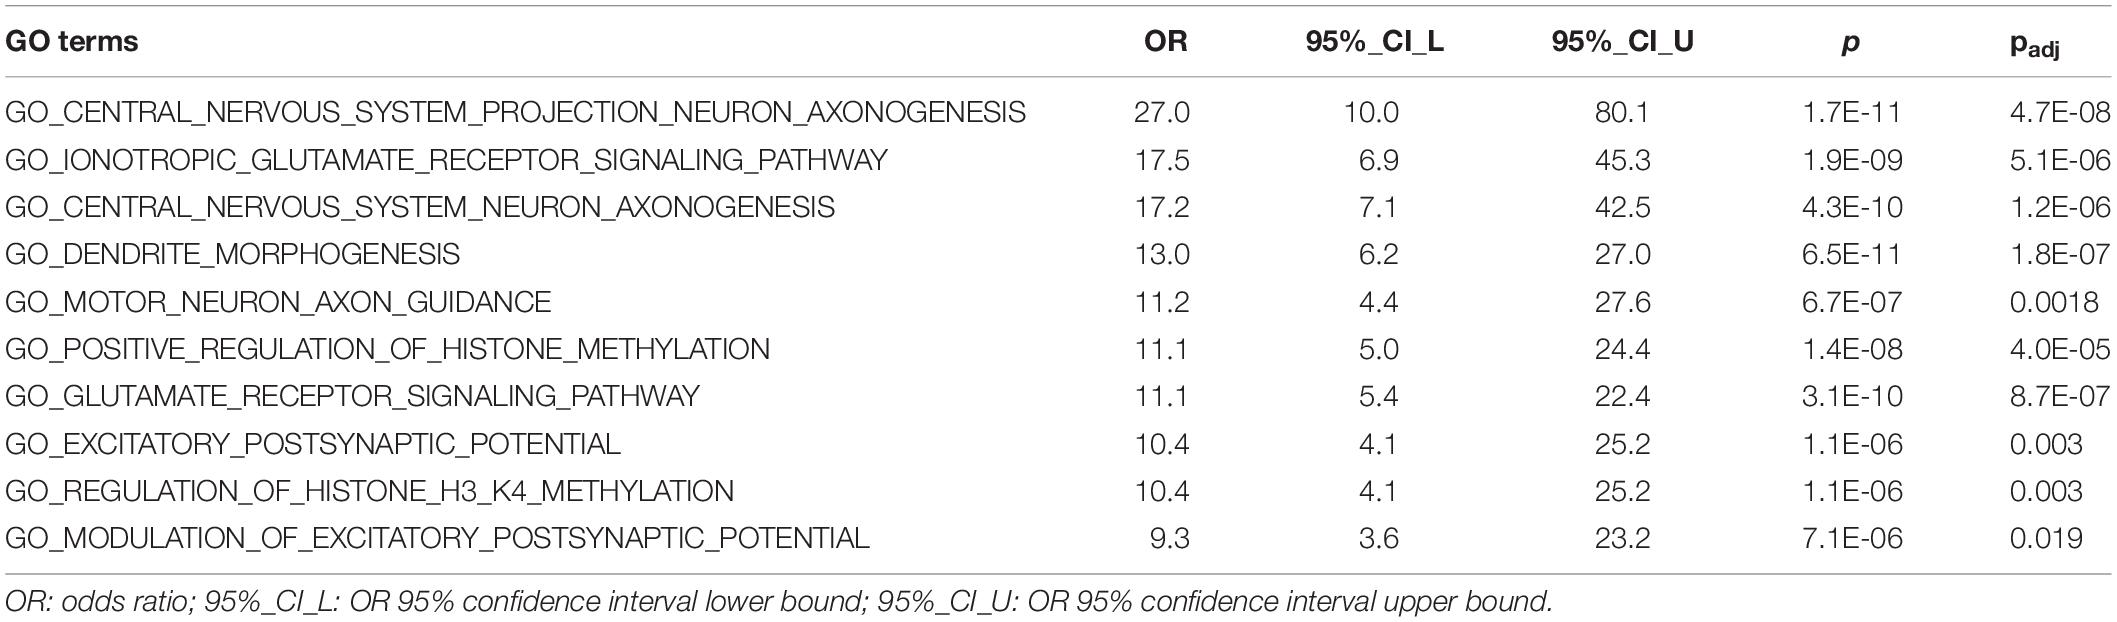
Table 1. Top ten enriched GO terms in predicted ASD risk genes.
Discussion
A number of methods have been developed for inferring ASD risk genes. Although they employ differing computational methodologies, most methods were built upon the concept of guilt-by-association, using the assumption that risk genes are functionally related. Theoretically, ASD risk genes should exert their effects at specific developmental stages in specific brain tissues or cell types that are critical to disease development. However, most existing methods have not considered the spatial and temporal patterns of gene relationships during brain development. In addition, gene-level constraint metrics, such as loss of function intolerance, have been used to prioritize ASD candidate genes, but no studies have quantitatively examined their potential for predicting ASD genes. Employing a supervised machine learning algorithm, we have shown that a combination of human brain spatiotemporal gene expression patterns and the gene-level constraint metric features predict ASD risk genes. We further demonstrated the validity of our method through validations using DGE evidence and independent sets of risk genes. We have further shown the superior performance of our ranking system over several other state-of-the-art ranking systems in ranking curated candidate genes.
We explored the potential role of the top ranked genes in ASD risk. The gene NBEA, which encodes neurobeachin that is a brain-specific kinase-anchoring protein implicated synaptic structure and function, was assigned the highest probability for conferring ASD risk (score = 0.97). Indeed, mutations in NBEA have been identified in ASD (Castermans et al., 2003; Wise et al., 2015) and neurodevelopmental disorders (Mulhern et al., 2018). Another notable gene in our top list was HERC1 (ranked third, score = 0.94), which encodes a protein that is a probable E3 ubiquitin-protein ligase. Multiple lines of evidence indicate a role for HERC1 in ASD: (1) it was reported that HERC1 mutations caused intellectual disability and facial dysmorphism in two Colombian siblings (Ortega-Recalde et al., 2015); (2) A nonsense variant in HERC1 was associated with intellectual disability, megalencephaly, thick corpus callosum and cerebellar atrophy (Nguyen et al., 2016); (3) importantly, mutations in HERC1 were reported to be associated with ASD in an exome sequencing study (Hashimoto et al., 2016). Our ranking system also successfully predicted another two ASD candidate genes TCF20 (ranked 26th, score = 0.87) and FBXO11 (ranked 19th, score = 0.88). Intriguingly, TCF20 was one of the highest ranking candidate autism risk genes (category 2) according to the most recent version of the SFARI Gene resource. Mutations in TCF20 were also implicated in Phelan-McDermid syndrome (Upadia et al., 2018), developmental disorders (Deciphering Developmental Disorders Study, 2017), and schizophrenia (Smeland et al., 2017). FBXO11 was prioritized as a strong ASD candidate gene (Ji et al., 2016), and was recently reported to be associated with a variable neurodevelopmental disorder (Gregor et al., 2018).
Our ranking system also highlighted some potential novel candidate genes that may deserve further investigation. Four genes, ZYG11B, HECTD1, CAND1, and MYCBP2, ranked second, fourth, seventh and tenth, are all involved in protein ubiquitination, which has been implicated in neuronal function and brain disorders, including ASD (Mabb and Ehlers, 2010). To our knowledge, direct genetic links between these genes with ASD have not been found. Of note, CAND1 encodes an essential regulator of Cullin-RING ubiquitin ligases that play a critical role in ubiquitination and protein degradation (Zheng et al., 2002); MYCBP2 encodes an E3 ubiquitin-protein ligase that plays a role in axon guidance and synapse formation in the developing nervous system. We have provided the whole list of ranked genes with their probability scores in Supplementary Table S3. Researchers can further explore the top-ranked genes or genes of their own interest.
Our study not only provides hundreds of new ASD candidate genes with evidence for involvement in ASD, but also shows that the predicted risk genes are biologically meaningful and are clustered around biological processes relevant to ASD. GO enrichment analysis demonstrated that the predicted risk genes were enriched in GO terms related to neuronal signaling, neurogenesis, chromatin remodeling, and histone modification, all of which are important biological processes implicated in ASD. In addition, among our top 10 ranked genes, we found that five were related to the protein ubiquitination pathway (HERC1, CAND1, ZYG11B, HECTD1, and MYCBP2), which is consistent with the significant enrichment of protein ubiquitination process in our GO enrichment analysis (GO_PROTEIN_UBIQUITINATION, OR = 2.3, pcorrected = 1.9 × 10⁻⁶), supporting the merging role of ubiquitin signaling in ASD (Mabb and Ehlers, 2010; Cheon et al., 2018). Our analyses also highlighted other biological mechanisms that may underlie ASD. For example, there is evidence for roles of RNA alternative splicing (Parikshak et al., 2016) in ASD, which was represented in our top enriched GO terms (GO_RNA_SPLICING, OR = 3.5, pcorrected = 8.0 × 10⁻¹²).
Our study also sheds light on when and where ASD genes may exert their effects during brain development. Of the 28 gene expression features from the top 30 important features in the BTree model, 15 referred to brain regions in the early to mid-prenatal stage (≤24 pcw), reinforcing the important role of early prenatal development in ASD. The involved brain regions include the posteroventral (inferior) parietal cortex (IPC), primary motor cortex (area M1, area 4) (M1C), posterior (caudal) superior temporal cortex (area 22c) (STC), inferolateral temporal cortex (area TEv, area 20) (ITC), medial prefrontal cortex (MFC), cerebellum (CB), dorsolateral prefrontal cortex (DFC), and ventrolateral prefrontal cortex (VFC).
This work should be viewed in light of several limitations. First, our method was trained on genes implicated in ASD by de novo mutations. It was not clear how our gene ranking system was relevant to genes affected by other type of variants. Second, our gene ranking system was validated using enrichment analyses of DGE evidence in ASD brain and independent lists of candidate genes. However, a more solid validation should be a replication study for top ranked genes in independent samples through sequencing, but it is beyond the scope of current study. Third, given the strong evidence of clinical and genetic overlap between ASD and other types of neurodevelopmental disorders (Mullin et al., 2013; Srivastava and Schwartz, 2014), further work is needed to investigate whether our gene ranking system is specific to ASD.
In summary, our study has demonstrated that human brain spatiotemporal gene expression patterns and gene-level constraint metrics predict ASD risk genes. Our gene ranking system provides a useful resource for prioritizing ASD candidate genes.
Data Availability Statement
The datasets generated from this study can be found in online Supplementary Material.
Author Contributions
SH and AR designed the study and wrote the manuscript. YL performed the data analyses and wrote the manuscript. SA performed the data analyses. AR and JP supported the manuscript preparation and project planning. All authors contributed to the article and approved the submitted version.
Conflict of Interest
The authors declare that the research was conducted in the absence of any commercial or financial relationships that could be construed as a potential conflict of interest.
Funding
This study was partially supported by National Institutes of Health grants R01 AA022994 and AA024486 (to SH). This manuscript has been released as a Pre-Print at bioRxiv (Ying et al., 2018).
Acknowledgments
The authors would like to thank Dr. Mingyao Ying for fruitful discussions.
Supplementary Material
The Supplementary Material for this article can be found online at: https://www.frontiersin.org/articles/10.3389/fgene.2020.500064/full#supplementary-material
FIGURE S1 | Heatmap view of spatiotemporal gene expression in human brain. Each cell in the heat map corresponds to the expression level of a gene (row) in a specific brain region and development stage (column). The ASD risk and non-risk genes are denoted by red and blue rows, respectively. Brain regions are represented by the 31 colors in Color Key of Brain Regions. The ASD risk genes tend to be expressed in a higher level compared to non-risk genes across developmental stages and brain regions. The intensity of the color in each cell represents the log2-transformed expression level. Full names of each brain region: CBC, cerebellar cortex; CB, cerebellum; VFC, ventrolateral prefrontal cortex; M1C, primary motor cortex (area M1, area 4); M1C-S1C, primary motor-sensory cortex (samples); IPC, posteroventral (inferior) parietal cortex; PCx, parietal neocortex; HIP, hippocampus (hippocampal formation); DTH, dorsal thalamus; TCx, temporal neocortex; S1C, primary somatosensory cortex (area S1, areas 3,1,2); MD, mediodorsal nucleus of thalamus; A1C, primary auditory cortex (core); AMY, amygdaloid complex; STR, striatum; URL, upper (rostral) rhombic lip; OFC, orbital frontal cortex; Ocx, occipital neocortex; MGE, medial ganglionic eminence; CGE, caudal ganglionic eminence; LGE, lateral ganglionic eminence; STC, posterior (caudal) superior temporal cortex (area 22c); MFC, anterior (rostral) cingulate (medial prefrontal) cortex; V1C, primary visual cortex (striate cortex, area V1/17); ITC, inferolateral temporal cortex (area TEv, area 20); DFC, dorsolateral prefrontal cortex.
FIGURE S2 | Gene expression difference between ASD risk and non-risk genes in the spatiotemporal development of human brain. Each cell in the heat map represents the expression level difference (t-test) in a specific brain region (column) and development stage (row). The intensity of color represents the log-transformed p-value from a t-test. The brain regions and stages without gene expression data are marked as black.
FIGURE S3 | Boxplot of gene-level constraint metrics and other gene variation features for true positive (TP) and true negative (TN) genes.
FIGURE S4 | Boxplot of AUCs under different feature sets for BTree model. The left was measured by the area under receiver operating curve (ROC), and the right was measured by the area under precision-recall curve (PRC).
FIGURE S5 | Top 30 important features in the BTree model.
FIGURE S6 | Comparison of our gene ranking system (BTree) with five other gene ranking systems on overall rankings of 173 independent candidate genes.
FIGURE S7 | Decile enrichment of 173 independent candidate genes for each gene ranking system. The number on the top of each panel represents the number of 173 curated candidate genes appeared in the first decile of each ranking system.
FIGURE S8 | Hierarchical clustering of significant GO terms.
TABLE S1 | Feature sets included in prediction model.
TABLE S2 | GO enrichment analysis for predicted ASD risk genes.
TABLE S3 | Gene risk score predicted from Boosted tree model.
Footnotes
- ^ https://www.sfari.org/resource/sfari-gene/
- ^ http://www.brainspan.org/
- ^ ftp://ftp.broadinstitute.org/pub/ExAC_release/release0.3.1/
functional_gene_constraint/fordist_cleaned_exac_r03_march16_z_pli_rec_null_data.txt
References
Asif, M., Martiniano, H., Vicente, A. M., and Couto, F. M. (2018). Identifying disease genes using machine learning and gene functional similarities, assessed through Gene Ontology. PLoS One 13:e0208626. doi: 10.1371/journal.pone.0208626
Batagelj, V., and Zaversnik, M. (2003). An O(m) algorithm for cores decomposition of networks. Adv. Data Anal. Classif. 5, 129–145.
Brin, S., and Page, L. (1998). “The anatomy of a large-scale hypertextual web search engine,” in Proceedings of the 7th World-Wide Web Conference, New York, NY.
Brueggeman, L., Koomar, T., and Michaelson, J. J. (2020). Forecasting risk gene discovery in autism with machine learning and genome-scale data. Sci. Rep. 10:4569.
Castermans, D., Wilquet, V., Parthoens, E., Huysmans, C., Steyaert, J., Swinnen, L., et al. (2003). The neurobeachin gene is disrupted by a translocation in a patient with idiopathic autism. J. Med. Genet. 40, 352–356. doi: 10.1136/jmg.40.5.352
Chen, T., He, T., Benesty, M., Khotilovich, V., and Tang, Y. (2015). Xgboost: Extreme Gradient Boosting. R Package Version 0.4-2.
Chen, Y. A., Tripathi, L. P., Dessailly, B. H., Nystrom-Persson, J., Ahmad, S., and Mizuguchi, K. (2014). Integrated pathway clusters with coherent biological themes for target prioritisation. PLoS One 9:e99030. doi: 10.1371/journal.pone.0099030
Cheon, S., Dean, M., and Chahrour, M. (2018). The ubiquitin proteasome pathway in neuropsychiatric disorders. Neurobiol. Learn. Mem. 165:106791. doi: 10.1016/j.nlm.2018.01.012
Colvert, E., Tick, B., Mcewen, F., Stewart, C., Curran, S. R., Woodhouse, E., et al. (2015). Heritability of autism spectrum disorder in a UK population-based twin sample. JAMA Psychiatry 72, 415–423. doi: 10.1001/jamapsychiatry.2014.3028
Deciphering Developmental Disorders Study (2017). Prevalence and architecture of de novo mutations in developmental disorders. Nature 542, 433–438. doi: 10.1038/nature21062
Duda, M., Zhang, H., Li, H. D., Wall, D. P., Burmeister, M., and Guan, Y. (2018). Brain-specific functional relationship networks inform autism spectrum disorder gene prediction. Transl. Psychiatry 8:56.
Gandal, M. J., Haney, J. R., Parikshak, N. N., Leppa, V., Ramaswami, G., Hartl, C., et al. (2018). Shared molecular neuropathology across major psychiatric disorders parallels polygenic overlap. Science 359, 693–697. doi: 10.1126/science.aad6469
Gandhi, T. K., Zhong, J., Mathivanan, S., Karthick, L., Chandrika, K. N., Mohan, S. S., et al. (2006). Analysis of the human protein interactome and comparison with yeast, worm and fly interaction datasets. Nat. Genet. 38, 285–293. doi: 10.1038/ng1747
Gilman, S. R., Iossifov, I., Levy, D., Ronemus, M., Wigler, M., and Vitkup, D. (2011). Rare de novo variants associated with autism implicate a large functional network of genes involved in formation and function of synapses. Neuron 70, 898–907. doi: 10.1016/j.neuron.2011.05.021
Gök, M. (2018). A novel machine learning model to predict autism spectrum disorders risk gene. Neural Comput. Appl. 31, 6711–6717. doi: 10.1007/s00521-018-3502-5
Gregor, A., Sadleir, L. G., Asadollahi, R., Azzarello-Burri, S., Battaglia, A., Ousager, L. B., et al. (2018). De novo variants in the F-box protein FBXO11 in 20 individuals with a variable neurodevelopmental disorder. Am. J. Hum. Genet. 10, 305–316. doi: 10.1016/j.ajhg.2018.07.003
Hallmayer, J., Cleveland, S., Torres, A., Phillips, J., Cohen, B., Torigoe, T., et al. (2011). Genetic heritability and shared environmental factors among twin pairs with autism. Arch. Gen. Psychiatry 68, 1095–1102. doi: 10.1001/archgenpsychiatry.2011.76
Hashimoto, R., Nakazawa, T., Tsurusaki, Y., Yasuda, Y., Nagayasu, K., Matsumura, K., et al. (2016). Whole-exome sequencing and neurite outgrowth analysis in autism spectrum disorder. J. Hum. Genet. 61, 199–206. doi: 10.1038/jhg.2015.141
Hormozdiari, F., Penn, O., Borenstein, E., and Eichler, E. E. (2015). The discovery of integrated gene networks for autism and related disorders. Genome Res. 25, 142–154. doi: 10.1101/gr.178855.114
Iossifov, I., Levy, D., Allen, J., Ye, K., Ronemus, M., Lee, Y. H., et al. (2015). Low load for disruptive mutations in autism genes and their biased transmission. Proc. Natl. Acad. Sci. U.S.A. 112, E5600–E5607.
Iossifov, I., O’roak, B. J., Sanders, S. J., Ronemus, M., Krumm, N., Levy, D., et al. (2014). The contribution of de novo coding mutations to autism spectrum disorder. Nature 515, 216–221.
Iossifov, I., Ronemus, M., Levy, D., Wang, Z., Hakker, I., Rosenbaum, J., et al. (2012). De novo gene disruptions in children on the autistic spectrum. Neuron 74, 285–299.
Jeste, S. S., and Geschwind, D. H. (2014). Disentangling the heterogeneity of autism spectrum disorder through genetic findings. Nat. Rev. Neurol. 10, 74–81. doi: 10.1038/nrneurol.2013.278
Ji, X., Kember, R. L., Brown, C. D., and Bucan, M. (2016). Increased burden of deleterious variants in essential genes in autism spectrum disorder. Proc. Natl. Acad. Sci. U.S.A. 113, 15054–15059. doi: 10.1073/pnas.1613195113
Kosmicki, J. A., Samocha, K. E., Howrigan, D. P., Sanders, S. J., Slowikowski, K., Lek, M., et al. (2017). Refining the role of de novo protein-truncating variants in neurodevelopmental disorders by using population reference samples. Nat. Genet. 49, 504–510. doi: 10.1038/ng.3789
Krishnan, A., Zhang, R., Yao, V., Theesfeld, C. L., Wong, A. K., Tadych, A., et al. (2016). Genome-wide prediction and functional characterization of the genetic basis of autism spectrum disorder. Nat. Neurosci. 19, 1454–1462. doi: 10.1038/nn.4353
Krumm, N., O’roak, B. J., Shendure, J., and Eichler, E. E. (2014). A de novo convergence of autism genetics and molecular neuroscience. Trends Neurosci. 37, 95–105. doi: 10.1016/j.tins.2013.11.005
Lek, M., Karczewski, K. J., Minikel, E. V., Samocha, K. E., Banks, E., Fennell, T., et al. (2016). Analysis of protein-coding genetic variation in 60,706 humans. Nature 536, 285–291.
Li, J., Shi, M., Ma, Z., Zhao, S., Euskirchen, G., Ziskin, J., et al. (2014). Integrated systems analysis reveals a molecular network underlying autism spectrum disorders. Mol. Syst. Biol. 10:774. doi: 10.15252/msb.20145487
Li, J., Wang, L., Guo, H., Shi, L., Zhang, K., Tang, M., et al. (2017). Targeted sequencing and functional analysis reveal brain-size-related genes and their networks in autism spectrum disorders. Mol. Psychiatry 22, 1282–1290. doi: 10.1038/mp.2017.140
Liu, L., Lei, J., and Roeder, K. (2015). Network assisted analysis to reveal the genetic basis of autism. Ann. Appl. Stat. 9, 1571–1600. doi: 10.1214/15-aoas844
Mabb, A. M., and Ehlers, M. D. (2010). Ubiquitination in postsynaptic function and plasticity. Annu. Rev. Cell. Dev. Biol. 26, 179–210. doi: 10.1146/annurev-cellbio-100109-104129
Mulhern, M. S., Stumpel, C., Stong, N., Brunner, H. G., Bier, L., Lippa, N., et al. (2018). NBEA: developmental disease gene with early generalized epilepsy phenotypes. Ann. Neurol. 84, 788–795.
Mullin, A. P., Gokhale, A., Moreno-De-Luca, A., Sanyal, S., Waddington, J. L., and Faundez, V. (2013). Neurodevelopmental disorders: mechanisms and boundary definitions from genomes, interactomes and proteomes. Transl. Psychiatry 3:e329. doi: 10.1038/tp.2013.108
Nguyen, L. S., Schneider, T., Rio, M., Moutton, S., Siquier-Pernet, K., Verny, F., et al. (2016). A nonsense variant in HERC1 is associated with intellectual disability, megalencephaly, thick corpus callosum and cerebellar atrophy. Eur. J. Hum. Genet. 24, 455–458. doi: 10.1038/ejhg.2015.140
Ortega-Recalde, O., Beltran, O. I., Galvez, J. M., Palma-Montero, A., Restrepo, C. M., Mateus, H. E., et al. (2015). Biallelic HERC1 mutations in a syndromic form of overgrowth and intellectual disability. Clin. Genet. 88, e1–e3.
Parikshak, N. N., Swarup, V., Belgard, T. G., Irimia, M., Ramaswami, G., Gandal, M. J., et al. (2016). Genome-wide changes in lncRNA, splicing, and regional gene expression patterns in autism. Nature 540, 423–427. doi: 10.1038/nature20612
Petrovski, S., Wang, Q., Heinzen, E. L., Allen, A. S., and Goldstein, D. B. (2013). Genic intolerance to functional variation and the interpretation of personal genomes. PLoS Genet. 9:e1003709. doi: 10.1371/journal.pgen.1003709
Ritchie, M. E., Phipson, B., Wu, D., Hu, Y., Law, C. W., Shi, W., et al. (2015). limma powers differential expression analyses for RNA-sequencing and microarray studies. Nucleic Acids Res. 43:e47. doi: 10.1093/nar/gkv007
Ronemus, M., Iossifov, I., Levy, D., and Wigler, M. (2014). The role of de novo mutations in the genetics of autism spectrum disorders. Nat. Rev. Genet. 15, 133–141. doi: 10.1038/nrg3585
Rossin, E. J., Lage, K., Raychaudhuri, S., Xavier, R. J., Tatar, D., and Benita, Y. (2011). Proteins encoded in genomic regions associated with immune-mediated disease physically interact and suggest underlying biology. PLoS Genet. 7:e1001273. doi: 10.1371/journal.pgen.1001273
Ryan, K. C. Y., Merico, D., Bookman, M., Thiruvahindrapuram, B., Patel, R. V., Whitney, J., et al. (2017). Whole genome sequencing resource identifies 18 new candidate genes for autism spectrum disorder. Nat. Neurosci. 20, 602–611.
Samocha, K. E., Robinson, E. B., Sanders, S. J., Stevens, C., Sabo, A., Mcgrath, L. M., et al. (2014). A framework for the interpretation of de novo mutation in human disease. Nat. Genet. 46, 944–950.
Sanders, S. J., He, X., Willsey, A. J., Ercan-Sencicek, A. G., Samocha, K. E., Cicek, A. E., et al. (2015). Insights into autism spectrum disorder genomic architecture and biology from 71 risk loci. Neuron 87, 1215–1233.
Sanders, S. J., Murtha, M. T., Gupta, A. R., Murdoch, J. D., Raubeson, M. J., Willsey, A. J., et al. (2012). De novo mutations revealed by whole-exome sequencing are strongly associated with autism. Nature 485, 237–241.
Smeland, O. B., Frei, O., Kauppi, K., Hill, W. D., Li, W., Wang, Y., et al. (2017). Identification of genetic loci jointly influencing schizophrenia risk and the cognitive traits of verbal-numerical reasoning, reaction time, and general cognitive function. JAMA Psychiatry 74, 1065–1075. doi: 10.1001/jamapsychiatry.2017.1986
Srivastava, A. K., and Schwartz, C. E. (2014). Intellectual disability and autism spectrum disorders: causal genes and molecular mechanisms. Neurosci. Biobehav. Rev. 46(Pt 2), 161–174. doi: 10.1016/j.neubiorev.2014.02.015
Stessman, H. A., Xiong, B., Coe, B. P., Wang, T., Hoekzema, K., Fenckova, M., et al. (2017). Targeted sequencing identifies 91 neurodevelopmental-disorder risk genes with autism and developmental-disability biases. Nat. Genet. 49, 515–526. doi: 10.1038/ng.3792
Subramanian, A., Tamayo, P., Mootha, V. K., Mukherjee, S., Ebert, B. L., Gillette, M. A., et al. (2005). Gene set enrichment analysis: a knowledge-based approach for interpreting genome-wide expression profiles. Proc. Natl. Acad. Sci. U.S.A. 102, 15545–15550. doi: 10.1073/pnas.0506580102
Turner, T. N., Coe, B. P., Dickel, D. E., Hoekzema, K., Nelson, B. J., Zody, M. C., et al. (2017). Genomic Patterns of de novo mutation in simplex autism. Cell 171, 710.e2–722.e2.
Upadia, J., Gonzales, P. R., Atkinson, T. P., Schroeder, H. W., Robin, N. H., Rudy, N. L., et al. (2018). A previously unrecognized 22q13.2 microdeletion syndrome that encompasses TCF20 and TNFRSF13C. Am. J. Med. Genet. A 176, 2791–2797. doi: 10.1002/ajmg.a.40492
Wang, T., Guo, H., Xiong, B., Stessman, H. A., Wu, H., Coe, B. P., et al. (2016). De novo genic mutations among a Chinese autism spectrum disorder cohort. Nat. Commun. 7:13316.
Willsey, A. J., Sanders, S. J., Li, M., Dong, S., Tebbenkamp, A. T., Muhle, R. A., et al. (2013). Coexpression networks implicate human midfetal deep cortical projection neurons in the pathogenesis of autism. Cell 155, 997–1007. doi: 10.1016/j.cell.2013.10.020
Wise, A., Tenezaca, L., Fernandez, R. W., Schatoff, E., Flores, J., Ueda, A., et al. (2015). Drosophila mutants of the autism candidate gene neurobeachin (rugose) exhibit neuro-developmental disorders, aberrant synaptic properties, altered locomotion, and impaired adult social behavior and activity patterns. J. Neurogenet. 29, 135–143. doi: 10.3109/01677063.2015.1064916
Xu, J., and Li, Y. (2006). Discovering disease-genes by topological features in human protein-protein interaction network. Bioinformatics 22, 2800–2805. doi: 10.1093/bioinformatics/btl467
Ying, L., Anjali, M. R., James, P., and Shizhong, H. (2018). A machine learning approach to predicting autism risk genes: validation of known genes and discovery of new candidates. bioRxiv [Preprint]. doi: 10.1101/463547
Zhang, C., and Shen, Y. (2017). A cell type-specific expression signature predicts haploinsufficient autism-susceptibility genes. Hum. Mutat. 38, 204–215. doi: 10.1002/humu.23147
Keywords: autism, de novo mutation, gene expression, constraint, machine learning
Citation: Lin Y, Afshar S, Rajadhyaksha AM, Potash JB and Han S (2020) A Machine Learning Approach to Predicting Autism Risk Genes: Validation of Known Genes and Discovery of New Candidates. Front. Genet. 11:500064. doi: 10.3389/fgene.2020.500064
Received: 23 September 2019; Accepted: 13 August 2020;
Published: 10 September 2020.
Edited by:
Mogens Fenger, The Capital Region of Denmark, DenmarkReviewed by:
Weihua Guan, University of Minnesota, United StatesSagiv Shifman, The Hebrew University of Jerusalem, Israel
Copyright © 2020 Lin, Afshar, Rajadhyaksha, Potash and Han. This is an open-access article distributed under the terms of the Creative Commons Attribution License (CC BY). The use, distribution or reproduction in other forums is permitted, provided the original author(s) and the copyright owner(s) are credited and that the original publication in this journal is cited, in accordance with accepted academic practice. No use, distribution or reproduction is permitted which does not comply with these terms.
*Correspondence: Anjali M. Rajadhyaksha, amr2011@med.cornell.edu; Shizhong Han, shan67@jhmi.edu