 Priyanka Banerjee
 Victor Adriano Okstoft Carmelo
 Haja N. Kadarmideen
- Quantitative Genomics, Bioinformatics and Computational Biology Group, Department of Applied Mathematics and Computer Science, Technical University of Denmark, Kongens Lyngby, Denmark
Interactions among genomic loci have often been overlooked in genome-wide association studies, revealing the combinatorial effects of variants on phenotype or disease manifestation. Unexplained genetic variance, interactions among causal genes of small effects, and biological pathways could be identified using a network biology approach. The main objective of this study was to determine the genome-wide epistatic variants affecting feed efficiency traits [feed conversion ratio (FCR) and residual feed intake (RFI)] based on weighted interaction SNP hub (WISH-R) method. Herein, we detected highly interconnected epistatic SNP modules, pathways, and potential biomarkers for the FCR and RFI in Duroc and Landrace purebreds considering the whole population, and separately for low and high feed efficient groups. Highly interacting SNP modules in Duroc (1,247 SNPs) and Landrace (1,215 SNPs) across the population and for low feed efficient (Duroc—80 SNPs, Landrace—146 SNPs) and high feed efficient group (Duroc—198 SNPs, Landrace—232 SNPs) for FCR and RFI were identified. Gene and pathway analyses identified ABL1, MAP3K4, MAP3K5, SEMA6A, KITLG, and KAT2B from chromosomes 1, 2, 5, and 13 underlying ErbB, Ras, Rap1, thyroid hormone, axon guidance pathways in Duroc. GABBR2, GNA12, and PRKCG genes from chromosomes 1, 3, and 6 pointed towards thyroid hormone, cGMP-PKG and cAMP pathways in Landrace. From Duroc low feed efficient group, the TPK1 gene was found involved with thiamine metabolism, whereas PARD6G, DLG2, CRB1 were involved with the hippo signaling pathway in high feed efficient group. PLOD1 and SETD7 genes were involved with lysine degradation in low feed efficient group in Landrace, while high feed efficient group pointed to genes underpinning valine, leucine, isoleucine degradation, and fatty acid elongation. Some SNPs and genes identified are known for their association with feed efficiency, others are novel and potentially provide new avenues for further research. Further validation of epistatic SNPs and genes identified here in a larger cohort would help to establish a framework for modelling epistatic variance in future methods of genomic prediction, increasing the accuracy of estimated genetic merit for FE and helping the pig breeding industry.
Introduction
Genetic or epistatic interactions between SNPs, genes or QTLs is a topic of interest in molecular and quantitative genetics (Cordell, 2002) as it occurs when the phenotypic effect of a mutation is affected by the presence of other mutations in the genome (Papp and Pál, 2011). The study of epistasis has fascinated biologists, as these interactions are key to understand how genes relate functionally. With the knowledge gained from genome-wide association studies (GWAS), an unbiased survey of single nucleotide polymorphisms (SNPs) across the genome assayed by commercial SNP platforms are tested for association with a phenotypic trait of interest. Although most of these SNPs are significantly associated, they have shown a small effect and account for a small proportion of heritable variance (Frazer et al., 2009; Manolio et al., 2009; Eichler et al., 2010).
Epistatic interactions between genes for some quantitative traits, such as meat quality (Ovilo et al., 2002; Duthie et al., 2011a), carcass (Duthie et al., 2010), reproductive traits (Bidanel, 1993; Rodríguez et al., 2005; Noguera et al., 2009), growth (Crooks and Guo, 2017), and muscle fiber traits (Estellé et al., 2008) have been reported for pigs. These findings shed light on the different interactions underlying the genomic regulation in several traits. Although, a large number of GWAS studies for feed efficiency and feeding behavior traits in pigs have been reported (Ding et al., 2017; Reyer et al., 2017b; Ding et al., 2018; Zhang et al., 2018), the epistatic effects over these traits are still not explored. By using 88 microsatellite markers in pigs, (Duthie et al., 2011b) epistatic QTLs (Quantitative Trait Loci) for growth, feed intake and chemical body composition at different stages of growth have been reported. However, to the best of our knowledge, there are no studies on genome-wide epistatic interactions using high throughput genomic data (HTG) and in the context of genetic (SNP) networks underlying feed efficiency related traits in pigs.
GWAS being a single-step approach tests each SNP with the trait of interest, which gives rise to multiple testing problems. Additionally, due to the high stringent cutoffs, some of the most biologically relevant SNPs are missed. Thus, searching for the missing heritability of the traits has led us to include the genetic or epistatic interactions, as it would help us to identify markers explaining a higher proportion of heritable variance. Furthermore, if all the epistatic SNPs are identified, it would help to establish a framework to explicitly include epistatic variance in future methods of genomic prediction in addition to additive variance. This approach would increase the accuracy of genomic prediction for FE and help the pig breeding industry.
Systems genomics and network biology methods focus on detecting interactions among genes and relate them to phenotype or disease manifestation (Suravajhala et al., 2016). WISH (Weighted Interaction SNP Hub) network method (Kogelman and Kadarmideen, 2014) has been proposed to calculate genome-wide epistatic interactions and to construct epistatic networks underlying complex phenotypes. Recently implemented in R, as WISH-R package (Carmelo et al., 2018), this method detects genome-wide interactions between single nucleotide polymorphism (SNP) and traits in high throughput genomic data (HTG). WISH-R calculates epistasis and constructs biological networks using Weighted Gene Co-expression Network Analysis (WGCNA) framework (Langfelder and Horvath, 2008). Herein, the main assumption of WGCNA for clustering gene expression data is used for HTG data to develop a scale-free weighted genetic interaction network to detect biologically relevant genetic modules and biological pathways for complex traits. Herein, we carried out a genomic scan for epistatic interaction followed by network analyses to investigate the extent of epistatic interactions underlying feed efficiency traits in Duroc and Landrace pigs. Additionally, we reported the biological pathways between both the breeds and within efficient and inefficient animals.
Material and Methods
Study Design and Phenotypes
A general overview of the study design and the main analyses steps is represented in Figure 1. The experimental trial was conducted at the pig testing station “Bøgildgård” operated by SEGES within Landbrug and Fødevarer (L&F: Danish Agriculture and Food Council). Pigs were ad libitum fed and free water supplied. The authors of this study were not responsible for animal husbandry, diet, and care as the testing station is a facility within the Danish breeding program run by SEGES.
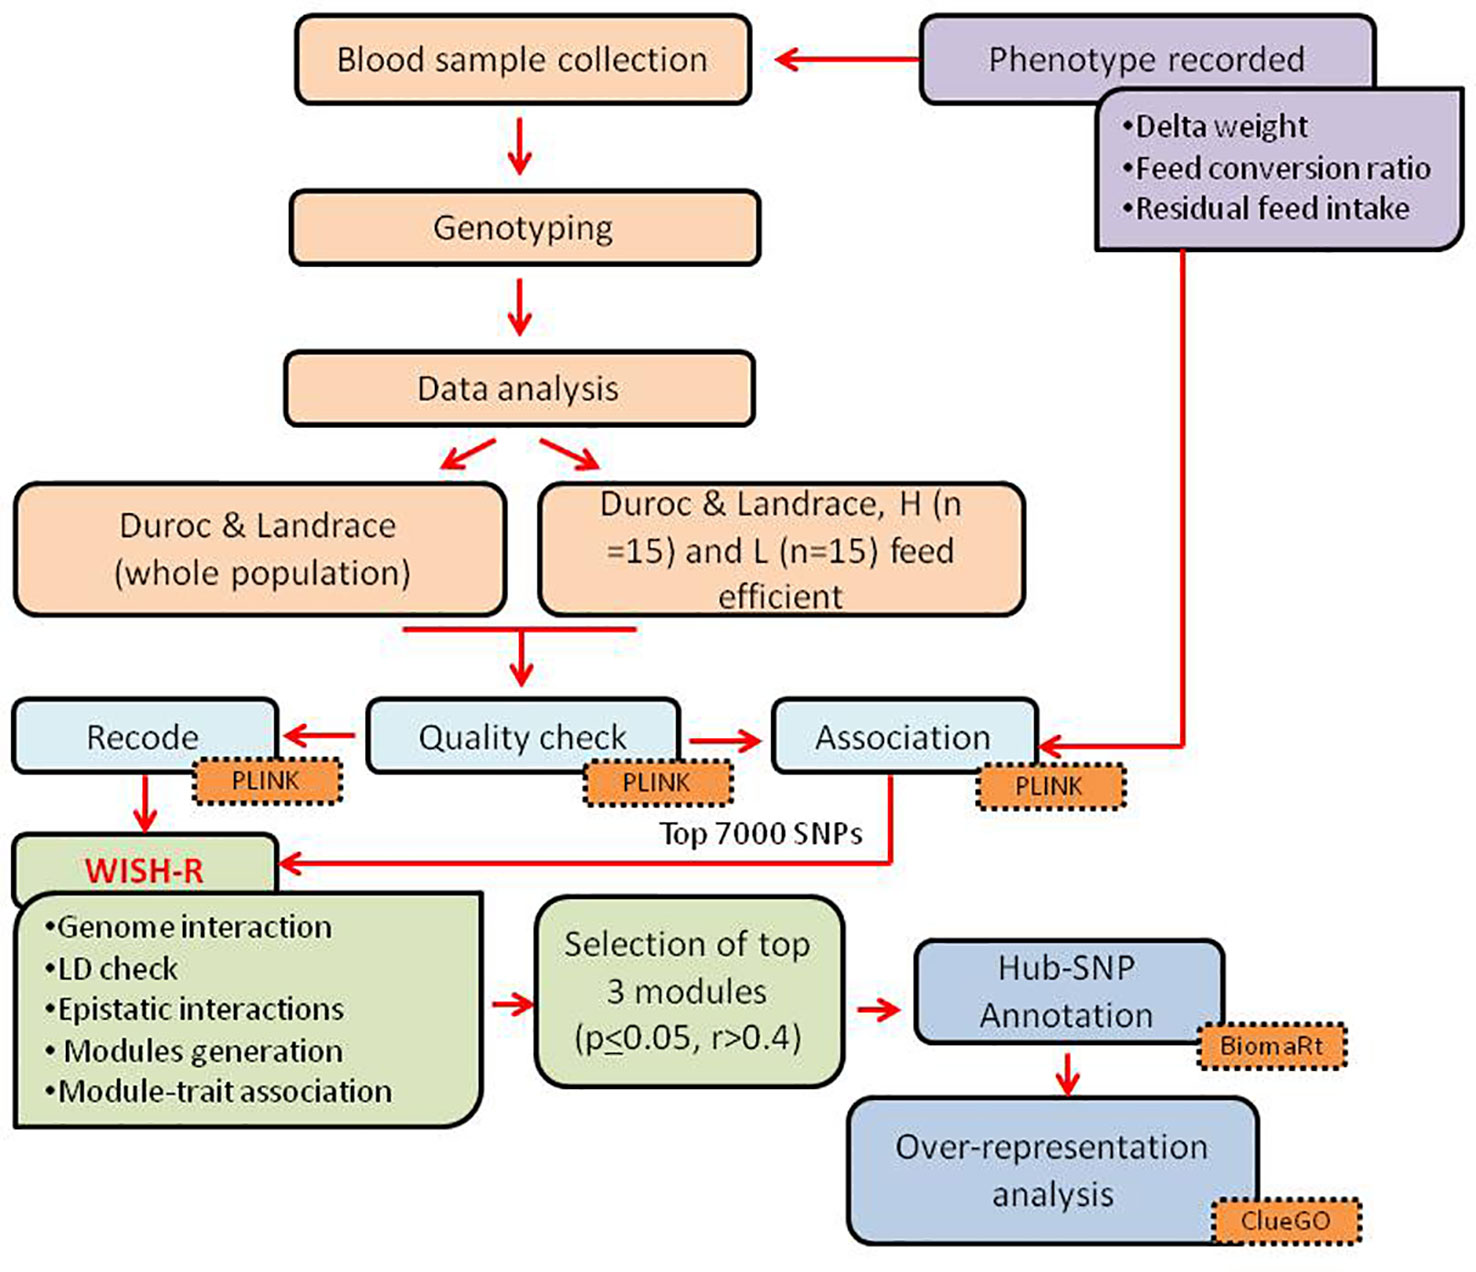
Figure 1 Schematic representation of the study design and analyses steps.
Blood samples at Bøgildgård were collected from jugular venipuncture from each pig into tubes containing EDTA and immediately placed on ice. The pigs were purebred uncastrated males from Danbred Duroc (n = 59) and Danbred Landrace breeds (n = 50), amounting to a total of 109 animals. The breeds have been mentioned as Duroc and Landrace further in the paper.
For the phenotypic traits, the weight of feed consumed (FC) and FE for each pig in the testing phase were measured, beginning with an initial weight of around 28 kg for each animal. The testing phase ranged from 41 to 70 days based on the viability of each pig. Bodyweight during the beginning and end of the test were recorded from the standard test procedure of the testing station, and their difference was referred to as delta weight (DW). The feed conversion ratio (FCR) was calculated as the ratio between the amount of FC and DW. Likewise, the residual feed intake (RFI) was estimated as the difference between the observed daily feed intake (DFI) and the predicted feed intake (pDFI) (Nguyen and McPhee, 2001). A summary of the traits is shown in Table 1. The animals were also classified as low and high feed efficient groups (LFE and HFE, respectively), based on the extremities of FCR for each breed. This was done by selecting pigs that were one standard deviation above or below the mean FCR for each breed, resulting in 15 samples in the LFE and HFE groups. The in-group analysis was done using RFI and FCR as a continuous trait.
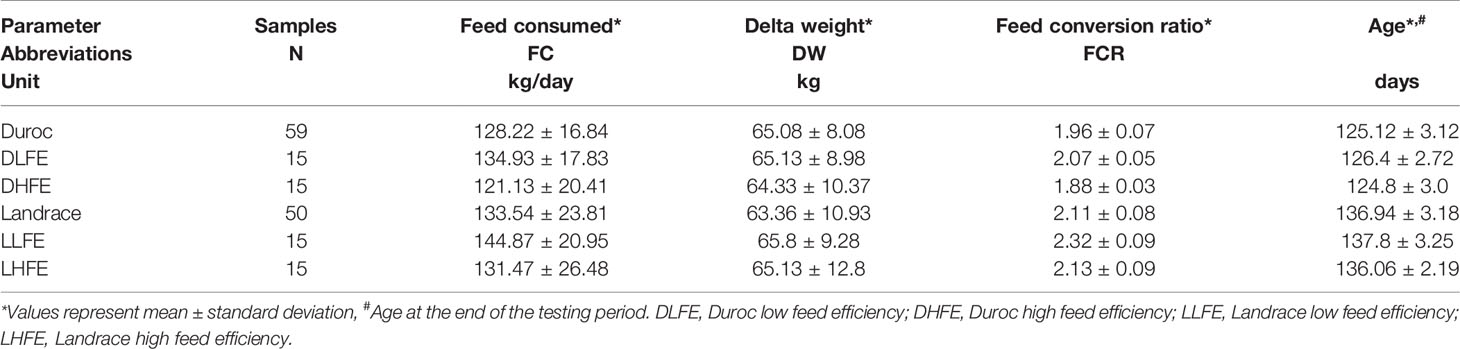
Table 1 Descriptive statistics of the phenotypic traits from Duroc and Landrace evaluated for feed efficiency related-traits.
SNP Genotyping, Quality Control, and Association
DNA isolation was carried out from the collected blood, and SNP genotyping was outsourced to GeneSeek (Neogen company - https://www.neogen.com/uk/). Genotyping was conducted using GGP Porcine HD array (GeneSeek, Scotland, UK), featuring over 68,516 SNPs across 18 autosomes and two sex chromosomes.
The genotype quality control (QC) was carried out using Plink software (Purcell et al., 2007). Samples with a genotyping rate ≤ 90% of markers were filtered out. SNPs with call rates < 90%, minor allele frequencies < 0.01, and Hardy-Weinberg equilibrium (HWE) P < 1 × 10⁻⁷, and the SNPs located on sex chromosomes, as well as with no position information were also excluded from the dataset.
To identify meaningful SNPs related to FCR, both among and within breeds (LFE and HFE groups), we carried an association analysis using Plink version 1.07 based on the “assoc” function. For this, two approaches were adopted as follows: we first carried a breed-specific analysis, considering the whole population (Duroc—59 samples and Landrace—50 samples). Then, the association was also performed within groups for each breed to identify group specific SNPs. The computed p-values were used in the later steps as a filter.
Genome-Wide Pair-Wise Interaction Analysis
We carried out a genome-wide association to investigate the epistatic interactions for feed efficiency traits in Duroc and Landrace pigs by applying the WISH-R package (Carmelo et al., 2018) based on WISH method (Kogelman and Kadarmideen, 2014). To identify breed-specific and group-specific SNP interactions, we selected the top 7,000 SNPs associated to FCR from each analysis, and then carried out the epistatic interaction calculation individually for each breed and each group (LFE, HFE). The selected SNPs were pruned for linkage disequilibrium (LD) using “LD_blocks” function, with a maximum block size of 1000, and threshold = 0.9 from WISH-R package (Carmelo et al., 2018). Further, the “epistatic.correlation” function, considering the default parameters, was employed to calculate the epistatic interaction among the remaining SNPs (Kogelman and Kadarmideen, 2014; Carmelo et al., 2018). The FCR was used as a continuous trait in the analyses for LFE and HFE groups and in both the breeds.
The heterogeneity model used for calculating epistasis is given as:
where y is the phenotype of interest, µ is the intercept, β1 and β2 are the SNP main effects, ϵ is the random residual effect, β3 represents the epistasis of the two loci. To represent the genotype snpi and snpj, the genotype data were coded as 2 (homozygote minor alleles), 1 (heterozygote) or 0 (homozygote major alleles) based on the function “generate.genotype” in WISH-R which uses file in the PED and TPED file format from Plink (Purcell et al., 2007).
The epistatic interactions (β3) estimated by WISH-R were visualized using the function “genome.interaction” with a quantile size of 0.9. The genome-wide interaction overview was calculated with the quantile values of the significance of the interaction between chromosomes. It indicated the chromosomal hotspots for the interaction of a given phenotype. WISH-R default settings were used to calculate chromosomal interactions.
Epistatic Networks and Trait Association Analyses
The SNP-SNP epistatic correlation coefficients calculated were used to construct the epistatic networks following the WISH-R pipeline that identified modules of SNPs related by epistasis. We then summarized modules based on module eigenSNP (MSNP), and related the MSNP with the traits of interest. We constructed a signed weighted network, using “generate.module” function, separately for both breeds, and also for the LFE and HFE groups in each breed. Strongly correlated modules were merged using the function “mergeCloseModules”.
To unravel biologically meaningful modules, we used the module eigenSNP to examine the relationship between the FCR and the modules, resulting in a genome-wide module association test. We also included the RFI in the association analysis to identify epistatic SNPs for both the traits.
The top 3 significant modules (p ≤ 0.05 and r > 0.4) were selected for downstream analysis to unravel the biological pathways underlying the traits. The P-values used were adjusted using Bonferroni approach referred as Padj. The highest interacting SNPs were identified considering the SNP connectivity score estimated from the “softConnectivity” function (Langfelder and Horvath, 2008). The SNPs from the top significant modules were termed as hub-SNPs and selected for further analysis.
Annotation of SNP-SNP Network and Gene Identification
The SNP annotation was done using BiomaRt (R package) (Durinck et al., 2005; Durinck et al., 2009) from the Porcine Ensembl database, Sscrofa11.1. The unidentified SNP annotation from Biomart was done through g:Convert in g:Profiler (https://biit.cs.ut.ee/gprofiler/convert) (Reimand et al., 2007). Gene ontologies (GO), canonical pathways, and biological interpretation were performed from ClueGO version 2.5.4 (Cytoscape plugin) (Bindea et al., 2009) based on Sus scrofa annotation. The KEGG pathways over-represented in the selected modules were identified by grouping the redundant terms with kappa-score = 0.4. The pathways with GroupPValue ≤ 0.05 were selected, and the network was visualized using Cytoscape version 3.7.1 (https://cytoscape.org/) (Shannon et al., 2003). A heatmap was constructed using pheatmap R-package considering -log10 (GroupPvalue) to summarize the pathways within and among the groups.
Results
Genome-Wide Epistatic Interactions
After quality control (QC), 48,444 and 49,876 loci in Duroc and Landrace on 18 porcine autosomes were available for association analysis with FCR. Likewise, 51,852 and 51,335 SNPs from Duroc and Landrace, respectively, passed QC in LFE and HFE groups.
From the association analyses, the top 7,000 SNPs were selected, and based on WISH-R package (Carmelo et al., 2018), we calculated the epistatic interactions based on FCR in both the breeds and within the breed groups (Figure 2). In Duroc considering the whole population, the chromosomal hotspots were widely distributed. However, in the Duroc, low feed efficient (DLFE) group, the pairwise interaction was more evident in chromosomes 10, 16, and 17 (Figure 2). From the Duroc, high feed efficient (DHFE) group (Figure 2), pairwise interactions were evident in chromosomes 4, 7, and 13. Although a widespread pairwise interaction was seen considering the whole population of the Landrace (Figure 2), the pairwise interaction in low feed efficient (LLFE) group was evident only in chromosomes 8 and 18 (Figure 2) whereas the chromosome 14 stood out for high feed efficiency (LHFE) group (Figure 2).
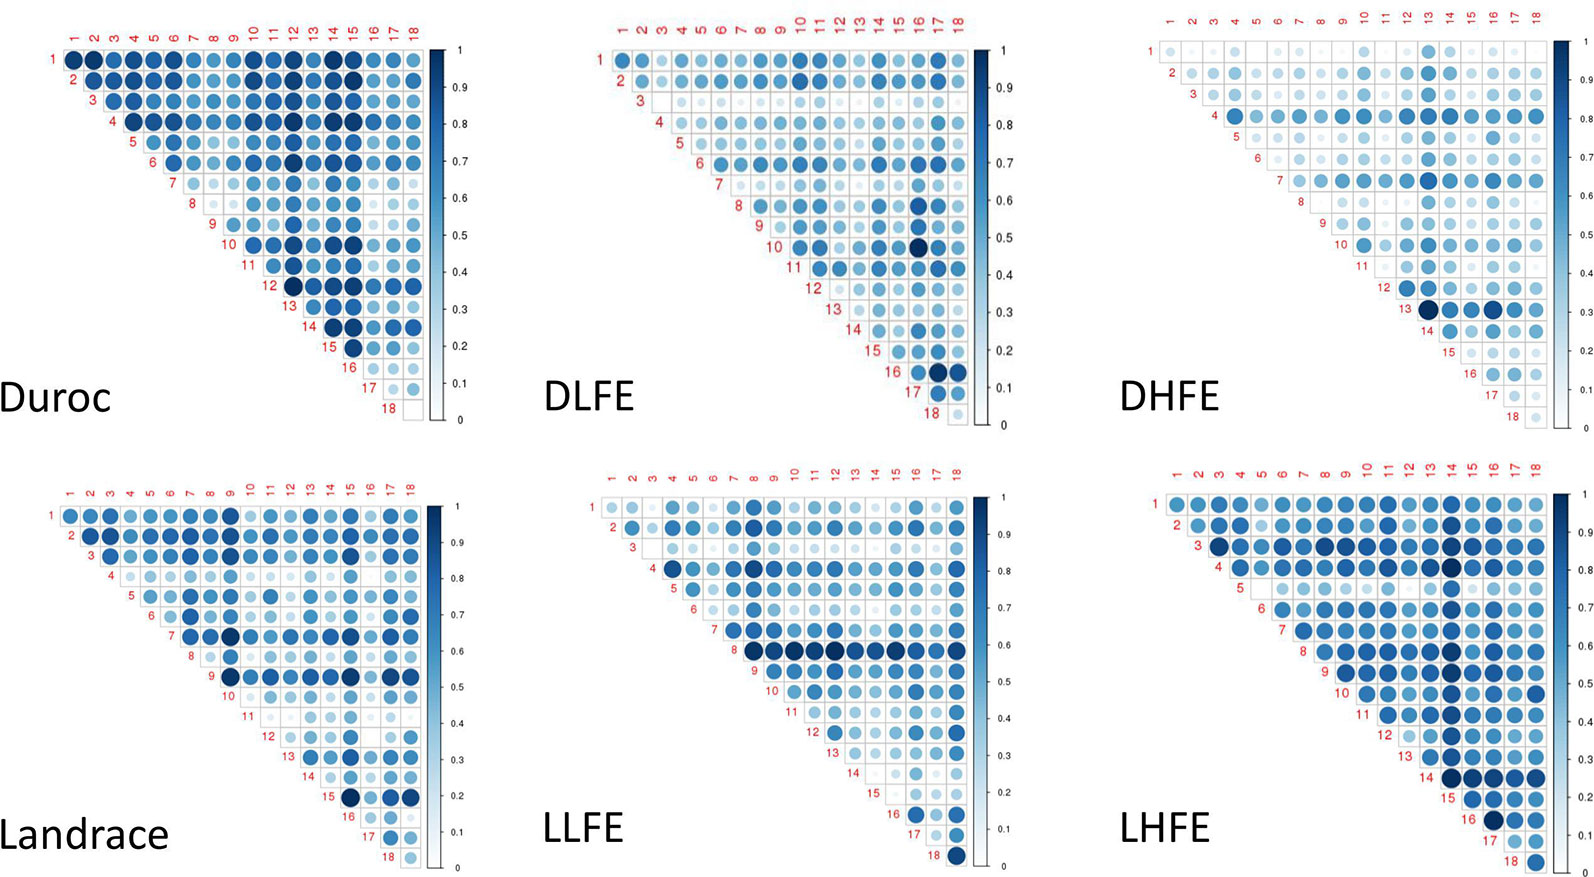
Figure 2 Pairwise chromosomal interaction. DLFE and DHFE represent Duroc low and high feed efficient groups, LLFE and LHFE represent Landrace low and high feed efficient groups, respectively.
SNP-SNP Network Analysis
Clustering the 5,191 remaining SNPs after LD pruning, we identified 10 modules in Duroc. Based on our criteria of r >0.4 and p value ≤ 0.05, three modules were selected for further analysis. Among the module-traits, MEpink (297 SNPs), MEblue (637 SNPs) and MEred (313 SNPs) were significantly associated (Padj <0.01) with both FCR and RFI traits (Figure 3A). For Landrace, 5,580 SNPs were clustered into 11 modules after LD pruning. Among the identified modules, MEbrown (593 SNPs), MEpink (113 SNPs), and MEyellow (509 SNPs) were the top significant ones associated to FCR and RFI. (Figure 3B). The list of hub-SNPs and their connectivity score is given in Supplementary Table 1.
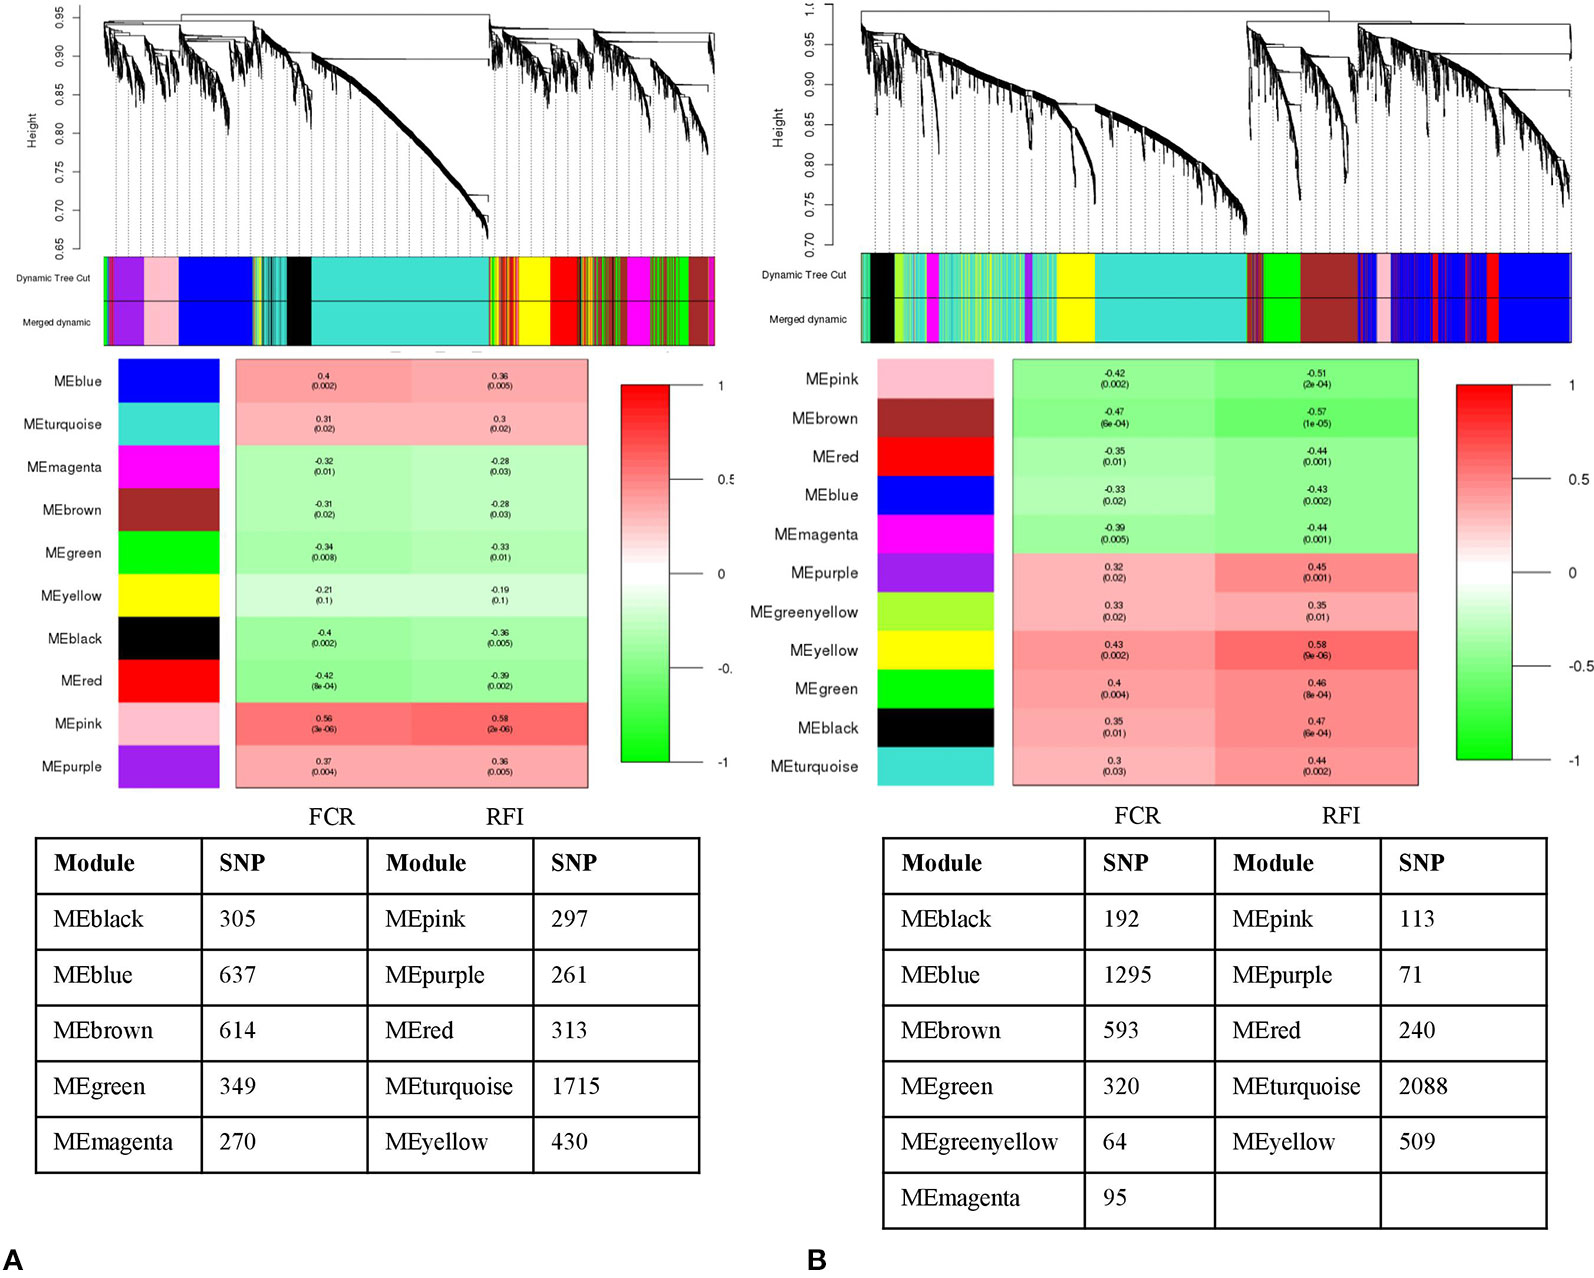
Figure 3 Dendrogram and module-trait correlation plots in A: Duroc and B: Landrace, with FCR and RFI as a continuous trait. Upper panel of each plot (A, B) represents SNP-clustering dendrogram obtained by hierarchical clustering of TOM-based dissimilarity with the corresponding module colors indicated by the color row. Each colored row represents color-coded module that contains a group of highly connected SNPs. The middle panel of each plot (A, B) represents the module trait correlation, where the x-axis represents feed conversion ratio (FCR) in the first column and residual feed intake (RFI) in the second column; the y-axis represents the modules. The color-code in the module-trait correlation plots is based on Pearson’s correlation (p-values in parenthesis). Positive and negative correlations are shown in red and green colors, respectively. The lower panel represents the number of SNPs clustered in each module.
Likewise, the SNP-SNP interaction was calculated in LFE and HFE groups in both breeds. In DLFE group, 5,081 SNPs were tested for the interaction after LD pruning. The SNPs were clustered into 20 modules in which MElightgreen with 80 SNPs was found to be the only module significant associated with FCR (r = –0.55, p-value = 0.03) and RFI (r = –0.52, p-value = 0.05) (Figure 4A). Regarding DHFE group, 5,118 SNPs were tested and clustered into 13 modules. The MEblack (198 SNPs) was significantly correlated to RFI (r = –0.61, p-value = 0.02) (Figure 4B). There was no significant association for FCR.
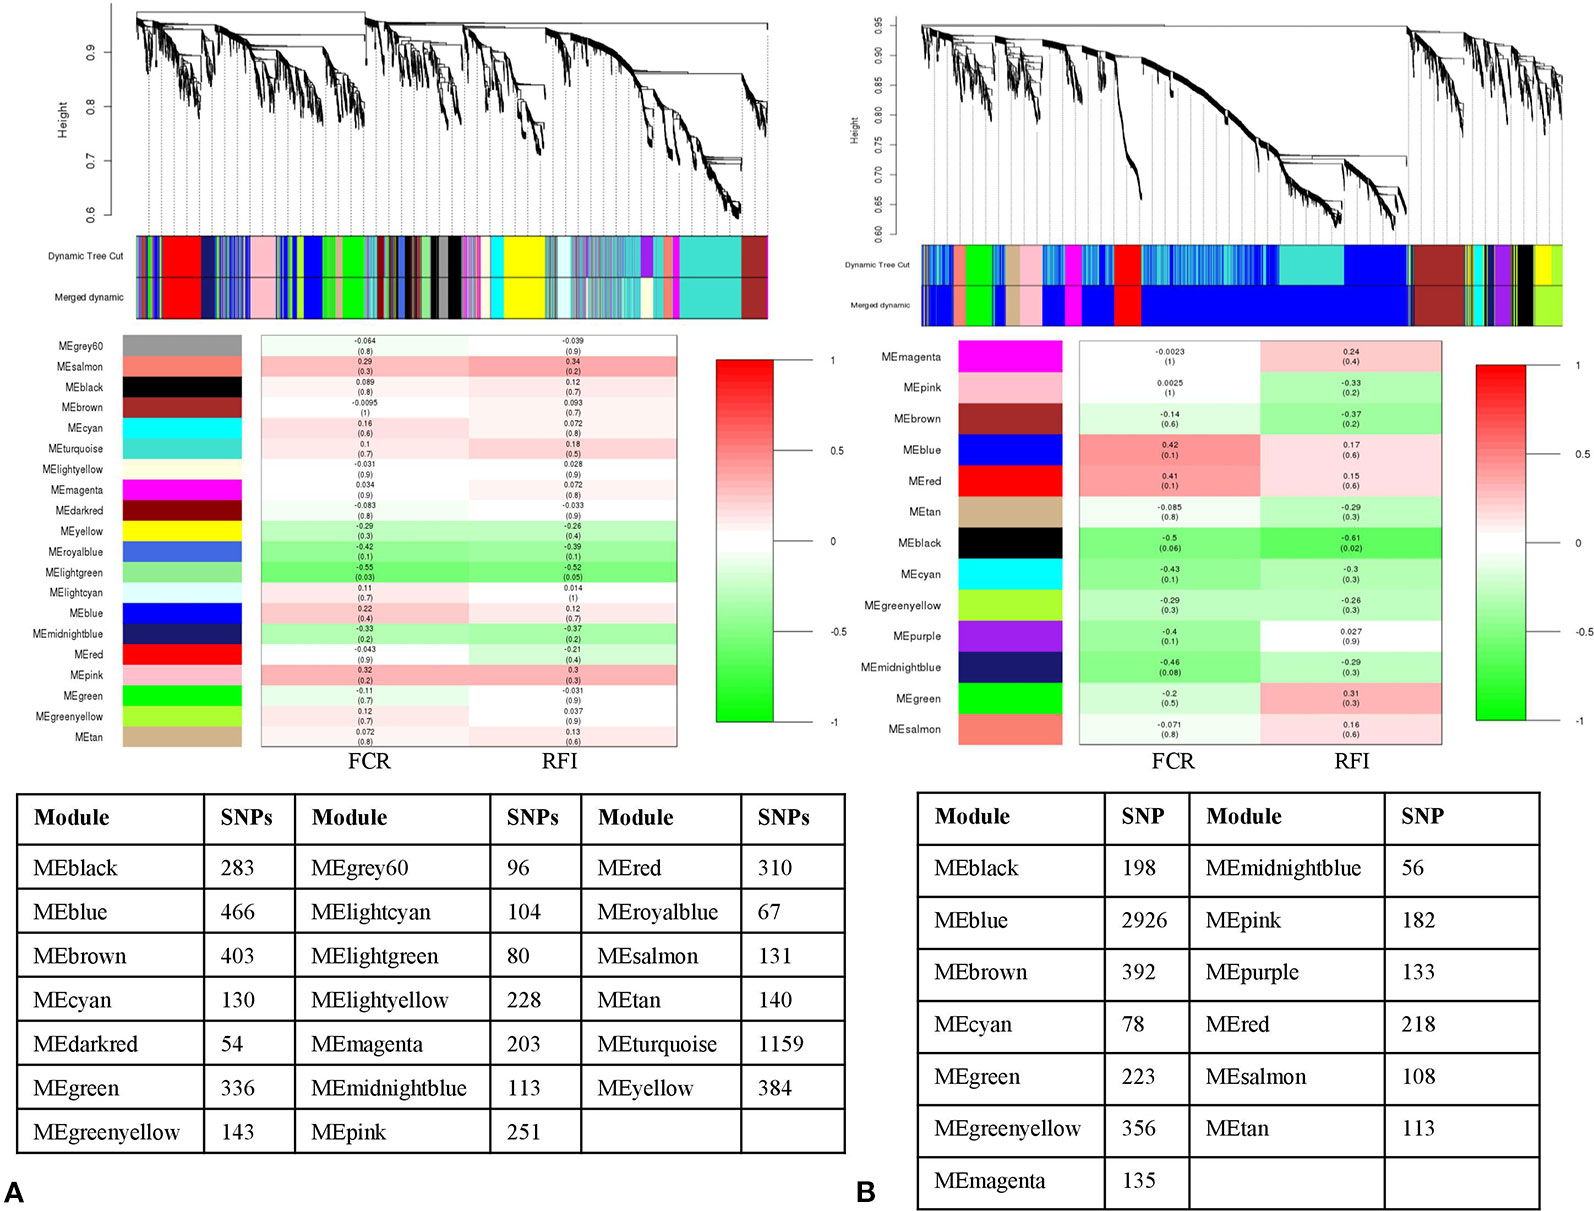
Figure 4 Dendrogram and module-trait correlation plots in A: Duroc low and B: Duroc high feed efficient groups. Upper panel of each plot (A, B) represents SNP-clustering dendrogram obtained by hierarchical clustering of TOM-based dissimilarity with the corresponding module colors indicated by the color row. Each colored row represents color-coded module that contains a group of highly connected SNPs. The middle panel of each plot (A, B) represents the module trait correlation, where the x-axis represents feed conversion ratio (FCR) in the first column and residual feed intake (RFI) in the second column; the y-axis represents the modules. The color-code in the module-trait correlation plots is based on Pearson’s correlation (p-values in parenthesis). Positive and negative correlations are shown in red and green colors, respectively. The lower panel represents the number of SNPs clustered in each module.
From LLFE group, 4,814 SNPs were tested and generated into 22 modules. The MEcyan module, comprising 146 SNPs (r = –0.54, p-value = 0.04) was significantly correlated with FCR. No significant associations were identified for RFI (Figure 5A). Among 7,547 SNPs in LHFE group, 29 modules were identified and MEdarkolivegreen (r = –0.53, p-value = 0.04) with 170 SNPs and MEpaleturquoise (r = –0.6, p-value = 0.02) with 62 SNPs were significantly correlated with FCR and RFI, respectively (Figure 5B).
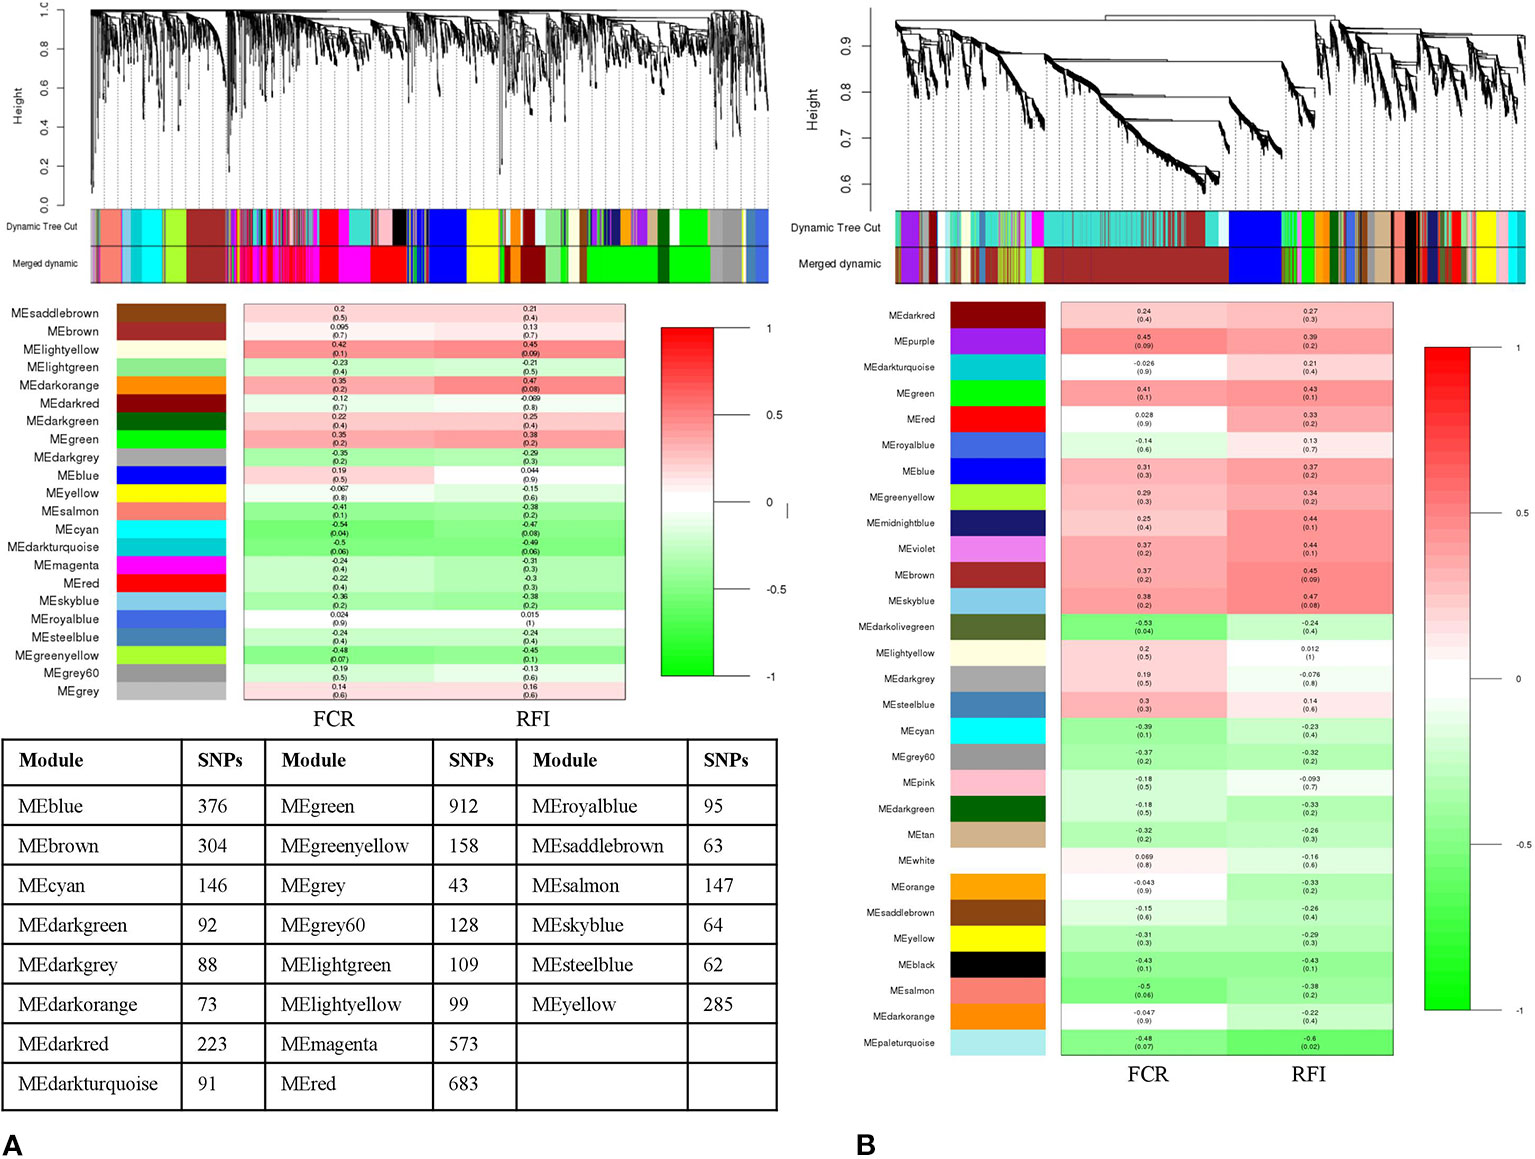
Figure 5 Dendrogram and module-trait correlation plots in A: Landrace low and B: Landrace high feed efficient groups. Upper panel of each plot (A, B) represents SNP-clustering dendrogram obtained by hierarchical clustering of TOM-based dissimilarity with the corresponding module colors indicated by the color row. Each colored row represents color-coded module that contains a group of highly connected SNPs. The middle panel of each plot (A, B) represents the module trait correlation, where the x-axis represents feed conversion ratio (FCR) in the first column and residual feed intake (RFI) in the second column; the y-axis represents the modules. The color-code in the module-trait correlation plots is based on Pearson’s correlation (p-values in parenthesis). Positive and negative correlations are shown in red and green colors, respectively. The lower panel represents the number of SNPs clustered in each module.
SNP Annotation and Network Visualization
The hub-SNPs were identified (Supplementary Table 1) from the significantly correlated modules (P ≤ 0.05) as described above. The summary of annotated hub-SNPs is provided in Table 2.
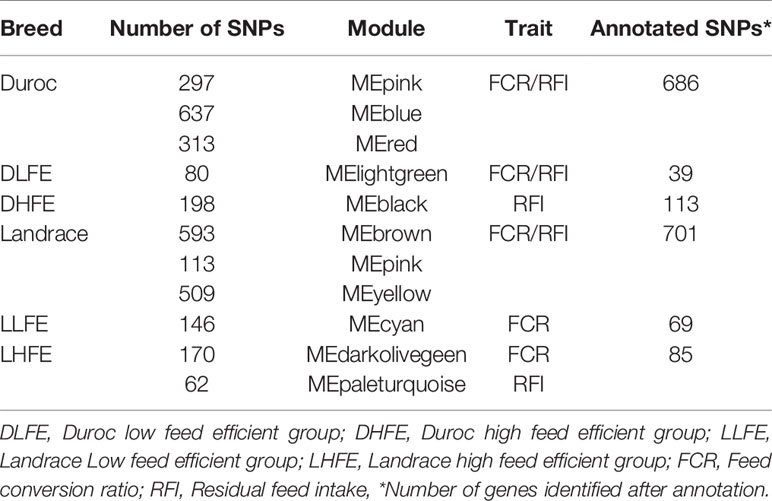
Table 2 Significant SNPs for FCR and RFI annotated for pathway analysis.
In Duroc, out of the 1,247 hub-SNPs, 43% of the SNPs were harbored in intergenic regions, followed by 40% in intronic variants (Figure 6A—pie chart). Regarding Landrace, out of 1,215 hub-SNPs identified, 43% of the SNPs were intronic variants, followed by 40% of SNPs in intergenic regions (Figure 6B—pie chart). The distribution of SNPs across the chromosomes identified from the significant modules and number of SNPs annotated in each breed are provided in the bar plot for Duroc and Landrace, respectively (Figures 6A, B—bar plot).
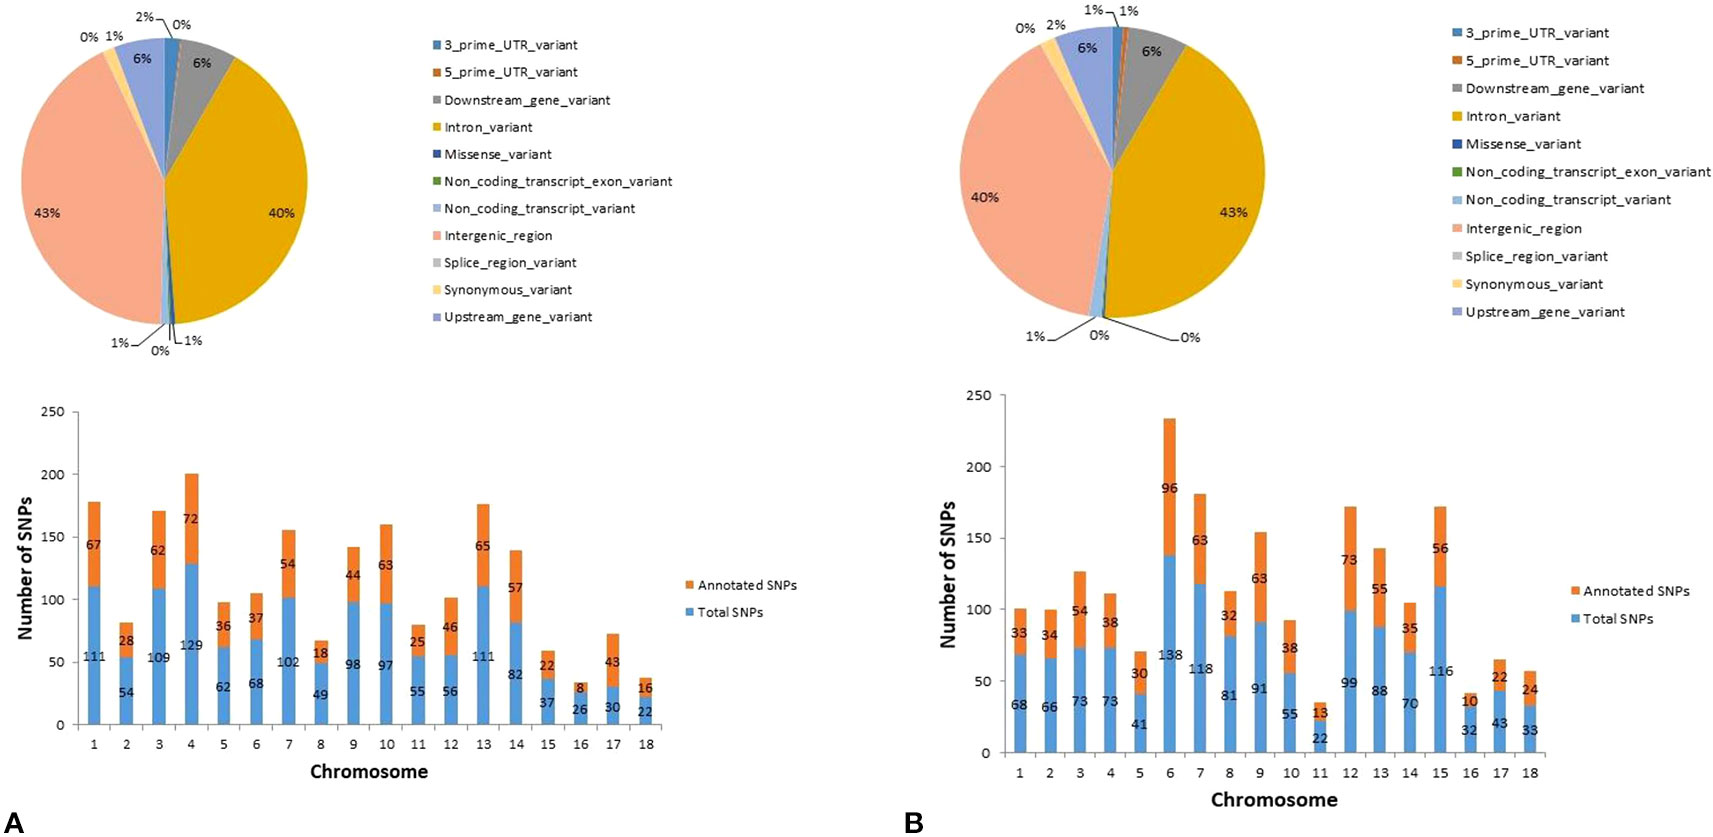
Figure 6 Graphical representation of the variant type identified (pie-chart) and distribution of SNPs across the chromosomes identified in the top significant modules (bar plot) for (A) Duroc and (B) Landrace.
From Duroc (1,247 hub-SNPs) and Landrace (1,215 hub-SNPs), only 64 SNPs were found common, while 1,183 SNPs were unique to Duroc and 1,151 were unique to Landrace. In DLFE and DHFE groups, with 80 and 198 hub-SNPs, respectively, four SNPs were common pointing towards the difference in SNP interactions in both breeds. In LLFE and LHFE groups, among 146 and 232 hub-SNPs in each group, respectively, only six SNPs were found common between them. The annotated hub-SNPs (Table 2) corresponding to genes were subjected to pathway analysis in ClueGO to capture the biological information of each gene in all the groups. The significant pathways (GroupPValue ≤ 0.05) underlying the hub-SNPs identified for each breed and in low and high feed efficient groups are given in Supplementary Table 2 and Figure 7.
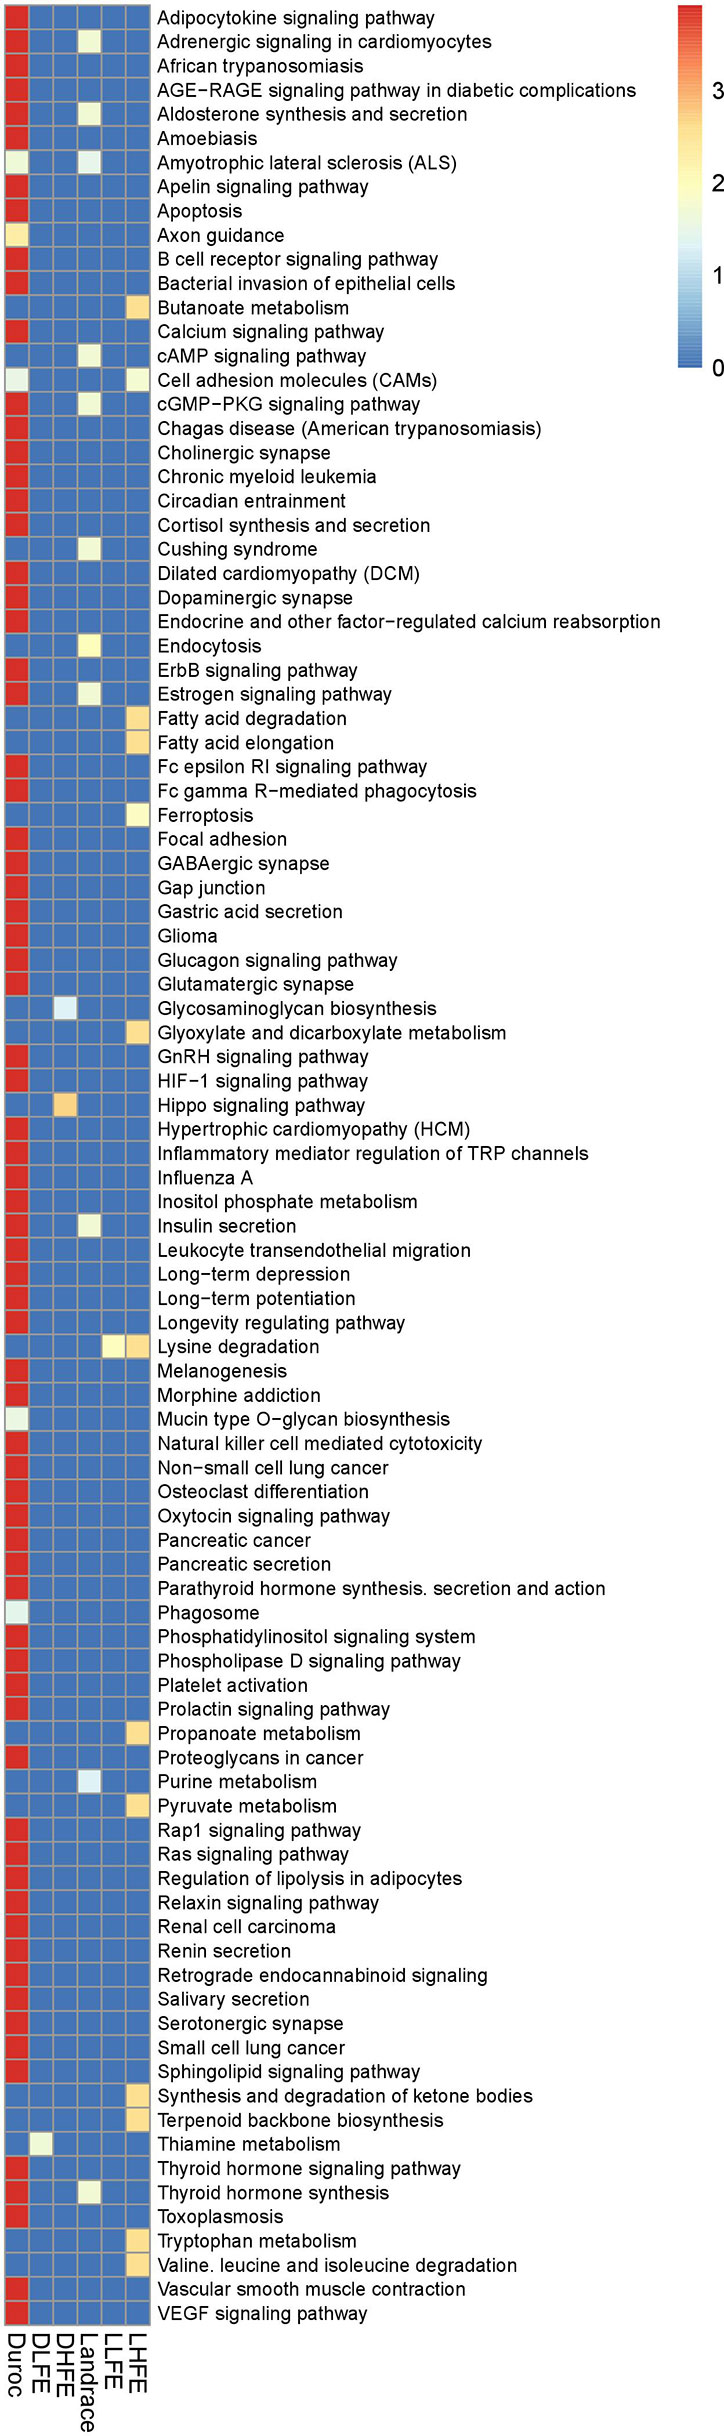
Figure 7 Over-represented signaling pathways of genes identified from hub-SNPs in each breed with low and high feed efficient groups. The plot is color-coded based on -log10 (GroupPvalue) of different pathways.
The pathways identified in Duroc points to inositol phosphate metabolism, Erb signaling pathway, Ras signaling pathway, and Rap1 signaling pathway. For DLFE group, SNP-SNP interaction pointed out to thiamine metabolism and phenylalanine, tyrosine, and tryptophan metabolism. In DHFE group, the pathways resulting from the interaction were the hippo signaling pathway and glycosaminoglycan biosynthesis. In Landrace, the major pathways involved were cGMP-PKG signaling pathway, cAMP-signaling pathway, MAPK signaling pathway, aldosterone synthesis, and secretion, and thyroid hormone synthesis. Lysine degradation was found to be the most significant pathway underlying LFE group. Additionally, the over-represented pathways included arginine and proline metabolism, and fatty acid biosynthesis as well. Pathways like fatty acid elongation and degradation, valine, leucine, and isoleucine degradation, lysine degradation, and tryptophan metabolism were identified for the LHFE group (Figure 7).
Gene annotation, reference SNP ID, Sus scrofa EnsemblID, chromosome in which the SNPs are located, and their connectivity scores as calculated for each breed and the LFE and HFE groups are given in Supplementary Table 3. A higher value of connectivity scores (in hundreds or above) shows that the data exhibit a strong driver that makes the subset of the samples globally different from the rest.
Discussion
Feed efficiency in pigs is an important quantitative trait influenced by complex genetic control. Understanding the molecular mechanisms underlying this complex trait will help in the efficient selection of pigs, thereby beneficial for the pig producers. In Danish pig breeding, Duroc is currently used as terminal sires in combination with crossbred Landrace x Yorkshire families (Do et al., 2013). Selection emphasis on feed efficiency in Duroc is greater as compared to Landrace. In our study, we found that Landrace has significantly greater FCR as compared with Duroc, this was also consistent with the studies reported earlier (Jensen et al., 2007; Do et al., 2013).
A plethora of GWAS and QTL studies for feed efficiency in pigs have been reported. However, to our knowledge, genetic networks based on HT SNP data for FE using genome-wide epistatic interactions have not been reported in Duroc and Landrace pigs. In this study, we used genome-wide SNPs to unravel the genetic contribution of the epistatic effects to the phenotypic variation for feed efficiency related traits like FCR and RFI in pigs. For this purpose, we used high throughput SNP genotype data generated with GGP Porcine HD array to search for signature SNPs that highly interact with each other, followed by network and pathway over-representation analyses, thereby underlying FE related-traits in Danish production pigs.
The pair-wise interaction varied between both the breeds and within the low and high feed efficient groups in each breed. While this does not give an accurate representation of individual interactions, it does indicate which chromosomes may be hot spots for interactions of a given phenotype. From the network analysis, we found several modules associated with FCR and RFI in both breeds, as well as in low and high feed efficient groups of each breed pointing towards the pathways affecting these traits.
Based on the over-representation pathway analysis, Rap1 and Ras signaling pathway, inositol phosphate metabolism, ErbB signaling pathway, thyroid hormone synthesis, adipocytokine-signaling pathway were identified in Duroc. From the SNP-SNP interaction in DLFE, thiamine metabolism, folate biosynthesis, and phenylalanine, tyrosine and tryptophan metabolism were found to be involved. In DHFE group, the pathways resulting from the interaction were hippo signaling pathway, glycosaminoglycan biosynthesis, glycosylphosphatidylinositol (GPI)-anchor biosynthesis, and nitrogen metabolism. In Landrace, the major pathways involved were cGMP-PKG signaling pathway, cAMP-signaling pathway, MAPK signaling pathway, aldosterone synthesis and secretion, and thyroid hormone synthesis. Furthermore, lysine degradation was found to be the most significant pathway underlying LLFE group, followed by arginine and proline metabolism and fatty acid biosynthesis as some other pathways. Pathways like fatty acid elongation and degradation, valine, leucine and isoleucine degradation, lysine degradation, and tryptophan metabolism were identified for the LHFE group.
mTOR and MAPK: Key Signaling Pathways in Duroc
The top pathways over-represented in Duroc included the ErbB signaling pathway, Ras, and Rap1 pathways. ErbB signaling pathway is associated with the NRG4 gene as given in our study. The ErbB receptor tyrosine kinases include the epidermal growth factor receptor (EGFR), ErbB2, ErbB3, and ErbB4. These are important for intestinal tract homeostatic maintenance (Schumacher et al., 2017). They have shown the treatment of activated pro-inflammatory macrophages with the ErbB4 ligand neuregulin-4 (NRG4) induces apoptosis (Schumacher et al., 2017). One of the major downstream targets of ErbB tyrosine receptor family is P13-K/Akt (Schuurbiers et al., 2009). Activation of this pathway is achieved after activation of EGFR and four members of ErbB family. EGFR itself is a weak activator of P13-K, but connects to Ras/P13-K/Akt pathway or collaborates with ErbB3 (Schuurbiers et al., 2009). Ras along with Rap1 play a critical role in regulating T-cell proliferation response (Remans et al., 2004). Ras transmits signals from TCR to the activation of Raf-1/ERK signaling cascade required for T-cell proliferation, IL-2 production, and thymic maturation. Closely related, Rap1 stimulates TCR and suppresses Ras-dependent transformation (Remans et al., 2004). P13Ks phosphorylate 3′-hydroxyl group of the inositol ring of phosphatidylinositides and are divided into three classes: Class I P13K, PIP3, and PIP2. PIP3 acts as a secondary messenger, facilitating the recruitment and activation of PI3K-dependent kinase-1 (PDK1) (Yu and Cui, 2016). The signaling duration of PIP3 is subject to regulation by phosphatase and tensin homolog (PTEN), which acts to oppose PI3K activity. The serine/threonine kinase AKT, also known as protein kinase B (PKB), possesses a PH domain and is recruited to the plasma membrane along with PDK1. Phosphorylation of amino acid residues by PDK1 and mTORC2 (a subunit of mTOR from P13K-related kinase family), respectively, is essential for full AKT activation (Yu and Cui, 2016). Previous reports of AKT3, which is a key regulator of P13/Akt/mTOR pathway, is involved in ErbB, Ras, Rap1, cGMP-PKG pathways in our study. Horodyska et al. (2019) also reported Akt acting in hepatocyte growth factor (HGF) signaling and epidermal growth factor (EGF) signaling pathways. Akt is a member of the Akt kinase family and has a significant role in the modulation of cell survival and proliferation in high feed efficient pigs (Horodyska et al., 2019). Gene ADCY8, which was involved in most of the pathways in our study, was involved with cholesterol levels in pigs (Bovo et al., 2019).
Genes ABL1, MAP3K4, MAP3K5 (chr 1), SEMA6A (chr 2), KITLG (chr 5), and KAT2B (chr 13), identified from highly interconnected epistatic SNPs also pointed out towards ErbB, Ras, Rap1, thyroid hormone, axon guidance signaling pathways in Duroc. Mitogen-activated protein kinase (MAPK) cascades have been shown to play a key role in transduction extracellular signals to cellular responses (Zhang and Liu, 2002), and its overexpression increased axon branching (Kalil et al., 2011). The top connectivity score SNPs pointed towards genes like SEMA6A, ABLIM1, and NTNG1, which are involved in the axon guidance pathway. SEMA6A was downregulated in porcine skeletal muscle as reported in a study of the transcriptional response to feeding a linseed enriched diet in pigs (Wei et al., 2016). ABLIM1 and NTNG1 affect intramuscular fat content (IMF) (Wang et al., 2017; Wang et al., 2019). Some other high connectivity score SNPs pointed to the MAP3K5 gene, which was related to residual feed intake (Pu et al., 2016). The MAPK (ERK1/2) signaling pathway causes serine phosphorylation by MAPK of several nucleoproteins, including the nuclear thyroid hormone receptor beta1, which is activated by thyroid hormone (Tang et al., 2004). KAT2B was involved with thyroid hormone signaling pathway. The systemic effects mediated by thyroid hormones induces metabolic shifts characterized by increased lipolysis and gluconeogenesis, affecting feed efficiency in pigs (Reyer et al., 2017a). MAPKs regulates (either stimulating or inhibiting) the catalytic activity, and specificity, of kinases and phosphatases that are involved in the metabolism of phosphatidylinositols (PI) and inositol phosphates (IP), thereby exert regulatory actions on PI- and/or IP-dependent signaling pathways (Caldwell et al., 2006). Genes P14KB and PLCB1 which accelerated to Inositol phosphate metabolism were associated with phosphate metabolism and feed efficiency in Duroc (Ding et al., 2018). P14KB was reported to be enriched in phosphate metabolism in Berkshire and Korean pigs (Edea and Kim, 2014).
We also focused on the study of the pathways identified by the highly interacting SNPs in LFE and HFE groups of both the breeds. In DLFE group, TPK1 (chr 9) was significantly involved with thiamine metabolism. The most active form of vitamin B1 is thiamin pyrophosphate; its synthesis in eukaryotes requires thiamine pyrophosphokinase, which catalyzes pyrophosphate group transfer from ATP to thiamine (Tylicki et al., 2018). Thiamin supplementation in dairy cattle has been reported to increase rumen pH and balance the population of lactic acid-producing and -consuming bacteria (Wang et al., 2015). Thiamine is critical for cellular function, as its phosphorylated and active form, thiamine diphosphate (TDP), acts as a coenzyme for three key enzymes in glucose metabolism (Liu et al., 2017) which differs to a great extent in high and low feed efficient groups (Fu et al., 2017).
From DHFE, the genes CRB1 (chr 10), DLG2 (chr 9), PARD6G (chr 6), and PPP1CB (chr 3) pointed towards the hippo signaling pathway. This pathway is an evolutionarily conserved and it controls organ size by regulating cell proliferation, apoptosis, and stem cell self-renewal (Leno-colorado et al., 2017). The glycosaminoglycan pathway, involving the CHST4 (chr 6) gene, was also significant in the HFE group. This pathway was identified in a GWAS study of beef cattle for growth and intake components for feed efficiency (Serão et al., 2013).
Cross-Talk of cGMP and cAMP Pathway Regulating Aldosterone Secretion in Landrace
The top pathways in Landrace were endocytosis and signaling pathways including cGMP-PKG, cAMP, estrogen signaling pathways, adrenergic signaling in cardiomyocytes, insulin secretion, thyroid hormone synthesis, aldosterone synthesis, amyotrophic lateral sclerosis, and purine metabolism. Cyclic nucleotides 3′,5′-cyclic adenosine monophosphate (cAMP) and 3′,5′-cyclic guanosine monophosphate (cGMP) are ubiquitous intracellular second messengers that regulate multiple physiological functions (Pavlaki and Nikolaev, 2018). The high interacting epistatic SNPs point out towards genes GABBR2, GNA12, PRKCG from chromosome 1, 3, and 6, which underlie the thyroid hormone, cGMP-PKG, and cAMP pathways. Phosphodiesterases (PDEs) are hydrolyzing enzymes that terminate the intracellular effects of cyclic nucleotides by their hydrolysis and prevents continuous activation of the downstream effector proteins (Pavlaki and Nikolaev, 2018). cGMP-regulated PDEs, especially PDE2 are found to regulate cGMP-to-cAMP cross-talk (Pavlaki and Nikolaev, 2018). Aldosterone secretion requires PDE2A-mediated hydrolysis of cAMP (Pavlaki and Nikolaev, 2018). The ATP1A2 gene, acting in most of the pathways as mentioned above, was involved with production traits in pigs (Stefanon et al., 2004) and was also related to cGMP-PKG signaling pathway in our study. Adrenergic signaling in cardiomyocytes was over-represented here, where CACNG7 and CACNG5 were partaking. According to the studies reported earlier, CACNG7 is a candidate gene with feed efficiency in Nelore cattle (Olivieri et al., 2016) while CACNG5 was differentially expressed and participated in activating MAPK signaling pathway in chickens (Li et al., 2018). MAPK pathway is activated by several stimuli and transduce the signal inside cells, generating diverse responses, including cell proliferation, differentiation in the rapidly renewing epithelia that line the gastrointestinal tract (Osaki and Gama, 2013).
In Landrace, lysine degradation was involved with LFE group. Fatty acid elongation, synthesis, and degradation of ketone bodies, valine, leucine, and isoleucine degradation, lysine degradation, metabolism of tryptophan, pyruvate, propanoate, butanoate, glyoxylate, and dicarboxylate, ferroptosis and cell adhesion molecules pathways were found over-represented in HFE. Genes SETD7 (chr 8) and PLOD1 (chr 6) were involved with lysine degradation in our study. Lysine is a limiting amino acid, and its deficiency impairs the animal’s immunity and growth performance (Liao et al., 2015). Reports also suggested that the dietary supplementation with lysine influences intestinal absorption and metabolism of amino acids (Yin et al., 2017). Lysine restriction inhibits intestinal lysine transport and promotes feed intake associated with gut microbiome in piglets (Yin et al., 2017). From the LHFE group, ACAT1 (chr 9) was involved in most of the pathways, which are also found to affect lipid metabolism in feed efficiency in pigs (Reyer et al., 2017a). Gene LPCAT3 involved with ferroptosis incorporates arachidonic acid (lipid) into the membrane of the intestine and liver cells, which enables triacylglycerols to be assembled into lipoproteins (Hashidate-Yoshida et al., 2015). Triglycerides are found to affect energy value to animals. Major constituents of triacylglycerol, saturated fatty acid (SFA) and monounsaturated fatty acid (MUFA) (Kasprzyk et al., 2015) were found to be lower in high feed efficient pigs (Horodyska et al., 2019).
The annotated SNPs and genes underlying the significant over-represented pathways discussed here pointed out their role in feed efficiency related-traits. We also identified other SNPs with high SNP-SNP interaction values, high connectivity score, and clustered into the selected modules. However, they were in intergenic regions and thus were not included in gene and pathway analysis. Since these SNPs occur in the modules selected to have a high epistatic interaction among themselves, a detailed study of these SNPs is needed to understand their role in feed efficiency related-traits.
Conclusion
This study applied a novel approach for studying the genome-wide epistatic interaction in quantitative traits using high throughput genomic data under a network and systems biology context. To the best of our knowledge, it is the first study to report such genome-wide genetic interaction networks underlying feed efficiency traits in pigs. We used WISH-R and other network approaches to search for pair-wise SNP interaction for feed efficiency traits from genotype data based on prior biological knowledge and frameworks. Highly interacting epistatic SNPs that clustered together in significant modules (r > 0.4, p ≤ 0.05), were identified in Duroc and Landrace across the whole population for FCR and RFI traits. The approach followed here, provided many interesting genes and interactions with significant p-values. While some of the identified hub-SNPs were linked to genes well known for their association with feed efficiency, others are novel and potentially provide new avenues for further research. The main over-represented pathways in Duroc were the mTOR and MAPK pathways. In Landrace, the main pathways were cAMP, cGMP-PKG pathway, aldosterone synthesis and secretion, and purine metabolism. Further validation of epistatic SNPs and genes identified here in a larger cohort would help to establish a framework for modelling epistatic variance in future methods of genomic prediction that includes epistasis, increasing the accuracy of estimated genetic merit for FE, as well as helping the pig breeding industry.
Data Availability Statement
We have made our genotype data along with metadata publicly available in NCBI-GEO data repository with the accession number: GSE144064 and the link: https://www.ncbi.nlm.nih.gov/geo/query/acc.cgi?acc=GSE144064.
Ethics Statement
The feed efficiency experiment were approved and carried out in accordance with the Ministry of Environment and Food of Denmark, Animal Experiments Inspectorate under the license number (tilladelsesnummer) 2016-15-0201-01123, and C-permit granted to the principal investigator/senior author (HK).
Author Contributions
HK conceived and designed this “FeedOMICS” project, obtained funding as the main applicant. VC and HK designed the blood sampling experiments, phenotype data collection, and biostatistical/bioinformatics analyses. PB and VC carried out biostatistical and bioinformatic data analyses. All authors collaborated in the interpretation of results, discussion, and write up of the manuscript. All authors have read, reviewed, and approved the final manuscript.
Funding
This study was funded by the Independent Research Fund Denmark (DFF) – Technology and Production (FTP) grant (grant number: 4184-00268B).
Conflict of Interest
The authors declare that the research was conducted in the absence of any commercial or financial relationships that could be construed as a potential conflict of interest.
Acknowledgments
VC received partial Ph.D. stipends from the University of Copenhagen and Technical University of Denmark. Authors thank SEGES—Pig Research Centre (VSP) Denmark for access to blood samples and phenotype datasets used in this study. Authors thank all staff who helped in sample collection at the central pig test station at Bøgildgård, Denmark.
Supplementary Material
The Supplementary Material for this article can be found online at: https://www.frontiersin.org/articles/10.3389/fgene.2020.00121/full#supplementary-material
Abbreviations
Chr, Chromosome; DFI, Daily feed intake; DHFE, Duroc high feed efficient; DLFE, Duroc low feed efficient; EDTA, Ethylenediaminetetraacetic acid; FC, Feed consumed; FCR, Feed conversion ratio; FE, Feed efficiency; GWAS, Genome-wide association study; HTG, High throughput data; KEGG, Kyoto Encyclopedia of Genes and Genomes; LD, Linkage disequilibrium; LHFE, Landrace high feed efficient; LLFE, Landrace low feed efficient; pDFI, Predicted daily feed intake; RFI, Residual feed intake; SNP, Single nucleotide polymorphism; TOM, Topological overlap matrix; WGCNA, Weighted gene Co-expression network analysis; WISH, Weighted Interaction SNP hub.
References
Bidanel, J. P. (1993). Estimation of crossbreeding parameters between Large White and Meishan porcine breeds. III. Dominance and epistatic components of heterosis on reproductive traits. Genet. Sel. Evol. 25, 263. doi: 10.1186/1297-9686-25-3-263
Bindea, G., Mlecnik, B., Hackl, H., Charoentong, P., Tosolini, M., Kirilovsky, A., et al. (2009). ClueGO: a cytoscape plug-in to decipher functionally grouped gene ontology and pathway annotation networks. Bioinformatics 25 (8), 1091–1093. doi: 10.1093/bioinformatics/btp101
Bovo, S., Mazzoni, G., Bertolini, F., Schiavo, G., Galimberti, G., Gallo, M., et al. (2019). Genome-wide association studies for 30 haematological and blood clinical-biochemical traits in Large White pigs reveal genomic regions affecting intermediate phenotypes. Sci. Rep. 9 (7003), 1–17. doi: 10.1038/s41598-019-43297-1
Caldwell, K. K., Sosa, M., Buckley, C. T. (2006). Identification of mitogen-activated protein kinase docking sites in enzymes that metabolize phosphatidylinositols and inositol phosphates. Cell Commun. Signal. 4 (2), 1–18. doi: 10.1186/1478-811X-4-2
Carmelo, V. A. O., Kogelman, L. J. A., Madsen, M. B., Kadarmideen, H. N. (2018). WISH-R- a fast and efficient tool for construction of epistatic networks for complex traits and diseases. BMC Bioinf. 19 (277), 1–7. doi: 10.1186/s12859-018-2291-2
Cordell, H. J. (2002). Epistasis: what it means, what it doesn’t mean, and statistical methods to detect it in humans. Hum. Mol. Genet. 11 (20), 2463–2468. doi: 10.1093/hmg/11.20.2463
Crooks, L., Guo, Y. (2017). Consequences of epistasis on growth in an Erhualian × White duroc pig cross. PLoS One 12 (1), e0162045. doi: 10.1371/journal.pone.0162045
Ding, R., Quan, J., Yang, M., Wang, X., Zheng, E., Yang, H., et al. (2017). Genome-wide association analysis reveals genetic loci and candidate genes for feeding behavior and eating efficiency in Duroc boars. PLoS One 12 (8), e0183244. doi: 10.1371/journal.pone.0183244
Ding, R., Yang, M., Wang, X., Quan, J., Zhuang, Z., Zhou, S., et al. (2018). Genetic architecture of feeding behavior and feed efficiency in a Duroc pig population. Front. Genet. 9, 1–11. doi: 10.3389/fgene.2018.00220
Do, D. N., Strathe, A. B., Jensen, J., Mark, T., Kadarmideen, H. N. (2013). Genetic parameters for different measures of feed efficiency and related traits in boars of three pig breeds. J. Anim. Sci. 91, 4069–4079. doi: 10.2527/jas.2012-6197
Durinck, S., Moreau, Y., Kasprzyk, A., Davis, S., De Moor, B., Brazma, A., et al. (2005). BioMart and Bioconductor: a powerful link between biological databases and microarray data analysis. Bioinformatics 21 (16), 3439–3440. doi: 10.1093/bioinformatics/bti525
Durinck, S., Spellman, P. T., Birney, E., Huber, W. (2009). Mapping identifiers for the integration of genomic datasets with the R/Bioconductor package biomaRt. Nat. Protoc. 4 (8), 1184–1191. doi: 10.1038/nprot.2009.97
Duthie, C., Simm, G., Doeschl-Wilson, A., Kalm, E., Knap, P. W., Roehe, R. (2010). Epistatic analysis of carcass characteristics in pigs reveals genomic interactions between quantitative trait loci attributable to additive and dominance genetic effects. J. Anim. Sci. 88 (7), 2219–2234. doi: 10.2527/jas.2009-2266
Duthie, C. A., Simm, G., Doeschl-Wilson, A., Kalm, E., Knap, P. W., Roehe, R. (2011a). Quantitative trait loci for meat quality traits in pigs considering imprinting and epistatic effects. Meat Sci. 87 (4), 394–402. doi: 10.1016/j.meatsci.2010.11.017
Duthie, C., Simm, G., Doeschl-Wilson, A., Kalm, E., Knap, P. W., Roehe, R. (2011b). Epistatic quantitative trait loci affecting chemical body composition and deposition as well as feed intake and feed efficiency throughout the entire growth period of pigs. Livest. Sci. 138, 34–48. doi: 10.1016/j.livsci.2010.11.022
Edea, Z., Kim, K. (2014). A whole genomic scan to detect selection signatures between Berkshire and Korean native pig breeds. J. Anim. Sci. Technol. 56 (23), 1–7. doi: 10.1186/2055-0391-56-23
Eichler, E. E., Flint, J., Gibson, G., Kong, A., Leal, S. M., Moore, J. H., et al. (2010). Missing heritability and strategies for finding the underlying causes of complex disease. Nat. Rev. Genet. 11, 446–450. doi: 10.1038/nrg2809
Estellé, J., Gil, F., Vázquez, J. M., Latorre, R., Ramírez, G., Barragán, M. C., et al. (2008). A quantitative trait locus genome scan for porcine muscle fiber traits reveals overdominance and epistasis. J. Anim. Sci. 86 (12), 3290–3299. doi: 10.2527/jas.2008-1034
Frazer, K. A., Murray, S. S., Schork, N. J., Topol, E. J. (2009). Human genetic variation and its contribution to complex traits. Nat. Rev. Genet. 10, 241–251. doi: 10.1038/nrg2554
Fu, L., Xu, Y., Hou, Y., Qi, X., Zhou, L., Liu, H., et al. (2017). Proteomic analysis indicates that mitochondrial energy metabolism in skeletal muscle tissue is negatively correlated with feed efficiency in pigs. Sci. Rep. 7, 1–8. doi: 10.1038/srep45291
Hashidate-Yoshida, T., Harayama, T., Hishikawa, D., Morimoto, R., Hamano, F., Tokuoka, S. M., et al. (2015). Fatty acyl-chain remodeling by LPCAT3 enriches arachidonate in phospholipid membranes and regulates triglyceride transport. Elife 2015 (4), e06328. doi: 10.7554/eLife.06328
Horodyska, J., Hamill, R. M., Reyer, H., Trakooljul, N., Lawlor, P. G., Mccormack, U. M., et al. (2019). RNA-Seq of Liver From Pigs Divergent in Feed Efficiency Highlights Shifts in Macronutrient Metabolism, Hepatic Growth and Immune Response. Front. Genet. 10, 117. doi: 10.3389/fgene.2019.00117
Jensen, T. B., Baadsgaard, N. P., Houe, H., Toft, N., Østergaard, S. (2007). The effect of lameness treatments and treatments for other health disorders on the weight gain and feed conversion in boars at a Danish test station. Livest. Sci. 112, 34–42. doi: 10.1016/j.livsci.2007.01.153
Kalil, K., Li, L., Hutchins, B. I. (2011). Signaling mechanisms in cortical axon growth, guidance, and branching. Front. Neuroanat. 5, 1–15. doi: 10.3389/fnana.2011.00062
Kasprzyk, A., Tyra, M., Babicz, M. (2015). Fatty acid profile of pork from a local and a commercial breed. Arch. Anim. Breed. 58, 379–385. doi: 10.5194/aab-58-379-2015
Kogelman, L. J. A., Kadarmideen, H. N. (2014). Weighted Interaction SNP Hub (WISH) network method for building genetic networks for complex diseases and traits using whole genome genotype data. BMC Syst. Biol. 8, S5. doi: 10.1186/1752-0509-8-S2-S5
Langfelder, P., Horvath, S. (2008). WGCNA: an R package for weighted correlation network analysis. BMC Bioinf. 9, 559. doi: 10.1186/1471-2105-9-559
Leno-colorado, J., Hudson, N. J., Reverter, A., Pérez-enciso, M. (2017). A pathway-centered analysis of pig domestication and breeding in Eurasia. G3 (Bethesda) 7, 2171–2184. doi: 10.1534/g3.117.042671
Li, P., Fan, W., Everaert, N., Liu, R., Li, Q., Zheng, M. (2018). Messenger RNA sequencing and pathway analysis provide novel insights into the susceptibility to salmonella enteritidis infection in chickens. Front. Genet. 9, 1–10. doi: 10.3389/fgene.2018.00256
Liao, S. F., Wang, T., Regmi, N. (2015). Lysine nutrition in swine and the related monogastric animals: muscle protein biosynthesis and beyond. Springerplus 4, 1–12. doi: 10.1186/s40064-015-0927-5
Liu, H., Sang, S., Lu, Y., Wang, Z., Yu, X., Zhong, C. (2017). Thiamine metabolism is critical for regulating correlated growth of dendrite arbors and neuronal somata. Sci. Rep. 7, 1–12. doi: 10.1038/s41598-017-05476-w
Manolio, T. A., Collins, F. S., Cox, N. J., Goldstein, D. B., Hindorff, L. A., Hunter, D. J., et al. (2009). Finding the missing heritability of complex diseases. Nature 461, 747–753. doi: 10.1038/nature08494
Nguyen, N. H., McPhee, C. P. (2001).Selection for growth rate in pigs on restricted feeding. Genetic parameters and correlated responses in residual feed intake, in: Association for the Advancement of Animal Breeding and Genetics 14th Conference, Queensland, NZ, Queenstown, NZ, 2001. http://era.daf.qld.gov.au/id/eprint/378/1/McPHee_Nguyen_RESIDUAL_FEED_INTAKE_OF_PIG1_sec.pdf.
Noguera, J. L., Rodríguez, C., Varona, L., Tomàs, A., Muñoz, G., Ramírez, O., et al. (2009). A bi-dimensional genome scan for prolificacy traits in pigs shows the existence of multiple epistatic QTL. BMC Genomics 10, 636. doi: 10.1186/1471-2164-10-636
Olivieri, B. F., Mercadante, M. E., Cyrillo, J. N., Branco, R. H., Bonilha, S. F., de Albuqerque, L. G., et al. (2016). Genomic regions associated with feed efficiency indicator traits in an experimental nellore cattle population. PLoS One 11 (10), e0164390. doi: 10.1371/journal.pone.0164390
Osaki, L. H., Gama, P. (2013). MAPKs and signal transduction in the control of gastrointestinal epithelial cell proliferation and differentiation. Int. J. Mol. Sci. 14 (5), 10143–10161. doi: 10.3390/ijms140510143
Ovilo, C., Clop, A., Noguera, J. L., Oliver, M. A., Barragan, C., Rodrıguez, C., et al. (2002). Quantitative trait locus mapping for meat quality traits in an Iberian × Landrace F 2 pig population. J. Anim. Sci. 80 (11), 2801–2808. doi: 10.2527/2002.80112801x
Papp, B., Pál, C. (2011). Systems biology of epistasis: shedding light on genetic interaction network “hubs.” Cell Cycle 10, 3623–3624. doi: 10.4161/cc.10.21.17853
Pavlaki, N., Nikolaev, V. (2018). Imaging of PDE2- and PDE3-Mediated cGMP-to-cAMP Cross-Talk in Cardiomyocytes. J. Cardiovasc. Dev. Dis. 5, 4. doi: 10.3390/jcdd5010004
Pu, L., Zhang, L. C., Zhang, J. S., Song, X., Wang, L. G., Liang, J. (2016). Porcine MAP3K 5 analysis : molecular cloning, characterization, tissue expression pattern, and copy number variations associated with residual feed intake. Genet. Mol. Res. 15, 1–13. doi: 10.4238/gmr.15037998
Purcell, S., Neale, B., Todd-Brown, K., Thomas, L., Ferreira, M. A. R., Bender, D., et al. (2007). PLINK: a tool set for whole-genome association and population-based linkage analyses. Am. J. Hum. Genet. 81, 559–575. doi: 10.1086/519795
Reimand, J., Kull, M., Peterson, H., Hansen, J., Vilo, J. (2007). G:Profiler-a web-based toolset for functional profiling of gene lists from large-scale experiments. Nucleic Acids Res. 35, 193–200. doi: 10.1093/nar/gkm226
Remans, P. H. J., Gringhuis, S. I., van Laar, J. M., Sanders, M. E., Papendrecht-van der Voort, E. A. M., Zwartkruis, F. J. T., et al. (2004). Rap1 signaling Is required for suppression of ras-generated reactive oxygen species and protection against oxidative stress in T Lymphocytes. J. Immunol. 173, 920–931. doi: 10.4049/jimmunol.173.2.920
Reyer, H., Oster, M., Magowan, E., Dannenberger, D., Ponsuksili, S., Wimmers, K. (2017a). Strategies towards improved feed efficiency in pigs comprise molecular shifts in hepatic lipid and carbohydrate metabolism. Int. J. Mol. Sci. 18 (8), 1674. doi: 10.3390/ijms18081674
Reyer, H., Shirali, M., Ponsuksili, S., Murani, E., Varley, P. F., Jensen, J., et al. (2017b). Exploring the genetics of feed efficiency and feeding behaviour traits in a pig line highly selected for performance characteristics. Mol. Genet. Genomics 292, 1001–1011. doi: 10.1007/s00438-017-1325-1
Rodríguez, C., Tomás, A., Alves, E., Ramirez, O., Arqué, M., Muñoz, G., et al. (2005). QTL mapping for teat number in an Iberian-by-Meishan pig intercross. Anim. Genet. 36, 490–496. doi: 10.1111/j.1365-2052.2005.01358.x
Schumacher, M. A., Hedl, M., Abraham, C., Bernard, J. K., Lozano, P. R., Hsieh, J. J., et al. (2017). ErbB4 signaling stimulates pro-inflammatory macrophage apoptosis and limits colonic inflammation. Cell Death Dis. 8, e2622. doi: 10.1038/cddis.2017.42
Schuurbiers, O. C. J., Kaanders, J. H. A. M., Van Der Heijden, H. F. M., Dekhuijzen, R. P. N., Oyen, W. J. G., Bussink, J. (2009). The PI3-K/AKT-pathway and radiation resistance mechanisms in non-small cell lung cancer. J. Thorac. Oncol. 4, 761–767. doi: 10.1097/JTO.0b013e3181a1084f
Serão, N. V., Gonzales, P. D., Beever, J. E., Bollero, G. A., Southey, B. R., Faulkner, D. B., et al. (2013). Bivariate genome-wide association analysis of the growth and intake components of feed efficiency. PLoS One 8 (10), e78530. doi: 10.1371/journal.pone.0078530
Shannon, P., Markiel, A., Ozier, O., Baliga, N. S., Wang, J. T., Ramage, D., et al. (2003). Cytoscape: a software environment for integrated models of biomolecular interaction networks. Genome Res. 13, 2498–2504. doi: 10.1101/gr.1239303
Stefanon, B., Floris, R., Braglia, S., Davoli, R., Fontanesi, L., Olio, S. D., et al. (2004). A new approach in association study of single nucleotide polymorphism of genes for carcass and meat quality traits in commercial pigs. Ital. J. Anim. Sci. 3, 177–189. doi: 10.4081/ijas.2004.177
Suravajhala, P., Kogelman, L. J. A., Kadarmideen, H. N. (2016). Multi-omic data integration and analysis using systems genomics approaches: methods and applications In animal production, health and welfare. Genet. Sel. Evol. 48, 1–14. doi: 10.1186/s12711-016-0217-x
Tang, H. Y., Lin, H. Y., Zhang, S., Davis, F. B., Davis, P. J. (2004). Thyroid hormone causes mitogen-activated protein kinase-dependent phosphorylation of the nuclear estrogen receptor. Endocrinology 145, 3265–3272. doi: 10.1210/en.2004-0308
Tylicki, A., Lotowski, Z., Siemieniuk, M., Ratkiewicz, A. (2018). Thiamine and selected thiamine antivitamins — biological activity and methods of synthesis. Biosci. Rep. 38 (1), 1–23. doi: 10.1042/BSR20171148
Wang, H., Pan, X., Wang, C., Wang, M., Yu, L. (2015). Effects of different dietary concentrate to forage ratio and thiamine supplementation on the rumen fermentation and ruminal bacterial community in dairy cows. Anim. Prod. Sci. 55 (2), 189–193. doi: 10.1071/AN14523
Wang, Y., Ma, C., Sun, Y., Li, Y., Kang, L., Jiang, Y. (2017). Dynamic transcriptome and DNA methylome analyses on longissimus dorsi to identify genes underlying intramuscular fat content in pigs. BMC Genomics 18, 780. doi: 10.1186/s12864-017-4201-9
Wang, Y., Ning, C., Wang, C., Guo, J., Wang, J., Wu, Y. (2019). Genome-wide association study for intramuscular fat content in Chinese Lulai black pigs. Asian-Australas. J. Anim. Sci. 32, 607–613. doi: 10.5713/ajas.18.0483
Wei, H., Zhou, Y., Jiang, S., Huang, F., Peng, J., Jiang, S. (2016). Transcriptional response of porcine skeletal muscle to feeding a linseed-enriched diet to growing pigs. J. Anim. Sci. Biotechnol. 7, 6. doi: 10.1186/s40104-016-0064-1
Yin, J., Han, H., Li, Y., Liu, Z., Zhao, Y., Fang, R., et al. (2017). Lysine restriction affects feed intake and amino acid metabolism via gut microbiome in piglets. Cell. Physiol. Biochem. 44, 1749–1761. doi: 10.1159/000485782
Yu, J. S. L., Cui, W. (2016). Proliferation, survival and metabolism: the role of PI3K/AKT/mTOR signalling in pluripotency and cell fate determination. Development 143, 3050–3060. doi: 10.1242/dev.137075
Zhang, W., Liu, H. T. (2002). MAPK signal pathways in the regulation of cell proliferation in mammalian cells. Cell Res. 12, 9–18. doi: 10.1038/sj.cr.7290105
Keywords: epistasis, WISH, WGCNA, feed efficiency, pigs
Citation: Banerjee P, Carmelo VAO and Kadarmideen HN (2020) Genome-Wide Epistatic Interaction Networks Affecting Feed Efficiency in Duroc and Landrace Pigs. Front. Genet. 11:121. doi: 10.3389/fgene.2020.00121
Received: 14 September 2019; Accepted: 31 January 2020;
Published: 28 February 2020.
Edited by:
Luis Varona, University of Zaragoza, SpainReviewed by:
Roberta Davoli, University of Bologna, ItalyShu-Hong Zhao, Huazhong Agricultural University, China
Copyright © 2020 Banerjee, Carmelo and Kadarmideen. This is an open-access article distributed under the terms of the Creative Commons Attribution License (CC BY). The use, distribution or reproduction in other forums is permitted, provided the original author(s) and the copyright owner(s) are credited and that the original publication in this journal is cited, in accordance with accepted academic practice. No use, distribution or reproduction is permitted which does not comply with these terms.
*Correspondence: Haja N. Kadarmideen, hajak@dtu.dk