 Alexander M. Kulminski*
 Yury Loika
 Jian Huang
 Konstantin G. ArbeevOlivia Bagley
 Svetlana Ukraintseva
 Anatoliy I. YashinIrina Culminskaya
- Biodemography of Aging Research Unit, Social Science Research Institute, Duke University, Durham, NC, United States
Age-related phenotypes are characterized by genetic heterogeneity attributed to an uncertain role of evolution in establishing their molecular mechanisms. Here, we performed univariate and pleiotropic meta-analyses of 24 age-related phenotypes dealing with such evolutionary uncertainty and leveraging longitudinal information. Our analysis identified 237 novel single nucleotide polymorphisms (SNPs) in 199 loci with phenotype-specific (61 SNPs) and pleiotropic (176 SNPs) associations and replicated associations for 160 SNPs in 68 loci in a modest sample of 26,371 individuals from five longitudinal studies. Most pleiotropic associations (65.3%, 115 of 176 SNPs) were impacted by heterogeneity, with the natural-selection—free genetic heterogeneity as its inevitable component. This pleiotropic heterogeneity was dominated (93%, 107 of 115 SNPs) by antagonistic genetic heterogeneity, a phenomenon that is characterized by antagonistic directions of genetic effects for directly correlated phenotypes. Genetic association studies of age-related phenotypes addressing the evolutionary uncertainty in establishing their molecular mechanisms have power to substantially improve the efficiency of the analyses. A dominant form of heterogeneous pleiotropy, antagonistic genetic heterogeneity, provides unprecedented insight into the genetic origin of age-related phenotypes and side effects in medical care that is counter-intuitive in medical genetics but naturally expected when molecular mechanisms of age-related phenotypes are not due to direct evolutionary selection.
Introduction
Large-scale genetic association studies including those called genome-wide association studies (GWAS) are a powerful tool for gaining insight into the genetics of human health span and life span. Historically, such studies were built in the framework of medical genetics, which is best adapted for Mendelian (hereditary) disorders. Major contributors to health span are common diseases (such as cardiovascular disease, stroke, cancer, Alzheimer's disease) occurring in late (i.e., post-reproductive) life and the risk factors that make individuals vulnerable to these diseases, collectively called age-related phenotypes. These are complex phenotypes of non-Mendelian type (Plomin et al., 2009). However, large-scale genetic association studies of such phenotypes utilize the same framework as for Mendelian disorders.
Biologists argue that gaining insight into biological processes requires evolutionary explanations (Dobzhansky, 1973). Because medical genetics historically focused on Mendelian-type hereditary disorders, such disorders are traditionally explained in terms of basic evolutionary forces such as mutation, natural selection, genetic drift, and gene flow. However, the sister discipline of evolutionary biology emphasizes fundamental difficulties in genetics of age-related phenotypes due to an uncertain role of evolution in establishing their molecular mechanisms (Kirkwood et al., 2011; Nesse et al., 2012). This problem is complicated by recent changes in human life expectancy (Oeppen and Vaupel, 2002) and the fitness landscape (Vijg and Suh, 2005; Crespi et al., 2010). Paradoxically, both medical genetics and evolutionary biology developed mostly independently, despite their reliance on the same forms of genomic data.
Evolutionary biology argues that mechanisms of age-related phenotypes are the results of indirect factors (“side-effects”) such as co-evolution with fast-evolving pathogens, mismatch with environments, reproductive success at the expense of health, trade-offs that leave every trait suboptimal, defenses and their special costs (Nesse and Williams, 1994; Nesse et al., 2012). The indirect role of evolution in mechanisms of age-related phenotypes, called in this paper evolutionary uncertainty, is the source of natural-selection–free genetic heterogeneity in predisposition to age-related phenotypes. This is an inevitable source of heterogeneity in the case of age-related phenotypes complementing the traditionally considered sources associated with complexity of phenotypes and their polygenicity. The inherent heterogeneity of age-related phenotypes can explain why the same allele can confer different, even antagonistic, risks to the same phenotype in different populations with the same ancestry (Day-Williams and Zeggini, 2011; Ukraintseva et al., 2016) and may result in complex forms of pleiotropy with seemingly related (Kulminski et al., 2016c, 2017) or unrelated (Goh et al., 2007; Barabasi et al., 2011; Kulminski et al., 2016a) phenotypes. This complexity implies that the role of the same genetic variant in the same phenotype can be naturally modified by the life course (Kulminski et al., 2013, 2017; Ukraintseva et al., 2016) regardless of heritability of such phenotypes because heritability concept for age-related phenotypes is notoriously problematic (Lewontin, 1974; Rose, 2006).
Here, we report the results of univariate and pleiotropic meta-analyses of genetic associations with multiple age-related phenotypes dealing with the evolutionary uncertainty in establishing their molecular mechanisms and leveraging longitudinal information. This approach follows the framework of evolutionary biology, which argues that genetic predisposition to age-related phenotypes is inherently heterogeneous, with the natural-selection–free genetic heterogeneity as its inevitable component. Thus, the key element of this biologically-motivated approach is addressing the inherent heterogeneity in genetic predisposition to such phenotypes. We identified 411 non-proxy single nucleotide polymorphisms (SNPs) (with linkage disequilibrium r2 < 70%) with genome-wide (GW) significance (p < pGW = 5 × 10⁻⁸) in a modest sample of 26,371 Caucasians from five longitudinal studies, including 237 novel SNPs (199 loci), 11 SNPs in the major histocompatibility complex (MHC), and 3 (3 loci) and 160 (68 loci) SNPs with p-values smaller and larger, respectively, in the current study than in previous studies. We show that the evolutionary uncertainty plays a dominant role in the associations with age-related phenotypes. We found that vast majority of pleiotropic associations with age-related phenotypes were affected by antagonistic genetic heterogeneity, a phenomenon not previously routinely recognized, that is characterized by antagonistic directions of genetic effects for directly correlated phenotypes.
Materials and Methods
Study Cohorts
Data were obtained from five longitudinal studies from the Candidate gene Association Resource, Atherosclerosis Risk in Communities (ARIC) study (Investigators, 1989), Cardiovascular Health Study (CHS) (Fried et al., 1991), Coronary Artery Risk Development in Young Adults (CARDIA) study (Hughes et al., 1987), Multi-Ethnic Study of Atherosclerosis (MESA) (Bild et al., 2002), and Framingham Heart Study (FHS) (Cupples et al., 2009). The FHS included three cohorts comprising parental (FHS_C1), offspring (FHS_C2), and grandchildren (FHS_C3) generations. Given this complex design, the FHS cohorts were examined separately.
Phenotypes
The analyses focused on 24 phenotypes (16 quantitative markers, 7 diseases, and death) listed in Table 1. Given the longitudinal design of the studied cohorts, the analyses leveraged repeated measurements of quantitative markers during follow-up and information about the timing of disease onset or death (Supplementary Table 1). These not strongly correlated phenotypes (Supplementary Figure 1) were available in the majority of selected cohorts. All studies collected information on diseases and death in population samples during follow-up.
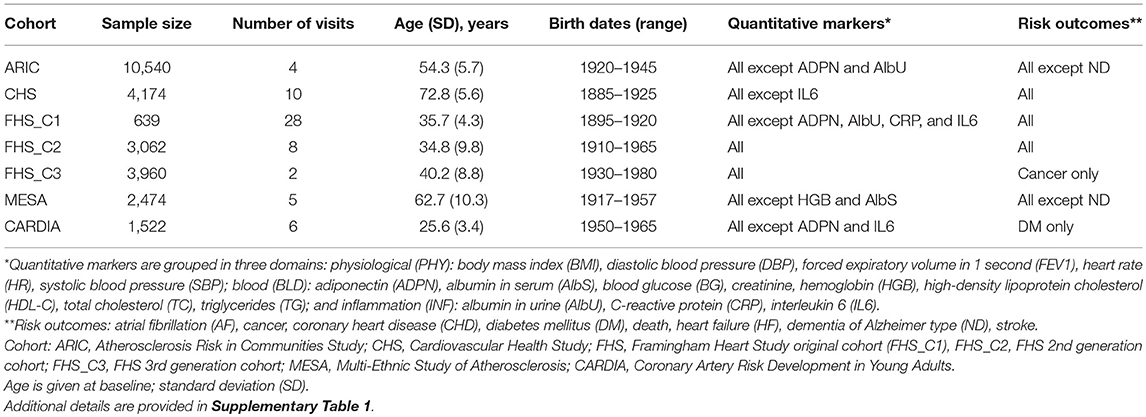
Table 1. Basic characteristics of cohorts included in the analyses.
Genotypes
Genotyping in each study was performed using the same customized Illumina CVDSNP55v1_A chip with approximately 50,000 SNPs from more than 2,000 selected candidate genes. SNPs were included in the analyses after quality control in each study (call rate > 95%, Hardy-Weinberg disequilibrium p > 10−4, minor allele frequency [MAF] > 2%). In case of marginally smaller MAF for prioritized SNPs in a specific cohort compared with the MAF cut-off, these SNPs were used regardless of the MAF cut-off.
Genes and Loci
SNPs were mapped to genes using variant effect predictor from Ensembl and the NCBI SNP database (assembly GRCh38.p7). Because the customized Illumina CVDSNP55v1_A chip was enriched by genes, most SNPs identified in our analyses were within or near protein-coding genes. If an index SNP was not within a protein-coding gene, the closest gene was assigned. Multiple genes were assigned if they were at about the same distance up- and down-stream from the index SNP or if the index SNP was within the region of overlapping genes. Loci were naturally associated with genes.
Analyses were performed in two stages (Figure 1).
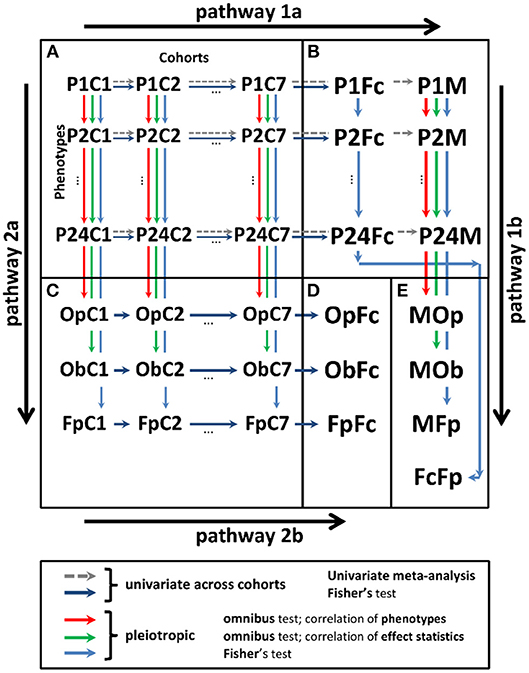
Figure 1. Scheme of univariate and pleiotropic meta-analyses in stage 2. (A) Statistics from stage 1 univariate genetic association study of 24 phenotypes in seven cohorts denoted PiCj, and . (B) Univariate statistics from the meta-analysis across cohorts using the fixed-effects meta-test (PiM) and Fisher test (PiFc). (C) Statistics from the pleiotropic meta-analysis across phenotypes in cohort j for: (i) omnibus tests with correlation matrix for phenotypes (OpCj) and effect statistics (ObCj) and (ii) Fisher test (FpCj). (D) Meta-statistics from Fisher test across cohorts for the results in (C) (OpFc, ObFc, and FpFc). (E) Meta-statistics across phenotypes for the results in (B) from (i) meta-test across cohorts and omnibus test across phenotypes with correlation matrix for phenotypes (MOp), (ii) meta-test across cohorts and omnibus test across phenotypes with correlation matrix for effect statistics (MOb), (iii) meta-test across cohorts and Fisher test across phenotypes (MFp), and (iv) Fisher test across cohorts and Fisher test across phenotypes (FcFp). Pathway 1: meta-analysis combining statistics across cohorts (pathway 1a) and pleiotropic meta-analysis across phenotypes (pathway 1b). Pathway 2: meta-analysis combining statistics across phenotypes (pathway 2a) and cohorts (pathway 2b).
Univariate Genetic Association Study in Stage 1
Genetic association study was performed for each phenotype in each cohort separately. This conventional approach was enhanced by leveraging longitudinal information. For quantitative markers, we used all measurements available during follow-up for the same individuals. Information on longitudinal measurements has multiple advantages including a potential gain in statistical power. To correct for repeated measurements correlations in the analyses of quantitative markers in all studies except the FHS, we used the generalized estimating equation (GEE) model with random effects for repeated measurements (gee package in R used with unstructured correlations). As the FHS included participants from large families, we used the linear mixed effects multilevel model (lme4 package in R) with random effects to correct for familial structure and repeated measurements correlations because the GEE model was not efficient due to memory constraints, particularly for variables with a large number of observations. Given gamma-like frequency distributions of ADPN, AlbU, CRP, and IL6, a GEE model with a gamma function and log-link was used in all studies. We evaluated associations for SNPs using the available measurements of quantitative markers for individuals of a given age at each examination.
Longitudinal information on time to events was implemented in the Cox proportional hazards mixed effects model (coxme package in R) that addressed familial relatedness. In the FHS, we used both prospective and retrospective onsets. The use of retrospective onsets in a failure-type model is justified by Prentice and Breslow (Prentice and Breslow, 1978). These analyses provide estimates of effects in a given population. The time variable in these analyses was the age at onset of an event or at right censoring.
The models were adjusted for: (all studies) age, sex, and the first five principal components; field center (ARIC, CARDIA, CHS, MESA); genotyping stage (CHS); and whether DNA samples had been subject to whole-genome amplification (FHS). Because the GEE model for AlbU with log-link gamma function adjusted for five principal components did not converge for CHS, this adjustment was disregarded in this analysis.
Principal component analysis (PCA) was performed on genotyping data after quality control using the smartpca program from the EIGENSOFT package.
Meta-Analyses in Stage 2
After stage 1, each SNP had a table with association statistics for up to 24 phenotypes in seven cohorts. These statistics were combined along two possible pathways (Figure 1): (i) across studies and then across phenotypes and (ii) across phenotypes and then across studies. These pathways can provide different results because of the inherent heterogeneity in genetic predisposition to age-related phenotypes (see the Significance). To address the impact such heterogeneity, we used four tests in pathway 1 and three tests in pathway 2 (Figure 1).
In pathway 1, univariate (phenotype-specific) meta-analysis combining stage 1 statistics across cohorts (pathway 1a) was performed using the Fisher test and conventional GWAS fixed-effects meta-test. Pleiotropic meta-analysis (pathway 1b) was performed by combining the univariate meta-statistics for the same SNPs across phenotypes. In pathway 1b, we used the Fisher test and two omnibus tests. The latter are traditionally used to address correlations between the effect statistics and phenotypes (details on all tests are below).
In pathway 2, we performed first pleiotropic meta-analysis by combining the stage 1 univariate statistics across phenotypes in each cohort separately (pathway 2a) using the Fisher test and the two omnibus tests as in pathway 1b. Then, we combined these pleiotropic meta-statistics across cohorts using the Fisher test (pathway 2b).
Fixed-Effects Meta-Test
We adopted a conventional GWAS meta-test using a fixed effects model with inverse-variance weighting [METAL software (Willer et al., 2010)]. The combined effect size was estimated as , and the variance of this effect-size was , where is the effect size in the study i and wi is the reciprocal of the variance of .
Fisher Test
The Fisher test (Fisher, 1970) combines p-values assuming that there is no correlation between the tests that generated these p-values. In pathway 1a, this test has the power to reject the “null” hypothesis of no pooled effect regardless of the effect sizes and directions in the cohort-specific statistics. Accordingly, this test can indicate heterogeneity in genetic associations by providing smaller p-values than those from the fixed-effects meta-test. In pathways 1b and 2a, the Fisher test combines p-values across phenotypes assuming that these p-values are from independent associations. This test is often used for pleiotropic meta-analysis of modestly correlated phenotypes (Fortney et al., 2015). Because the Fisher test combines p-values from multiple statistics, it addresses the problem of multiple testing by increasing the number of degrees of freedom.
Omnibus Tests
The Fisher test is based on the assumption of independence of the combined statistics. The statistics for the associations of the same SNPs with different phenotypes may or may not be independent. It is therefore argued that tests penalizing for correlation of such statistics should be used to deflate the Fisher test estimates. A commonly adopted test in this case is an omnibus test (Xu et al., 2003; Bolormaa et al., 2014; Zhu et al., 2015).
Suppose that for a certain SNP we have an estimated effect size and its standard error for the phenotype in the cohort , where Kj is the number of phenotypes in a study j. A general omnibus test statistic can be constructed as , where is a z-score vector of associations of SNPs with phenotypes and Σj is the correlation matrix of the z-scores to be estimated (Xu et al., 2003; Bolormaa et al., 2014). Accordingly, this test takes into account the correlation of the effect statistics for different phenotypes. Under the null hypothesis (βj =0), the test statistic follows a chi-squared distribution with Kj degrees of freedom
from which we obtained a combined p-value pj in the study j.
Correlation matrices Σ can be evaluated from the estimates of the effect statistics for each phenotype for independent SNPs; they are denoted Σ ≡ ΣB. It has been argued that Σ can be also constructed by evaluating correlations between phenotypes (Zhu et al., 2015); these matrices are denoted Σ ≡ ΣP. Correlation matrices were constructed for pathways 1 and 2 (Figure 1) separately. Cohort-specific matrices for pathway 2 were constructed by evaluating correlations of the effect statistics in each cohort using the results from the univariate genetic association study in stage 1 for each phenotype for independent SNPs. For pathway 1, matrix was constructed by evaluating correlations of the effect statistics from the fixed effect meta-test of all cohorts. The phenotype-based cohort-specific matrices for pathway 2, , were constructed using phenotype measurements in each cohort separately by evaluating correlations between vectors defined by person-observations of the selected phenotypes. In the case of no overlapping measurements of quantitative traits, the closest measurements to a given examination were used. Matrix for pathway 1 was constructed using a fixed effect meta-test applied to the correlation statistics of phenotypes in each cohort, which was evaluated using averaged values for quantitative traits measured longitudinally at different visits.
Genetic Heterogeneity
Evolutionary biology argues that genetic predisposition to age-related phenotypes is inherently heterogeneous due to the undefined role of evolution in establishing their molecular mechanisms. This implies that mechanisms driving genetic predisposition to age-related phenotypes and correlations between these phenotypes may have different origins.
Figure 2 illustrates four types of genetic heterogeneity in connections of SNPs with two partly correlated age-related phenotypes P1 and P2. Figures 2A,B illustrate commonly expected heterogeneities (of types 1 and 2) when vectors of the effects β1 and β2 are aligned with projections P1 and P2 of a vector of correlation, or, equivalently, a bivariate vector of the effects is aligned with a vector of correlation. Heterogeneity of type 1 (Figure 2A) refers to the situation when one observes perfect alignment of these vectors in some sub-samples. Although this situation resembles homogeneity, it actually may not be. To prove homogeneity, such perfect alignment should be in any sub-sample of a given sample. Type 2 (Figure 2B) is a commonly expected heterogeneity with a modest deviation from collinearity of the bivariate vector of the effects and the vector of correlation in subsamples and the entire sample. This heterogeneity, however, preserves alignment of these vectors in the same direction. Both types of heterogeneity can indicate shared mechanisms driving correlation between phenotypes and the effect statistics. Thus, either the ΣB or ΣP-based omnibus test can penalize for this correlation, deflating the estimates from the Fisher test. This is evident from the test statistics in the two-dimensional case,
because ẑ1ẑ2Σ21, ẑ1ẑ2Σ12 > 0 in this situation. Penalization of these statistics indicates overlap in the association signals, which is essential for identifying mediated pleiotropy (Solovieff et al., 2013) and, potentially, shared biological mechanisms in genetic predisposition to different phenotypes.
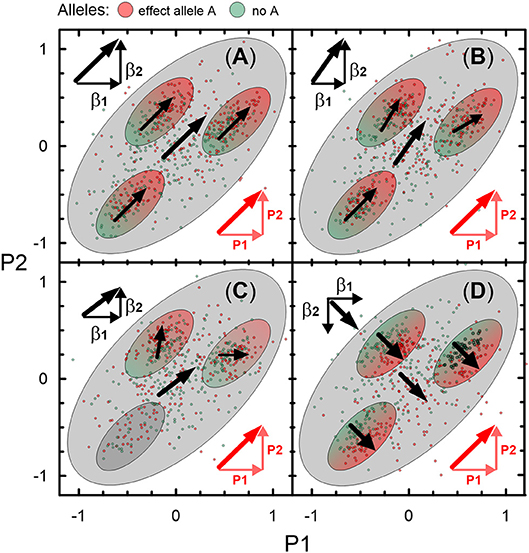
Figure 2. Schematic illustration of 4 types of genetic heterogeneity. Heterogeneity of: (A) type 1, (B) type 2, (C) type 3, and (D) type 4 in the associations with two partly correlated age-related phenotypes P1 and P2. Small dots represent a sample of carriers of an effect allele A (red color) and those who do not carry this allele (no A; green color). Large ellipse shows correlation of P1 and P2 in this sample (r = 0.6). Small ellipses show correlation of P1 and P2 in subsamples of this sample. Red color denotes vector of correlation of P1 and P2 (thick diagonal vector) and its projections on P1 (horizontal) and P2 (vertical). Black vectors β1 and β2 denote the effects in the associations of allele A with P1 and P2. Sum of β1 and β2 represents bivariate vector (thick line) of the effects.
Figure 2C illustrates less commonly expected heterogeneity of type 3 by showing that despite virtually the same alignment as in Figure 2B of the bivariate vector of the effects with the vector of correlation in the entire sample, the mechanisms are different. The difference is that the bivariate vector in Figure 2C is a superposition of virtually independent (orthogonal) bivariate vectors of the effects in subsamples. The subsample-specific bivariate vectors can be strongly misaligned with the vector of the phenotype correlation. Then, the omnibus ΣP-based test will be overly deflated compared to the Fisher and ΣB-based omnibus tests. Type 3 heterogeneity indicates biological pleiotropy due to mechanisms other than those driving correlation between the studied phenotypes.
Figure 2D illustrates heterogeneity of type 4, which is counter-intuitive in medical genetics but naturally expected when molecular mechanisms of age-related phenotypes are not due to direct evolutionary selection. This heterogeneity implies (virtual) orthogonality of the bivariate vector of effects to the vector of the phenotype correlation, which is driven by opposite directions of the effect vector (β2 in this case) for one phenotype and projection of the vector of correlation on this phenotype (P2). Accordingly, this heterogeneity is called antagonistic heterogeneity, implying antagonistic directions of genetic effects for directly correlated phenotypes. In this case, the omnibus test provides smaller p-values than the Fisher test, as can be seen from (1) because ẑ1ẑ2Σ21, ẑ1ẑ2Σ12 < 0 in this case.
Genetic heterogeneity can be further complicated by subsamples with no effects (ellipse with no arrows in Figure 2C) and/or antagonistic effects for the same phenotypes at, e.g., different ages. This complication can make effects in the entire sample seemingly weak despite strong effects in subsamples.
Significance and Novelty
The fixed-effect, Fisher, and two omnibus meta-tests used in our analyses have power to identify associations that are adjusted or unadjusted for correlation and heterogeneity in genetic predisposition to age-related phenotypes. Accordingly, GW level (p = 5 × 10⁻⁸) attained in either of these tests was used as a cut-off for significance for a given SNP. The difference between p-values from these tests for a SNP was used to characterize the impact of correlation and heterogeneity on the association.
SNPs were considered novel if they attained GW significance in: (i) the univariate meta-analysis but were not reported in the GRASP catalog (Leslie et al., 2014) at p ≤ 5 × 10⁻⁸ or (ii) the pleiotropic meta-analysis but not in the pleiotropic analysis of results from GRASP. For univariate meta-analysis, we used evidence for the same (index) SNP in our study and GRASP. If no associations were reported in GRASP for the index SNP, we included SNPs with the smallest p-values within ± 1 Mb flanking region. For pleiotropic meta-analysis, we selected associations from GRASP for the index SNPs with 24 phenotypes used in our analysis (Table 1). Then we performed pleiotropic meta-analysis by applying the Fisher test to these GRASP results to present evidence for pleiotropy in prior studies. We used the Fisher test because the effect sizes were not reported in GRASP. We adopted a conservative approach by not penalizing the Fisher statistics for phenotypes with p-values not reported in GRASP.
Heterogeneity Coefficient
We used METAL software (Willer et al., 2010) to evaluate the heterogeneity coefficient I2. The I2 can be interpreted as the percentage of the total variability in a set of effect sizes due to between-sample variability.
Results
Study Overview
We used 24 weakly to moderately correlated (Supplementary Figure 1) age-related phenotypes (16 markers, seven diseases, and death) available from five longitudinal studies comprising seven cohorts (Table 1). Analyses were performed for 26,371 individuals of Caucasian ancestry, men, and women combined, in two stages using an additive genetic model with minor allele as an effect allele. In stage 1, we performed a genetic association study of each phenotype (one SNP—one phenotype) in each cohort separately (Figure 1A), following the traditional univariate GWAS design. This analysis leveraged longitudinal information from repeated measurements of quantitative markers and the timing of risk outcomes (Table 1 and Supplementary Table 1). The univariate statistics in each cohort for each phenotype (Figure 1A) can be combined via two pathways (Figures 1B–E). The first is the traditional pathway (pathway 1) meta-analyzing the results first across cohorts [as in most GWAS meta-analyses, e.g., (Willer et al., 2013)] and then across phenotypes (Visscher and Yang, 2016). The second pathway leverages the availability of the results from individual studies and, thus, it extends the methods based on the summary statistics (Visscher and Yang, 2016). Accordingly, for pathway 2, we first performed pleiotropic meta-analysis of the results across phenotypes in each cohort and then across cohorts. These analyses addressed the evolutionary uncertainty in establishing molecular mechanisms of age-related phenotypes by performing five meta-tests (Figure 1) (see “Materials and Methods”).
Univariate Meta-Analysis and Heterogeneity
Using a Fisher test and conventional GWAS fixed-effect meta-test (Figure 1, pathway 1a), we identified 61 novel SNPs (see “Materials and Methods”) and 3 SNPs with smaller p-values than previously reported (55 loci; counts of loci exclude the MHC) (Table 2 and Supplementary Table 2). One SNP (rs10160664) was associated with two phenotypes, albumin in urine (AlbU) and C-reactive protein (CRP), at the GW level. Of these 65 GW significant associations (for 64 SNPs), 23 were identified in the fixed-effects meta-test, 11 in the Fisher test, and 31 in both tests. The Fisher test outperformed the meta-test (pFisher < pmeta) for 18 of the 61 novel SNPs (29.5%). All associations were observed for quantitative markers: 52 for AlbU, 6 for total cholesterol (TC), 2 for heart rate (HR), 1 for high-density lipoprotein cholesterol (HDL-C), 1 for interleukin-6 (IL-6), 1 for albumin in serum (AlbS), 1 for adiponectin (ADPN), and 1 for CRP and AlbU. For 3 SNPs, GW significance in the current study was approximately the same as that in previous studies for the index SNPs (rs17645031, rs1784042) or a nearby SNP (rs1879266). The remaining 61 SNPs, or SNPs nearby to them, did not attain pGW in previous studies (Table 2).
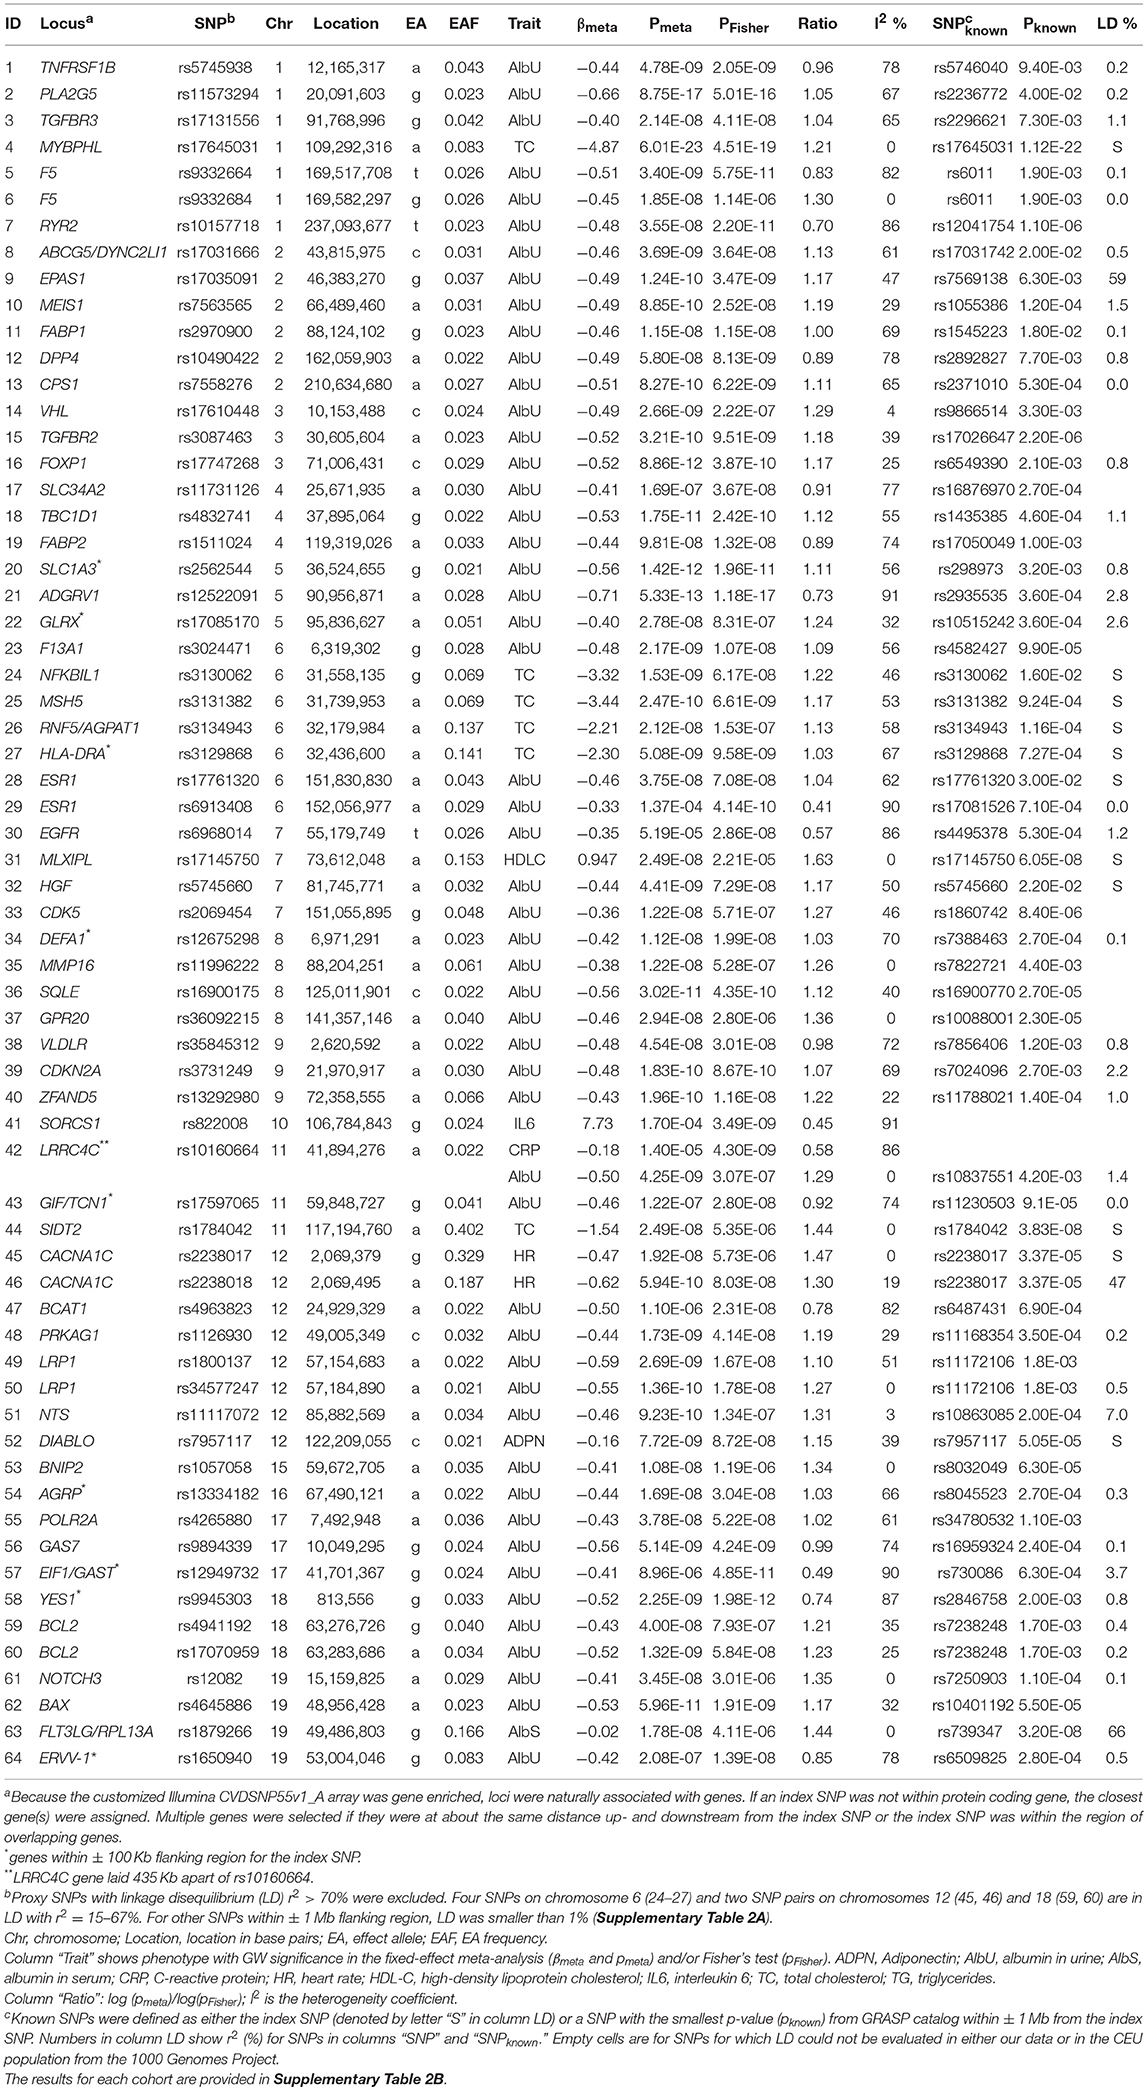
Table 2. Novel SNPs, and SNPs with smaller p-values than previously reported, attained genome-wide significance (p < 5 × 10⁻⁸) in univariate meta-analysis of individual phenotypes.
Out-performance of the meta-test by the Fisher test indicates a substantial role of heterogeneity in associations across cohorts (see “Materials and Methods”). This is evidenced by a strong and highly significant inverse correlation of the ratio of log-transformed p-values from these two tests, log10 (pmeta)/log10 (pFisher), with the heterogeneity coefficient I2 (Table 2; rPearson = −0.874, p = 2.0 × 10⁻²¹). This correlation implies that the larger the pmeta relative to the pFisher, the more heterogeneous the association signals across cohorts. Forest plots in Supplementary Figure 2 illustrate homogeneous and heterogeneous associations for uncommon SNPs associated with AlbU across cohorts.
The univariate meta-analysis replicated 198 associations for 160 SNPs (68 loci) with p < pGW (Supplementary Table 3, Supplementary Material). For most of these SNPs, p-values were smaller for the meta-test than for the Fisher test (pmeta < pFisher) except for rs1260326, rs13333226, and rs2075650. As for the novel SNPs in Table 2, we observed a strong and highly significant inverse correlation of log10 (pmeta)/log10 (pFisher) with I2 (rPearson = −0.603, p = 5.5 × 10⁻²¹). Most of these 198 associations (166 or 83.8%) were observed for lipids.
Univariate Meta-Analysis and Longitudinal Information
Longitudinal information from repeated measurements benefits univariate analyses for SNPs with relatively homogeneous associations across visits by decreasing standard errors (Supplementary Figure 3). For example, rs17645031 attained p = 6.01 × 10⁻²³ in our modest sample (Table 2, SNP #4) and p = 1.12 × 10⁻²² in a previously described sample of 97,063 individuals (Teslovich et al., 2010) (Supplementary Figure 3C). This improvement substantially increases the efficiency of genetic association studies, which can be quantified by the ratio of the log-transformed p-value to the sample size (Kulminski et al., 2016b). For rs17645031, the efficiency can be approximated by the ratio of the sample sizes because the p-values in the different studies are virtually the same, yielding a 3.7-fold (= 97,063/26,371) larger efficiency in our study than in the previous study (Teslovich et al., 2010).
Pleiotropic Meta-Analysis
We used four tests in pathway 1 and three tests in pathway 2 (Figure 1) to examine pleiotropy in six domains: three domains of physiological, blood, and inflammation markers and three domains of all 16 quantitative markers, seven diseases and death, and all 24 phenotypes (Table 1; see “Materials and Methods”). Pleiotropic associations were defined as at least one test showing GW significance.
Our analysis identified 176 novel pleiotropic SNPs (152 loci) with ppleio < pGW (Tables 3, 4 and Supplementary Tables 4, 5) by combining associations with multiple phenotypes that individually did not attain GW significance in univariate meta-analysis (puni > pGW). Accordingly, this analysis identified SNPs for which associations may be considered “noise” in univariate analyses (Supplementary Figure 4). Of these, 79 (75 loci) and 97 (86 loci) SNPs attained GW significance in pathway 1 (Table 3 and Supplementary Table 4) and pathway 2 (Table 4 and Supplementary Table 5), respectively. Table 5 illustrates these associations for selected SNPs. Most SNPs in each pathway showed associations in the domain of 16 quantitative markers: 29 of 79 SNPs (pathway 1) and 77 of 97 SNPs (pathway 2). The remaining SNPs showed associations in the domains of: (i) 24 phenotypes (19 and 12 in pathways 1 and 2, respectively), (ii) inflammation markers (20 and 4), (iii) blood markers (4 and 4), and (iv) physiological markers (7 in pathway 1 only). No associations with p < pGW were identified in the disease/death domain. The 79 SNPs identified in pathway 1 were associated with up to 11 phenotypes at p < 0.05 (Table 3 and Supplementary Table 4), with most associations clustered in the domain of 16 quantitative markers. Figure 3 shows pleiotropic SNPs that attained GW significance in the domains of 16 quantitative markers or 24 phenotypes. Our analysis also identified 11 SNPs in the MHC (Supplementary Table 6).
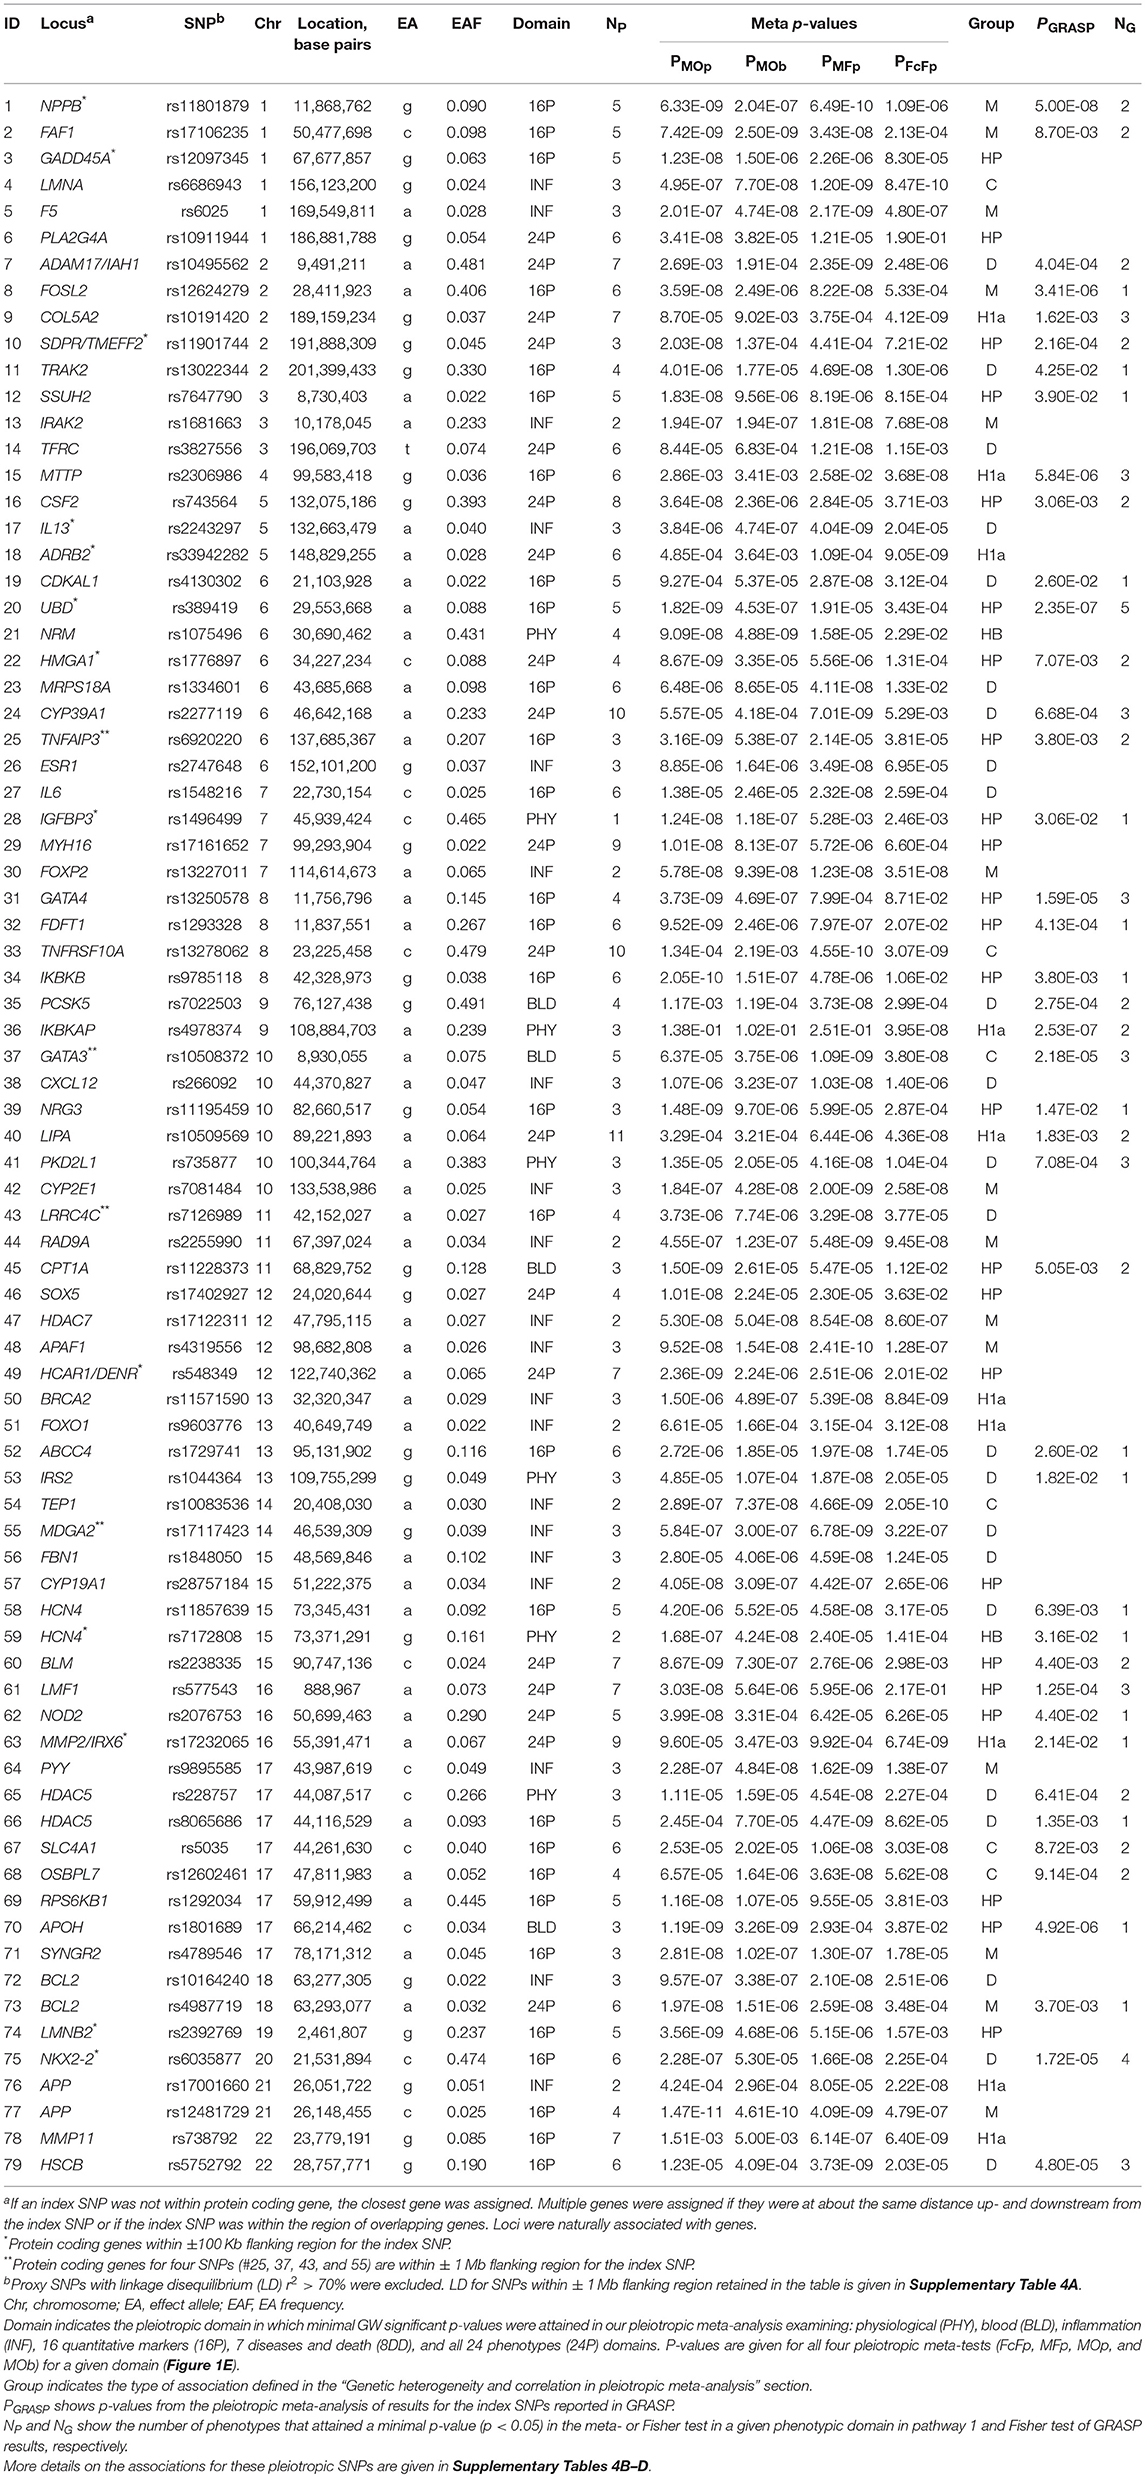
Table 3. Novel pleiotropic SNPs attained genome-wide significance (p < 5 × 10⁻⁸) in pathway 1.
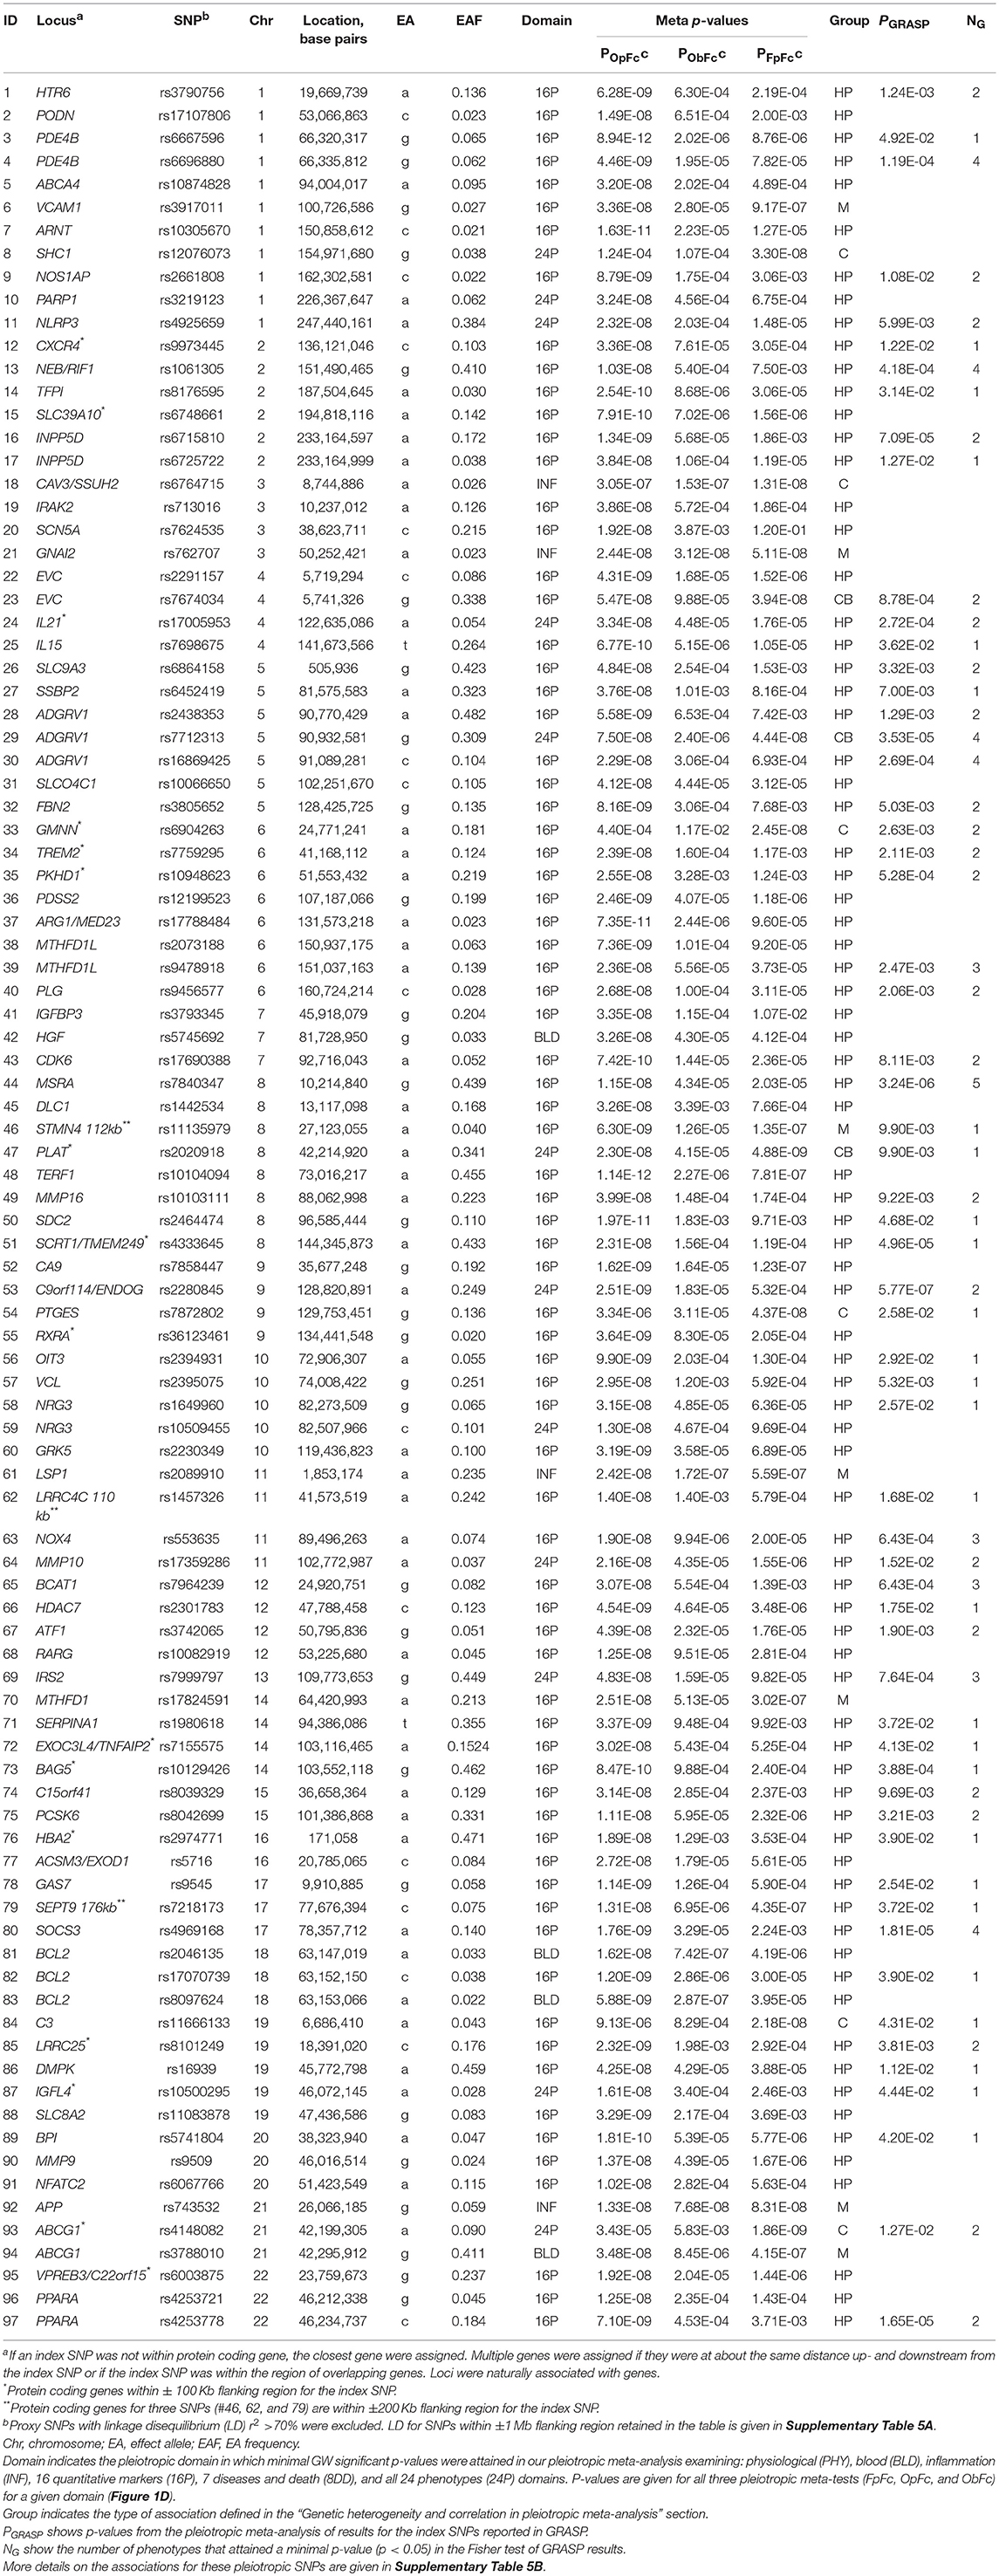
Table 4. Novel pleiotropic SNPs attained genome-wide significance (p < 5 × 10⁻⁸) in pathway 2.
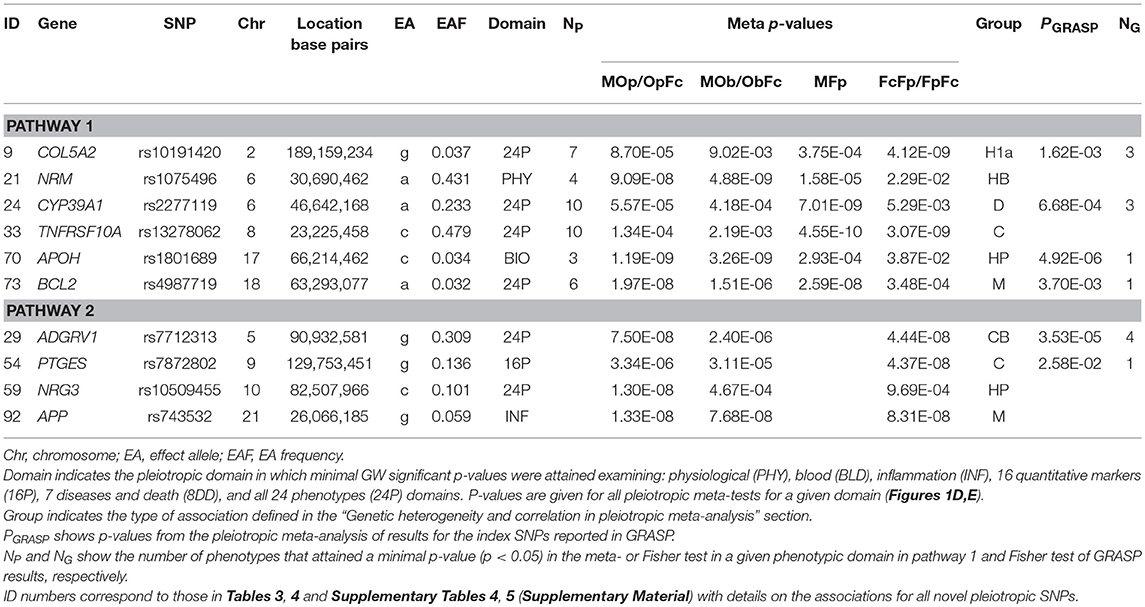
Table 5. Selected novel pleiotropic genome-wide significant SNPs.
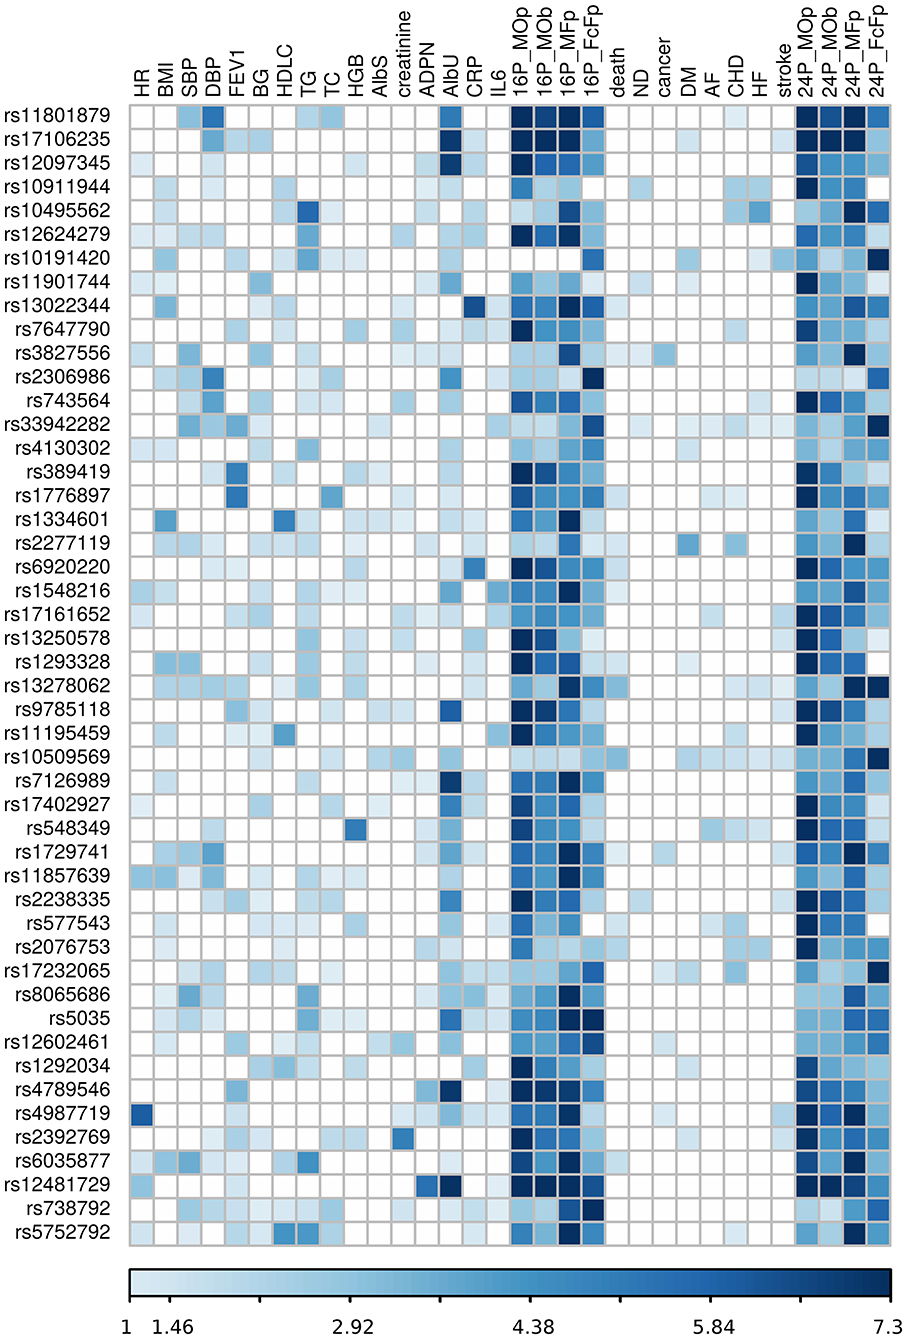
Figure 3. Heat map of phenotype-specific associations for selected pleiotropic SNPs. Data are for SNPs with pleiotropic associations in the domains of 16 quantitative markers (16P) and all 24 phenotypes (24P) from Table 3. Phenotypes are defined in Table 1. FcFp, MFp, MOp, and MOb denote pleiotropic meta-tests (Figure 1). Colors code -log10 (p-value) trimmed at GW level -log10 (5 × 10⁻⁸) = 7.3 for better resolution.
Because ppleio < pGW < puni for pleiotropic SNPs, this inequality automatically validates pleiotropy for 79 SNPs in pathway 1, as it implies that pleiotropic statistics improved to attain ppleio < pGW by pooling contributions from multiple phenotypes with puni > pGW (Supplementary Tables 4B–D). Because combining statistics in pathway 2 may yield ppleio < pGW driven by strong pleiotropy in one cohort only, the set of 97 SNPs did not include SNPs with ppleio < pGW in one cohort that did not attain nominal significance (adjusted for six tests, p > 0.05/6 = 8.3 × 10⁻³) in at least one additional cohort (Supplementary Table 7).
Genetic Heterogeneity and Correlation in Pleiotropic Meta-Analysis
The Fisher test in pathways 1b and 2a (Figure 1) combined p-values across phenotypes assuming that they were from independent associations. Given the evolutionary uncertainty in establishing molecular mechanisms of age-related phenotypes, these associations may or may not be independent, even for correlated phenotypes, because the mechanisms driving genetic associations with these phenotypes and the correlations among them may have different origins (see “Materials and Methods”). Then, differences in p-values from the Fisher and omnibus tests (Figures 1D,E) reflect the impacts of heterogeneity and/or correlation in genetic associations. Below, we characterize these impacts. We used an ad-hoc cut-off for the difference in p-values between these tests of ≥1.5 orders of magnitude to characterize a strong impact.
Our analysis identified conventional and unconventional sets of associations in each pathway. The conventional set, represented by three groups of SNPs in pathways 1 (D, C, and M) and 2 (C, CB, and M) (Table 5), was characterized by associations commonly expected in GWAS. It included 43 SNPs from pathway 1 (Table 3) and 16 SNPs from pathway 2 (Table 4), covering 33.5% (59 of 176) of SNPs. The C (6 SNPs in each pathway) and CB (3 SNPs in pathway 2 only) groups included 15 SNPs with p < pGW in the Fisher-based tests and substantially larger (≥1.5 orders of magnitude) p-values in the omnibus tests (e.g., pFcFp, pMFp < pGW < pMOp, pMOb for pathway 1). Although this is a commonly expected result for correlated phenotypes, indicating a strong impact of correlation between phenotypes and/or association signals, it was relevant to only 8.5% of SNPs. The difference between the C and CB groups is that for the latter group there was a substantial difference between pFpFc and pObFc but not between pFpFc and pOpFc. Group D included 23 SNPs (13.1%) with GW significance attained only in the MFp test (i.e., pMFp < pGW < pFcFp, pMOp, pMOb). This result indicates SNPs with more homogeneous associations in pathway 1a when pmeta is less than or approximately the same as pFisher (Supplementary Tables 4C,D). Group M (14 and 7 SNPs in pathways 1 and 2, respectively) was characterized by attaining GW significance in several tests and/or minor (<1.5 orders of magnitude) differences between p-values in these tests.
The unconventional set, represented by three groups of pleiotropic SNPs in pathway 1 (H1a, HP, and HB) and one group (HP) in pathway 2 (Table 5), was characterized by associations with a strong impact of the evolutionary uncertainty in establishing molecular mechanisms of age-related phenotypes. It included 36 SNPs from pathway 1 (Table 3) and 81 SNPs from pathway 2 (Table 4), covering 66.5% (117 of 176) of SNPs, which defined heterogeneous pleiotropy. The HP group, the most common in each pathway (24 and 81 SNPs in pathways 1 and 2, respectively, covering 59.7% of SNPs), was characterized by attaining GW significance in the ΣP-based omnibus tests (Figure 1) and substantially larger (≥1.5 orders of magnitude) p-values in the Fisher-based tests (e.g., pMOp < pGW < pMFp for pathway 1). The HB group (2 SNPs) resembled the HP group except for having pMOb < pGW instead of pMOp < pGW. These results indicate a strong impact of antagonistic genetic heterogeneity (Figures 2D, 4) characteristic for 107 SNPs (60.8%). Lastly, the H1a group (10 SNPs) was characterized by attaining GW significance in the FcFp test and substantially larger (≥1.5 orders of magnitude) p-values in the other three tests in pathway 1 (i.e., pFcFp < pGW < pMFp, pMOp, pMOb). This result indicates a strong impact of heterogeneity across cohorts because pFisher in this case was typically smaller than pmeta for different phenotypes in pathway 1a (Supplementary Tables 4C,D).
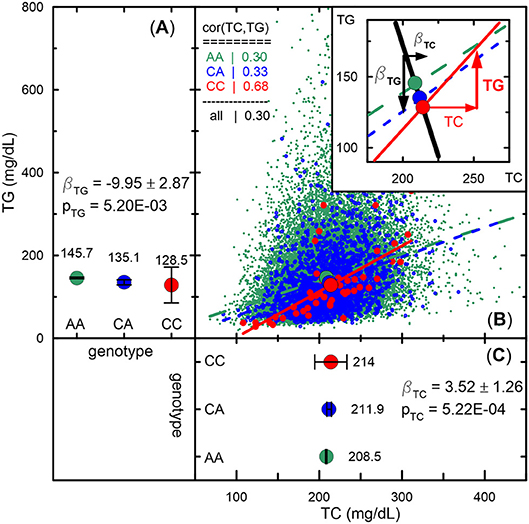
Figure 4. Empirical illustration of antagonistic genetic heterogeneity. (A,C) Mean values and 95% confidence intervals of TG and TC, respectively, for rs1801689 genotypes (green for AA, blue for CA, and red for CC) in the Atherosclerosis Risk in Communities Study measured at baseline. Beta and p denote effect sizes and p-values, respectively. Antagonistic genetic heterogeneity is evidenced by opposite directions of changes in mean values across genotypes for directly correlated phenotypes (i.e., a minor allele associated with a larger concentration of TC is associated with a smaller concentration of TG, whereas a larger concentration of TC correlates [r = 0.68 for CC genotype] with a larger concentration of TG for this allele). (B) Scatter plot of TG vs. TC. The slopes of lines represent correlation coefficients given in the upper left corner inset. The upper right corner inset illustrates antagonistic genetic heterogeneity by showing opposite directions of genetic effect for TG (black line) and projection of the vector of the correlation on TG (red line). See other details in see “Materials and Methods” section and Figure 2.
Pathway 2 provides a natural opportunity to validate the antagonistic heterogeneity for 81 SNPs in different cohorts. Our analysis shows that this heterogeneity, characterized by pOpFc < pFpFc with a difference of ≥0.2 orders of magnitude, was replicated for all SNPs. For 5 SNPs this difference was observed in two cohorts and for the remaining 76 SNPs in three to seven cohorts (Supplementary Table 8).
Biological Pathway and Gene Ontology (GO) Enrichment Analysis
We performed enrichment analyses of biological pathways and toxicity (tox) functions using IPA (www.qiagenbioinformatics.com) and GO biological processes (BPs) using DAVID (Huang da et al., 2009) in two groups of four and two gene sets. The first group included four gene sets: (i) three sets for pleiotropic SNPs from Table 3 (pw1), Table 4 (pw2), and the two tables combined (pw1&2) and (ii) one set for the AlbU-specific SNPs from Table 2. The second group included genes for SNPs from the identified conventional and unconventional sets. The conventional set of 59 SNPs (Tables 3, 4, groups D, C, CB, and M) characterizes associations commonly expected in genetic association studies. The unconventional set of 107 SNPs is characterized by strong impact of antagonistic heterogeneity (Tables 3, 4, groups HP and HB).
The IPA analysis of the first group of four sets identified 41 pathways (Figure 5 and Supplementary Table 9) enriched for genes in at least one set at p < 10−4 (Fisher's exact test). Five pathways, inhibition of matrix metalloproteases, neuroinflammation signaling, hepatic fibrosis/hepatic stellate cell activation, IL-8 signaling, and apoptosis signaling, were consistently enriched for pleiotropic genes from the pw1 and pw2 sets (p < 10−2), with stronger enrichment attained in the combined pw1&2 gene set (p < 10−4) as well as for genes from the AlbU set (p < 10−2). One pathway, docosahexaenoic acid (DHA) signaling, also attained the same cut offs for the significance, although p-value in the combined pw1&2 set was larger than that in the pw1 set. Pooling genes from the pw1 and pw2 sets into the pw1&2 set improved the significance of the enrichment for most biological pathways (25 of 41) in the pw1&2 set. One pathway, differential regulation of cytokine production in macrophages and T helper cells by IL-17A and IL-17F, was enriched (p < 10−4) exclusively in the pw1 set with no genes in the pw2 set. Of 30 pathways enriched in the pw1&2 set at p < 10−4, 15 pathways were either not present (no genes) or did not attain nominal significance (p > 0.05) in the AlbU set.
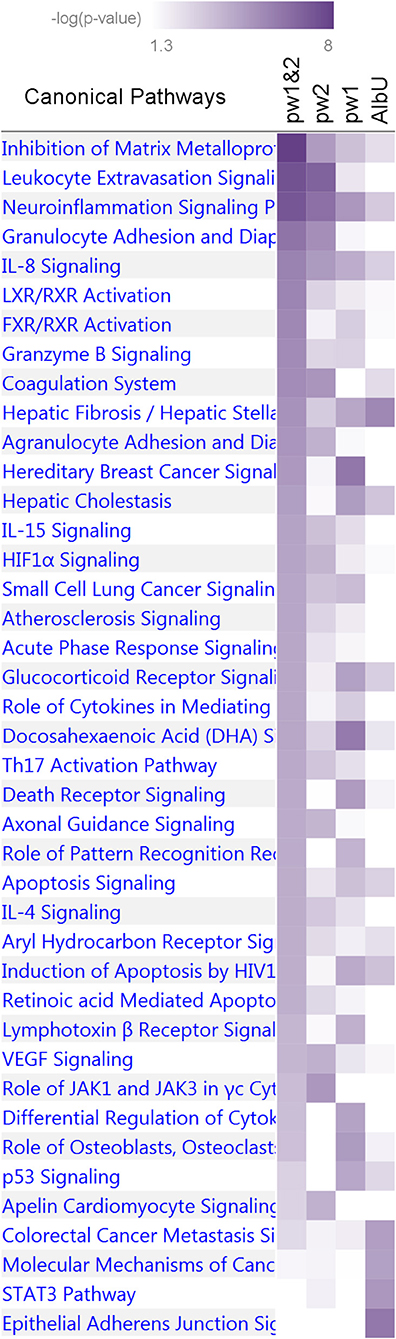
Figure 5. Enrichment of canonical biological pathways in four gene sets. Pw1, pw2, and pw1&2 denote three sets of genes for pleiotropic SNPs from Tables 3, 4 separately and combined, respectively. AlbU denotes the set of genes for SNPs associated with albumin in urine (AlbU) from Table 2. Color coding for –log10 (p-value) is given in the inset. Numerical estimates are given in Supplementary Table 9.
Nine and 10 pathways were enriched at p < 10−4 in the unconventional and conventional sets, respectively (Supplementary Table 10). Two of them, neuroinflammation signaling and IL-8 signaling pathways, attained p < 10−4 in both sets whereas the others predominantly characterized the unconventional or conventional set. Thus, this analysis identified 17 pathways enriched at p < 10−4 in the two sets (Figure 6). Fourteen of these Seventeen pathways were enriched at p < 10−4 in the pw1, pw2, and/or pw1&2 gene sets (Supplementary Table 10). Analysis of the tox functions for these two sets identified 43 terms enriched at p < 10−4 in the conventional (20 terms) and unconventional (27 terms) sets with four terms related to cardiotoxicity attaining p < 10−4 in both sets (enlargement of heart, hypertrophy of heart, arrhythmia, and familial arrhythmia) (Supplementary Table 11). Concurring with the pathway analysis, these terms supported differences in tox functions in the unconventional and conventional sets.
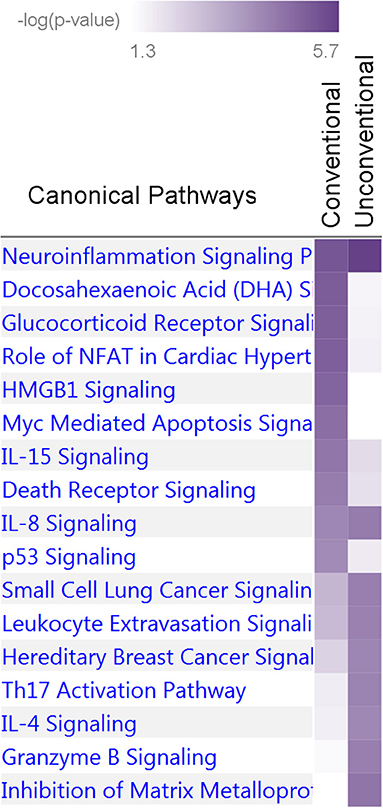
Figure 6. Enrichment of canonical biological pathways in two gene sets. Conventional set includes genes for pleiotropic SNPs from Tables 3, 4, groups D, C, CB, and M. Unconventional set includes genes for pleiotropic SNPs from Tables 3, 4, groups HB and HP. The conventional set characterizes associations commonly expected in genetic association studies whereas the unconventional set highlights a phenomenon characterized by strong impact of antagonistic heterogeneity. Color coding for –log10 (p-value) is given in the inset. Numerical estimates are given in Supplementary Table 10.
The GO analysis identified 8 BPs with enrichment for genes at p < 10−4 (Fisher's exact test) in at least one of the four sets, i.e., pw1, pw2, pw1&2, and unconventional sets; no enrichment at p < 10−4 was observed in AlbU and conventional sets (Supplementary Table 12). These BPs were associated with immune and inflammatory process (e.g., positive regulation of B cell proliferation, platelet degranulation, response to drug, response to hypoxia), extracellular matrix (extracellular matrix disassembly), the coagulation system (platelet degranulation, response to hypoxia), and specific metabolic events (triglyceride metabolic process). BP positive regulation of B cell proliferation showed the most significant enrichment (p = 9.3 × 10⁻⁷) in the pw1&2 set and it was the only pathway enriched at p < 0.01 in all five pleiotropic sets (i.e., excluding AlbU).
Discussion
Despite a modest sample of 26,371 individuals from five longitudinal studies, our comprehensive univariate and pleiotropic meta-analyses identified large number of 237 novel SNPs in 199 loci with phenotype-specific (25.7%) and pleiotropic (74.3%) associations and replicated associations for 160 SNPs in 68 loci. We show that most previously reported SNPs, which were replicated in our univariate meta-analysis (98.1%, 157 of 160 SNPs), exhibited relatively homogeneous associations in the studied cohorts. Consistent with the framework of medical genetics, this result provides evidence that currently prevailing strategies of large-scale GWAS are well adapted to handle homogeneous genetic effects. This result is contrasted by a substantial impact of heterogeneity, with the natural-selection—free genetic heterogeneity as its inevitable component, in a large fraction of the 237 novel SNPs identified in our univariate (18 of 61 SNPs, 29.5%) and pleiotropic (115 of 176 SNPs, 65.3%) meta-analyses. In pleiotropic meta-analysis, this result underscores heterogeneous pleiotropy and its most common type, antagonistic genetic heterogeneity (107 of 115 SNPs, 93%), which is characterized by antagonistic directions of genetic effects for directly correlated phenotypes (Figures 2D, 4). Although antagonistic genetic heterogeneity is counter-intuitive in medical genetics, it is naturally expected when molecular mechanisms of age-related phenotypes are not due to direct evolutionary selection. This heterogeneity also has been reported for alleles from well-known apolipoprotein B gene (Kulminski et al., 2017), which are involved in lipid metabolism. It provides unprecedented insight into the genetic origins of age-related phenotypes and side effects of medical care. Unlike the common role of antagonistic genetic heterogeneity in pleiotropic associations, our results do not support a common role of mediated pleiotropy (Solovieff et al., 2013) (15 of 176 SNPs, 8.5%), which is conventionally assumed for correlated phenotypes, especially in framework of medical genetics (Teslovich et al., 2010).
Most pleiotropic SNPs (137 of 176, 77.8%) attained GW significance in the two largest domains of 16 quantitative markers (60.2%) and 24 phenotypes (17.6%), which supports the hypothesis that genetic associations with multiple age-related phenotypes can be driven by more fundamental mechanisms than those underlying common etiologies of phenotypes (Goh et al., 2007; Franco et al., 2009; Kirkwood et al., 2011; Kulminski et al., 2016a). This idea has been conceptualized in the rapidly developing discipline of geroscience (Kaeberlein et al., 2015; Franceschi and Garagnani, 2016), which is based on observations that age and aging (Guarente, 2011) are among the most important risk factors for geriatric diseases of distinct etiologies. This pleiotropy may provide a basis for improving health care by reducing the burden of a major subset of common diseases (Martin et al., 2007; Sierra et al., 2008). However, the dominant role of antagonistic heterogeneity in pleiotropic associations cautions against simplistic approaches in studies of the genetic origin of multiple age-related phenotypes. Antagonistic heterogeneity emphasizes the importance of personalized medicine (Schork, 2015), which can potentially handle antagonistic risks [due to gene-gene and/or gene-environment interactions (Jazwinski et al., 2010; Ukraintseva et al., 2016)] on an individual basis. Our results suggest that merging geroscience and personalized medicine is highly promising for the efficient translation of discoveries regarding the genetics of age-related phenotypes to health care developments.
The degree of similarity or mismatch of correlation patterns between genetic and phenotypic factors is of enduring interest in the evolutionary genetics as it informs about forces driving development and clustering of phenotypes (Cheverud, 1988). For example, the similarity of the patterns suggests that the same environmental exposures contribute to the genetic and phenotypic variation (Cheverud, 1988) whereas their mismatch indicates that different exposures likely affect them (Hebert et al., 1994). If a study considers phenotypes directly shaped by natural selection (e.g., fitness-related phenotypes), the analysis of the degree of similarity or mismatch leveraging the genetic basis of pleiotropy helps in dissecting pathways leading to organisms' morphological modularity (Cheverud et al., 2004). As the age-related phenotypes are considered not to be directly shaped by natural selection (Nesse and Williams, 1994; Nesse et al., 2012), it is unlikely that this analysis of such phenotypes can help in gaining insights into organisms' morphology. Still, it informs on potential role of the environment. Specifically, co-direction of the genetic associations with phenotypes and correlation between them may indicate the mechanism of biological or mediated pleiotropy (Solovieff et al., 2013) shaped by the same environment. Anti-collinearity of the genetic associations and correlation between phenotypes likely indicates heterogeneity of genetic mechanisms in pleiotropic predisposition to such phenotypes shaped by different environmental exposures. Thus, our finding of extensive effect of antagonistic heterogeneity driven by such anti-collinearity supports a key role of the environment in shaping heterogeneous pleiotropic predisposition to age-related phenotypes.
Our bioinformatics analysis of enrichment of canonical pathways in two groups of four (pw1, pw2, pw1&2, and AlbU) and two (conventional and unconventional) gene sets identified 41 and 17 pathways at p < 10−4. The signature of these two groups was enrichment in the immune/inflammation responses, 14 of 41 (Supplementary Table 9) and 8 of 17 (Supplementary Table 10) pathways, respectively. Of them, two pathways (neuroinflammation signaling and IL-8 signaling) were enriched in all six sets and four (inhibition of matrix metalloproteases, hepatic fibrosis, apoptosis signaling, and docosahexaenoic acid (DHA) signaling) in four sets of the first group (pw1, pw2, pw1&2, and AlbU). Neuroinflammation, an inflammatory response within the central nervous system, is closely associated with neurodegenerative diseases such as the Alzheimer's and Parkinson's diseases (Fulop et al., 2018). Pro-inflammatory cytokine IL-8 plays an important role in pathological aging as it promotes angiogenesis and tumorigenicity (Qazi et al., 2011); it was also linked to cardiovascular disease and neuroinflammation (Apostolakis et al., 2009; Ramesh et al., 2013). Matrix metalloproteases (MMPs), which are extracellular matrix-degrading enzymes, are also involved in the modulation of inflammation and the innate immune system (Sorokin, 2010). MMPs are associated with the development of various age-related diseases including cancer, cardiovascular pathologies, neurological diseases, inflammatory, and fibrotic disorders (Freitas-Rodriguez et al., 2017). Hepatic fibrosis is associated with the expansion of potential cellular sources of extracellular matrix and crosstalk with inflammatory and immune systems (Jiao et al., 2009). Apoptosis occurs naturally as a mechanism of maintaining cell populations in tissues and as a defense against harmful stimuli and pathological processes via the immune response (Strasser et al., 2000). DHA is relevant for brain function especially in the context of neuroinflammation (Hashimoto et al., 2017). The analysis of top GO BPs supported enrichment of pathways related to inflammation and immunity. Specifically, B cells (positive regulation of B cell proliferation) play an important role in regulation of immune responses and inflammation (Bouaziz et al., 2008; Cain et al., 2009). BP extracellular matrix disassembly, tightly linked with MMPs, has a role in physiological and pathological traits (e.g., tissue fibrosis, cancer, cardiovascular disease, arthritis) and in mediating immune responses and tissue inflammation (Sorokin, 2010; Bonnans et al., 2014).
Comparative analysis of enrichment of pathways in the conventional and unconventional sets identified death and stress response as characteristic processes for the conventional set and maintenance of extracellular matrix (ECM) components and tissue homeostasis as those for the unconventional set. The death/stress response is supported by enrichment of genes in three apoptotic signaling pathways, myc mediated apoptosis signaling, death receptor signaling, IL-15 signaling (Figure 6, Supplementary Table 10). In addition, HMGB1 (HMGB1 signaling) codes a proinflammatory cytokine, which is critical to the cell response to stress and is implicated in diseases characterized by cell damages and death (e.g., Alzheimer's disease, stroke, cancer) (Bell et al., 2006). As a response to stress, p53 signaling can activate multiple apoptotic signals (Vousden and Lane, 2007). Glucocorticoids (glucocorticoid receptor signaling) are essential for stress response (Oakley and Cidlowski, 2013). The unconventional-set–specific role of ECM/tissue homeostasis is supported by inhibition of matrix metalloproteases, granzyme B signaling, IL-4 signaling, and Th17 activation pathways. The extracellular proteases, such as the MMPs, are a regulator of extracellular matrix turnover playing a role in tissue development, repair and remodeling (Stamenkovic, 2003). The serine protease granzyme B is implicated in degradation of extracellular matrix proteins, particularly, influencing age-specific impaired wound healing (Hiebert and Granville, 2012; Parkinson et al., 2015). The pleiotropic cytokine IL-4 may promote biogenesis of extracellular matrix proteins in normal wound healing and in pathological fibrosis (Postlethwaite et al., 1992; Salmon-Ehr et al., 2000). The IL-17, the key cytokine produced by Th17 cells, contributes to tissue inflammation associated with extracellular matrix destruction and activates the production and function of matrix metalloproteinases (Miossec and Kolls, 2012). In line, death and cardiotoxicity terms characterize tox functions in the conventional set whereas hepatotoxicity, which includes liver cancers tightly linked with tissue homeostasis, along with cardiotoxicity are characteristic tox functions for the unconventional set.
Thus, the results of our bioinformatics analysis suggest that inflammation and immune responses, which are critical processes in aging (Finch et al., 2010), may play a key role in genetic predisposition to multiple phenotypes, highlighting inflammation and immune responses as promising targets in geroscience and personalized medicine (Franceschi et al., 2018). They also provide first insights into potential biological functions related to tissue homeostasis, which may underline the antagonistic genetic heterogeneity.
In summary, our analysis shows that genetic association studies relying on the rigor of large samples are adapted to handle homogeneous genetic effects. Most genetic associations with complex, age-related traits examined in this study are, however, inherently heterogeneous. Accordingly, large fraction of variance in genetic predisposition to such traits may be missed within the traditional framework. Leveraging more comprehensive analyses adapted to deal with the inherent heterogeneity in genetic predisposition to age-related traits is critical to substantially advance the progress in uncovering genetic architecture of such traits.
Author Contributions
AK conceived and designed the experiment and wrote the paper. YL performed statistical analyses and contributed to drafting of the paper. JH, KA, OB, and SU prepared data. AY contributed to discussion of the intermediate and final results. IC prepared data and performed bioinformatics analysis.
Funding
This research was supported by Grants No P01 AG043352 and R01AG047310 from the National Institute on Aging. The funders had no role in study design, data collection and analysis, decision to publish, or preparation of the manuscript. The content is solely the responsibility of the authors and does not necessarily represent the official views of the National Institutes of Health. This manuscript was prepared using a limited access datasets obtained though dbGaP (accession numbers phs000007.v28.p10, phs000280.v3.p1, phs000209.v13.p3, phs000287.v5.p1, phs000285.v3.p2). See also Acknowledgment Text in Supplementary Data Sheet.
Conflict of Interest Statement
The authors declare that the research was conducted in the absence of any commercial or financial relationships that could be construed as a potential conflict of interest.
Supplementary Material
The Supplementary Material for this article can be found online at: https://www.frontiersin.org/articles/10.3389/fgene.2019.00433/full#supplementary-material
References
Apostolakis, S., Vogiatzi, K., Amanatidou, V., and Spandidos, D. A. (2009). Interleukin 8 and cardiovascular disease. Cardiovasc. Res. 84, 353–360. doi: 10.1093/cvr/cvp241
Barabasi, A. L., Gulbahce, N., and Loscalzo, J. (2011). Network medicine: a network-based approach to human disease. Nat. Rev. Genet. 12, 56–68. doi: 10.1038/nrg2918
Bell, C. W., Jiang, W., Reich, C. F. 3rd, and Pisetsky, D. S. (2006). The extracellular release of HMGB1 during apoptotic cell death. Am. J. Physiol. Cell Physiol. 291, C1318–1325. doi: 10.1152/ajpcell.00616.2005
Bild, D. E., Bluemke, D. A., Burke, G. L., Detrano, R., Diez Roux, A. V., Folsom, A. R., et al. (2002). Multi-ethnic study of atherosclerosis: objectives and design. Am. J. Epidemiol. 156, 871–881. doi: 10.1093/aje/kwf113
Bolormaa, S., Pryce, J. E., Reverter, A., Zhang, Y., Barendse, W., Kemper, K., et al. (2014). A multi-trait, meta-analysis for detecting pleiotropic polymorphisms for stature, fatness and reproduction in beef cattle. PLoS Genet. 10:e1004198. doi: 10.1371/journal.pgen.1004198
Bonnans, C., Chou, J., and Werb, Z. (2014). Remodelling the extracellular matrix in development and disease. Nat. Rev. Mol. Cell Biol. 15, 786–801. doi: 10.1038/nrm3904
Bouaziz, J. D., Yanaba, K., and Tedder, T. F. (2008). Regulatory B cells as inhibitors of immune responses and inflammation. Immunol. Rev. 224, 201–214. doi: 10.1111/j.1600-065X.2008.00661.x
Cain, D., Kondo, M., Chen, H., and Kelsoe, G. (2009). Effects of acute and chronic inflammation on B-cell development and differentiation. J. Invest. Dermatol. 129, 266–277. doi: 10.1038/jid.2008.286
Cheverud, J. M. (1988). A comparison of genetic and phenotypic correlations. Evolution 42, 958–968. doi: 10.1111/j.1558-5646.1988.tb02514.x
Cheverud, J. M., Ehrich, T. H., Vaughn, T. T., Koreishi, S. F., Linsey, R. B., and Pletscher, L. S. (2004). Pleiotropic effects on mandibular morphology II: differential epistasis and genetic variation in morphological integration. J. Exp. Zool. B Mol. Dev. Evol. 302, 424–435. doi: 10.1002/jez.b.21008
Crespi, B., Stead, P., and Elliot, M. (2010). Evolution in health and medicine sackler colloquium: comparative genomics of autism and schizophrenia. Proc Natl Acad Sci U.S.A. 107(Suppl. 1), 1736–1741. doi: 10.1073/pnas.0906080106
Cupples, L. A., Heard-Costa, N., Lee, M., and Atwood, L. D. (2009). Genetics analysis workshop 16 problem 2: the framingham heart study data. BMC Proc. 3(Suppl. 7), S3. doi: 10.1186/1753-6561-3-S7-S3
Day-Williams, A. G., and Zeggini, E. (2011). The effect of next-generation sequencing technology on complex trait research. Eur. J. Clin. Invest. 41, 561–567. doi: 10.1111/j.1365-2362.2010.02437.x
Dobzhansky, T. (1973). Nothing in biology makes sense except in the light of evolution. Am. Biol. Teach. 35, 125–129. doi: 10.2307/4444260
Finch, C. E., Morgan, T. E., Longo, V. D., and de Magalhaes, J. P. (2010). Cell resilience in species life spans: a link to inflammation? Aging Cell 9, 519–526. doi: 10.1111/j.1474-9726.2010.00578.x
Fortney, K., Dobriban, E., Garagnani, P., Pirazzini, C., Monti, D., Mari, D., et al. (2015). Genome-wide scan informed by age-related disease identifies loci for exceptional human longevity. PLoS Genet. 11:e1005728. doi: 10.1371/journal.pgen.1005728
Franceschi, C., and Garagnani, P. (2016). Suggestions from geroscience for the genetics of age-related diseases. PLoS Genet. 12:e1006399. doi: 10.1371/journal.pgen.1006399
Franceschi, C., Garagnani, P., Morsiani, C., Conte, M., Santoro, A., Grignolio, A., et al. (2018). The continuum of aging and age-related diseases: common mechanisms but different rates. Front. Med. 5:61. doi: 10.3389/fmed.2018.00061
Franco, O. H., Karnik, K., Osborne, G., Ordovas, J. M., Catt, M., and van der Ouderaa, F. (2009). Changing course in ageing research: the healthy ageing phenotype. Maturitas 63, 13–19. doi: 10.1016/j.maturitas.2009.02.006
Freitas-Rodriguez, S., Folgueras, A. R., and Lopez-Otin, C. (2017). The role of matrix metalloproteinases in aging: tissue remodeling and beyond. Biochim. Biophys. Acta. 1864, 2015–2025. doi: 10.1016/j.bbamcr.2017.05.007
Fried, L. P., Borhani, N. O., Enright, P., Furberg, C. D., Gardin, J. M., Kronmal, R. A., et al. (1991). The cardiovascular health study: design and rationale. Ann. Epidemiol. 1, 263–276. doi: 10.1016/1047-2797(91)90005-W
Fulop, T., Witkowski, J. M., Bourgade, K., Khalil, A., Zerif, E., Larbi, A., et al. (2018). Can an infection hypothesis explain the beta amyloid hypothesis of Alzheimer's disease? Front. Aging Neurosci. 10:224. doi: 10.3389/fnagi.2018.00224
Goh, K. I., Cusick, M. E., Valle, D., Childs, B., Vidal, M., and Barabasi, A. L. (2007). The human disease network. Proc. Natl. Acad. Sci. U.S.A. 104, 8685–8690. doi: 10.1073/pnas.0701361104
Guarente, L. (2011). Franklin H. Epstein lecture: sirtuins, aging, and medicine. N. Engl. J. Med. 364, 2235–2244. doi: 10.1056/NEJMra1100831
Hashimoto, M., Hossain, S., Al Mamun, A., Matsuzaki, K., and Arai, H. (2017). Docosahexaenoic acid: one molecule diverse functions. Crit. Rev. Biotechnol. 37, 579–597. doi: 10.1080/07388551.2016.1207153
Hebert, D., Faure, S., and Olivieri, I. (1994). Genetic, phenotypic, and environmental correlations in black medic, Medicago lupulina L., grown in three different environments. Theor. Appl. Genet. 88, 604–613. doi: 10.1007/BF01240925
Hiebert, P. R., and Granville, D. J. (2012). Granzyme B in injury, inflammation, and repair. Trends Mol. Med. 18, 732–741. doi: 10.1016/j.molmed.2012.09.009
Huang da, W., Sherman, B. T., and Lempicki, R. A. (2009). Systematic and integrative analysis of large gene lists using DAVID bioinformatics resources. Nat. Protoc. 4, 44–57. doi: 10.1038/nprot.2008.211
Hughes, G. H., Cutter, G., Donahue, R., Friedman, G. D., Hulley, S., Hunkeler, E., et al. (1987). Recruitment in the coronary artery disease risk development in young adults (Cardia) study. Control Clin Trials 8(4 Suppl.), 68S−73S. doi: 10.1016/0197-2456(87)90008-0
Investigators, T. A. (1989). The atherosclerosis risk in communities (Aric) study - design and objectives. Am. J. Epidemiol. 129, 687–702. doi: 10.1093/oxfordjournals.aje.a115184
Jazwinski, S. M., Kim, S., Dai, J., Li, L., Bi, X., Jiang, J. C., et al. (2010). HRAS1 and LASS1 with APOE are associated with human longevity and healthy aging. Aging Cell 9, 698–708. doi: 10.1111/j.1474-9726.2010.00600.x
Jiao, J., Friedman, S. L., and Aloman, C. (2009). Hepatic fibrosis. Curr. Opin. Gastroenterol. 25, 223–229. doi: 10.1097/MOG.0b013e3283279668
Kaeberlein, M., Rabinovitch, P. S., and Martin, G. M. (2015). Healthy aging: the ultimate preventative medicine. Science 350, 1191–1193. doi: 10.1126/science.aad3267
Kirkwood, T. B., Cordell, H. J., and Finch, C. E. (2011). Speed-bumps ahead for the genetics of later-life diseases. Trends Genet. 27, 387–388. doi: 10.1016/j.tig.2011.07.001
Kulminski, A. M., Culminskaya, I., Arbeev, K. G., Ukraintseva, S. V., Stallard, E., Arbeeva, L., et al. (2013). The role of lipid-related genes, aging-related processes, and environment in healthspan. Aging Cell 12, 237–246. doi: 10.1111/acel.12046
Kulminski, A. M., He, L., Culminskaya, I., Loika, Y., Kernogitski, Y., Arbeev, K. G., et al. (2016a). Pleiotropic associations of allelic variants in a 2q22 region with risks of major human diseases and mortality. PLoS Genet. 12:e1006314. doi: 10.1371/journal.pgen.1006314
Kulminski, A. M., Kernogitski, Y., Culminskaya, I., Loika, Y., Arbeev, K. G., Bagley, O., et al. (2017). Uncoupling associations of risk alleles with endophenotypes and phenotypes: insights from the ApoB locus and heart-related traits. Aging Cell 16, 61–72. doi: 10.1111/acel.12526
Kulminski, A. M., Loika, Y., Culminskaya, I., Arbeev, K. G., Ukraintseva, S. V., Stallard, E., et al. (2016b). Explicating heterogeneity of complex traits has strong potential for improving GWAS efficiency. Sci. Rep. 6:35390. doi: 10.1038/srep35390
Kulminski, A. M., Raghavachari, N., Arbeev, K. G., Culminskaya, I., Arbeeva, L., Wu, D., et al. (2016c). Protective role of the apolipoprotein E2 allele in age-related disease traits and survival: evidence from the long life family study. Biogerontology 17, 893–905. doi: 10.1007/s10522-016-9659-3
Leslie, R., O'Donnell, C. J., and Johnson, A. D. (2014). GRASP: analysis of genotype-phenotype results from 1390 genome-wide association studies and corresponding open access database. Bioinformatics 30, 185–194. doi: 10.1093/bioinformatics/btu273
Lewontin, R. C. (1974). Annotation: the analysis of variance and the analysis of causes. Am. J. Hum. Genet. 26, 400–411.
Martin, G. M., Bergman, A., and Barzilai, N. (2007). Genetic determinants of human health span and life span: progress and new opportunities. PLoS Genet. 3:e125. doi: 10.1371/journal.pgen.0030125
Miossec, P., and Kolls, J. K. (2012). Targeting IL-17 and T H 17 cells in chronic inflammation. Nat. Rev. Drug Discovery 11:763. doi: 10.1038/nrd3794
Nesse, R. M., Ganten, D., Gregory, T. R., and Omenn, G. S. (2012). Evolutionary molecular medicine. J. Mol. Med. 90, 509–522. doi: 10.1007/s00109-012-0889-9
Nesse, R. M., and Williams, G. C. (1994). Why We Get Sick: The New Science of Darwinian Medicine. New York, NY: Times Books.
Oakley, R. H., and Cidlowski, J. A. (2013). The biology of the glucocorticoid receptor: new signaling mechanisms in health and disease. J. Allergy Clin. Immunol. 132, 1033–1044. doi: 10.1016/j.jaci.2013.09.007
Oeppen, J., and Vaupel, J. W. (2002). Demography. broken limits to life expectancy. Science 296, 1029–1031. doi: 10.1126/science.1069675
Parkinson, L. G., Toro, A., Zhao, H., Brown, K., Tebbutt, S. J., and Granville, D. J. (2015). Granzyme B mediates both direct and indirect cleavage of extracellular matrix in skin after chronic low-dose ultraviolet light irradiation. Aging Cell 14, 67–77. doi: 10.1111/acel.12298
Plomin, R., Haworth, C. M., and Davis, O. S. (2009). Common disorders are quantitative traits. Nat. Rev. Genet. 10, 872–878. doi: 10.1038/nrg2670
Postlethwaite, A. E., Holness, M. A., Katai, H., and Raghow, R. (1992). Human fibroblasts synthesize elevated levels of extracellular matrix proteins in response to interleukin 4. J. Clin. Invest. 90, 1479–1485. doi: 10.1172/JCI116015
Prentice, R., and Breslow, N. (1978). Retrospective studies and failure time models. Biometrika 65, 153–158. doi: 10.1093/biomet/65.1.153
Qazi, B. S., Tang, K., and Qazi, A. (2011). Recent advances in underlying pathologies provide insight into interleukin-8 expression-mediated inflammation and angiogenesis. Int. J. Inflam. 2011:908468. doi: 10.4061/2011/908468
Ramesh, G., MacLean, A. G., and Philipp, M. T. (2013). Cytokines and chemokines at the crossroads of neuroinflammation, neurodegeneration, and neuropathic pain. Mediators Inflamm. 2013:480739. doi: 10.1155/2013/480739
Rose, S. P. (2006). Commentary: heritability estimates–long past their sell-by date. Int. J. Epidemiol. 35, 525–527. doi: 10.1093/ije/dyl064
Salmon-Ehr, V., Ramont, L., Godeau, G., Birembaut, P., Guenounou, M., Bernard, P., et al. (2000). Implication of interleukin-4 in wound healing. Lab. Invest. 80, 1337–1343. doi: 10.1038/labinvest.3780141
Schork, N. J. (2015). Personalized medicine: time for one-person trials. Nature 520, 609–611. doi: 10.1038/520609a
Sierra, F., Hadley, E., Suzman, R., and Hodes, R. (2008). Prospects for life span extension. Annu. Rev. Med. 60, 457–469. doi: 10.1146/annurev.med.60.061607.220533
Solovieff, N., Cotsapas, C., Lee, P. H., Purcell, S. M., and Smoller, J. W. (2013). Pleiotropy in complex traits: challenges and strategies. Nat. Rev. Genet. 14, 483–495. doi: 10.1038/nrg3461
Sorokin, L. (2010). The impact of the extracellular matrix on inflammation. Nat. Rev. Immunol. 10, 712–723. doi: 10.1038/nri2852
Stamenkovic, I. (2003). Extracellular matrix remodelling: the role of matrix metalloproteinases. J. Pathol. 200, 448–464. doi: 10.1002/path.1400
Strasser, A., O'Connor, L., and Dixit, V. M. (2000). Apoptosis signaling. Annu. Rev. Biochem. 69, 217–245. doi: 10.1146/annurev.biochem.69.1.217
Teslovich, T. M., Musunuru, K., Smith, A. V., Edmondson, A. C., Stylianou, I. M., Koseki, M., et al. (2010). Biological, clinical and population relevance of 95 loci for blood lipids. Nature 466, 707–713. doi: 10.1038/nature09270
Ukraintseva, S., Yashin, A., Arbeev, K., Kulminski, A., Akushevich, I., Wu, D., et al. (2016). Puzzling role of genetic risk factors in human longevity: “risk alleles” as pro-longevity variants. Biogerontology 17, 109–127. doi: 10.1007/s10522-015-9600-1
Vijg, J., and Suh, Y. (2005). Genetics of longevity and aging. Annu. Rev. Med. 56, 193–212. doi: 10.1146/annurev.med.56.082103.104617
Visscher, P. M., and Yang, J. (2016). A plethora of pleiotropy across complex traits. Nat. Genet. 48, 707–708. doi: 10.1038/ng.3604
Vousden, K. H., and Lane, D. P. (2007). p53 in health and disease. Nat. Rev. Mol. Cell Biol. 8, 275–283. doi: 10.1038/nrm2147
Willer, C. J., Li, Y., and Abecasis, G. R. (2010). METAL: fast and efficient meta-analysis of genomewide association scans. Bioinformatics 26, 2190–2191. doi: 10.1093/bioinformatics/btq340
Willer, C. J., Schmidt, E. M., Sengupta, S., Peloso, G. M., Gustafsson, S., Kanoni, S., et al. (2013). Discovery and refinement of loci associated with lipid levels. Nat. Genet. 45, 1274–1283. doi: 10.1038/ng.2797
Xu, X., Tian, L., and Wei, L. J. (2003). Combining dependent tests for linkage or association across multiple phenotypic traits. Biostatistics 4, 223–229. doi: 10.1093/biostatistics/4.2.223
Keywords: genetic association studies, pleiotropy, age-related phenotypes, genetic heterogeneity, aging, health span, life span
Citation: Kulminski AM, Loika Y, Huang J, Arbeev KG, Bagley O, Ukraintseva S, Yashin AI and Culminskaya I (2019) Pleiotropic Meta-Analysis of Age-Related Phenotypes Addressing Evolutionary Uncertainty in Their Molecular Mechanisms. Front. Genet. 10:433. doi: 10.3389/fgene.2019.00433
Received: 13 December 2018; Accepted: 24 April 2019;
Published: 10 May 2019.
Edited by:
Elena G. Pasyukova, Institute of Molecular Genetics (RAS), RussiaReviewed by:
Gil Atzmon, University of Haifa, IsraelDaniel Promislow, University of Washington, United States
Copyright © 2019 Kulminski, Loika, Huang, Arbeev, Bagley, Ukraintseva, Yashin and Culminskaya. This is an open-access article distributed under the terms of the Creative Commons Attribution License (CC BY). The use, distribution or reproduction in other forums is permitted, provided the original author(s) and the copyright owner(s) are credited and that the original publication in this journal is cited, in accordance with accepted academic practice. No use, distribution or reproduction is permitted which does not comply with these terms.
*Correspondence: Alexander M. Kulminski, Alexander.Kulminski@duke.edu