 Elia Vajana1,2*
 Mario Barbato1
 Licia Colli1
 Marco Milanesi1,3,4
 Estelle Rochat2
 Enrico Fabrizi5
 Christopher Mukasa6
 Marcello Del Corvo1
 Charles Masembe7
 Vincent B. Muwanika8
 Fredrick Kabi9
 Tad Stewart Sonstegard10
 Heather Jay Huson11
 Riccardo Negrini1,12 The NextGen Consortium13
 Stéphane Joost2†
 Paolo Ajmone-Marsan1†
- 1Department of Animal Science, Food and Nutrition (DIANA), Biodiversity and Ancient DNA Research Centre (BioDNA), and Proteomics and Nutrigenomics Research Centre (PRONUTRIGEN), Università Cattolica del Sacro Cuore, Piacenza, Italy
- 2Laboratory of Geographic Information Systems (LASIG), School of Architecture, Civil and Environmental Engineering (ENAC), École Polytechnique Fédérale de Lausanne (EPFL), Lausanne, Switzerland
- 3Department of Support, Production and Animal Health, School of Veterinary Medicine, São Paulo State University, Araçatuba, Brazil
- 4International Atomic Energy Agency (IAEA), Collaborating Centre on Animal Genomics and Bioinformatics, Araçatuba, Brazil
- 5Department of Economics and Social Sciences, Università Cattolica del Sacro Cuore, Piacenza, Italy
- 6National Animal Genetic Resource Centre and Data Bank, Entebbe, Uganda
- 7Department of Zoology, Entomology and Fisheries, Makerere University, Kampala, Uganda
- 8Department of Environmental Management, Makerere University, Kampala, Uganda
- 9National Livestock Resources Research Institute (NaLIRRI), National Agricultural Research Organisation, Tororo, Uganda
- 10Recombinetics, Inc., St. Paul, MN, United States
- 11Department of Animal Science, Cornell University, Ithaca, NY, United States
- 12Associazione Italiana Allevatori (AIA), Rome, Italy
- 13http://nextgen.epfl.ch/consortium
East Coast fever (ECF) is a fatal sickness affecting cattle populations of eastern, central, and southern Africa. The disease is transmitted by the tick Rhipicephalus appendiculatus, and caused by the protozoan Theileria parva parva, which invades host lymphocytes and promotes their clonal expansion. Importantly, indigenous cattle show tolerance to infection in ECF-endemically stable areas. Here, the putative genetic bases underlying ECF-tolerance were investigated using molecular data and epidemiological information from 823 indigenous cattle from Uganda. Vector distribution and host infection risk were estimated over the study area and subsequently tested as triggers of local adaptation by means of landscape genomics analysis. We identified 41 and seven candidate adaptive loci for tick resistance and infection tolerance, respectively. Among the genes associated with the candidate adaptive loci are PRKG1 and SLA2. PRKG1 was already described as associated with tick resistance in indigenous South African cattle, due to its role into inflammatory response. SLA2 is part of the regulatory pathways involved into lymphocytes' proliferation. Additionally, local ancestry analysis suggested the zebuine origin of the genomic region candidate for tick resistance.
Introduction
East Coast fever (ECF) is an endemic vector-borne disease affecting the species Bos taurus in eastern and central Africa. ECF etiological agent is the emo-parasite protozoan Theileria parva Theiler, 1904, vectored by the hard-bodied tick vector Rhipicephalus appendiculatus Neumann, 1901. The disease is reported to cause high morbidity and mortality in susceptible indigenous populations coming from outside endemic areas and among exotic breeds, thus undermining the livestock sector development in the affected countries (Norval et al., 1992; Olwoch et al., 2008; Muhanguzi et al., 2014).
Cape buffalo (Syncerus caffer Sparrman, 1779) is T. parva native host, being its wild and asymptomatic reservoir (Oura et al., 2011). The primordial contact between buffalo-derived T. parva and domestic bovines probably occurred ~4500 years before present (YBP), following B. taurus migration into T. parva areal (Epstein, 1971). However, it is hard to define if the host jump affected taurine- or indicine-like B. taurus first, since no consensus can easily be reached to define who among the subspecies B. t. taurus and B. t. indicus was present in East Africa at that time (Freeman, 2006; Hiendleder et al., 2008; Decker et al., 2014; Magee et al., 2014; Mwai et al., 2015). In particular, African taurine migration might have occurred sometime between ~8,000 and 1,500 YBP (Magee et al., 2014; Mwai et al., 2015), and the most ancient zebuine colonization wave is estimated to have occurred between ~4,000 and 2,000 YBP from the Asian continent, as suggested by the first certain archaeological record dated 1,750 YBP (Freeman, 2006). Once T. parva spread to domestic populations, coevolution between the parasite and the new hosts likely led to the divergence between buffalo- (T. p. lawracei) and cattle-specific (T. p. parva) parasite strains (Hayashida et al., 2013; Sivakumar et al., 2014), and to the appearance of indigenous herds able to survive and recover from infection (Kabi et al., 2014; Bahbahani and Hanotte, 2015).
Most likely, such populations appeared (and still inhabit) areas where environmental conditions guaranteed the constant coexistence between vector, parasite, and domestic host. Such a combination, together with the evolution of some sort of resistance and/or tolerance (i.e., the capacity of reducing parasite burden or attenuating the symptoms caused by a given parasite burden, respectively), plausibly prompted the establishment of an epidemiological state referred to as endemic stability, a condition where hosts become parasite reservoirs while showing negligible clinical symptoms (Kivaria et al., 2004; Råberg et al., 2007; Gachohi et al., 2012; Laisser et al., 2017). However, to our knowledge no clear indication has been provided for a genetic control prompting survival and recovery from ECF (Bahbahani and Hanotte, 2015), although previous research identified the role of host genetics on both tolerance and resistance strategies in animals (Råberg et al., 2007), as in the case of B. taurus resistance to tropical theileriosis (Glass and Jensen, 2007; Chaussepied et al., 2010) and tick burden (Kim et al., 2017). Furthermore, the identification of adaptive variation responsible for survival to ECF would undoubtedly represent a sensible step forward toward sustainability and productivity of local agroecosystems.
Here, we explicitly test the hypothesis that indigenous host populations living in ECF-endemically stable areas are locally adapted to ECF burden, and investigate for selection signatures involved with ECF-tolerance/resistance. In particular, local adaptation is known to be promoted by spatially varying (i.e., divergent) natural selection (Kawecki and Ebert, 2004), leading a population at its native site to present higher fitness “than any other population introduced to that site” (Savolainen et al., 2013). Such conditions appear to be met in East Africa, where R. appendiculatus distribution is reported to be wide but patchy (implying a spatially heterogeneous ECF burden on local host populations; Olwoch et al., 2003, 2008), B. taurus presence is long-standing and its distribution wide (Robinson et al., 2014), and the introduction of allochthonous B. taurus populations into ECF-endemic areas proved unsuccessful, with mortality rates ranging 40–100% (Rubaire-Akiiki et al., 2006; Olwoch et al., 2008; Gachohi et al., 2012).
By testing for significant associations between environmental and genetic features of individuals (or populations) at their sampling sites, landscape genomics aims to detect the environmental drivers of divergent selection triggering adaptive variation (Rellstab et al., 2015). Here, we relied on a landscape genomics approach to search for signatures of local adaptation in the genomes of indigenous B. taurus populations from Uganda, where the concomitant occurrence of endemically stable areas in the South-West and in the East of the country (Kivaria et al., 2004; Rubaire-Akiiki et al., 2006), spatially varying selection due to regional climatic differences (Kabi et al., 2014), and host populations connected by high rates of gene flow (Kawecki and Ebert, 2004; Stucki et al., 2017) is likely to have promoted local adaptation to the disease even over short time scales, i.e., from thousands of years to few decades (Stockwell et al., 2003; Crispo et al., 2010; Fraser et al., 2011).
Since endemic areas are currently inhabited by indigenous B. t. indicus and the B. t. indicus x African B. t. taurus crosses sanga and zenga (Hanotte et al., 2002; Mwai et al., 2015), two main hypotheses can be associated with the origin of local adaptation to ECF: (i) at first adaptation appeared in local African B. t. taurus populations and was then introgressed into zebu and derived sanga and zenga crossbreds; alternatively, (ii) it appeared in B. t. indicus, and then either evolved independently in zebuine populations of eastern Africa, or was imported from the Indian continent, where similar selective pressures are recorded (Singh et al., 1993; Boulter and Hall, 1999).
To search for ECF-specific signatures of selection, we first modelled R. appendiculatus potential distribution and T. p. parva infection risk in Uganda to define the spatially varying selective pressure over the host genomes, and then used this information to search for single-nucleotide polymorphisms (SNPs) potentially involved into local adaptation to ECF through genotype-environment association analysis. Subsequently, we annotated candidate genes, and studied the ancestral origin of the identified candidate genomic regions by means of local ancestry analysis to shed light on the possible evolutionary origins of local adaptation.
Materials and Methods
Ecological Modelling
R. appendiculatus occurrence probability (ψR) and T. p. parva infection risk in cattle (γ) were modelled and used as environmental predictors into landscape genomics models. Geographical variability in both ψR and γ was assumed to describe the spatially heterogeneous selective pressure on cattle genomes. Further, S. caffer occurrence probability (ψS) was estimated and used in combination with ψR to model γ, as the geographical proximity between Cape buffaloes and cattle herds constitutes a factor for explaining ECF incidence. The following three sections will describe data and methods used to estimate ψR, ψS, and γ.
Raster Data
Bioclimatic variables (BIO) referring to the time span between 1960 and 1990 were collected from the WorldClim database (v.1.4. release3) (Hijmans et al., 2005) at a spatial resolution of 30 arc-seconds and in the un-projected latitude/longitude coordinate reference system (WGS84 datum). Altitude information was collected from the SRTM 90 m Digital Elevation Database (v.4.1) (Jarvis et al., 2008), which provides tiles covering Earth's land surface in the WGS84 datum, at 90 m resolution at the equator. Altitude was used to compute terrain slope through the function terrain implemented in the R package raster (Hijmans, 2016). The 10-year (2001–2010) averaged Normalized Difference Vegetation Index (NDVI) was derived for 72 ten-day annual periods from the “eMODIS products” (Supplementary Text 1) (US Geological Survey1), in the WGS84 datum, and at a resolution of 250 m at the equator. A raster file describing cattle density (number of animals/km2) was acquired from the Livestock Geo-Wiki database (Robinson et al., 2014), in the WGS84 datum, at a resolution of 1 km2 at the equator. A raster file describing each pixel distance from the nearest water source was obtained with the function distance within the R package raster. The “Land and Water Area” dataset from the Gridded Population of the World collection (GPV v.4) (CIESIN, 2016) was used to define water bodies in Uganda at a resolution of 30 arc-seconds with WGS84 datum.
All raster files were transposed into Africa Albers Equal Area Conic projection to guarantee a constant pixel size and meet the main assumption of the statistical technique used to model ψR and ψS, i.e., that each pixel presents the same probability to be randomly sampled in order to detect the species occurrence (Merow and Silander, 2014). Raster files were standardised to the same resolution (~0.85 km2), origin, and extent. To avoid the inclusion of potentially misleading background locations while characterizing the occurrence probability of terrestrial species, inland water surfaces were masked prior to ψR and ψS estimation (Barve et al., 2011). Quantum GIS (v.2.16.2) (QGIS Development Team, 2016) and the R package raster were used for raster files manipulation.
Species Distribution Models
The R package Maxlike (Royle et al., 2012) was used to model ψR and ψS over Uganda. Maxlike is able to estimate species occurrence probability (ψ) from presence-only data, by maximizing the likelihood of occurrences under the logit-linear model (Merow and Silander, 2014):
where ψx denotes the species occurrence probability in the x pixel of the landscape, β0 the model intercept (i.e., the expected prevalence across the study area), β the vector of slope parameters, and z(x) the vector of environmental variables for x. Occurrence probability in x is derived from the inverse logit:
Fifty-one and 61 spatial records of R. appendiculatus and S. caffer (Figures 1A,B) were obtained from a tick occurrence database previously collected (Cumming, 1999b), and the Global Biodiversity Information Facility (GBIF, 2012), respectively.
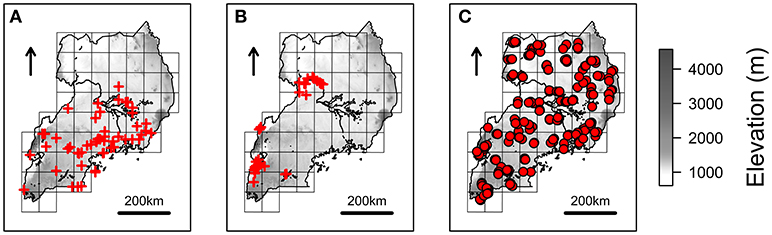
Figure 1. Species occurrences and NextGen sampling scheme. Red crosses represents the spatial records used to estimate Rhipicephalus appendiculatus (A) and Syncerus caffer (B) distributions over Uganda, as derived from Cumming (1999b) and GBIF (2012), respectively. Farms where cattle have been sampled to be genotyped and tested for Theileria parva parva infection are represented with red circles (C). The grid scheme used to sample farms during the NextGen project is shown on the background of each map (see main text), together with elevation.
The most relevant environmental variables affecting tick and Cape buffalo distributions were identified from the literature. Specifically, the BIO variables representing temperature/precipitation interaction in the most extreme periods of the year were used to model R. appendiculatus occurrence (Table 1 and Supplementary Figure 1) (Cumming, 1999a, 2002), while altitude, terrain slope, NDVI, distance to water sources (Wd), and annual precipitation (BIO12) were used to model the Cape buffalo distribution (Pettorelli et al., 2011; Matawa et al., 2012; Naidoo et al., 2012). A Maxlike regression analysis was applied to individuate the NDVI values best predicting the available S. caffer occurrences, and the period April 6–15 was retained for subsequent analyses (Supplementary Figure 2). No variable depicting the top-down regulatory effect of predators on buffalo populations was considered, as bottom-up ecological mechanisms (like quantity and quality of food resources) are argued to play the main role in determining large herbivores distribution (Winnie et al., 2008).
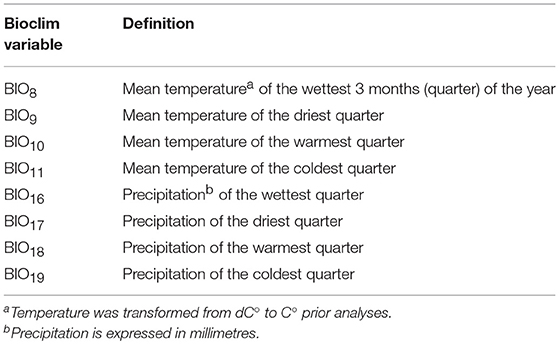
Table 1. Predictors used to model Rhipicephalus appendiculatus distribution.
Collinearity was checked prior to analyses by computing pairwise absolute correlations (|r|) between variables, which were considered collinear when |r| exceeded the suggested threshold of 0.7 (Dormann et al., 2013). High collinearity was found among BIO variables, which were then subjected to principal components analysis (PCA) to obtain orthogonal predictors for ψR.
Obtained components were tested into univariate and multivariate R. appendiculatus distribution models. Particularly, components explaining up to 95% of the original variance (Jolliffe, 2002) were individuated and tested with different combinations into multivariate models, leading to a total of 12 candidate R. appendiculatus distribution models. Conversely, all the combinations of environmental variables were tested into univariate up to penta-variate Cape buffalo distribution models, resulting in a total of 31 candidate models for predicting S. caffer potential distribution.
In both cases, Bayesian Information Criterion (BIC) was used to select the best models (Aho et al., 2014). Bring's standardization (Bring, 1994; Cade, 2015) was applied on predictors before parameters' estimate, and the delta method was implemented to compute the 95% confidence intervals around the fitted ψRx and ψSx.
Infection Risk Model
In the context of the European Project NextGen2, 587 blood samples from Ugandan indigenous B. taurus were tested for the presence/absence of T. p. parva p104 antigen DNA sequence (Kabi et al., 2014). Samples were collected and georeferenced in correspondence of 203 farms distributed over a grid of 51 cells covering the whole Uganda, with an average of 12 (±4 s.d.) animals/cell, and three (±1 s.d.) animals/farm (Figure 1C).
ECF epidemiology is complex and determined by both biotic and abiotic factors (Norval et al., 1992). Particularly, R. appendiculatus occurrence (ψR) (Magona et al., 2008, 2011; Gachohi et al., 2011; Muhanguzi et al., 2014), cattle density (Cd) (Billiouw et al., 2002; Olwoch et al., 2008), potential proximity with S. caffer (ψS) and the maximal temperature in the warmest month of the year (BIO5) were considered to predict γ. BIO5 was used to account for the possible limiting effect of high temperatures on the parasite development into the tick (Young and Leitch, 1981). Predictors' values were obtained at the geographical position of each animal (i.e., at farm locations), checked for the presence of collinearity (as done for the species distribution models) and outliers (Supplementary Figure 3), and subsequently standardized following Bring's procedure prior to parameters' estimation.
Infection risk for any i-th animal was modelled using a binary mixed-effects logistic regression, where ψR, BIO5, Cd, and ψS were specified as fixed effects, and random intercepts were estimated for each farm to account for the possible influence of local environmental conditions and management practices (e.g., differential use of acaricides), as well as unmeasured biological features (e.g., breed- or individual-specific response to tick burden) (Gachohi et al., 2012). Since geographical position of samples was recorded at the farm-level, all the animals coming from a given farm were characterized by equal environmental values. Thus, the model can be written as:
where γij represents T. p. parva infection risk for the i-th animal in the j-th farm, β0 is the population intercept (Zuur et al., 2009), β0+b0j is the j-th farm random intercept, β the vector of slope parameters, and z(j) the vector containing the predictors' values as derived from the pixel where the j-th farm is located, equal for all the animals in j. In this way, animals in j are expected with the same predicted γ, so that infection risk in the j-th farm can be calculated using the population model from the previous equation:
Estimates of the parameters were obtained through the Maximum Likelihood criterion using the glmer function included in the R package lme4 (Bates et al., 2015).
Landscape Genomics
Molecular Datasets
The NextGen project genotyped 813 georeferenced indigenous B. taurus from Uganda using the medium-density BovineSNP50 BeadChip (54,596 SNPs; Illumina Inc., San Diego, CA, USA). Landscape genomics analyses were carried out on this set of animals, which will be referred to as the “landscape genomics dataset” (LGD). Samples were collected according to the spatial scheme represented in Figure 1C, and encompassed 503 of the individuals tested for T. p. parva infection. Quality control (QC) procedures were carried out with the software PLINK v.1.7 (Purcell et al., 2007). LGD was limited to autosomal chromosomes and pruned for minor allele frequency (MAF) <0.01, genotype call rates <0.95, and individual call rate <0.9. Pairwise genome-wide identity-by-descent (IBD) values were estimated, and one individual per pair showing IBD>0.5 was excluded from analyses to reduce the risk of spurious associations due to unreported kinship (Turner et al., 2011). To avoid excluding too many individuals from nearby areas, spatial positions of the highlighted pairs were considered prior to removal.
Population genetic structure of Ugandan cattle was studied on the landscape genomics dataset merged with molecular data from other European taurine, African taurine, zebuine, and sanga populations retrieved from various sources and for different geographical areas worldwide (Supplementary Table 1). This extended dataset will be referred to as the “population structure dataset” (PSD). PLINK was used to prune PSD for linkage disequilibrium (LD) >0.1 with sliding windows of 50 SNPs and step size of 10 SNPs (option –indep-pairwise 50 10 0.1), and to filter for the QC thresholds previously reported.
Population Structure Analysis
PSD was analysed with ADMIXTURE v.1.3.0 (Alexander et al., 2009) for a dual purpose. Firstly, to provide genotype-environment association tests with population structure predictors in order to reduce the risk of false positive detections (Schoville et al., 2012; Rellstab et al., 2015). To this aim, we decided to use membership coefficients for the four-cluster solution (K=4), as this was reported to be the best partition based on the ADMIXTURE cross-validation index for the same set of Ugandan individuals undergoing landscape genomics in the present study (Stucki et al., 2017). Due to strong collinearity (|r|>0.7) (Dormann et al., 2013) among the membership coefficients of two ancestral components, a PCA was performed trough the R function prcomp to obtain synthetic and orthogonal population structure predictors. Secondly, to identify the main gene pools present in Uganda in the context of a worldwide-extended dataset, and therefore guide selection of proper reference populations for local ancestry analysis.
Genotype-Environment Associations
We used the software SAMβADA v.0.5.3 (Joost et al., 2007; Stucki et al., 2017) to test for associations between B. taurus genotypes and ψR and γ at sampling locations. Given diploid species and biallelic markers, SAMβADA runs three models per locus, one for each possible genotype. Each model estimates the probability πi for the i-th individual to carry a given genotype, as a function of the considered environmental and population structure variables:
and thus:
Genotype-environment association tests were carried out through a likelihood-ratio test comparing a null and an alternative model for each genotype (Stucki et al., 2017). Particularly, null models comprised the population structure predictors alone, while alternative ones included population structure predictors plus either ψR or γ. A genotype was considered significantly associated with ψR and/or γ if the resulting p-value associated with the likelihood-ratio test statistic (D) was lower than the nominal significance threshold of 0.05 after Benjamini-Hochberg (BH) correction for multiple testing (H0: D=0, αBH=0.05; Supplementary Texts 2–3). The R function p.adjust was used to perform p-values corrections, and predictors were centred prior to analysis to ease estimation of model parameters.
Gene Annotation
Global linkage disequilibrium (LD) decay was estimated using SNeP v.1.11 (Barbato et al., 2015) to define LD extent around marker loci. A window of ±25 kbp (r2≈0.2) was then selected around those SNPs associated with ψR and/or γ to annotate genes in the Ensembl database release 87 (Aken et al., 2016). Annotated genes were investigated for known biological function according to the literature, and candidate genes identified based on their pertinence with ECF local adaptation.
Local Ancestry
Molecular Dataset
Target population for local ancestry analysis comprised 102 indigenous Ugandan B. taurus individuals collected during the NextGen sampling campaign (two animals sampled per cell; Figure 1C), and genotyped with the BovineHD BeadChip (777,961 SNPs; Illumina Inc., San Diego, CA, USA). Reference populations (see Results section) were selected in coherence with the major Ugandan gene pools identified by the ADMIXTURE analysis (Supplementary Text 4). Target and reference populations were pooled in a “local ancestry dataset” (LAD). Only autosomal SNPs passing the same filtering parameters applied to LGD were retained for analysis.
PCAdmix Analysis
Local ancestry investigation allows to assign the ancestral origin of a chromosomal region (window) given two or more reference populations, and have been used to infer the admixture history of closely related groups (Pasaniuc et al., 2009), identify signals of adaptive introgression (Barbato et al., 2017), and highlight target regions of recent selection (Tang et al., 2007). Here, PCADMIX v.1.0 (Brisbin et al., 2012) was used to infer local genomic ancestry of the Ugandan samples. Given the SNPs density present in LAD (i.e., one SNP every ~3.4 kbp, on average), we used 20 SNPs per window to obtain a window size comparable to the optimal one suggested in Brisbin et al. (2012).
Beta Regression Analysis
Genomic windows hosting SNPs in linkage with the candidate genes for local adaptation were identified and their ancestry proportions computed per sampling cell (Figure 1C). Average ψR and γ per cell values (hereafter ψRc and γc, respectively) were derived using the zonal.stats function included in the R package spatialEco (Evans, 2017). In order to test for significant associations between ancestry proportions and ψRc and γc, a beta regression analysis was performed using the R package betareg (Cribari-Neto and Zeileis, 2010), according to the model:
where ai is the ancestry proportion observed in cell i, which is assumed to derive from a beta distribution B(μi, ϕ) with mean μi=E(ai) and precision parameter ϕ, xi is either average ψR or γ in cell i, β0 and β1 are intercept and regression coefficient, respectively. Expected ancestry proportion in i was calculated through the inverse logit:
Ancestry proportions were transformed prior to analysis (Smithson and Verkuilen, 2006), and the Maximum Likelihood criterion was used to estimate model parameters.
Ethics Statement
The NextGen sampling campaign was carried out during years 2011 and 2012, before Directive 2010/63/EU came into force (i.e., 1 January 2013). Thus, all experimental procedures were compliant with the former EU Directive 86/609/EEC, according to which no approval from dedicated animal welfare/ethics committee was needed for this study. The permission to carry out the study was obtained from the Uganda National Council for Science and Technology (UNCST) reference number NS 325 (Kabi et al., 2014). The permission to carry out the sampling at each farm was obtained directly from the owners.
Results
Ecological Modelling
Species Distribution Models
The first three principal components (PC1, PC2, and PC3) accounted for more than 95% of the variance among the BIO predictors, and were subsequently tested into multivariate Maxlike models to estimate ψR. Particularly, PC1 (61%) was mainly correlated with BIO variables linked to temperature (BIO8, BIO9, BIO10, and BIO11), PC2 (19%) with precipitation (BIO16, BIO17, BIO18, and BIO19), and PC3 (15%) with both temperature and precipitation (BIO19 and BIO8) (Table 1 and Supplementary Figure 5). The model employing PC1, PC2, and PC3 was selected based on the BIC metric (Supplementary Figure 6), with PC1, and PC2 showing a significant positive effect on the tick distribution, and PC3 a significant negative effect (Table 2) (H0: βi=0, α=0.05). The model predicts low habitat suitability in the regions North of the Lakes Kwania, Kyoga and Kojwere (0<ψR<0.1), and favourable ecological conditions around Lake Victoria (0.4<ψR<1) and South-West of Lake Albert (0.4<ψR<0.8), these latter separated by a corridor of lower suitability (0<ψR<0.3) (Figure 2A and Supplementary Figure 7).
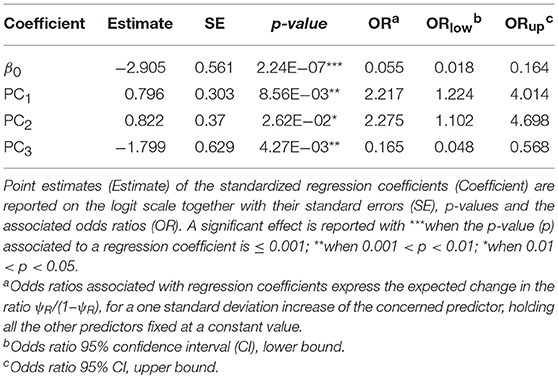
Table 2. Maxlike results for Rhipicephalus appendiculatus distribution model.
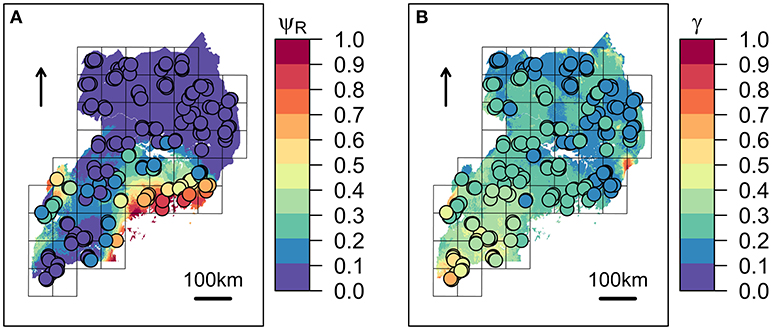
Figure 2. Predicted spatial distributions for ECF vector and infection risk in cattle. (A) Rhipicephalus appendiculatus occurrence probability (ψR) as predicted by the selected distribution model. (B) Predicted Theileria parva parva infection risk (γ). Colour from blue to red tones corresponds to increasing values of ψR and γ. Sampled farms are represented with circles, and coloured according to ψR and γ values estimated at their geographical location.
No excessive collinearity was recorded among the predictors for ψS. The best model according to the BIC metric included: altitude, annual precipitation, average NDVI, and distance from the nearest water source (Table 3 and Supplementary Figure 8). The model predicts the highest habitat suitability (0.2<ψS<0.8) in the near proximity of the water bodies (especially along the White Nile in the North-West, the south-eastern coasts of Lake Édouard, and the northern coasts of Lake George), and in small areas near the Katonga Game Reserve (Supplementary Figure 9).
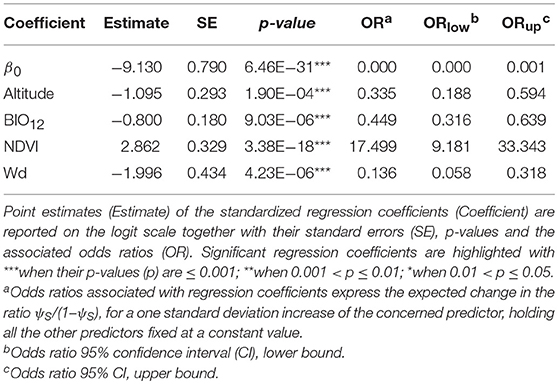
Table 3. Maxlike results for Syncerus caffer distribution model.
Infection Risk Model
Following outliers inspection, ψR, Cd, and ψS were transformed on the log10 scale to reduce the observed skewness in the distributions (Supplementary Figure 3). No excessive collinearity was observed among the model predictors (|r|<0.7). All the explanatory variables except for Cd showed a significant effect (H0: βi=0, α=0.05) on infection risk. Particularly, BIO5 and ψR showed a negative association with γ, while ψS resulted positively associated (Table 4). Overall, northern regions of Uganda present a low probability of infection (0.1<γ<0.3). A similar range is observed southwards, in the region comprised between Lake Kyoga, Lake Victoria, Lake Albert and the eastern borders with Kenya. South-westwards, infection probability increases following a positive gradient from γ≈0.30 to γ≈0.70 in the most southern districts (Figure 2B).
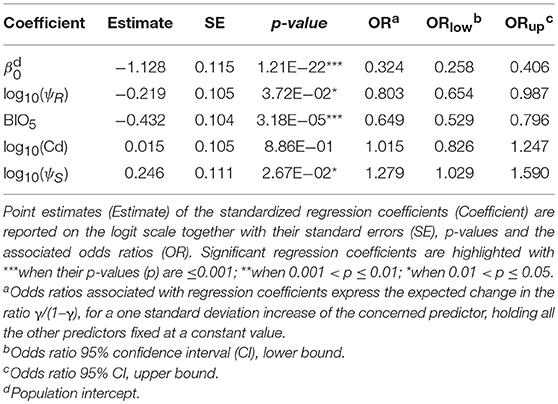
Table 4. Infection risk model results.
Landscape Genomics
Population Structure Analysis
After pruning for MAF, LD, genotype and individual call rates, PSD counted 12,925 SNPs and 1,355 individuals, among which 743 from Uganda, 131 European taurine, 158 African taurine, 195 sanga from outside Uganda, and 128 zebu cattle.
Sanga and zebuine ancestries were the most represented in Uganda. Particularly, on average the sanga component constituted 76% (±13%) of the individual ancestries, whereas the zebuine counted 18% (±13%), with more than half of the individuals showing a zebuine proportion >20%. Further, ~3% of African and European taurine genomic ancestry components was also observed (Supplementary Figure 4). Genomic components showed spatial structure, the zebuine gene pool being more present in the North-East of the country, and the sanga in central and south-western Uganda (Supplementary Figure 10) (Stucki et al., 2017). The African taurine ancestry component was detectable as background signal especially in the North-West and South-West, whereas European introgression was mostly observed in the South-West.
The first three principal components (PC1, PC2 and PC3, respectively) explained almost the totality of the variance within ADMIXTURE Q-scores for K=4; PC1 split the dataset between sanga and zebu gene pools, and PC2 and PC3 identified the European and African taurine components, respectively. Thus, these three PCs were used as population structure predictors to account for population structure within LGD in the landscape genomics models.
Genotype-Environment Associations
After QC, LGD counted 40,886 markers and 743 animals (the same in PSD) from 199 farms (4 ± 1 samples/farm), over 51 cells (15 ± 5 samples/cell).
Sixty-three genotypes across 41 putative adaptive loci resulted significantly associated with ψR (Figure 3A, Supplementary Table 2, and Supplementary Figures 11–12). Eight genotypes across seven loci resulted significantly associated with γ (Figure 3B, Supplementary Table 3, and Supplementary Figures 11–12).
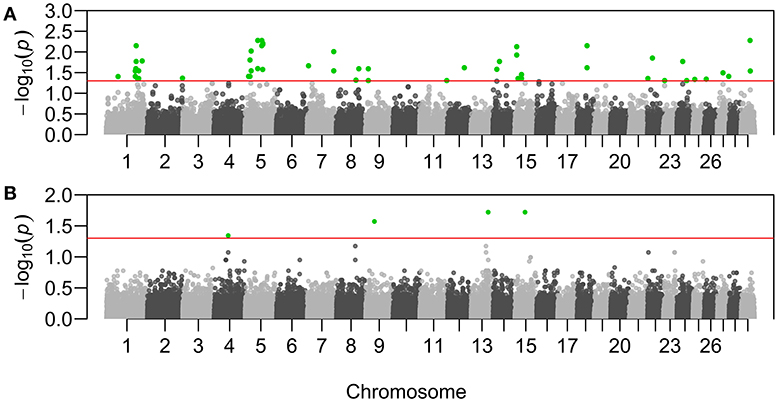
Figure 3. Manhattan plots of the genotype-environment associations. X-axis reports chromosomal position of the tested SNPs on B. taurus chromosomes. Y-axis reports the test statistic p-values (p) for the associations with Rhipicephalus appendiculatus occurrence probability (A), and with Theileria parva parva infection risk (B). P-values are displayed for each genotype after the Benjamini-Hochberg (BH) correction, and on the –log10 scale. Nominal significance threshold (αBH=0.05) is displayed as a red line, and significant p-values are highlighted in green.
Gene Annotation
Among the 41 loci significantly associated with ψR, 18 presented at least one annotated gene in the Ensembl database in close proximity (Table 5A and Supplementary Figure 12). Locus BTA-113604-no-rs (hereafter BTA-113604) is located ~12.5 kbp apart from the Protein kinase, cGMP-dependent, type I (PRKG1) gene on chromosome 26. PRKG1 was already proposed as a candidate gene for tick resistance in South African Nguni cattle (Mapholi et al., 2016).
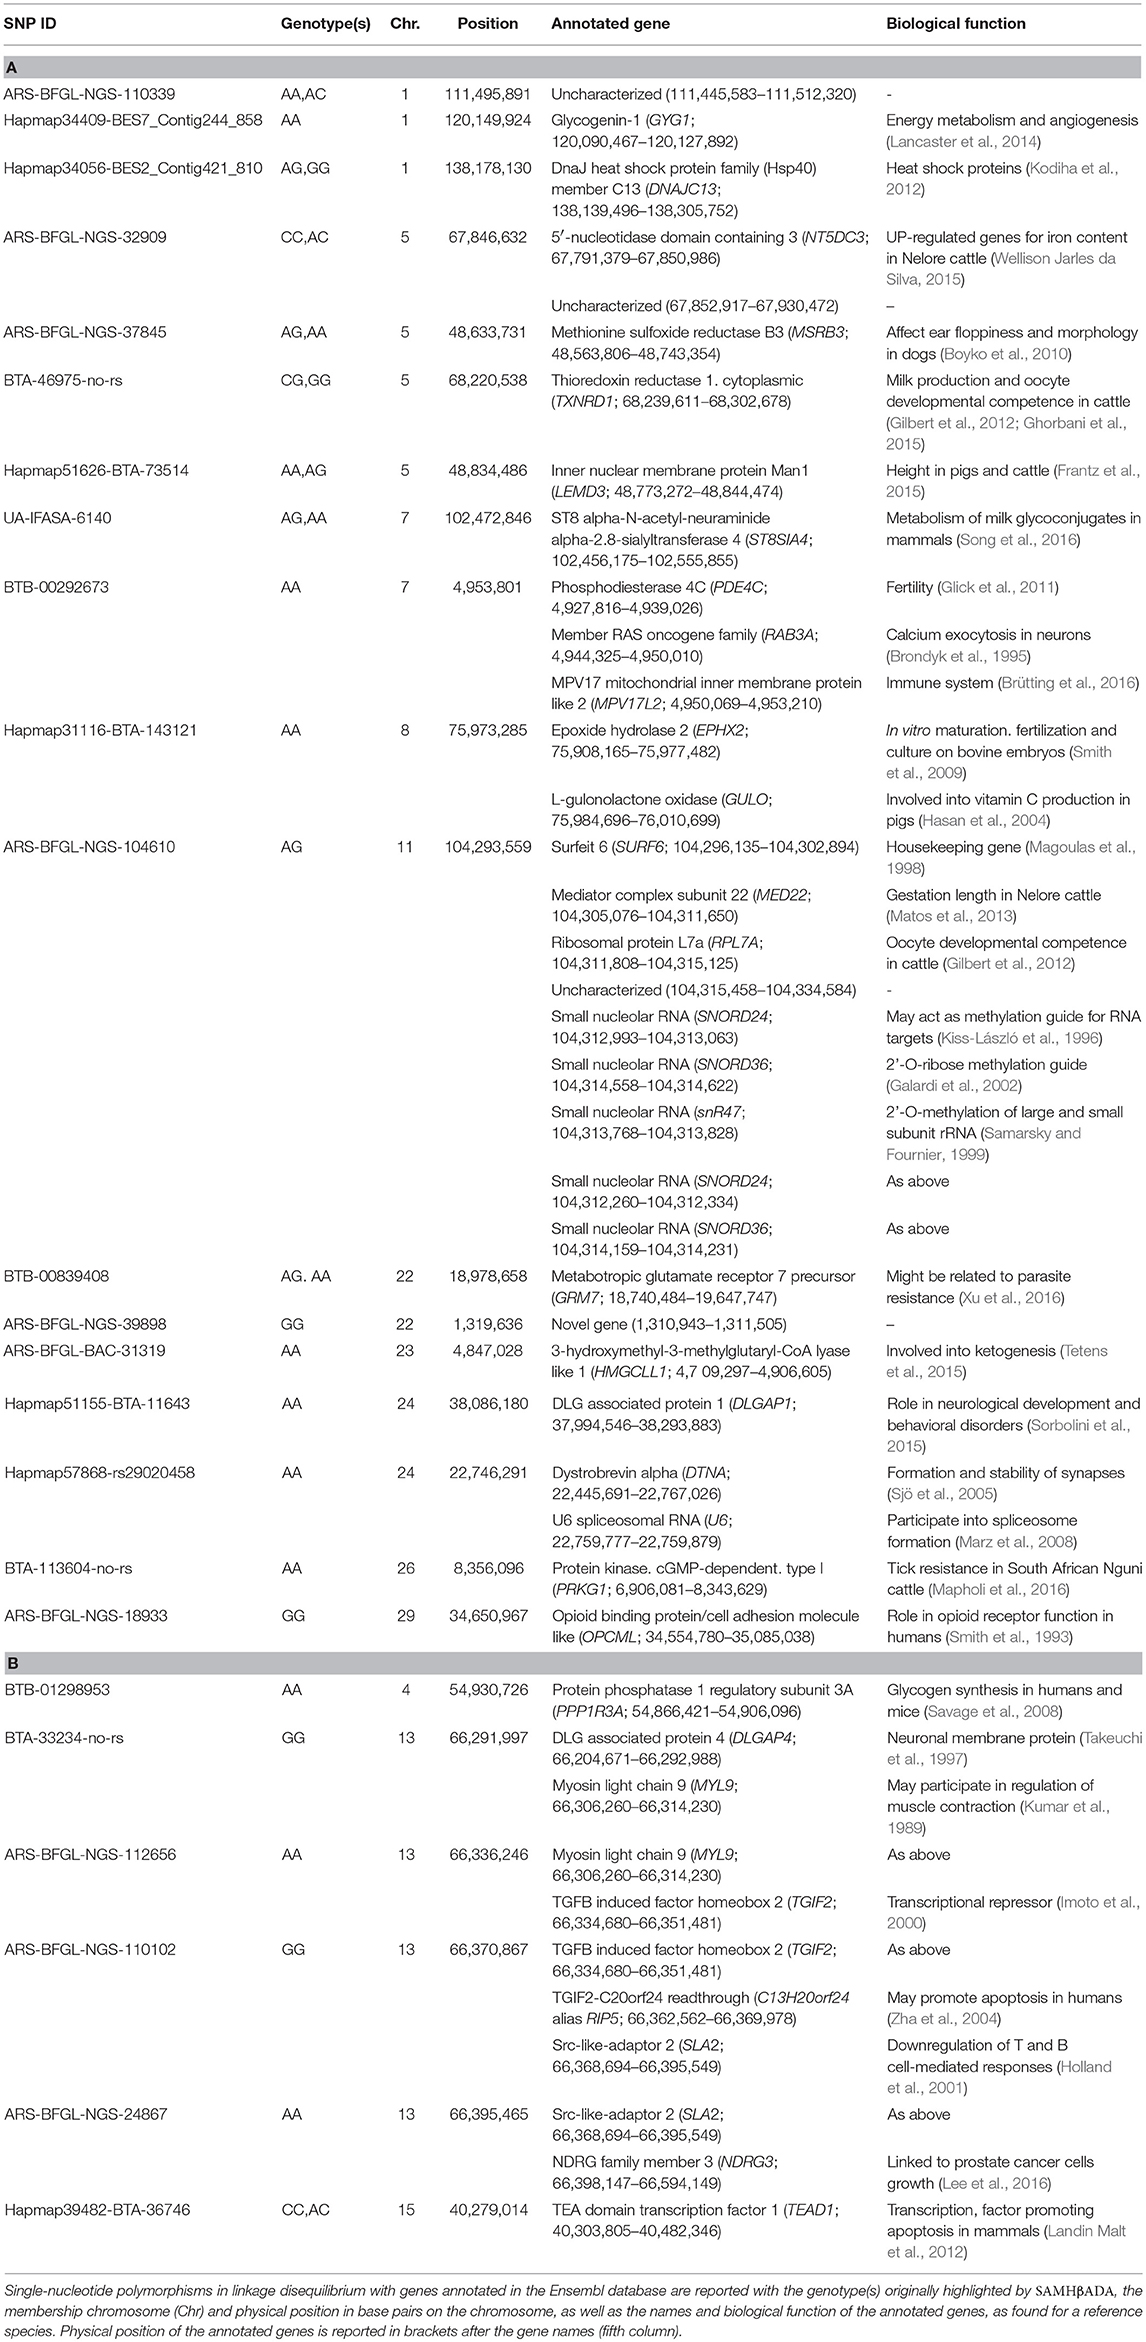
Table 5. Gene annotation for the loci significantly associated with ψR (A) and γ (B).
Six out of the seven loci significantly associated with γ presented at least one annotated gene within the selected window size (Table 5B and Supplementary Figure 12). Two SNPs (ARS-BFGL-NGS-110102 and ARS-BFGL-NGS-24867, hereafter ARS-110102 and ARS-24867, respectively) were proximal to the Src-like-adaptor 2 (SLA2) gene on chromosome 13. SLA2 human orthologue encodes the Src-like-adaptor 2, a member of the SLAP protein family which regulates the T and B cell-mediated immune response (Holland et al., 2001). Given T. p. parva known ability to promote the proliferation of T and B cells (Baldwin et al., 1988; Dobbelaere and Küenzi, 2004), we considered SLA2 as a second candidate gene for ECF local adaptation.
Local Ancestry
PCAdmix Analysis
Based on the gene pools revealed by ADMIXTURE analysis in Ugandan indigenous cattle, we performed PCADMIX analysis using one zebuine (Tharparkar; THA) and one African taurine (Muturu; MUT) reference (Supplementary Text 4). After QC, LAD counted 689,339 markers and 128 individuals (102 Ugandan cattle individuals, 13 THA, and 13 MUT).
For the genomic window hosting BTA-113604 (i.e., window 13 on chromosome 26; Supplementary Figure 13), 79 out of the 204 haploid individuals targeted showed MUT ancestry, while 125 THA ancestry (Supplementary Figure 14). For the genomic window hosting ARS-110102 and ARS-24867 (i.e., window 145 on chromosome 13; Supplementary Figure 13), 63 haploid individuals were assigned to MUT, while 141 to THA (Supplementary Figure 14).
Beta Regression Analysis
Tharparkar ancestry at window 13 of chromosome 26 showed a positive and significant association with ψRc (H0: βi=0, α=0.05) (Table 6 and Figure 4), while no significant association was found between the Muturu/Tharparkar ancestries at window 145 of chromosome 13 and γc (Supplementary Text 5).
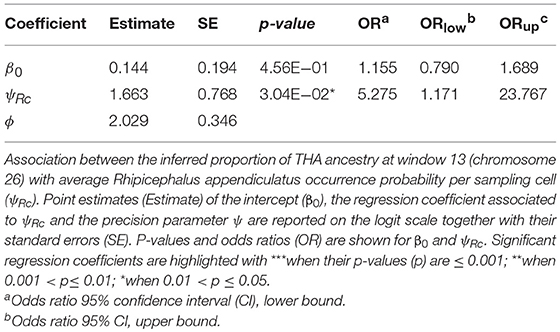
Table 6. Beta regression results.
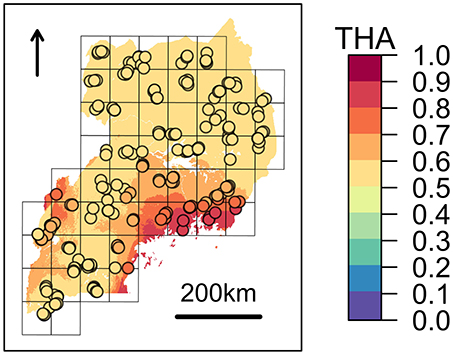
Figure 4. Expected zebuine proportion of the genomic region candidate for tick resistance. The association inferred through beta regression between Tharparkar ancestry (THA) and average Rhipicephalus appendiculatus occurrence probability per cell (Table 6) was used to generalize expected zebuine ancestry over Uganda. Colour key corresponds to predicted THA proportion, with increasing values from the blue to the red tones. Sampled farms are represented with circles, and coloured according to the predicted THA proportion at their geographical location.
Discussion
East Coast fever represents a major issue for livestock health in sub-Saharan countries (Nene et al., 2016), with over one million cattle deceased every year, and an annual economic damage of 168–300 million USD (Norval et al., 1992; McLeod and Kristjanson, 1999).
ECF incidence is highly correlated with the geographical distribution of the tick vector R. appendiculatus, whose occurrence is an essential precondition for T. p. parva infection in cattle (Olwoch et al., 2008). However, with the present study we show that areas with predicted poor habitat suitability for the tick can present higher infection rates when compared with regions highly suitable for the tick (Figure 2 and Table 4). Such observation suggests that additional factors may contribute in explaining the observed T. p. parva infection patterns; here, we suggest three possible hypotheses.
First, environmental temperature may play a pivotal role in defining T. p. parva infection risk. Piroplasm development within the tick vector appears to be hindered by temperatures >28°C persisting even for short time periods (as less as 15 days) (Young and Leitch, 1981). Therefore, areas exceeding this temperature threshold might present a reduced infection risk due to the low success in parasite development and transmission. The presence of such a temperature constraint might concur in explaining the low infection risk predicted in the regions such as North-East of Lake Victoria, where a highly suitable habitat is predicted for R. appendiculatus, but where temperature can reach 30°C in the warmest month of the year (January) (Hijmans et al., 2005). Coherently, in the south-western area, environmental temperature ranges between ~8 and 28°C during the whole year (Hijmans et al., 2005), and the predicted risk of infection increases possibly reflecting a higher efficiency in the parasite transmission despite the predicted decrease in tick occurrence probability.
Second, the most suitable areas for the vector (Figure 2A) overlap those regions where the highest levels of zebuine ancestry were recorded (Supplementary Figure 10). B. t. indicus is known to be more effective in counteracting tick infestation than B. t. taurus (Brizuela et al., 1996; Wambura et al., 1998; Mattioli et al., 2000; Jonsson et al., 2014), and is consequently less affected by tick-borne micro-organisms (Mattioli et al., 2000), including T. p. parva, whose effects are known to be dose-dependent (Brossard and Wikel, 1997; Nene et al., 2016). The core adaptive response to tick burden was identified as the inflammatory reaction triggered by the tick bite at the cutaneous level (Mattioli et al., 2000), which activates a strong white cells-mediated cutaneous reaction (Willadsen, 1980) affecting attachment, salivation, engorgement, and ultimately limiting the inoculation of tick-borne microorganisms (Wikel and Bergrnan, 1997). Therefore, the low infection risk observed in the most suitable areas for R. appendiculatus (e.g., north-eastern districts) might be explained by the coexistence of putative tick-resistant zebuine-like populations (Bahbahani et al., 2017), along with a sub-optimal environmental niche for the parasite. Further, we speculate that cattle populations living in regions suitable for T. p. parva development, but with reduced predicted tick burden (e.g., the southern districts; Figures 2A,B), could have not undergone a tick-specific adaptation, and therefore show higher infection rates.
Third, the R. appendiculatus distribution model does not explicitly consider anthropogenic factors like tick-control campaigns on a local and temporal basis. However, adequate tick-control campaigns are rarely undertaken in Uganda (Ugandan National Drug Authority), and evidence of R. appendiculatus developing drug resistance has been recorded (Vudriko et al., 2016).
Despite T. p. parva infection being observed in the northern farms of Uganda, a low tick occurrence probability is predicted for the same regions (ψR<0.1; Figure 2A). A possible explanation is the lack of R. appendiculatus records from these areas, and the consequent bias in the tick distribution model (Cumming, 1999b; Olwoch et al., 2003). Moreover, predicted infection risk in the North (γ<0.3; Figure 2B) may be inflated by the inverse relationship between γ and ψR as estimated by the infection risk model (Table 4), and care is recommended regarding the infection risk predictions for these areas.
Local adaptation is prone to evolve in host-parasite systems, given the strong (and often reciprocal) selection imposed by one species to the other, the reduced role of phenotypic plasticity, and the small number of genes with strong effects usually involved (Kawecki and Ebert, 2004). In a spatial context, a gradient of selection intensity (i.e., spatially varying selection) is required over the landscape, with coexistence areas showing higher selective pressure being candidate for local adaptive responses to evolve. In the present case, host distribution encompasses regions having different selective pressure in terms of both tick and parasite burdens (Figures 2A,B). Regions with higher T. p. parva selective pressure (implying tick occurrence with effective transmission) are those where the host population is expected to be locally adapted to infection; whereas, regions with higher tick burden (but lower infection risk) are those where tick-resistant populations are expected to occur. Following this rational, we suggest that the putative adaptive component sustaining ECF-tolerance/resistance might be due to a synergic mechanism involving specific adaptations to R. appendiculatus and T. p. parva.
Specifically, adaptations to tick burden could be found along the Lake Victoria coasts, where a higher selective pressure linked to R. appendiculatus is predicted (Figure 2A). We identified 41 loci across 18 chromosomes significantly associated with ψR (Figure 3A), with the majority of putative loci under selection found on chromosomes 5 (nine loci), 1 (seven loci), and 15 (three loci). Interestingly, the large genomic region hosting the associated SNPs on chromosome 5 (Supplementary Table 2) overlaps a genomic region which has been previously associated with several traits in tropical cattle, including parasite resistance (Porto-Neto et al., 2014). Among the genes in LD with the associated markers, we found PRKG1 on chromosome 26 (Table 5A and Supplementary Figure 13), a gene coding for an important mediator of vasodilation, and already reported as possibly involved in tick resistance in the South African Nguni breed (see Table 6 in Mapholi et al., 2016). Importantly, vasodilatation is a classical feature of the inflammatory response (Sherwood and Toliver-Kinsky, 2004; Surks, 2007), the core mechanisms underlying tick resistance, as discussed before. None of the remaining annotated genes was easily attributable to adaptation to tick burden (Table 5A).
A specific adaptive response toward T. p. parva infection may have evolved in south-western Uganda, possibly due to ecological conditions more suitable for parasite survival and successful transmission, and the presence of a more tick-susceptible cattle population (Supplementary Figure 10). Theileria parva pathogenicity is linked to its ability to invade host lymphocytes, and promoting their transformation and clonal expansion through the activation of several host-cell signalling pathways (McKeever and Morrison, 1990; Dobbelaere and Küenzi, 2004; Chaussepied et al., 2010). Here, we found seven markers significantly associated with γ, two of which (ARS-110102 and ARS-24867) included within SLA2 genic region on chromosome 13 (Supplementary Figure 13). SLA2 is known to be involved with signal transduction in B and T cells, playing a role into downregulation of humoral and cell-mediated immune responses, and thus contributing to a correct activation and proliferation of lymphocytes (Holland et al., 2001; Kazi et al., 2015; Marton et al., 2015). SLA2 antagonistic effect on lymphocytes proliferation would suggest its putative involvement in opposing the diffusion of T. p. parva in the organism.
Replication studies performed in areas with analogous host characteristics and selective gradients, like Kenya or Tanzania (Giblin, 1990; Gachohi et al., 2012; Laisser et al., 2017), and following the same methodology applied here would allow to validate the generality of the adaptive patterns highlighted, as well as to further control for the confounding effects of population structure and unconsidered collinear environmental features (Rellstab et al., 2015). Further, experimental validation will be essential to finally verify the physiological effect of the identified genes, and thus considering targeted breeding schemes.
Despite the genetic proximity between Muturu and some tick resistant indigenous B. t. taurus breeds of western Africa (i.e., N'Dama) Mattioli et al., 2000; Ibeagha-Awemu et al., 2004, local ancestry of the genomic region candidate for tick resistance was predominantly assigned to Tharparkar (Figure 4, Table 6, and Supplementary Figure 14). This result is in agreement with the known resistance of zebuine cattle to ticks, and suggests the origin of tick resistance in eastern Africa either from imported Indian populations or within local zebuine-like populations after migration from India. Conversely, no easily-interpretable indication was obtained for the genomic region candidate for tolerance to T. p. parva infection. Indeed, neither Tharparkar nor Muturu ancestries displayed a significant association with infection risk, while an additional local ancestry analysis revealed a positive correlation with the European taurine Hereford ancestry when tested versus Tharparkar (Supplementary Text 5). Although surprising, this result would rather point toward a taurine origin of infection tolerance/resistance. However, local ancestry results are inherently reference-dependent (Barbato et al., 2017), and further analyses with different African taurine and zebuine references will be required to disentangle the evolutionary origin of the genomic regions under scrutiny.
Besides the identification of candidate regions for local adaptation, our results revealed allochthonous introgression from Europe within the local gene pools of indigenous Ugandan B. taurus populations (Supplementary Text 4 and Supplementary Figure 10). This finding is consistent with the generalized loss of agro-biodiversity reported worldwide (FAO, 2015; Mwai et al., 2015), and stresses the importance of monitoring local genetic resources to conserve unique adaptations, including tolerance and/or resistance to tropical endemic diseases.
Despite limitations in both epidemiological and species occurrence data, the proposed methodological framework allowed the identification of two candidate genes putatively associated with local adaptation to East Coast fever. Overall, the combination of ecological modelling (i.e., species distribution and infection risk models) and landscape genomics showed the potential of detecting candidate genomic regions showing adaptive significance, and can assist in unravelling the adaptive patterns underlying any kind of symbiotic relationship like host-parasite interactions, mutualism, and commensalism, as well as competition among species.
Data Accessibility
The datasets generated and analyzed for this study, as well as the source code developed for data analysis, can be found in the Dryad Digital Repository (doi: 10.5061/dryad.sf5j2bf). Raster data are available from the public sources mentioned in the references and in Supplementary Text 1.
Author Contributions
EV, MB, LC, MM, ER, EF, MD, RN, SJ, and PA-M: Conceptualization; EV, MB, LC, and MM: Data curation; EV and MB: Formal analysis; EV, MB, ER, EF, SJ, and PA-M: Methodology; EV, MB, MM, and MD: Software; EV: Visualization, original draft preparation; MB, LC, MM, ER, SJ, TSS, and PA-M: Review and editing; LC, MM, FK, and RN: Investigation; LC, RN, SJ, and PA-M: Funding acquisition; LC, SJ, and PA-M: Supervision; SJ and PA-M: Project administration; CMu, CMa, VBM, FK, TSS, and HJH: Resources.
Funding
This study makes use of data generated by the NextGen Consortium, coordinated by Dr. Pierre Taberlet. The European Union's Seventh Framework Programme (FP7/2010-2014) provided funding for the project under grant agreement no 244356–NextGen (Grant KBBE-2009-1-1-03). EV was supported by the Doctoral School on the Agro-Food System (Agrisystem) of the Università Cattolica del Sacro Cuore (Italy). MM was supported by grant 2016/05787-7, São Paulo Research Foundation (FAPESP). The funders had no role in study design, data collection and analysis, decision to publish, or preparation of the manuscript.
Conflict of Interest Statement
TSS was employed by company Recombinetics, Inc.
The remaining authors declare that the research was conducted in the absence of any commercial or financial relationships that could be construed as a potential conflict of interest.
Acknowledgments
The authors are grateful to the members of the NextGen Consortium, and to Graeme S. Cumming, who kindly provided the R. appendiculatus occurrence dataset used in the present study. A previous version of this manuscript appeared as a chapter of the Ph.D. thesis by Vajana (2017), and was released as pre-print to bioRχiv (Vajana et al., 2018).
Supplementary Material
The Supplementary Material for this article can be found online at: https://www.frontiersin.org/articles/10.3389/fgene.2018.00385/full#supplementary-material
Abbreviations
Cd, Cattle density; D, Likelihood-ratio test statistic; |r|, Absolute Pearson's product-moment correlation coefficient; r2, Global linkage disequilibrium decay; γ, Theileria parva parva infection risk in cattle; γc, Average γ in the c sampling cell; πi, Genotype occurrence probability in the i-th individual; ψ, Species occurrence probability; ψx, Species occurrence probability in the x pixel of the landscape; ψR, Rhipicephalus appendiculatus occurrence probability; ψRx, Rhipicephalus appendiculatus occurrence probability in the x pixel of the landscape; ψRc, Average ψR in the c sampling cell; ψS, Syncerus caffer occurrence probability; ψSx, Syncerus caffer occurrence probability in the x pixel of the landscape.
Footnotes
1. ^US Geological Survey (USGS). Earth Resources Observation and Science (EROS) Center - Famine Early Warning Systems Network (FEWS NET). Available at: https://earlywarning.usgs.gov/fews.
References
Aho, K., Derryberry, D., and Peterson, T. (2014). Model selection for ecologists: the worldviews of AIC and BIC. Ecology 95, 631–636. doi: 10.1890/13-1452.1
Aken, B. L., Ayling, S., Barrell, D., Clarke, L., Curwen, V., Fairley, S., et al. (2016). The Ensembl gene annotation system. Database 2016:baw093. doi: 10.1093/database/baw093
Alexander, D. H., Novembre, J., and Lange, K. (2009). Fast model-based estimation of ancestry in unrelated individuals. Genome Res. 19, 1655–1664. doi: 10.1101/gr.094052.109
Bahbahani, H., and Hanotte, O. (2015). Genetic resistance: tolerance to vector-borne diseases and the prospects and challenges of genomics. Rev. Sci. Tech 34, 185–197. Available online at: https://pdfs.semanticscholar.org/9dfc/e06d6cf47093061024ff324a013e93cdd7fa.pdf
Bahbahani, H., Tijjani, A., Mukasa, C., Wragg, D., Almathen, F., Nash, O., et al. (2017). Signatures of selection for environmental adaptation and zebu × taurine hybrid fitness in East African Shorthorn Zebu. Front. Genet. 8:68. doi: 10.3389/fgene.2017.00068
Baldwin, C. L., Black, S. J., Brown, W. C., Conrad, P. A., Goddeeris, B. M., Kinuthia, S. W., et al. (1988). Bovine T cells, B cells, and null cells are transformed by the protozoan parasite Theileria parva. Infect. Immun. 56, 462–467.
Barbato, M., Hailer, F., Orozco-terWengel, P., Kijas, J., Mereu, P., Cabras, P., et al. (2017). Genomic signatures of adaptive introgression from European mouflon into domestic sheep. Sci. Rep. 7:7623. doi: 10.1038/s41598-017-07382-7
Barbato, M., Orozco-terWengel, P., Tapio, M., and Bruford, M. W. (2015). SNeP: a tool to estimate trends in recent effective population size trajectories using genome-wide SNP data. Front. Genet. 6:109. doi: 10.3389/fgene.2015.00109
Barve, N., Barve, V., Jiménez-Valverde, A., Lira-Noriega, A., Maher, S. P., Peterson, A. T., et al. (2011). The crucial role of the accessible area in ecological niche modeling and species distribution modeling. Ecol. Model. 222, 1810–1819. doi: 10.1016/j.ecolmodel.2011.02.011
Bates, D., Mächler, M., Bolker, B., and Walker, S. (2015). Fitting linear mixed-effects models using lme4. J. Stat. Softw. 67, 1–48. doi: 10.18637/jss.v067.i01
Billiouw, M., Vercruysse, J., Marcotty, T., Speybroeck, N., Chaka, G., and Berkvens, D. (2002). Theileria parva epidemics: a case study in eastern Zambia. Vet. Parasitol. 107, 51–63. doi: 10.1016/S0304-4017(02)00089-4
Boulter, N., and Hall, R. (1999). Immunity and vaccine development in the bovine theilerioses. Adv. Parasitol. 44, 41–97.
Boyko, A. R., Quignon, P., Li, L., Schoenebeck, J. J., Degenhardt, J. D., Lohmueller, K. E., et al. (2010). A simple genetic architecture underlies morphological variation in dogs. PLoS Biol. 8:e1000451. doi: 10.1371/journal.pbio.1000451
Bring, J. (1994). How to standardize regression coefficients. Am. Stat. 48, 209–213. doi: 10.2307/2684719
Brisbin, A., Bryc, K., Byrnes, J., Zakharia, F., Omberg, L., Degenhardt, J., et al. (2012). PCADMIX: principal components-based assignment of ancestry along each chromosome in individuals with admixed ancestry from two or more populations. Hum. Biol. 84, 343–364. doi: 10.3378/027.084.0401
Brizuela, C. M., Ortellado, C. A., Sanchez, T. I., Osorio, O., and Walker, A. R. (1996). Formulation of integrated control of Boophilus microplus in Paraguay: analysis of natural infestations. Vet. Parasitol. 63, 95–108.
Brondyk, W. H., McKiernan, C. J., Fortner, K. A., Stabila, P., Holz, R. W., and Macara, I. G. (1995). Interaction cloning of Rabin3, a novel protein that associates with the Ras-like GTPase Rab3A. Mol. Cell. Biol. 15, 1137–1143.
Brossard, M., and Wikel, S. K. (1997). Immunology of interactions between ticks and hosts. Med. Vet. Entomol. 11, 270–276.
Brütting, C., Emmer, A., Kornhuber, M., and Staege, M. (2016). A survey of endogenous retrovirus (ERV) sequences in the vicinity of multiple sclerosis (MS)-associated single nucleotide polymorphisms (SNPs). Mol. Biol. Rep. 43, 827–836. doi: 10.1007/s11033-016-4004-0
Cade, B. S. (2015). Model averaging and muddled multimodel inferences. Ecology 96, 2370–2382. doi: 10.1890/14-1639.1
Chaussepied, M., Janski, N., Baumgartner, M., Lizundia, R., Jensen, K., Weir, W., et al. (2010). TGF-b2 induction regulates invasiveness of Theileria-transformed leukocytes and disease susceptibility. PLoS Pathog. 6:e1001197. doi: 10.1371/journal.ppat.1001197
CIESIN Center for International Earth Science Information Network (2016). Gridded Population of the World, Version 4 (GPWv4): Land and Water Area. Palisades, NY: NASA Socioeconomic Data and Applications Center (SEDAC).
Cribari-Neto, F., and Zeileis, A. (2010). Beta regression in R. J. Stat. Softw. 34. doi: 10.18637/jss.v034.i02
Crispo, E., DiBattista, J. D., Correa, C., Thibert-Plante, X., McKellar, A. E., Schwartz, A. K., et al. (2010). The evolution of phenotypic plasticity in response to anthropogenic disturbance. Evol. Ecol. Res. 12, 47–66. Available online at: https://pdfs.semanticscholar.org/afb5/a4a4bfc20f6c4dc7c40bfbd515e15f66f11e.pdf
Cumming, G. S. (1999a). Host distributions do not limit the species ranges of most African ticks (Acari: Ixodida). Bull. Entomol. Res. 89, 303–327.
Cumming, G. S. (2002). Comparing climate and vegetation as limiting factors for species ranges of african ticks. Ecology 83, 255–268. doi: 10.2307/2680136
Decker, J. E., McKay, S. D., Rolf, M. M., Kim, J., Molina Alcalá, A., Sonstegard, T. S., et al. (2014). Worldwide patterns of ancestry, divergence, and admixture in domesticated cattle. PLoS Genet. 10:e1004254. doi: 10.1371/journal.pgen.1004254
Dobbelaere, D. A., and Küenzi, P. (2004). The strategies of the Theileria parasite: a new twist in host–pathogen interactions. Curr. Opin. Immunol. 16, 524–530. doi: 10.1016/j.coi.2004.05.009
Dormann, C. F., Elith, J., Bacher, S., Buchmann, C., Carl, G., Carré, G., et al. (2013). Collinearity: a review of methods to deal with it and a simulation study evaluating their performance. Ecography 36, 27–46. doi: 10.1111/j.1600-0587.2012.07348.x
Epstein, H. (1971). On the Classification of Cattle. The Origin of Domestic Animals of Africa. New York, NY: African Publishing Corporation.
Evans, J. S. (2017). spatialEco. Available online at: https://CRAN.R-project.org/package=spatialEco.
FAO (2015). The Second Report on the State of the World's Animal Genetic Resources for Food and Agriculture. Rome: FAO Commission on Genetic Resources for Food and Agriculture Assessments. Available online at: http://www.fao.org/3/a-i4787e/index.html.
Frantz, L. A., Schraiber, J. G., Madsen, O., Megens, H. J., Cagan, A., Bosse, M., et al. (2015). Evidence of long-term gene flow and selection during domestication from analyses of Eurasian wild and domestic pig genomes. Nat. Genet. 47, 1141–1148. doi: 10.1038/ng.3394
Fraser, D. J., Weir, L. K., Bernatchez, L., Hansen, M. M., and Taylor, E. B. (2011). Extent and scale of local adaptation in salmonid fishes: review and meta-analysis. Heredity 106, 404–420. doi: 10.1038/hdy.2010.167
Freeman, A. R. (2006). Assessing the relative ages of admixture in the bovine hybrid zones of Africa and the Near East using X chromosome haplotype mosaicism. Genetics 173, 1503–1510. doi: 10.1534/genetics.105.053280
Gachohi, J., Skilton, R., Hansen, F., Ngumi, P., Kitala, P., (2012). Epidemiology of East Coast fever (Theileria parva infection) in Kenya: past, present and the future. Parasit Vectors 5:194. doi: 10.1186/1756-3305-5-194
Gachohi, J. M., Kitala, P. M., Ngumi, P. N., and Skilton, R. A. (2011). Environment and farm factors associated with exposure to Theileria parva infection in cattle under traditional mixed farming system in Mbeere District, Kenya. Trop. Anim. Health Prod. 43, 271–277. doi: 10.1007/s11250-010-9688-x
Galardi, S., Fatica, A., Bachi, A., Scaloni, A., Presutti, C., and Bozzoni, I. (2002). Purified Box C/D snoRNPs are able to reproduce site-specific 2'-O-Methylation of target RNA in vitro. Mol. Cell. Biol. 22, 6663–6668. doi: 10.1128/MCB.22.19.6663-6668.2002
GBIF (2012). Recommended Practices for Citation of the Data Published Through the GBIF Network. Version 1.0 (Authored by Vishwas Chavan). Copenhagen: Global Biodiversity Information Facility. Available online at: https://www.gbif.org/citation-guidelines
Ghorbani, S., Tahmoorespur, M., Masoudi-Nejad, A., Nasiri, M., and Asgari, Y. (2015). Analysis of the enzyme network involved in cattle milk production using graph theory. Mol. Biol. Res. Commun. 4, 93–103.
Giblin, J. L. (1990). East coast fever in socio-historical context: a case study from Tanzania. Int. J. Afr. Hist. Stud. 23, 401–421. doi: 10.2307/219597
Gilbert, I., Robert, C., Vigneault, C., Blondin, P., and Sirard, M. A. (2012). Impact of the LH surge on granulosa cell transcript levels as markers of oocyte developmental competence in cattle. Reproduction 143, 735–747. doi: 10.1530/REP-11-0460
Glass, E. J., and Jensen, K. (2007). Resistance and susceptibility to a protozoan parasite of cattle—gene expression differences in macrophages from different breeds of cattle. Vet. Immunol. Immunopathol. 120, 20–30. doi: 10.1016/j.vetimm.2007.07.013
Glick, G., Shirak, A., Seroussi, E., Zeron, Y., Ezra, E., Weller, J. I., et al. (2011). Fine mapping of a QTL for fertility on BTA7 and its association with a CNV in the Israeli holsteins. GenesGenomesGenetics 1, 65–74. doi: 10.1534/g3.111.000299
Hanotte, O., Bradley, D. G., Ochieng, J. W., Verjee, Y., Hill, E. W., and Rege, J. E. (2002). African pastoralism: genetic imprints of origins and migrations. Science 296, 336–339. doi: 10.1126/science.1069878
Hasan, L., Vögeli, P., Stoll, P., Kramer, S. S., Stranzinger, G., and Neuenschwander, S. (2004). Intragenic deletion in the gene encoding L-gulonolactone oxidase causes vitamin C deficiency in pigs. Mamm. Genome 15, 323–333. doi: 10.1007/s00335-003-2324-6
Hayashida, K., Abe, T., Weir, W., Nakao, R., Ito, K., Kajino, K., et al. (2013). Whole-genome sequencing of Theileria parva strains provides insight into parasite migration and diversification in the African Continent. DNA Res. 20, 209–220. doi: 10.1093/dnares/dst003
Hiendleder, S., Lewalski, H., and Janke, A. (2008). Complete mitochondrial genomes of Bos taurus and Bos indicus provide new insights into intra-species variation, taxonomy and domestication. Cytogenet. Genome Res. 120, 150–156. doi: 10.1159/000118756
Hijmans, R. J. (2016). raster: Geographic Data Analysis and Modeling. Available online at: https://CRAN.R-project.org/package=raster.
Hijmans, R. J., Cameron, S. E., Parra, J. L., Jones, P. G., and Jarvis, A. (2005). Very high resolution interpolated climate surfaces for global land areas. Int. J. Climatol. 25, 1965–1978. doi: 10.1002/joc.1276
Holland, S. J., Liao, X. C., Mendenhall, M. K., Zhou, X., Pardo, J., Chu, P., et al. (2001). Functional cloning of Src-like adapter protein-2 (SLAP-2), a novel inhibitor of antigen receptor signaling. J. Exp. Med. 194, 1263–1276. doi: 10.1084/jem.194.9.1263
Ibeagha-Awemu, E. M., Jann, O. C., Weimann, C., and Erhardt, G. (2004). Genetic diversity, introgression and relationships among West/Central African cattle breeds. Genet. Sel. Evol. 36, 673–690. doi: 10.1051/gse:2004024
Imoto, I., Pimkhaokham, A., Watanabe, T., Saito-Ohara, F., Soeda, E., and Inazawa, J. (2000). Amplification and overexpression of TGIF2, a novel homeobox gene of the TALE superclass, in ovarian cancer cell lines. Biochem. Biophys. Res. Commun. 276, 264–270. doi: 10.1006/bbrc.2000.3449
Jarvis, A., Reuter, H. I., Nelson, A., and Guevara, E. (2008). Hole-Filled SRTM for the Globe Version 4, Available From the CGIAR-CSI SRTM 90m Database. Available online at: http://srtm.csi.cgiar.org.
Jonsson, N. N., Piper, E. K., and Constantinoiu, C. C. (2014). Host resistance in cattle to infestation with the cattle tick Rhipicephalus microplus. Parasite Immunol. 36, 553–559. doi: 10.1111/pim.12140
Joost, S., Bonin, A., Bruford, M. W., Després, L, Conord, C., Erhardt, G., et al. (2007). A spatial analysis method (SAM) to detect candidate loci for selection: towards a landscape genomics approach to adaptation. Mol. Ecol. 16, 3955–3969. doi: 10.1111/j.1365-294X.2007.03442.x
Kabi, F., Masembe, C., Muwanika, V., Kirunda, H., and Negrini, R. (2014). Geographic distribution of non-clinical Theileria parva infection among indigenous cattle populations in contrasting agro-ecological zones of Uganda: implications for control strategies. Parasit. Vectors 7:414. doi: 10.1186/1756-3305-7-414
Kawecki, T. J., and Ebert, D. (2004). Conceptual issues in local adaptation. Ecol. Lett. 7, 1225–1241. doi: 10.1111/j.1461-0248.2004.00684.x
Kazi, J. U., Kabir, N. N., and Rönnstrand, L. (2015). Role of SRC-like adaptor protein (SLAP) in immune and malignant cell signaling. Cell. Mol. Life Sci. 72, 2535–2544. doi: 10.1007/s00018-015-1882-6
Kim, J., Hanotte, O., Mwai, O. A., Dessie, T., Bashir, S., Diallo, B., et al. (2017). The genome landscape of indigenous African cattle. Genome Biol. 18:34. doi: 10.1186/s13059-017-1153-y
Kiss-László, Z, Henry, Y., Bachellerie, J. P., Caizergues-Ferrer, M., and Kiss, T. (1996). Site-specific ribose methylation of preribosomal RNA: a novel function for small nucleolar RNAs. Cell 85, 1077–1088.
Kivaria, F. M., Heuer, C., Jongejan, F., Okello-Onen, J., Rutagwenda, T., Unger, F., et al. (2004). Endemic stability for Theileria parva infections in Ankole calves of the Ankole ranching scheme, Uganda. Onderstepoort J. Vet. Res. 71, 189–195. doi: 10.4102/ojvr.v71i3.259
Kodiha, M., Frohlich, M., and Stochaj, U. (2012). Spatial Proteomics Sheds Light on the Biology of Nucleolar Chaperones. Curr. Proteomics 9, 186–216. doi: 10.2174/157016412803251824
Kumar, C. C., Mohan, S. R., Zavodny, P. J., Narula, S. K., and Leibowitz, P. J. (1989). Characterization and differential expression of human vascular smooth muscle myosin light chain 2 isoform in nonmuscle cells. Biochemistry 28, 4027–4035.
Laisser, E. L., Chenyambuga, S. W., Karimuribo, E. D., Msalya, G., Kipanyula, M. J., Mwilawa, A. J., et al. (2017). A review on prevalence, control measure, and tolerance of Tanzania Shorthorn Zebu cattle to East Coast fever in Tanzania. Trop. Anim. Health Prod. 49, 813–822. doi: 10.1007/s11250-017-1266-z
Lancaster, P. A., Sharman, E. D., Horn, G. W., Krehbiel, C. R., and Starkey, J. D. (2014). Effect of rate of weight gain of steers during the stocker phase. III. Gene expression of adipose tissues and skeletal muscle in growing–finishing beef cattle. J. Anim. Sci. 92, 1462–1472.
Landin Malt, A., Cagliero, J., Legent, K., Silber, J., Zider, A., and Flagiello, D. (2012). Alteration of TEAD1 expression levels confers apoptotic resistance through the transcriptional up-regulation of livin. PLoS ONE 7:e45498. doi: 10.1371/journal.pone.0045498
Lee, J. C., Chiang, K. C., Feng, T. H., Chen, Y. J., Chuang, S. T., Tsui, K. H., et al. (2016). The iron chelator, Dp44mT, effectively inhibits human oral squamous cell carcinoma cell growth in vitro and in vivo. Int. J. Mol. Sci. 17:1435. doi: 10.3390/ijms17091435
Magee, D. A., MacHugh, D. E., and Edwards, C. J. (2014). Interrogation of modern and ancient genomes reveals the complex domestic history of cattle. Anim. Front. 4, 7–22. doi: 10.2527/af.2014-0017
Magona, J. W., Walubengo, J., Olaho-Mukani, W., Jonsson, N. N., Welburn, S. C., and Eisler, M. C. (2008). Clinical features associated with seroconversion to Anaplasma marginale, Babesia bigemina and Theileria parva infections in African cattle under natural tick challenge. Vet. Parasitol. 155, 273–280. doi: 10.1016/j.vetpar.2008.05.022
Magona, J. W., Walubengo, J., Olaho-Mukani, W., Jonsson, N. N., Welburn, S. W., and Eisler, M. C. (2011). Spatial variation of tick abundance and seroconversion rates of indigenous cattle to Anaplasma marginale, Babesia bigemina and Theileria parva infections in Uganda. Exp. Appl. Acarol. 55, 203–213. doi: 10.1007/s10493-011-9456-2
Magoulas, C., Zatsepina, O. V., Jordan, P. W., et al. (1998). The SURF-6 protein is a component of the nucleolar matrix and has a high binding capacity for nucleic acids in vitro. Eur J Cell Biol 75, 174–183. doi: 10.1016/s0171-9335(98)80059-9
Mapholi, N. O., Maiwashe, A., Matika, O., Riggio, V., Bishop, S. C., MacNeil, M. D., et al. (2016). Genome-wide association study of tick resistance in South African Nguni cattle. Ticks Tick-Borne Dis. 7, 487–497. doi: 10.1016/j.ttbdis.2016.02.005
Marton, N., Baricza, E., Érsek, B., Buzás, E. I., and Nagy, G. (2015). The emerging and diverse roles of src-like adaptor proteins in health and disease. Mediators Inflamm. 2015, 1–9. doi: 10.1155/2015/952536
Marz, M., Kirsten, T., and Stadler, P. F. (2008). Evolution of spliceosomal snRNA genes in metazoan animals. J. Mol. Evol. 67, 594–607. doi: 10.1007/s00239-008-9149-6
Matawa, F., Murwira, A., and Schmidt, K. S. (2012). Explaining elephant (Loxodonta africana) and buffalo (Syncerus caffer) spatial distribution in the Zambezi Valley using maximum entropy modelling. Ecol. Model. 242, 189–197. doi: 10.1016/j.ecolmodel.2012.05.010
Matos, M. C., Utsunomiya, Y. T., Santana do Carmo, A., Russiano, V.icente, and W. R. R., Grisolia, A. B., et al. (2013). “Meta-analysis of genome-wide association studies for gestation length in Nellore cattle - Preliminary results,” in X Simpósio Brasileiro de Melhoramento Animal, Uberaba (Uberaba).
Mattioli, R. C., Pandey, V. S., Murray, M., and Fitzpatrick, J. L. (2000). Immunogenetic influences on tick resistance in African cattle with particular reference to trypanotolerant N'Dama (Bos taurus) and trypanosusceptible Gobra zebu (Bos indicus) cattle. Acta Trop. 75, 263–277. doi: 10.1016/S0001-706X(00)00063-2
McKeever, D. J., and Morrison, W. I. (1990). Theileria parva: the nature of the immune response and its significance for immunoprophylaxis. Sci. Tech. Rev. 9, 405–421.
McLeod, A., and Kristjanson, R. (1999). Impact of Ticks and Associated Diseases on Cattle in Asia, Australia and Africa. ILRI and eSYS report to ACIAR. Nairobi: International Livestock Research Institute.
Merow, C., and Silander, J. A. (2014). A comparison of Maxlike and Maxent for modelling species distributions. Methods Ecol. Evol. 5, 215–225. doi: 10.1111/2041-210X.12152
Muhanguzi, D., Picozzi, K., Hatendorf, J., Thrusfield, M., Welburn, S. C., Kabasa, J. D., et al. (2014). Prevalence and spatial distribution of Theileria parva in cattle under crop-livestock farming systems in Tororo District, Eastern Uganda. Parasit. Vectors 7:91. doi: 10.1186/1756-3305-7-91
Mwai, O., Hanotte, O., Kwon, Y.-J., and Cho, S. (2015). Invited review - African indigenous cattle: unique genetic resources in a rapidly changing world. Asian Aust. J. Anim. Sci. 28, 911–921. doi: 10.5713/ajas.15.0002R
Naidoo, R., Du Preez, P., Stuart-Hill, G., Jago, M., and Wegmann, M. (2012). Home on the range: factors explaining partial migration of African buffalo in a tropical environment. PLoS ONE 7:e36527. doi: 10.1371/journal.pone.0036527
Nene, V., Kiara, H., Lacasta, A., Pelle, R., Svitek, N., and Steinaa, L. (2016). The biology of Theileria parva and control of East Coast fever – Current status and future trends. Ticks Tick-Borne Dis. 7, 549–564. doi: 10.1016/j.ttbdis.2016.02.001
Norval, R. A. I., Perry, B. D., and Young, A. S. (1992). The Epidemiology of Theileriosis in Africa. ILRI (aka ILCA and ILRAD) Available online at: http://books.google.it/books?hl=it&lr=&id=_eIeTH63SzIC&oi=fnd&pg=PP9&dq=norval+et+al+theileriosis&ots=7BPcXR0DUT&sig=NuMl28IJ76o5WJsTJYQents3ZbM (Accessed October 24, 2014).
Olwoch, J. M., Rautenbach, C., de, W., Erasmus, B. F. N., Engelbrecht, F. A., and Van Jaarsveld, A. S. (2003). Simulating tick distributions over sub-Saharan Africa: the use of observed and simulated climate surfaces. J. Biogeogr. 30, 1221–1232. doi: 10.1046/j.1365-2699.2003.00913.x
Olwoch, J. M., Reyers, B., Engelbrecht, F. A., and Erasmus, B. F. N. (2008). Climate change and the tick-borne disease, theileriosis (East Coast fever) in sub-Saharan Africa. J. Arid Environ. 72, 108–120. doi: 10.1016/j.jaridenv.2007.04.003
Oura, C. A., Tait, A., Asiimwe, B., Lubega, G. W., and Weir, W. (2011). Haemoparasite prevalence and Theileria parva strain diversity in Cape buffalo (Syncerus caffer) in Uganda. Vet. Parasitol. 175, 212–219. doi: 10.1016/j.vetpar.2010.10.032
Pasaniuc, B., Sankararaman, S., Kimmel, G., and Halperin, E. (2009). Inference of locus-specific ancestry in closely related populations. Bioinformatics 25, i213–i221. doi: 10.1093/bioinformatics/btp197
Pettorelli, N., Ryan, S., Mueller, T., Bunnefeld, N., Jedrzejewska, B., Lima, M., et al. (2011). The Normalized Difference Vegetation Index (NDVI): unforeseen successes in animal ecology. Clim. Res. 46, 15–27. doi: 10.3354/cr00936
Porto-Neto, L. R., Reverter, A., Prayaga, K. C., Chan, E. K. F., Johnston, D. J., Hawken, R. J., et al. (2014). The genetic architecture of climatic adaptation of tropical cattle. PLoS ONE 9:e113284. doi: 10.1371/journal.pone.0113284
Purcell, S., Neale, B., Todd-Brown, K., Thomas, L., Ferreira, M. A. R., Bender, D., et al. (2007). PLINK: a tool set for whole-genome association and population-based linkage analyses. Am. J. Hum. Genet. 81, 559–575. doi: 10.1086/519795
QGIS Development Team (2016). QGIS Geographic Information System. Open Source Geospatial Foundation Project. Available online at: https://qgis.org/en/site/
Råberg, L., Sim, D., and Read, A. F. (2007). Disentangling genetic variation for resistance and tolerance to infectious diseases in animals. Science 318, 812–814. doi: 10.1126/science.1148526
Rellstab, C., Gugerli, F., Eckert, A. J., Hancock, A. M., and Holderegger, R. (2015). A practical guide to environmental association analysis in landscape genomics. Mol. Ecol. 24, 4348–4370. doi: 10.1111/mec.13322
Robinson, T. P., Wint, G. R. W., Conchedda, G., Van Boeckel, T. P., Ercoli, V., Palamara, E., et al. (2014). Mapping the global distribution of livestock. PLoS ONE 9:e96084. doi: 10.1371/journal.pone.0096084
Royle, J. A., Chandler, R. B., Yackulic, C., and Nichols, J. D. (2012). Likelihood analysis of species occurrence probability from presence-only data for modelling species distributions: likelihood analysis of presence-only data. Methods Ecol. Evol. 3, 545–554. doi: 10.1111/j.2041-210X.2011.00182.x
Rubaire-Akiiki, C. M., Okello-Onen, J., Musunga, D., Kabagambe, E. K., Vaarst, M., Okello, D., et al. (2006). Effect of agro-ecological zone and grazing system on incidence of East Coast Fever in calves in Mbale and Sironko Districts of Eastern Uganda. Prev. Vet. Med. 75, 251–266. doi: 10.1016/j.prevetmed.2006.04.015
Samarsky, D. A., and Fournier, M. J. (1999). A comprehensive database for the small nucleolar RNAs from Saccharomyces cerevisiae. Nucleic Acids Res. 27, 161–164.
Savage, D. B., Zhai, L., Ravikumar, B., Choi, C. S., Snaar, J. E., McGuire, A. C., et al. (2008). A prevalent variant in PPP1R3A impairs glycogen synthesis and reduces muscle glycogen content in humans and mice. PLoS Med. 5:e27. doi: 10.1371/journal.pmed.0050027
Savolainen, O., Lascoux, M., and Merilä, J. (2013). Ecological genomics of local adaptation. Nat. Rev. Genet. 14, 807–820. doi: 10.1038/nrg3522
Schoville, S. D., Bonin, A., François, O., Lobreaux, S., Melodelima, C., and Manel, S. (2012). Adaptive genetic variation on the landscape: methods and cases. Annu. Rev. Ecol. Evol. Syst. 43, 23–43. doi: 10.1146/annurev-ecolsys-110411-160248
Sherwood, E. R., and Toliver-Kinsky, T. (2004). Mechanisms of the inflammatory response. Best Pract. Res. Clin. Anaesthesiol. 18, 385–405. doi: 10.1016/j.bpa.2003.12.002
Singh, J., Gill, J. S., Kwatra, M. S., and Sharma, K. K. (1993). Treatment of theileriosis in crossbred cattle in the Punjab. Trop. Anim. Health Prod. 25, 75–78.
Sivakumar, T., Hayashida, K., Sugimoto, C., and Yokoyama, N. (2014). Evolution and genetic diversity of Theileria. Infect. Genet. Evol. 27, 250–263. doi: 10.1016/j.meegid.2014.07.013
Sjö, A., Magnusson, K., and Peterson, K. J. (2005). Association of α-dystrobrevin with reorganizing tight junctions. J. Membr. Biol. 203, 21–30. doi: 10.1007/s00232-004-0728-1
Smith, M. W., Clark, S. P., Hutchinson, J. S., Wei, Y. H., Churukian, A. C., Daniels, L. B., et al. (1993). A sequence-tagged site map of human chromosome 11. Genomics 17, 699–725. doi: 10.1006/geno.1993.1392
Smith, S. L., Everts, R. E., Sung, L.-Y., Du, F., Page, R. L., Henderson, B., et al. (2009). Gene expression profiling of single bovine embryos uncovers significant effects of in vitro maturation, fertilization and culture. Mol. Reprod. Dev. 76, 38–47. doi: 10.1002/mrd.20927
Smithson, M., and Verkuilen, J. (2006). A better lemon squeezer? Maximum-likelihood regression with beta-distributed dependent variables. Psychol. Methods 11, 54–71. doi: 10.1037/1082-989X.11.1.54
Song, S., Ou-Yang, Y., Huo, J., Zhang, Y., Yu, C., Liu, M., et al. (2016). Molecular cloning, sequence characterization, and tissue expression analysis of three water buffalo (Bubalus bubalis) genes – ST6GAL1, ST8SIA4 and SLC35C1. Arch. Anim. Breed. 59, 363–372. doi: 10.5194/aab-59-363-2016
Sorbolini, S., Marras, G., Gaspa, G., Dimauro, C., Cellesi, M., Valentini, A., et al. (2015). Detection of selection signatures in Piemontese and Marchigiana cattle, two breeds with similar production aptitudes but different selection histories. Genet. Sel. Evol. 47:52. doi: 10.1186/s12711-015-0128-2
Stockwell, C. A., Hendry, A. P., and Kinnison, M. T. (2003). Contemporary evolution meets conservation biology. Trends Ecol. Evol. 18, 94–101. doi: 10.1016/S0169-5347(02)00044-7
Stucki, S., Orozco-terWengel, P., Forester, B. R., Duruz, S., Colli, L., Masembe, C., et al. (2017). High performance computation of landscape genomic models including local indicators of spatial association. Mol. Ecol. Resour. 17, 1072–1089. doi: 10.1111/1755-0998.12629
Surks, H. K. (2007). cGMP-dependent protein kinase I and smooth muscle relaxation: a tale of two isoforms. Circ. Res. 101, 1078–1080. doi: 10.1161/CIRCRESAHA.107.165779
Takeuchi, M., Hata, Y., Hirao, K., Toyoda, A., Irie, M., and Takai, Y. (1997). A family of PSD-95/SAP90-associated proteins localized at postsynaptic density. J. Biol. Chem. 272, 11943–11951.
Tang, H., Choudhry, S., Mei, R., Morgan, M., Rodriguez-Cintron, W., Burchard, E. G., et al. (2007). Recent genetic selection in the ancestral admixture of Puerto Ricans. Am. J. Hum. Genet. 81, 626–633. doi: 10.1086/520769
Tetens, J., Heuer, C., Heyer, I., Klein, M. S., Gronwald, W., Junge, W., et al. (2015). Polymorphisms within the APOBR gene are highly associated with milk levels of prognostic ketosis biomarkers in dairy cows. Physiol. Genomics 47, 129–137. doi: 10.1152/physiolgenomics.00126.2014
Turner, S., Armstrong, L. L., Bradford, Y., Carlson, C. S., Crawford, D. C., Crenshaw, A. T., et al. (2011). “Quality Control Procedures for Genome-Wide Association Studies,” in Current Protocols in Human Genetics, eds J. L. Haines, B. R. Korf, C. C. Morton, C. E. Seidman, J. G. Seidman and D. R. Smith (Hoboken, NJ: John Wiley and Sons, Inc.). Available online at: http://doi.wiley.com/10.1002/0471142905.hg0119s68 [Accessed December 15, 2016].
Vajana, E. (2017). Exploring Livestock Evolutionary History, Diversity, Adaptation and Conservation Through Landscape Genomics and Ecological Modelling. Available online at: http://tesionline.unicatt.it/bitstream/10280/19085/1/tesiphd_completa_Vajana.pdf
Vajana, E., Barbato, M., Colli, L., Milanesi, M., Rochat, E., Fabrizi, E., et al. (2018). Combining landscape genomics and ecological modelling to investigate local adaptation of indigenous Ugandan cattle to East Coast fever. bioRxiv. doi: 10.1101/315184
Vudriko, P., Okwee-Acai, J., Tayebwa, D. S., Byaruhanga, J., Kakooza, S., Wampande, E., et al. (2016). Emergence of multi-acaricide resistant Rhipicephalus ticks and its implication on chemical tick control in Uganda. Parasit. Vectors 9:4. doi: 10.1186/s13071-015-1278-3
Wambura, P. N., Gwakisa, P. S., Silayo, R. S., and Rugaimukamu, E. A. (1998). Breed-associated resistance to tick infestation in Bos indicus and their crosses with Bos taurus. Vet. Parasitol. 77, 63–70. doi: 10.1016/S0304-4017(97)00229-X
Wellison Jarles da Silva, D. (2015). Expressão Gênica Diferencial Relacionada ao Contenúdo de Ferro no Músculo em Animais Nelore. São Carlos; São Paulo: Universidade Federal de São Carlos.
Wikel, S. K., and Bergrnan, D. (1997). Tick-host immunology: significant advances and challenging opportunities. Parasitol. Today 13, 383–389.
Willadsen, P. (1980). “Immediate hypersensitivity to Boophilus microplus: factors affecting hypersensitivity, and their relevance in the resistance of cattle to ticks,” in Proceedings of a Symposium Held at the 56th Annual Conference of Australian Veterinary Association, eds L. A. Y Johnston and M. G. Cooper (Townsville, QLD; Sydney, NSW).
Winnie, J. A., Cross, P., and Getz, W. (2008). Habitat quality and heterogeneity influence distribution and behavior in African buffalo (Syncerus caffer). Ecology 89, 1457–1468. doi: 10.1890/07-0772.1
Xu, L., Hou, Y., Bickhart, D. M., Zhou, Y., Hay, E. H., abdel, Song, J., et al. (2016). Population-genetic properties of differentiated copy number variations in cattle. Sci. Rep. 6:23161. doi: 10.1038/srep23161
Young, A. S., and Leitch, B. L. (1981). Epidemiology of East Coast fever: some effects of temperature on the development of Theileria parva in the tick vector Rhipicephalus appendiculatus. Parasitology 83, 199–211.
Keywords: local adaptation, landscape genomics, species distribution modelling, indigenous cattle, East Coast fever
Citation: Vajana E, Barbato M, Colli L, Milanesi M, Rochat E, Fabrizi E, Mukasa C, Del Corvo M, Masembe C, Muwanika VB, Kabi F, Sonstegard TS, Huson HJ, Negrini R, The NextGen Consortium, Joost S and Ajmone-Marsan P (2018) Combining Landscape Genomics and Ecological Modelling to Investigate Local Adaptation of Indigenous Ugandan Cattle to East Coast Fever. Front. Genet. 9:385. doi: 10.3389/fgene.2018.00385
Received: 18 May 2018; Accepted: 27 August 2018;
Published: 03 October 2018.
Edited by:
S. Hong Lee, University of South Australia, AustraliaReviewed by:
Seung Hwan Lee, Chungnam National University, South KoreaGonzalo Gajardo, University of Los Lagos, Chile
Copyright © 2018 Vajana, Barbato, Colli, Milanesi, Rochat, Fabrizi, Mukasa, Del Corvo, Masembe, Muwanika, Kabi, Sonstegard, Huson, Negrini, The NextGen Consortium, Joost and Ajmone-Marsan. This is an open-access article distributed under the terms of the Creative Commons Attribution License (CC BY). The use, distribution or reproduction in other forums is permitted, provided the original author(s) and the copyright owner(s) are credited and that the original publication in this journal is cited, in accordance with accepted academic practice. No use, distribution or reproduction is permitted which does not comply with these terms.
*Correspondence: Elia Vajana, elia.vajana@epfl.ch
†These authors have contributed equally to this work