Utilizing Novel Field and Data Exploration Methods to Explore Hot Moments in High-Frequency Soil Nitrous Oxide Emissions Data: Opportunities and Challenges
 Christine S. O’Connell1*
  Tyler L. Anthony2
  Melanie A. Mayes3
  Tibisay Pérez2,4
  Debjani Sihi5
  Whendee L. Silver2
- 1Department of Environmental Studies, Macalester College, St. Paul, MN, United States
- 2Department of Environmental Science, Policy, and Management, University of California, Berkeley, Berkeley, CA, United States
- 3Oak Ridge National Laboratory, Environmental Sciences Division, Climate Change Science Institute, Oak Ridge, TN, United States
- 4Centro de Ciencias Atmosféricas y Biogeoquímica, Instituto Venezolano de Investigaciones Científicas, Caracas, Venezuela
- 5Department of Environmental Sciences, Emory University, Atlanta, GA, United States
Soil nitrous oxide (N2O) emissions are an important driver of climate change and are a major mechanism of labile nitrogen (N) loss from terrestrial ecosystems. Evidence increasingly suggests that locations on the landscape that experience biogeochemical fluxes disproportionate to the surrounding matrix (hot spots) and time periods that show disproportionately high fluxes relative to the background (hot moments) strongly influence landscape-scale soil N2O emissions. However, substantial uncertainties remain regarding how to measure and model where and when these extreme soil N2O fluxes occur. High-frequency datasets of soil N2O fluxes are newly possible due to advancements in field-ready instrumentation that uses cavity ring-down spectroscopy (CRDS). Here, we outline the opportunities and challenges that are provided by the deployment of this field-based instrumentation and the collection of high-frequency soil N2O flux datasets. While there are substantial challenges associated with automated CRDS systems, there are also opportunities to utilize these near-continuous data to constrain our understanding of dynamics of the terrestrial N cycle across space and time. Finally, we propose future research directions exploring the influence of hot moments of N2O emissions on the N cycle, particularly considering the gaps surrounding how global change forces are likely to alter N dynamics in the future.
Introduction
Globally, soils are the largest source of nitrous oxide (N2O) to the atmosphere (Tian et al., 2020) and soil N2O emissions have substantial influence over both the nitrogen (N) cycle and landscape-level greenhouse gas (GHG) emissions (Groffman et al., 2009). Fluxes of N2O at the soil-atmosphere boundary tend to be episodic in nature due to short-lived peak emissions (a.k.a., “hot moments”) resulting from pulse events associated with natural (e.g., storm events, freeze-thaw cycles) and anthropogenic (e.g., fertilization in agricultural soils, flood irrigation) factors (Molodovskaya et al., 2012; Wagner-Riddle et al., 2017, 2020). Additionally, a small proportion of landscape locations can be predisposed to biogeochemical fluxes disproportionate to the surrounding matrix (a.k.a., “hot spots”), also as a result of natural (e.g., hydrologic, redox dynamics, aggregate microsites) and anthropogenic factors (e.g., landscape management decisions) (Silver et al., 1999; Groffman et al., 2009; Bernhardt et al., 2017; Barcellos et al., 2018).
Measurements at discrete time points (e.g., bi-weekly or monthly) or with limited replication across a landscape in traditional field campaigns can miss these critical hot spots and hot moments. Missing these hot moments or under-observing hot spots can result in large uncertainties in national and global inventories (Tian et al., 2020). To that end, researchers have attempted to identify optimum sampling frequency (daily to weekly) or time (e.g., mid-morning to mid-day, late evening) that can increase precision and reduce disparities in terrestrial N2O budget estimates (Smith and Dobbie, 2001; Parkin, 2008; Barton et al., 2015; Reeves and Wang, 2015). However, there remain open questions about how best to measure, model and predict hot spots and hot moments of soil N2O fluxes. It is therefore imperative that we develop both robust methodologies for observing patterns of hot spots and hot moments of soil N2O emissions and, at the same time, models that can aid in predicting and scaling them.
Over the past decade, several optical techniques, including cavity ring-down spectroscopy (CRDS), have been developed and deployed in the field (Figure 1) to measure ecosystem trace gas fluxes (Rapson and Dacres, 2014). The major advantage of these techniques is their ability to carry out high frequency measurements of a number of trace gases simultaneously. With CRDS, spectra can be obtained roughly every 2 s (Christiansen et al., 2015), generating 15–30 times more data points per flux measurement than traditional “manual” chamber-based flux measurements. The simultaneous development of automated chambers, which allow for continuous and unmonitored operation via chamber-management software (such as EosAnalyze-AC, Eosense, Nova Scotia, Canada or SoilFluxPro, LI-COR Biosciences, Nebraska, United States), has created the ability to conduct pseudo-continuous in situ flux measurements capable of five or more individual N2O flux measurements per hour (Diefenderfer et al., 2018; Hemes et al., 2019). Other recent technologies utilized in ecosystem-scale applications include continuous wave quantum cascade laser (QCL) N2O gas analyzers (Savage et al., 2014; Cowan et al., 2020), eddy covariance (Tallec et al., 2019), and flux gradient (Wagner-Riddle et al., 2017) methods. Among these techniques, CRDS systems combined with automatic soil chambers provide the ability to capture the spatial and temporal heterogeneity of N2O fluxes at the plot scale needed to better constrain N cycle processes and controls.
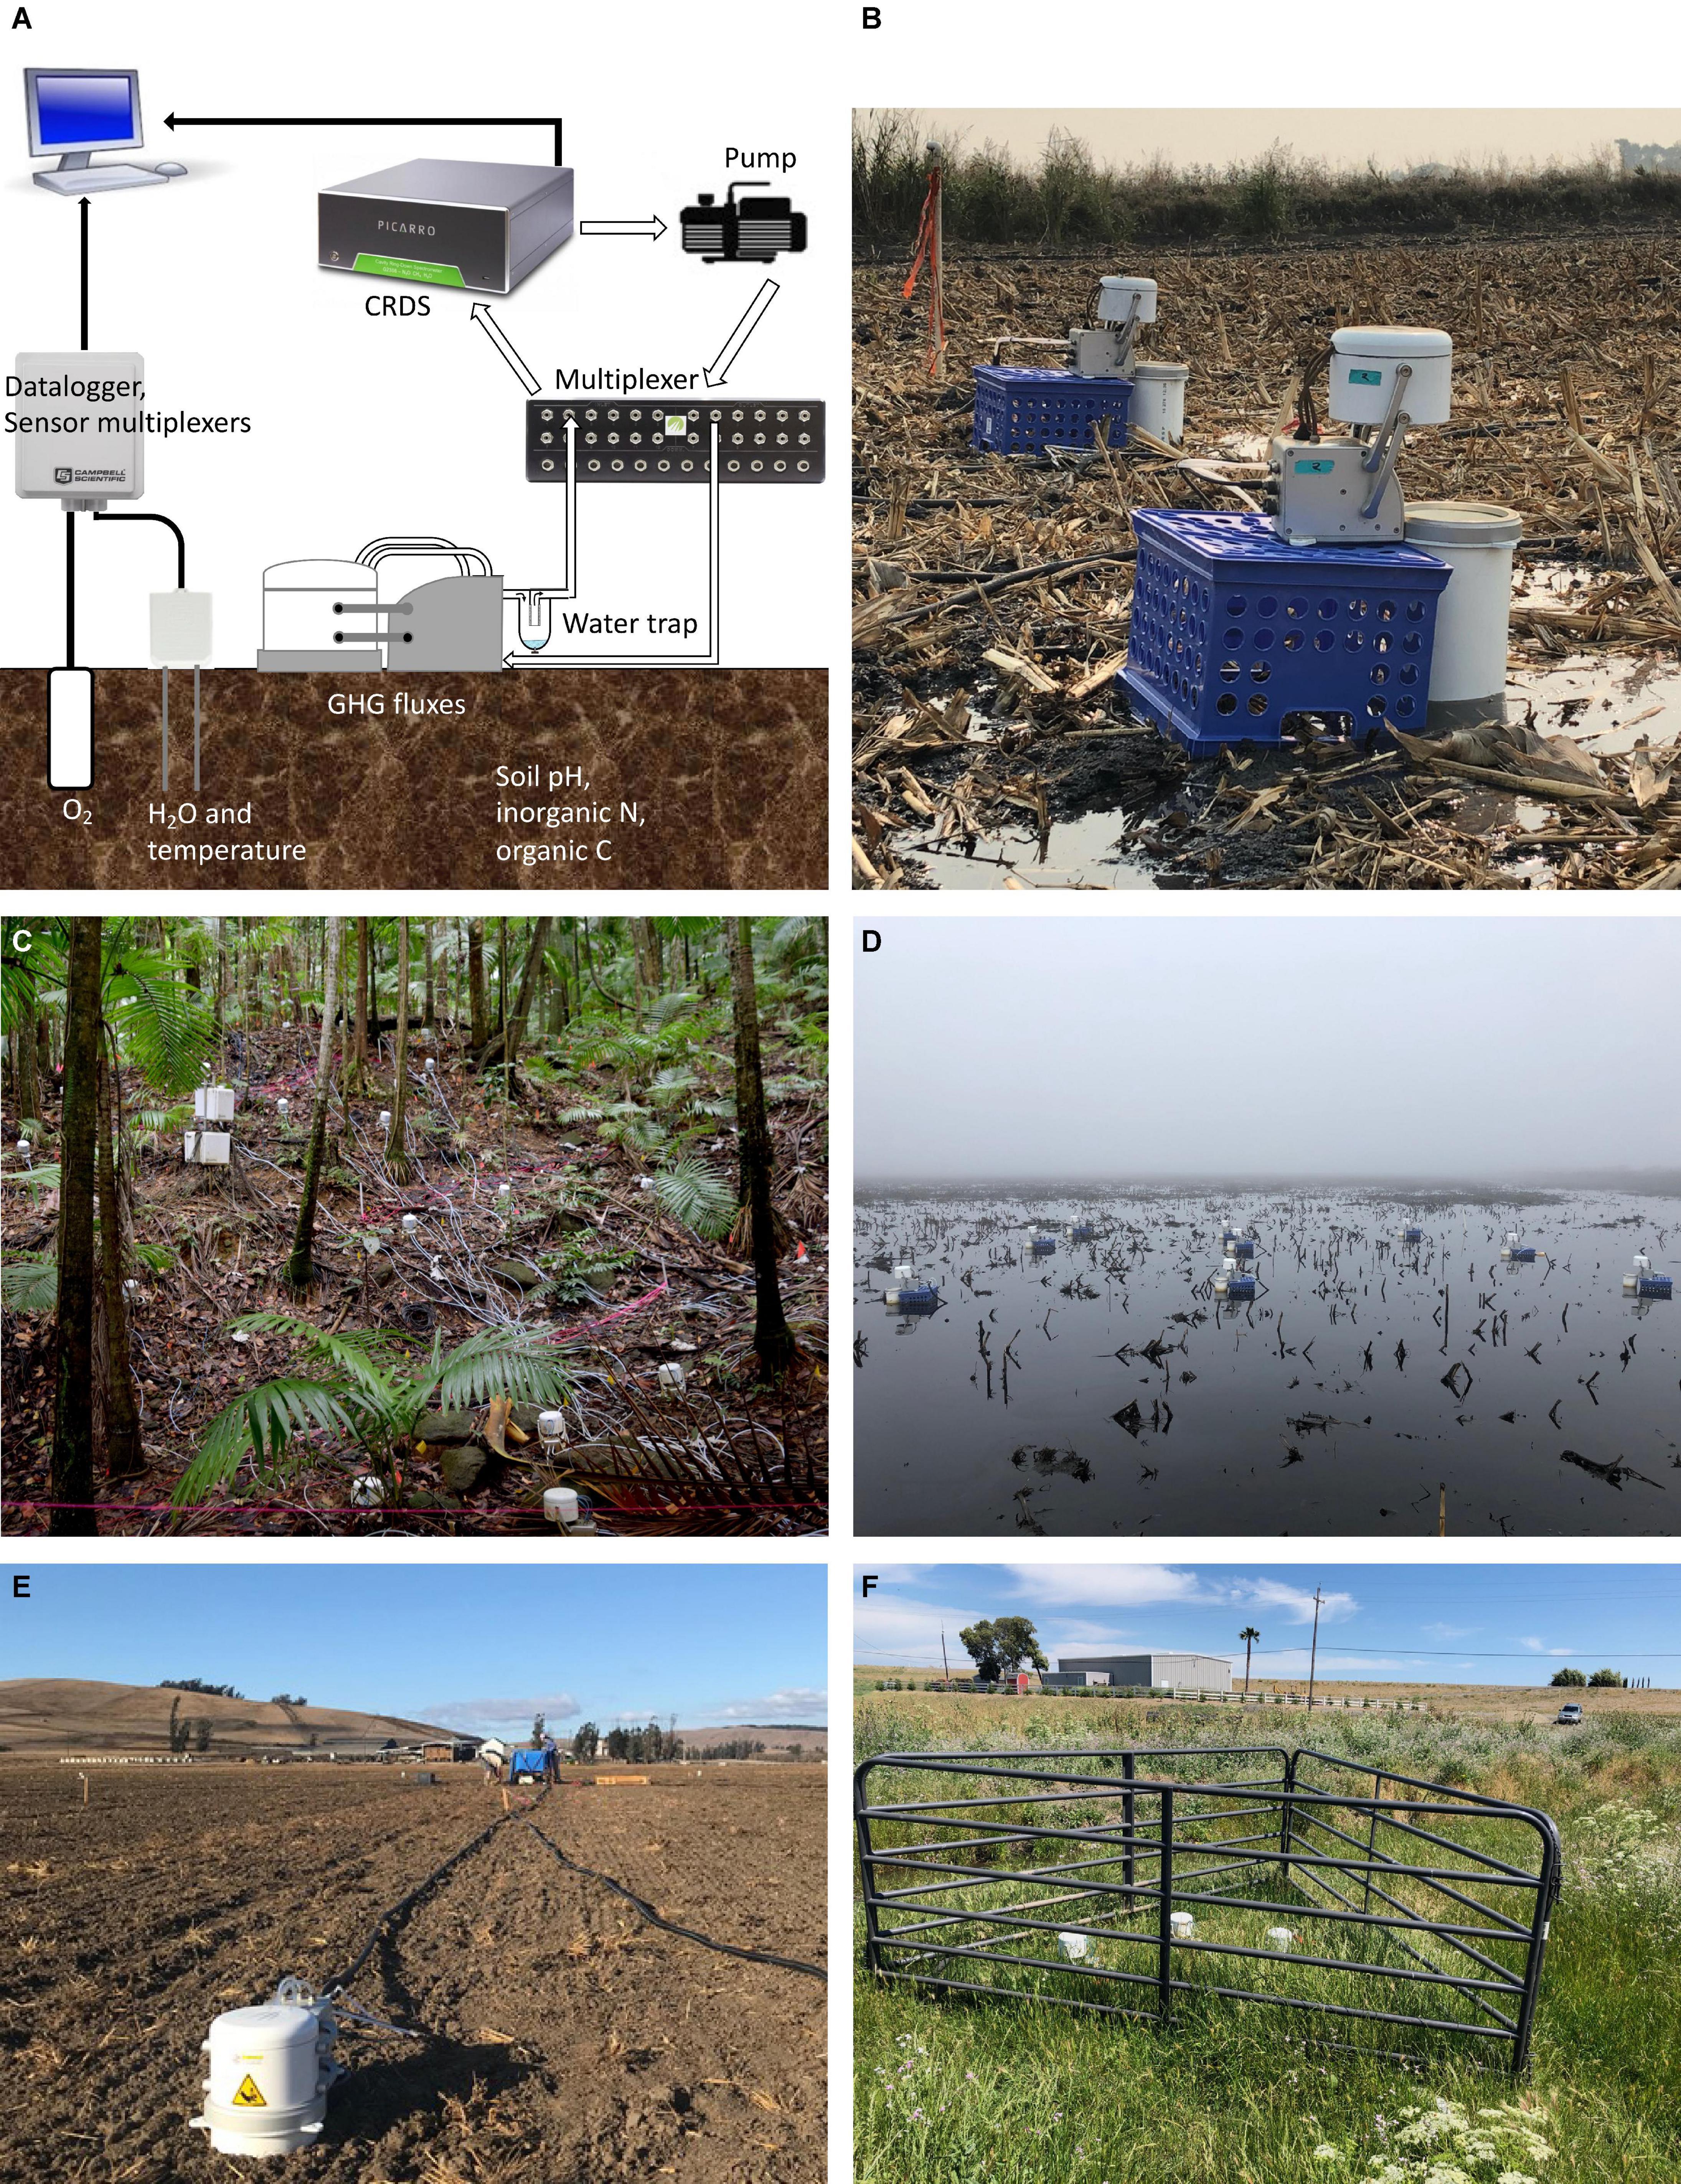
Figure 1. (A) Sampling configuration for continuous soil GHG emissions by CRDS and applicable soil physicochemical variables (in this case, e.g., soil moisture, temperature, and oxygen sensors). A circulating pump draws air after chamber enclosure. The air passes through a multiplexer where is directed to the CRDS for pseudo-continuous GHG concentration measurements. (B–F) Field deployment of automated CRDS systems including in tropical high-rainfall ecosystem [Luquillo Experimental Forest, Puerto Rico (C)], in flooded soils [California, United States (B,D)] and agricultural systems [California, United States (E,F)].
The emergence of field-ready, automated GHG instrumentation that can measure soil N2O emissions has made studying hot spots and hot moments of soil N2O fluxes more tractable. However, there remain numerous challenges to implementing these systems in the field, as well as challenges associated with analyzing these new high-frequency datasets and incorporating these findings into process-based ecosystem and Earth system models. High-frequency data on soil N2O emissions is quickly becoming available as more automated CRDS systems are deployed. Here, we outline challenges and opportunities associated with novel field and data exploration methods that explore the hot moments present in high-frequency soil N2O data. We discuss the advantages, disadvantages and applications of automated CRDS flux systems. We additionally outline strategies for analyzing and scaling high-frequency soil N2O emissions data. Finally, we suggest areas for future research that leverage these emerging methods and experimental design paradigms to improve our understanding of N cycle processes and regional or global N2O budgets.
Field Instrumentation: Cavity Ring-Down Spectroscopy for Ecosystem Science Applications
Pioneer Research Advancement on Automated Chambers for Greenhouse Gas Flux Measurements
The first automated system for measuring GHG fluxes was designed by Silvola et al. (1992). This method consisted of six chambers with pneumatic open and close valves. When GHG fluxes were measured, the selected chamber closed, a pump circulated air through the chamber and to a mobile lab located 50 meters away. An aliquot of the chamber air was injected into a gas chromatograph (GC) at 5-min intervals for the 20 min of chamber closure. The GC included thermal conductivity, electron capture and flame ionization detectors for measuring CO2, N2O and CH4 concentrations, respectively. Also during that time, flux gradient measurements by Fourier Transform Infrared spectroscopy (FTIR) showed that CO2, N2O and CH4 could be measured at large scale from agricultural land (Griffith and Galle, 2000). The increased frequency of measurements obtained by pioneer automated chamber research (Table 1) allowed the capture of diurnal variations and enhanced both our understanding of microbial processes responsible for soil GHG fluxes and the physicochemical variables related to them.
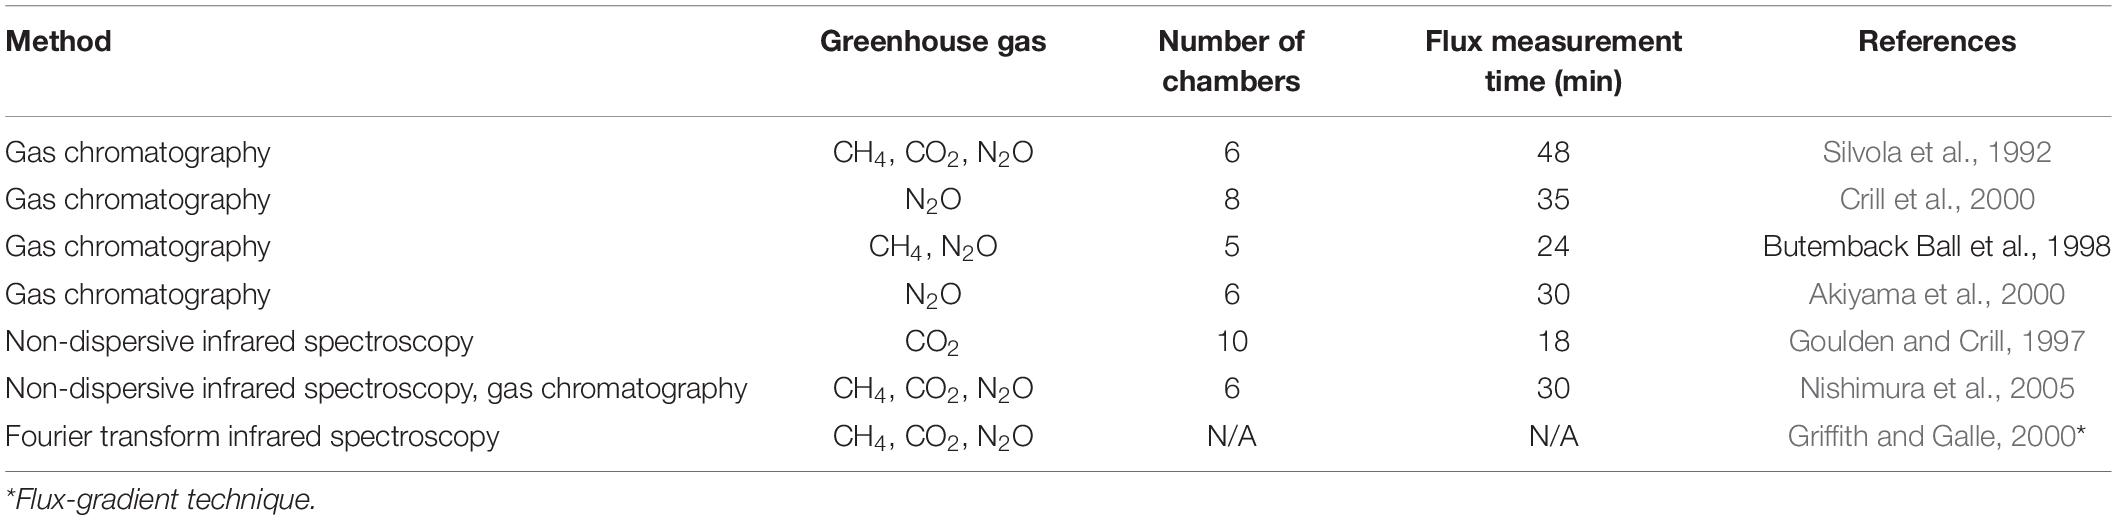
Table 1. Pioneer methods for automated greenhouse gas flux measurements.
Advantages and Disadvantages of Automated and Manual Chamber Systems
The deployment of automated chambers using fast response spectroscopic methods (i.e., CRDS, FTIR, among others) further increases the potential frequency of soil GHG fluxes. These methods also have a number of advantages over manual GC flux measurements (Christiansen et al., 2015; Brannon et al., 2016; Lebegue et al., 2016; Keane et al., 2018; O’Connell et al., 2018; Barba et al., 2019; Courtois et al., 2019; Anthony and Silver, 2021). Current CRDS automated chamber system flux measurement time is about 10 min, at least a third shorter than previous automated chamber systems (Table 1). Additionally, manual chambers are highly labor intensive, limiting the number of individual flux measurements possible (Pattey et al., 2007; Görres et al., 2016), and they have much lower temporal sensitivity given the significantly longer sampling times required (>30 min/flux). This infrequent sampling also has the potential to overlook event-based, diurnal and day-to-day variability (Reeves et al., 2016). Many manual chamber flux measurements are taken weekly or monthly (Teh et al., 2011; Matson et al., 2017; Krichels and Yang, 2019); infrequent measurements can miss or underestimate hot moments of N2O flux (Barton et al., 2015; Reeves et al., 2016).
However, manual chamber measurements also have a number of advantages in comparison to automated chamber systems. These include the ability for widespread deployment across soil conditions and simpler deployment in remote ecosystems. They also have the ability to sample a large spatial area over a short period of time and have comparatively low analyzer costs (one central GC for subsequent sample analysis vs. an individual CRDS analyzer needed per field site) (Pattey et al., 2007; Rapson and Dacres, 2014; Görres et al., 2016; Grace et al., 2020). Additionally, to overcome the underestimations related to hot moments of N2O flux, strategic sampling integrating process modeling and statistical methods can substantially improve cumulative flux estimation accuracy using infrequent chamber-based methods (Saha et al., 2017).
The most important advantage of CRDS analyzers is the combination of high precision, resulting in a lower minimum detectable flux, with high measurement frequency, that allows for real-time flux determination. In conjunction with automated chambers, CRDS analyzers can continuously measure fluxes at a relatively high temporal frequency (Rapson and Dacres, 2014; Harris et al., 2020). Increasing the number of flux measurements enables capture of short-term N2O pulses, which can generate the bulk of environmentally relevant net N2O emissions to the atmosphere (Butterbach-Bahl et al., 2013; Savage et al., 2014). Automation also provides the ability to more accurately determine the magnitude and duration of N2O fluxes following N fertilization, irrigation, or other environmental disturbances (Grace et al., 2020). This is particularly important in ecosystems where manual chambers would be difficult to access or cause soil disturbances, which can be an issue with repeated manual sampling events during hot moments of significant N2O flux, including flooding or freeze-thaw events.
Further advancements in CRDS technology have also allowed for the measurement of stable isotope ratios and site preference in N2O molecules (Yoshida and Toyoda, 2000; Harris et al., 2020). Isotopic N2O and site-preference measurements can provide important information about the environmental sources of N2O production (e.g., nitrification vs. denitrification, soil N sources) (Decock and Six, 2013; Heil et al., 2014; Winther et al., 2018). With CRDS analyzers, these measurements can now be performed in situ, as some of these instruments can analyze the N2O isotopic composition in gaseous mixtures, providing real-time data with minimal sample pretreatment. These measurements can be used to better resolve the drivers of N2O production and consumption, previously impossible with non-optical measurement techniques.
The largest disadvantage of automated CRDS systems is the need for a stable, continuous power supply and the system’s significant energy demand (∼1 kWh), although energy-efficient portable CRDS analyzers have been developed to measure other trace gases (Jeffrey et al., 2019; Brachmann et al., 2020). This electrical demand limits the ability to continuously deploy these systems in remote locations. Generators or solar power have been used with CRDS in remote locations (e.g., savannah woodlands and tropical rainforests; Livesley et al., 2011; O’Connell et al., 2018; Courtois et al., 2019), but continuous deployment involves significant labor and/or travel costs needed to maintain instrumentation functionality. Deployment of CRDS technology is also hindered by instrumentation costs (systems are generally greater than $85k USD), equipment sensitivity to environmental conditions (e.g., high temperatures or humidity), and the difficulty of automated chamber deployment in complex, heterogenous field environments (Reeves et al., 2016; Grace et al., 2020). Additionally, the deployment of automated CRDS systems can be challenging when spectral interferences with other atmospheric constituents, particularly H2O, occur (Harris et al., 2020). Such interferences increase the challenges CRDS systems face in further constraining measurements of the soil N cycle (Kim et al., 2012), but can also be minimized with installation of in-line water traps (Erler et al., 2015; Murray et al., 2018; Figure 1).
Some of the other disadvantages to automated systems can be overcome by the simultaneous utilization of manual chamber measurements (Savage and Davidson, 2003). Manual chambers can help increase the extent of sampling across space during important flux measurement periods, increasing the ability to detect spatiotemporal variability. This combination can also be a useful approach in experiments where it is necessary to compare a large number of treatments, because the number of automated chambers per CRDS system is limited (Savage et al., 2014; Grace et al., 2020). To aid future experimental design, we provide a potential road map for the selection of appropriate methods. Manual chambers are recommended when budget, large number of treatments, remoteness, and access of land power are a constraint. If these constraints are overcome, automated chambers with spectroscopic methods are advisable. To capture hot spots of N2O emissions it may be necessary to combine manual measurements with an automated chamber system (Savage and Davidson, 2003). We recommend that automated chambers be placed in locations that are likely to capture hot moments of emissions (e.g., areas with fluctuating redox, high plant activity, or where fertilizer is applied heavily) with a similar number of automated chambers being placed in areas not expected to be predisposed to hot moments, in order to avoid biasing the overall dataset. Manual chambers, in contrast, could be used in likely hot spots (e.g., low lying areas and areas with soil compaction, poor diffusion or slow water infiltration) with, again, a similar number placed in areas suspected to not be hot spots. Further, it is common for automatic chambers to be deployed and remain in a fixed location throughout a field campaign, which can lead to bias in which micro-scale abiotic conditions are favored within a dataset. When field access is not limited, one solution to this potential bias would be to relocate automated stationary chambers at periodic intervals, though that comes with the disadvantage of losing data continuity in a given chamber location. We recommend a priori decisions about how often and where to move chambers (e.g., to a random set of sub-plot quadrats, seasonally, or quarterly) so as to avoid inserting bias toward within the captured data (e.g., by moving a chamber after a hot spot appears to “resolve” and thus skewing emissions data upwards).
Applications of Automated Cavity Ring-Down Spectroscopy Flux Systems
In general, the high temporal frequency of automated measurements greatly improves the ability to measure (and predict) the effects of soil management decisions or other environmentally relevant events. The increasing availability of automated CRDS systems has allowed for measurement of N2O fluxes and the ability to capture hot moments in mangrove forests (Murray et al., 2018), tropical rainforests (Courtois et al., 2019), desert (Eberwein et al., 2020), and during freeze-thaw cycles (Ruan and Robertson, 2016; Wagner-Riddle et al., 2017), drought events (O’Connell et al., 2018), soil rewetting events (Liang et al., 2016; Hemes et al., 2019; Liu et al., 2019), and fertilization application in agroecosystems (Savage et al., 2014; Cowan et al., 2020). Increased application of automated flux measurements using CRDS instrumentation may also increase observations of other short-term (hourly to multi-day) hot moments previously undetected from less frequent flux measurement techniques, including for other GHGs. For instance, correlation on hourly scales between soil temperature/moisture and GHG fluxes could constrain microbial mechanisms of soil GHG production, with implications for ecosystem-level estimates (i.e., Martin et al., 2012). Net ecosystem exchange (NEE) is affected by seasonal variability in plant activity (e.g., variability in root respiration and exudate production) (Curiel Yuste et al., 2007). Forest canopy photosynthesis affects ecosystem respiration but the timing of links between canopy photosynthesis and ecosystem respiration is not well understood (Mencuccini and Hölttä, 2010). In these two examples, high frequency soil CO2 fluxes could aid in accounting for the relative contribution of soil GHG fluxes to NEE. Future deployments of high-frequency systems, in combination with continuous ecosystem-scale eddy covariance flux measurements (Wagner-Riddle et al., 2017), may further constrain the specific importance of hot spots and/or hot moments on net ecosystem N2O (and other GHG) fluxes.
Data Applications: Leveraging High-Frequency Soil N2O Emissions Data
Constraining N Cycle Uncertainties
High-frequency soil N2O datasets require different data management strategies than those designed for traditional manual chamber experimental designs, due to both the large size of these datasets and the structure of the time-series data itself. Numerical modeling approaches have been developed to improve the precision of measured soil GHG fluxes in automated CRDS systems (Creelman et al., 2013). Increased precision combined with the improved temporal coverage of high-frequency data can substantially improve our understanding of N-cycling processes and budgets.
Year-round measurements of high-frequency N2O emissions can improve gap-filling methods by accounting for concurrent changes in multiple covariates (Dorich et al., 2020). For example, a recent study demonstrated that ignoring winter emissions from croplands subjected to freeze-thaw cycles can significantly underestimate global agricultural emissions (Wagner-Riddle et al., 2017). The use of a near-continuous flux gradient method, made possible by using a tunable-diode-laser (TDL) trace gas analyzer (Grace et al., 2020), was central to this finding: N2O data collection during winter using manual chambers was previously impractical or would highly perturb soil conditions. Edge season emissions associated with microbial decomposition of crop residues in intensive agricultural systems can also increase agricultural N2O emission (Scheer et al., 2017). During the growing season, fertilizer-derived N2O emissions can increase exponentially instead of the generally assumed linear functions conventionally used in the Intergovernmental Panel on Climate Change reports (Shcherbak et al., 2014; Gerber et al., 2016). Accurately accounting for these agricultural N2O emissions using high-frequency data can help close the global N budget and guide mitigation strategies (Mosier et al., 1998; Syakila and Kroeze, 2011).
High-precision pseudo-continuous measurement technologies also improve confidence in field measurements that observe net consumption of atmospheric N2O in soils. These observations, which have been seen in soils ranging from poorly drained wetlands to well-drained upland soils, could, in traditional methods, be discarded as measurement error or experimental noise (Chapuis-Lardy et al., 2007; Eugster et al., 2007; Goldberg and Gebauer, 2009; Schlesinger, 2013; Savage et al., 2014). The occurrence of net N2O reduction in well-drained soils warrants an improved understanding of spatial heterogeneity of anaerobic microsites where N2O can get reduced to N2 via biological denitrification (Parkin, 1987). Representation of spatial heterogeneity is crucial for upscaling mechanistic processes related to N2O production and consumption occurring at the aggregate scale to landscape, regional, and global scales (Ebrahimi and Or, 2018; Sihi et al., 2019). Mechanistic representations in process-based land-surface models of varying complexity (Tian et al., 2018, 2020), an alternative of statistical extrapolation of field measurements, is a widely used bottom-up approach to quantify global N2O sources and sinks, which also rely on the availability and quality of open-source data.
Big Data Approaches and Model Integration
Several statistical strategies have been successful at integrating high-frequency soil N2O datasets into investigations at the regional, continental or global scales. The use of simple statistical models has led to contrasting and disparate national and global N2O budgets (Gerber et al., 2016). In contrast, Bayesian Markov Chain Monte Carlo algorithms offer the potential to unravel multiple confounding factors and improve predictions of high-frequency soil N2O fluxes by process-based biogeochemical models (Myrgiotis et al., 2018; Sihi et al., 2019). Alternatively, process-based models coupled with machine-learning approaches can be used to evaluate N2O dynamics and driver-response relationships in long-term high-frequency N2O data (Saha et al., 2021). Inequality indicators (e.g., Lorenz curve and Gini coefficient) have also been used to assess hot or cold spots or moments in soil N2O fluxes from high-frequency data collected from heterogeneous landscapes (Saha et al., 2018). Statistical methods used for hot-moment analysis of other time-series soil flux data, i.e., wavelet analysis, can also be used for identifying hot-moments in soil N2O fluxes (Liptzin et al., 2010; Vargas et al., 2018). These strategies have different computational demands, need differing levels and types of input data, operate either within or independently from process-based modeling frameworks, and have different levels of predictive power; determining the appropriate statistical approach for a given application can include assessing the quality of input data and considering the tractability of various statistical methods (Figure 2).
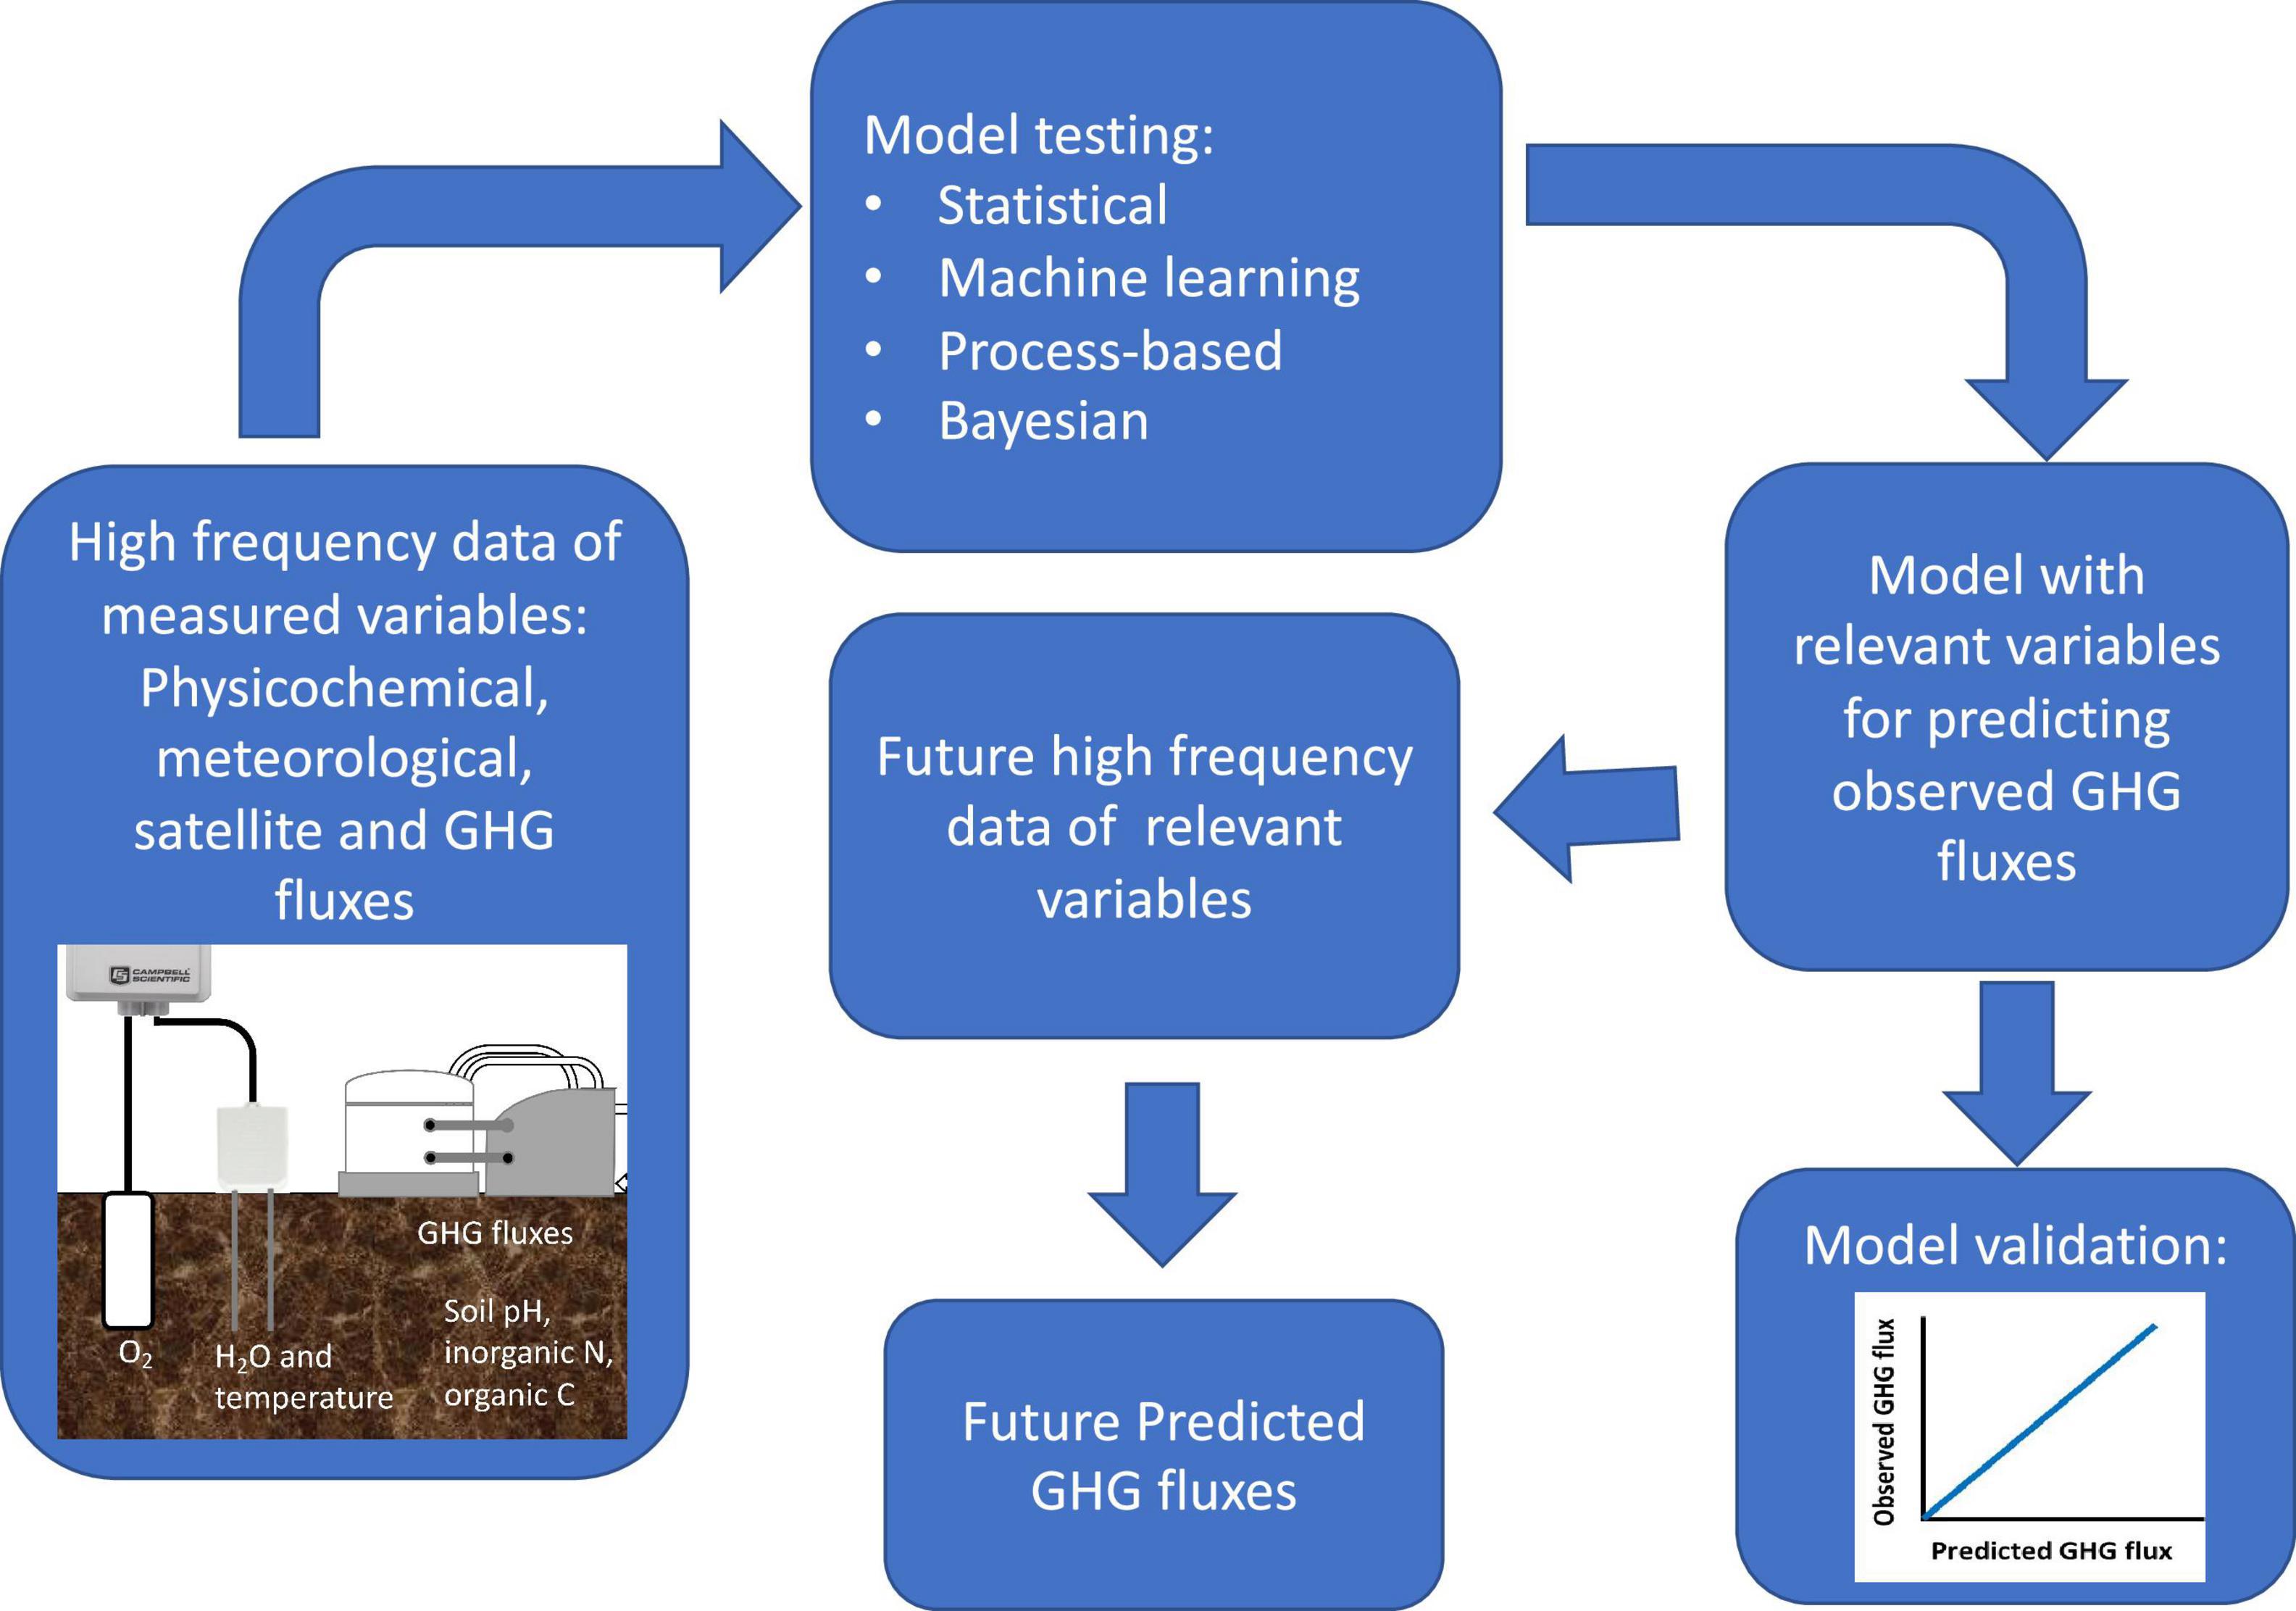
Figure 2. Diagram for testing effectiveness of available models to predict GHG fluxes. High frequency data of measured variables are required to test methods and rank them according to predictive power and computational cost.
The Global N2O Database (Dorich et al., 2020)1 holds promise to lower uncertainty in annual N2O estimates. It provides ample opportunities for future analysis and in-depth comparisons among different methods, crop types, and management practices (e.g., irrigation, tillage). Harmonization with other high-frequency open-source soil flux data like COntinuous SOil REspiration (COSORE; Bond Lamberty et al., 2020) data and collaboration with well-established ecosystem flux communities like AmeriFlux2 and FluxNet3 can potentially increase the user pool of the Global N2O Database and improve the flux processing pipelines and gap-filling algorithms. Institutional back-up, built-in analytical and statistical tools, availability of analysis scripts using open-source software, and an interactive web interface further encourage researchers to conduct advanced statistical analysis with long-term, high-frequency N2O data.
Future Directions
Rethinking Nitrogen Cycle Processes and Budgets
Hot spots and hot moments of soil N2O emissions can account for large proportions of total ecosystem N2O flux, with the proportion varying widely across systems and contexts (Groffman et al., 2009; Turner et al., 2016; Bernhardt et al., 2017). CRDS systems can be deployed alongside high-frequency sensors that measure abiotic soil variables [e.g., soil moisture, temperature and oxygen (O2), Figure 1]. Such designs can quantify the importance of soil N2O hot moments and what abiotic conditions correlate with those fluxes: in a Northern California grassland system, > 80% of the emitted N2O occurs during “hot moments” (Anthony and Silver, 2021). These studies thus far are uncommon, geographically biased, and not always conducted in biomes and regions shown to be globally important sources of N2O emissions (Bond Lamberty et al., 2020; Dorich et al., 2020). There is a critical need to deploy automated CRDS systems under more field conditions and across ecosystems to better quantify the importance of hot moments within the N cycle.
Measuring high N2O flux events in situ provides an excellent template to explore the molecular and microbial dynamics of N2O production and consumption in soils. With the proliferation of high-frequency soil N2O emissions data, laboratory incubation experiments (using natural abundance stable isotopes or 13C or 15N labeled substrates) would allow us to better understand the microbial processes associated with these high fluxes (Kuzyakov and Blagodatskaya, 2015). For example, pool dilution techniques allow for the determination of gross rates of N2O production and consumption under simulated field conditions (Yang et al., 2012) which would help produce better estimates of denitrification-derived N2 fluxes to the atmosphere. Tools from microbial ecology and bioinformatics may also be able to improve experimental design and guide the deployment of automated chambers (Kuzyakov and Blagodatskaya, 2015). Finally, metagenomic and other high-resolution techniques can be useful to identify microbial functional types associated with the spatial or temporal configuration of N2O fluxes.
This work is especially critical in agricultural systems. Anthropogenic global N2O sources related to fertilizer applications are responsible for 30% of the tropospheric N2O concentration increase in the past 4 decades (Tian et al., 2020). Measurements of the isotopic composition of N2O in the global atmosphere combined with knowledge of the “isotopic fingerprints” of N2O sources (e.g., soils, freshwater, and oceans) and sinks (e.g., stratospheric photolysis and photooxidation) have been used in both “bottom up” and “top down” approaches to explain the current increase in global tropospheric N2O concentrations (Pérez et al., 2001; Park et al., 2012; Snider et al., 2015; Prokopiou et al., 2018). Changes over time show increased atmospheric N2O is largely due to increased fertilizer use in agriculture, as expected (Pérez et al., 2001; Park et al., 2012; Prokopiou et al., 2018). Continuous CRDS measurements of N2O isotopic composition from agricultural systems can capture the N2O isotopic fingerprint of high flux events, which can constrain the relative contribution of fertilizer-derived N2O from background emissions rates.
Pairing High-Frequency Data Collection With Modeling Approaches
Numerous opportunities exist to improve input data for models. High-frequency soil N2O flux data can be used to better validate modeled GHG fluxes predictions from natural or agricultural systems. Available models (e.g., Daycent, DNDC, and EPIC) often use static chamber soil GHG measurements as validation data, which can lead to underestimation of landscape N2O fluxes, likely due to an underestimation of the magnitude of peak daily fluxes (Gaillard et al., 2018). High-frequency data with better estimates of peak daily fluxes can improve estimates of N2O emissions; improved N2O emissions data can also improve the underlying statistical relationships upon which these models rely (Bond Lamberty et al., 2020; Dorich et al., 2020).
Recent advances in machine learning (ML) models for predicting N2O soil fluxes have been shown to improve outputs derived from process-based modeling (Saha et al., 2021). However, when comparing classical regression, shallow learning, and deep learning ML model performances, only the heavy computational deep neural network Long Short-Term Memory (LSTP) model is successful in predicting N2O fluxes from agriculture using a static chamber data time series as the input (Hamrani et al., 2020). The low performance of the other ML algorithms could be related to the intrinsic characteristic of the method. As an example, random forest machine learning applied to a dataset that had both automated chambers and continuous measurements of soil volumetric content gave the same generalized validation (R2 = 0.38) (Saha et al., 2021) as one obtained by other studies that had both static chamber N2O fluxes and discrete soil physicochemical measurements (R2 values between 0.37 and 0.39, Hamrani et al., 2020; Glenn et al., 2021). Therefore, to better assess N2O flux prediction robustness of available models (ML algorithms, statistical, process-based and Bayesian modeling approaches), high frequency data of both N2O fluxes and measured variables (physicochemical, micro and macro-meteorological, spectral, etc.) would be required. This could be more achievable as new high frequency technology for measuring physicochemical variables such as pH, NH4+ and NO3– become available (Figure 2).
High frequency measurements of driving variables are needed as inputs to ML models. Moisture, temperature, and O2 sensors with sufficient capacity are widely available and have been used in a large number of studies (i.e., O’Connell et al., 2018;Anthony and Silver, 2021). The high cost of environmental sensors currently limits their widespread adoption and use. CRDS systems typically cost over $85k USD and automated chambers can be ∼$3–10k USD each depending on their features. Soil sensors (e.g., O2, moisture, temperature) also tend to be costly, often several hundred dollars per sensor with high spatial replication needed to capture plot-scale variability. New printable sensor technology has the potential to make advances not only in the variables mentioned above, but also in measurements of inorganic nitrogen species (i.e., substrates for N2O production in nitrification and denitrification processes). They have the potential to drastically lower costs and increase replication in the future (Sui et al., 2021).
Broadly, increasing the accuracy, precision and temporal coverage of soil N2O flux estimates along with other relevant variables across time and ecosystems will be crucial for scaling observational work and incorporating climate feedbacks into global models. Global change will likely alter soil N2O emissions in intersectional ways, both as climate and agricultural management change (Griffis et al., 2017). Novel field and data exploration methods that can better observe hot moments of soil N2O flux can be leveraged to constrain our understanding of the N cycle as well as improve our ability to predict landscape-level GHG feedbacks under global change conditions.
Conclusion
Utilizing novel field and data exploration methods to explore hot spots and especially hot moments in high-frequency soil GHG data has the potential to transform our ability to measure, analyze and predict patterns of soil greenhouse gas, and especially N2O, emissions from terrestrial ecosystems. While there are currently substantial challenges involved, this technology is rapidly evolving. Future research should seek to further constrain our understanding of N cycling dynamics via high-frequency data collection across ecosystem type, region, disturbance regime, and under global change scenarios. These efforts are crucial to test and validate ecosystem modeling approaches, to improve the geographic representation of field-based datasets of soil N2O emissions, and to enhance our understanding of the processes and patterns that underlie the terrestrial N cycle.
Author Contributions
All authors listed have made a substantial, direct, and intellectual contribution to this work as well as contributed to the writing of the manuscript.
Funding
DS acknowledges support from U.S. Department of Energy (DOE) Environmental System Science Program (DE-SC0022314), NSF Macrosystem Biology and NEON-Enabled Science Program (DEB-2106137), University Research Council and Halle Institute for Global Research and the Halle Foundation Collaborative Research Grant at Emory University. This work was supported by an NSF grant to WS (DEB-1457805), as well as the NSF sponsored Luquillo CZO (EAR-1331841 and EAR-0722476) and LTER (DEB-0620910). Additional support was provided by the DOE grant TES-DE-FOA-0000749 and the USDA National Institute of Food and Agriculture, McIntire Stennis project CA-B-ECO-7673-MS to WS. We are grateful for funding from Betsy Taylor, The Jena and Michael King Foundation, The Band Foundation, The V. K. Rasmussen Foundation, The Trisons Foundation, Oak Creek Foundation, The Rathmann Family Foundation, a grant from the California Strategic Growth Council to WS, a UC Lab Fees Grant to WS, and funding from the UCOP Sustainability Program, California Department of Water Resources, Grant/Award No. 4600011240; California Sea Grant, Grant/Award No. R/SF-89; Delta Stewardship Council, Grant/Award No. 5298. TA was supported by the California Sea Grant Delta Science Fellowship. This material was based upon work supported by the Delta Stewardship Council Delta Science Program under Grant No. 5298 and California Sea Grant College Program Project R/SF-89. This work was also supported through an Early Career Award to MM through the U.S. DOE Biological and Environmental Research Program.
Author Disclaimer
The contents of this material do not necessarily reflect the views and policies of the Delta Stewardship Council or California Sea Grant, nor does mention of trade names or commercial products constitute endorsement or recommendation for use.
Licenses and Permissions
This manuscript has been authored by UT-Battelle, LLC, under contract DE-AC05-00OR22725 with the U.S. Department of Energy (DOE). The US government retains and the publisher, by accepting the article for publication, acknowledges that the US government retains a nonexclusive, paidup, irrevocable, worldwide license to publish or reproduce the published form of this manuscript, or allow others to do so, for US government purposes. DOE will provide public access to these results of federally sponsored research in accordance with the DOE Public Access Plan (http://energy.gov/downloads/doe-public-accessplan).
Conflict of Interest
The authors declare that the research was conducted in the absence of any commercial or financial relationships that could be construed as a potential conflict of interest.
Publisher’s Note
All claims expressed in this article are solely those of the authors and do not necessarily represent those of their affiliated organizations, or those of the publisher, the editors and the reviewers. Any product that may be evaluated in this article, or claim that may be made by its manufacturer, is not guaranteed or endorsed by the publisher.
Acknowledgments
The authors thank Summer Ahmed, Heather Dang, Kris Daum, Gisela Gonzalez Pagán, Carla López Lloreda, Ryan Salladay, Jordan Stark, and Brian Yudkin for assistance with protocol development and field and lab support.
Footnotes
References
Akiyama, H., Tsuruta, H., and Watanabe, T. (2000). N2O and NO emissions from soils after the application of different chemical fertilizers. Chemosphere Glob. Change Sci. 2, 313–320.
Anthony, T. L., and Silver, W. L. (2021). Hot moments drive extreme nitrous oxide and methane emissions from agricultural peatlands. Glob. Change Biol. 27, 5141–5153. doi: 10.1111/gcb.15802
Barba, J., Poyatos, R., and Vargas, R. (2019). Automated measurements of greenhouse gases fluxes from tree stems and soils: magnitudes, patterns and drivers. Sci. Rep. 9:4005. doi: 10.1038/s41598-019-39663-8
Barcellos, D., O’Connell, C. S., Silver, W., Meile, C., and Thompson, A. (2018). Hot spots and hot moments of soil moisture explain fluctuations in iron and carbon cycling in a humid tropical forest soil. Soil Syst. 2, 59–22. doi: 10.3390/soilsystems2040059
Barton, L., Wolf, B., Rowlings, D., Scheer, C., Kiese, R., Grace, P., et al. (2015). Sampling frequency affects estimates of annual nitrous oxide fluxes. Sci. Rep. 5, 15912–15919. doi: 10.1038/srep15912
Bernhardt, E. S., Blaszczak, J. R., Ficken, C. D., Fork, M. L., Kaiser, K. E., and Seybold, E. C. (2017). Control points in ecosystems: moving beyond the hot spot hot moment concept. Ecosystems 20, 665–682. doi: 10.1007/s10021-016-0103-y
Bond Lamberty, B., Christianson, D. S., Malhotra, A., Pennington, S. C., Sihi, D., AghaKouchak, A., et al. (2020). COSORE: a community database for continuous soil respiration and other soil−atmosphere greenhouse gas flux data. Glob. Change Biol. 26, 7268–7283. doi: 10.1111/gcb.15353
Brachmann, C. G., Hernandez-Ramirez, G., and Hik, D. S. (2020). CH4 uptake along a successional gradient in temperate alpine soils. Biogeochemistry 147, 109–123. doi: 10.1007/s10533-019-00630-0
Brannon, E. Q., Moseman-Valtierra, S. M., Rella, C. W., Martin, R. M., Chen, X., and Tang, J. (2016). Evaluation of laser-based spectrometers for greenhouse gas flux measurements in coastal marshes. Limnol. Oceanogr. Methods 14, 466–476. doi: 10.1002/lom3.10105
Butterbach-Bahl, K., Baggs, E. M., Dannenmann, M., Kiese, R., and Zechmeister-Boltenstern, S. (2013). Nitrous oxide emissions from soils: how well do we understand the processes and their controls? Philos. Trans. R. Soc. Lond. B Biol. Sci. 368, 20130122–20130113. doi: 10.1098/rstb.2013.0122
Chapuis-Lardy, L., Wrage, N., Metay, A., Chotte, J.-L., and Bernoux, M. (2007). Soils, a sink for N2O? a review. Glob. Change Biol. 13, 1–17.
Christiansen, J. R., Outhwaite, J., and Smukler, S. M. (2015). Comparison of CO2, CH4 and N2O soil-atmosphere exchange measured in static chambers with cavity ring-down spectroscopy and gas chromatography. Agric. For. Meteorol. 21, 48–57. doi: 10.1016/j.agrformet.2015.06.004
Courtois, E. A., Stahl, C., Burban, B., Van den Berge, J., Berveiller, D., Bréchet, L., et al. (2019). Automatic high-frequency measurements of full soil greenhouse gas fluxes in a tropical forest. Biogeosciences 16, 785–796. doi: 10.5194/bg-16-785-2019
Cowan, N., Levy, P., Maire, J., Coyle, M., Leeson, S. R., Famulari, D., et al. (2020). An evaluation of four years of nitrous oxide fluxes after application of ammonium nitrate and urea fertilisers measured using the eddy covariance method. Agric. For. Meteorol. 280:107812. doi: 10.1016/j.agrformet.2019.107812
Crill, P. M., Keller, M., Weitz, A., Grauel, B., and Veldkamp, E. (2000). Intensive field measurements of nitrous oxide emissions from a tropical agricultural soil. Glob. Biogeochem. Cycles 14, 85–95.
Creelman, C., Nickerson, N., and Risk, D. (2013). Quantifying lateral diffusion error in soil carbon dioxide respiration estimates using numerical modeling. Soil Sci. Soc. Am. J. 77, 699–708. doi: 10.2136/sssaj2012.0352
Curiel Yuste, J., Baldocchi, D. D., Gershenson, A., Goldstein, A., Misson, L., and Wong, S. (2007). Microbial soil respiration and its dependency on carbon inputs, soil temperature and moisture. Glob. Change Biol. 13, 2018–2035. doi: 10.1111/j.1365-2486.2007.01415.x
Decock, C., and Six, J. (2013). On the potential of δ 18O and δ 15N to assess N2O reduction to N2 in soil. Eur. J. Soil Sci. 64, 610–620.
Diefenderfer, H. L., Cullinan, V. I., Borde, A. B., Gunn, C. M., and Thom, R. M. (2018). High-frequency greenhouse gas flux measurement system detects winter storm surge effects on salt marsh. Glob. Change Biol. 24, 5961–5971. doi: 10.1111/gcb.14430
Dorich, C. D., Conant, R. T., Albanito, F., Butterbach-Bahl, K., Grace, P., Scheer, C., et al. (2020). Improving N2O emission estimates with the global N2O database. Curr. Opin. Environ. Sustain. 47, 13–20. doi: 10.1016/j.cosust.2020.04.006
Eberwein, J. R., Homyak, P. M., Carey, C. J., Aronson, E. L., and Jenerette, G. D. (2020). Large nitrogen oxide emission pulses from desert soils and associated microbiomes. Biogeochemistry 149, 239–250. doi: 10.1007/s10533-020-00672-9
Ebrahimi, A., and Or, D. (2018). On upscaling of soil microbial processes and biogeochemical fluxes from aggregates to landscapes. J. Geophys. Res. Biogeosci. 123, 1526–1547. doi: 10.1029/2017jg004347
Erler, D. V., Duncan, T. M., Murray, R., Maher, D. T., Santos, I. R., Gatland, J. R., et al. (2015). Applying cavity ring-down spectroscopy for the measurement of dissolved nitrous oxide concentrations and bulk nitrogen isotopic composition in aquatic systems: Correcting for interferences and field application. Limnol. Oceanogr. Methods 13, 391–401. doi: 10.1002/lom3.10032
Eugster, W., Zeyer, K., Zeeman, M., Michna, P., Zingg, A., Buchmann, N., et al. (2007). Methodical study of nitrous oxide eddy covariance measurements using quantum cascade laser spectrometery over a Swiss forest. Biogeosciences 4, 927–939. doi: 10.5194/bg-4-927-2007
Gaillard, R. K., Jones, C. D., Ingraham, P., Collier, S., Izaurralde, R. C., Jokela, W., et al. (2018). Underestimation of N2O emissions in a comparison of the DayCent, DNDC, and EPIC models. Ecol. Appl. 28, 694–708. doi: 10.1002/eap.1674
Gerber, J. S., Carlson, K. M., Makowski, D., Mueller, N. D., Garcia de Cortazar-Atauri, I., Havlík, P., et al. (2016). Spatially explicit estimates of N2O emissions from croplands suggest climate mitigation opportunities from improved fertilizer management. Glob. Change Biol. 22, 3383–3394. doi: 10.1111/gcb.13341
Glenn, A. J., Moulin, A. P., Roy, A. K., and Wilson, H. F. (2021). Soil nitrous oxide emissions from no-till canola production under variable rate nitrogen fertilizer management. Geoderma 385:114857. doi: 10.1016/j.geoderma.2020.114857
Goldberg, S. D., and Gebauer, G. (2009). Drought turns a Central European Norway spruce forest soil from an N2O source to a transient N2O sink. Glob. Change Biol. 15, 850–860. doi: 10.1111/j.1365-2486.2008.01752.x
Görres, C. M., Kammann, C., and Ceulemans, R. (2016). Automation of soil flux chamber measurements: potentials and pitfalls. Biogeosciences 13, 1949–1966. doi: 10.5194/bg-13-1949-2016
Goulden, M. L., and Crill, P. M. (1997). Automated measurements of CO2 exchange at the moss surface of a black spruce forest. Tree Physiol. 17, 537–542.
Grace, P. R., Weerden, T. J., Rowlings, D. W., Scheer, C., Brunk, C., Kiese, R., et al. (2020). Global research alliance N2O chamber methodology guidelines: considerations for automated flux measurement. J. Environ. Qual. 49, 1126–1140. doi: 10.1002/jeq2.20124
Griffis, T. J., Chen, Z., Baker, J. M., Wood, J. D., Millet, D. B., Lee, X., et al. (2017). Nitrous oxide emissions are enhanced in a warmer and wetter world. PNAS 114, 12081–12085. doi: 10.1073/pnas.1704552114
Griffith, D. W. T., and Galle, B. (2000). Flux measurements of NH3, N2O and CO2 using dual beam FTIR spectroscopy and the flux-gradient technique. Atmos. Environ. 34, 1087–1098. doi: 10.1016/s1352-2310(99)00368-4
Groffman, P. M., Butterbach-Bahl, K., Fulweiler, R. W., Gold, A. J., Morse, J. L., Stander, E. K., et al. (2009). Challenges to incorporating spatially and temporally explicit phenomena (hotspots and hot moments) in denitrification models. Biogeochemistry 93, 49–77. doi: 10.1007/s10533-008-9277-5
Hamrani, A., Akbarzadeh, A., and Madramootoo, C. A. (2020). Machine learning for predicting greenhouse gas emissions from agricultural soils. Sci. Total Environ. 741:140338. doi: 10.1016/j.scitotenv.2020.140338
Harris, S. J., Liisberg, J., Xia, L., Wei, J., Zeyer, K., Yu, L., et al. (2020). N2O isotopocule measurements using laser spectroscopy: analyzer characterization and intercomparison. Atmos. Meas. Tech. 13, 2797–2831. doi: 10.5194/amt-13-2797-2020
Heil, J., Wolf, B., Brüggemann, N., Emmenegger, L., Tuzson, B., Vereecken, H., et al. (2014). Site-specific 15N isotopic signatures of abiotically produced N2O. Geochim. Cosmochim. Acta 139, 72–82. doi: 10.1016/j.gca.2014.04.037
Hemes, K. S., Chamberlain, S. D., Eichelmann, E., Anthony, T., Valach, A., Kasak, K., et al. (2019). Assessing the carbon and climate benefit of restoring degraded agricultural peat soils to managed wetlands. Agric. For. Meteorol. 268, 202–214. doi: 10.1016/j.agrformet.2019.01.017
Jeffrey, L. C., Reithmaier, G., Sippo, J. Z., Johnston, S. G., Tait, D. R., Harada, Y., et al. (2019). Are methane emissions from mangrove stems a cryptic carbon loss pathway? Insights from a catastrophic forest mortality. New Phytol. 224, 146–154. doi: 10.1111/nph.15995
Keane, B. J., Ineson, P., Vallack, H. W., Blei, E., Bentley, M., Howarth, S., et al. (2018). Greenhouse gas emissions from the energy crop oilseed rape (Brassica napus); the role of photosynthetically active radiation in diurnal N2O flux variation. GCB Bioenergy 10, 306–319. doi: 10.1111/gcbb.12491
Kim, D. G., Vargas, R., Bond-Lamberty, B., and Turetsky, M. R. (2012). Effects of soil rewetting and thawing on soil gas fluxes: a review of current literature and suggestions for future research. Biogeosciences 9, 2459–2483. doi: 10.5194/bg-9-2459-2012
Krichels, A. H., and Yang, W. H. (2019). Dynamic controls on field−scale soil nitrous oxide hot spots and hot moments across a microtopographic gradient. J. Geophys. Res. Biogeosci. 124, 3618–3634. doi: 10.1029/2019jg005224
Kuzyakov, Y., and Blagodatskaya, E. (2015). Microbial hotspots and hot moments in soil: Concept & review. Soil Biol. Biochem. 83, S29–S36.
Lebegue, B., Schmidt, M., Ramonet, M., Wastine, B., Yver Kwok, C., Laurent, O., et al. (2016). Comparison of nitrous oxide (N2O) analyzers for high-precision measurements of atmospheric mole fractions. Atmos. Meas. Tech. 9, 1221–1238. doi: 10.5194/amt-9-1221-2016
Liang, L. L., Grantz, D. A., and Jenerette, G. D. (2016). Multivariate regulation of soil CO2 and N2O pulse emissions from agricultural soils. Glob. Change Biol. 22, 1286–1298. doi: 10.1111/gcb.13130
Liptzin, D., Silver, W. L., and Detto, M. (2010). Temporal dynamics in soil oxygen and greenhouse gases in two humid tropical forests. Ecosystems 14, 171–182. doi: 10.1007/s10021-010-9402-x
Liu, H., Zak, D., Rezanezhad, F., and Lennartz, B. (2019). Soil degradation determines release of nitrous oxide and dissolved organic carbon from peatlands. Environ. Res. Lett. 14, 94009–94010.
Livesley, S. J., Grover, S., Hutley, L. B., Jamali, H., Butterbach-Bahl, K., Fest, B., et al. (2011). Seasonal variation and fire effects on CH4, N2O and CO2 exchange in savanna soils of northern Australia. Agric. For. Meteorol. 151, 1440–1452. doi: 10.1016/j.agrformet.2011.02.001
Martin, J. G., Phillips, C. L., Schmidt, A., Irvine, J., and Law, B. E. (2012). High-frequency analysis of the complex linkage between soil CO(2) fluxes, photosynthesis and environmental variables. Tree Physiol. 32, 49–64. doi: 10.1093/treephys/tpr134
Matson, A. L., Corre, M. D., Langs, K., and Veldkamp, E. (2017). Soil trace gas fluxes along orthogonal precipitation and soil fertility gradients in tropical lowland forests of Panama. Biogeosciences 14, 3509–3524. doi: 10.5194/bg-14-3509-2017
Mencuccini, M., and Hölttä, T. (2010). The significance of phloem transport for the speed with which canopy photosynthesis and belowground respiration are linked. New Phytol. 185, 189–203. doi: 10.1111/j.1469-8137.2009.03050.x
Molodovskaya, M., Singurindy, O., Richards, B. K., Warland, J., Johnson, M. S., and Steenhuis, T. S. (2012). Temporal variability of nitrous oxide from fertilized croplands: hot moment analysis. Soil Sci. Soc. Am. J. 76, 1728–1740. doi: 10.2136/sssaj2012.0039
Mosier, A., Kroeze, C., Nevison, C., Oenema, O., Seitzinger, S. P., and van Cleemput, O. (1998). Closing the global N2O budget: nitrous oxide emissions through the agricultural nitrogen cycle. Nutr. Cycl. Agroecosyst. 52, 225–248. doi: 10.1016/j.envpol.2018.11.016
Murray, R., Erler, D., Rosentreter, J., Maher, D., and Eyre, B. (2018). A seasonal source and sink of nitrous oxide in mangroves: insights from concentration, isotope, and isotopomer measurements. Geochim. Cosmochim. Acta 238, 169–192. doi: 10.1016/j.gca.2018.07.003
Myrgiotis, V., Williams, M., Topp, C. F. E., and Rees, R. M. (2018). Improving model prediction of soil N2O emissions through Bayesian calibration. Sci. Total Environ. 624, 1467–1477. doi: 10.1016/j.scitotenv.2017.12.202
Nishimura, S., Sudo, S., Akiyama, H., Yonemura, S., Yagi, K., and Tsuruta, H. (2005). Development of a system for simultaneous and continuous measurement of carbon dioxide, methane and nitrous oxide fluxes from croplands based on the automated closed chamber method. Soil Sci. Plant Nutr. 51, 557–564.
O’Connell, C. S., Ruan, L., and Silver, W. L. (2018). Drought drives rapid shifts in tropical rainforest soil biogeochemistry and greenhouse gas emissions. Nat. Commun. 9:1348. doi: 10.1038/s41467-018-03352-3
Park, S., Croteau, P., Boering, K. A., Etheridge, D. M., Ferretti, D., Fraser, P. J., et al. (2012). Trends and seasonal cycles in the isotopic composition of nitrous oxide since 1940. Nat. Geosci. 5, 261–265. doi: 10.1038/ngeo1421
Parkin, T. B. (1987). Soil microsites as a source of denitrification variability. Soil Sci. Soc. Am. J. 51, 1194–1199. doi: 10.2136/sssaj1987.03615995005100050019x
Parkin, T. B. (2008). Effect of sampling frequency on estimates of cumulative nitrous oxide emissions. J. Environ. Qual. 37, 1390–1395. doi: 10.2134/jeq2007.0333
Pattey, E., Edwards, G. C., Desjardins, R. L., Pennock, D. J., Smith, W., Grant, B., et al. (2007). Tools for quantifying N2O emissions from agroecosystems. Agric. For. Meteorol. 142, 103–119. doi: 10.1016/j.agrformet.2006.05.013
Pérez, T., Trumbore, S. E., Tyler, S. C., Matson, P. A., Monasterio, I. O., Rahn, T., et al. (2001). Identifying the agricultural imprint on the global N2O budget using stable isotopes. J. Geophys. Res. Atmos. 106, 9869–9878. doi: 10.1029/2000jd900809
Prokopiou, M., Sapart, C. J., Rosen, J., Sperlich, P., Blunier, T., Brook, E., et al. (2018). Changes in the isotopic signature of atmospheric nitrous oxide and its global average source during the last three millennia. J. Geophys. Res. Atmos. 123, 131–117. doi: 10.1007/978-94-007-5364-8_5
Rapson, T. D., and Dacres, H. (2014). Analytical techniques for measuring nitrous oxide. Trends Anal. Chem. 54, 65–74. doi: 10.1016/j.trac.2013.11.004
Reeves, S., and Wang, W. (2015). Optimum sampling time and frequency for measuring N2O emissions from a rain-fed cereal cropping system. Sci. Total Environ. 530–531, 219–226. doi: 10.1016/j.scitotenv.2015.05.117
Reeves, S., Wang, W., Salter, B., and Halpin, N. (2016). Quantifying nitrous oxide emissions from sugarcane cropping systems: optimum sampling time and frequency. Atmos. Environ. 136, 123–133. doi: 10.1016/j.atmosenv.2016.04.008
Ruan, L., and Robertson, G. P. (2016). Reduced snow cover increases wintertime nitrous oxide (n2o) emissions from an agricultural soil in the upper U.S. Midwest. Ecosystems 20, 917–927. doi: 10.1007/s10021-016-0077-9
Saha, D., Basso, B., and Robertson, G. P. (2021). Machine learning improves predictions of agricultural nitrous oxide (N2O) emissions from intensively managed cropping systems. Environ. Res. Lett. 16:024004. doi: 10.1088/1748-9326/abd2f3
Saha, D., Kemanian, A. R., Montes, F., Gall, H., Adler, P. R., and Rau, B. M. (2018). Lorenz curve and gini coefficient reveal hot spots and hot moments for nitrous oxide emissions. J. Geophys. Res. Biogeosci. 123, 193–206. doi: 10.1002/2017jg004041
Saha, D., Kemanian, A. R., Rau, B. M., Adler, P. R., and Montes, F. (2017). Designing efficient nitrous oxide sampling strategies in agroecosystems using simulation models. Atmos. Environ. 155, 189–198. doi: 10.1016/j.atmosenv.2017.01.052
Savage, K., Phillips, R., and Davidson, E. (2014). High temporal frequency measurements of greenhouse gas emissions from soils. Biogeosciences 11, 2709–2720. doi: 10.5194/bg-11-2709-2014
Savage, K. E., and Davidson, E. A. (2003). A comparison of manual and automated systems for soil CO2 flux measurements: trade-offs between spatial and temporal resolution. J. Exp. Bot. 54, 891–899. doi: 10.1093/jxb/erg121
Scheer, C., Rowlings, D., Firrell, M., Deuter, P., Morris, S., Riches, D., et al. (2017). Nitrification inhibitors can increase post-harvest nitrous oxide emissions in an intensive vegetable production system. Sci. Rep. 7:43677. doi: 10.1038/srep43677
Schlesinger, W. H. (2013). An estimate of the global sink for nitrous oxide in soils. Glob. Change Biol. 19, 2929–2931. doi: 10.1111/gcb.12239
Shcherbak, I., Millar, N., and Robertson, G. P. (2014). Global metaanalysis of the nonlinear response of soil nitrous oxide (N2O) emissions to fertilizer nitrogen. Proc. Natl. Acad. Sci. 111, 9199–9204. doi: 10.1073/pnas.1322434111
Sihi, D., Davidson, E. A., Savage, K. E., and Liang, D. (2019). Simultaneous numerical representation of soil microsite production and consumption of carbon dioxide, methane, and nitrous oxide using probability distribution functions. Glob. Change Biol. 26, 200–218. doi: 10.1111/gcb.14855
Silver, W. L., Lugo, A. E., and Keller, M. (1999). Soil oxygen availability and biogeochemistry along rainfall and topographic gradients in upland wet tropical forest soils. Biogeochemistry 44, 301–328. doi: 10.1007/bf00996995
Silvola, J., Martikainen, P., and Nykänen, H. (1992). A mobile automatic gas chromatograph system to measure CO2, CH4 and N2O fluxes from soil in the field. Suo 43, 263–266.
Smith, K. A., and Dobbie, K. E. (2001). The impact of sampling frequency and sampling times on chamber-based measurements of N2O emissions from fertilized soils. Glob. Change Biol. 7, 933–945. doi: 10.1046/j.1354-1013.2001.00450.x
Snider, D. M., Venkiteswaran, J. J., Schiff, S. L., and Spoelstra, J. (2015). From the ground up: global nitrous oxide sources are constrained by stable isotope values. (S Hu, Ed). PLoS One 10:e0118954. doi: 10.1371/journal.pone.0118954
Sui, Y., Atreya, M., Dahal, S., Gopalakrishnan, A., Khosla, R., and Whiting, G. L. (2021). Controlled biodegradation of an additively fabricated capacitive soil moisture sensor. ACS Sust. Chem. Eng. 9, 2486–2495. doi: 10.1021/acssuschemeng.0c07615
Syakila, A., and Kroeze, C. (2011). The global nitrous oxide budget revisited. Greenhouse Gas Measure. Manag. 1, 17–26. doi: 10.3763/ghgmm.2010.0007
Tallec, T., Brut, A., Joly, L., Dumelié, N., Serça, D., Mordelet, P., et al. (2019). N2O flux measurements over an irrigated maize crop: a comparison of three methods. Agric. For. Meteorol. 264, 56–72. doi: 10.1016/j.agrformet.2018.09.017
Teh, Y. A., Silver, W. L., Sonnentag, O., Detto, M., Kelly, M., and Baldocchi, D. D. (2011). Large greenhouse gas emissions from a temperate peatland pasture. Ecosystems 14, 311–325. doi: 10.1007/s10021-011-9411-4
Tian, H., Xu, R., Canadell, J. G., Thompson, R. L., Winiwarter, W., Suntharalingam, P., et al. (2020). A comprehensive quantification of global nitrous oxide sources and sinks. Nature 586, 248–256. doi: 10.1038/s41586-020-2780-0
Tian, H., Yang, J., Lu, C., Xu, R., Canadell, J. G., Jackson, R. B., et al. (2018). The global N2O model intercomparison project. Bull. Am. Meteorol. Soc. 99, 1231–1251. doi: 10.5194/acp-18-16155-2018
Turner, P. A., Griffis, T. J., Mulla, D. J., Baker, J. M., and Venterea, R. T. (2016). A geostatistical approach to identify and mitigate agricultural nitrous oxide emission hotspots. Sci. Total Environ. 572, 442–449. doi: 10.1016/j.scitotenv.2016.08.094
Vargas, R., Sánchez-Cañete, P. E., Serrano-Ortiz, P., Curiel Yuste, J., Domingo, F., López-Ballesteros, A., et al. (2018). Hot-moments of soil CO2 efflux in a water-limited grassland. Soil Syst. 2, 47–18. doi: 10.3390/soilsystems2030047
Wagner-Riddle, C., Baggs, E. M., Clough, T., Fuchs, K., and Petersen, S. O. (2020). Mitigation of nitrous oxide emissions in the context of nitrogen loss reduction from agroecosystems: managing hot spots and hot moments. Curr. Opin. Environ. Sustain. 47, 46–53. doi: 10.1016/j.cosust.2020.08.002
Wagner-Riddle, C., Congreves, K. A., Abalos, D., Berg, A. A., Brown, S. E., Ambadan, J. T., et al. (2017). Globally important nitrous oxide emissions from croplands induced by freeze–thaw cycles. Nat. Geosci. 10, 279–283. doi: 10.1038/ngeo2907
Winther, M., Balslev-Harder, D., Christensen, S., Priemé, A., Elberling, B., Crosson, E., et al. (2018). Continuous measurements of nitrous oxide isotopomers during incubation experiments. Biogeosciences 15, 767–780. doi: 10.5194/bg-15-767-2018
Yang, W. H., Weber, K. A., and Silver, W. L. (2012). Nitrogen loss from soil through anaerobic ammonium oxidation coupled to iron reduction. Nat. Geosci. 5, 538–541. doi: 10.1038/ngeo1530
Keywords: soil nitrous oxide emissions, novel methods, high-frequency data, hot spots and hot moments, nitrogen cycling, soil greenhouse gas
Citation: O’Connell CS, Anthony TL, Mayes MA, Pérez T, Sihi D and Silver WL (2022) Utilizing Novel Field and Data Exploration Methods to Explore Hot Moments in High-Frequency Soil Nitrous Oxide Emissions Data: Opportunities and Challenges. Front. For. Glob. Change 5:674348. doi: 10.3389/ffgc.2022.674348
Received: 01 March 2021; Accepted: 10 February 2022;
Published: 24 May 2022.
Edited by:
Michelle Y. Wong, Cary Institute of Ecosystem Studies, United StatesReviewed by:
Debasish Saha, The University of Tennessee, Knoxville, United StatesYit Arn Teh, Newcastle University, United Kingdom
Copyright © 2022 O’Connell, Anthony, Mayes, Pérez, Sihi and Silver. This is an open-access article distributed under the terms of the Creative Commons Attribution License (CC BY). The use, distribution or reproduction in other forums is permitted, provided the original author(s) and the copyright owner(s) are credited and that the original publication in this journal is cited, in accordance with accepted academic practice. No use, distribution or reproduction is permitted which does not comply with these terms.
*Correspondence: Christine S. O’Connell, coconnell@macalester.edu