Modeling the Carbon Cost of Plant Nitrogen and Phosphorus Uptake Across Temperate and Tropical Forests
 Kara Allen
 Joshua B. Fisher
 Richard P. Phillips
 Jennifer S. Powers
 Edward R. Brzostek
- 1Manaaki Whenua—Landcare Research, Lincoln, New Zealand
- 2Biology Department, West Virginia University, Morgantown, WV, United States
- 3Jet Propulsion Laboratory, California Institute of Technology, Pasadena, CA, United States
- 4Joint Institute for Regional Earth System Science and Engineering, University of California, Los Angeles, Los Angeles, CA, United States
- 5Department of Biology, Indiana University, Bloomington, IN, United States
- 6Department of Ecology, Evolution, and Behavior, University of Minnesota, St. Paul, MN, United States
- 7Department of Plant Biology, University of Minnesota, St. Paul, MN, United States
Nutrient limitation is a key source of uncertainty in predicting terrestrial carbon (C) uptake. Models have begun to include nitrogen (N) dynamics; however, phosphorus (P), which can also limit or colimit net primary production in many ecosystems, is currently absent in most models. To meet this challenge, we integrated P dynamics into a cutting-edge plant nutrient uptake model (Fixation and Uptake of Nitrogen: FUN 2.0) that mechanistically tracks the C cost of N uptake from soil based on the cost of allocating C to leaf resorption and root/root-microbial uptake and the availability of N in soil. We incorporated the direct C cost of P uptake, as well as an N cost of synthesizing phosphatase enzymes to extract P from soil, into a new model formulation (FUN 3.0). We confronted and validated FUN 3.0 against empirical estimates of canopy, root, and soil P pools from 45 temperate forest plots in Indiana, USA, and 18 tropical dry forest plots located in Guanacaste, Costa Rica, that vary in P availability and distribution of arbuscular mycorrhizal and ectomycorrhizal associated trees. FUN 3.0 was able to accurately predict N and P retranslocation across the temperate and tropical forest sites (slopes of 0.95 and 0.92 for P and N retranslocation, respectively). Carbon costs for acquiring P were three times higher in tropical forest sites compared to temperate forest sites, driving overall higher C costs in tropical sites. In addition, the N costs for acquiring P in tropical forest sites lead to a substantial increase in N fixation to support phosphatase enzyme production. Sensitivity analyses showed that tropical sites appeared to be severely P limited, while the temperate sites showed evidence for co-limitation by N and P. Collectively, FUN 3.0 provides a novel framework for predicting coupled N and P limitation that earth system models can leverage to enhance predictions of ecosystem response to global change.
Introduction
The response of the land carbon (C) sink to environmental changes (e.g., increasing atmospheric CO2, nitrogen deposition, warmer temperatures) is controlled by limitation of key nutrients, such as nitrogen (N) and phosphorus (P). Our ability to predict the extent to which environmental change will impact the future land C sink depends on how ecosystem models represent nutrient interactions within their structures (Wieder et al., 2015). Recent model developments have primarily focused on coupling C-N biogeochemical cycles (Zaehle et al., 2014) and have predicted significant reductions in global net primary productivity (NPP) under increasing atmospheric CO2 compared to C-climate–only models (Hungate et al., 2003; Thornton et al., 2007; Zaehle et al., 2010). Many of the C-N earth system models (ESMs) are parameterized to capture nutrient limitation in northern hemisphere forests, which tend to be most limited by N availability. However, in many terrestrial ecosystems, P can limit or colimit primary production, with consequences for ecosystem C cycling (Elser et al., 2007). As such, ESMs that consider C-N-P couplings should facilitate improved predictions of feedbacks to climate change (Fleischer et al., 2019).
Phosphorus is often presumed to limit primary production in tropical forests (e.g., Vitousek and Sandford, 1986; Crews et al., 1995; Tanner et al., 1998) owing to the presence of highly weathered soils and the absence of recent glacial deposits (Walker and Syers, 1976). Yet, evidence from fertilization experiments have shown that both N and P may control tropical forest productivity (Schulte-Uebbing and de Vries, 2017; Wright, 2019) and ecosystem processes (Powers et al., 2005; Waring et al., 2019). Moreover, the tight coupling of N and P cycles in the tropics (Reed et al., 2011) suggests that N and P co-limitation may be far more common than previously considered (Harpole et al., 2011). Given the substantial role tropical forests play in the global C cycle (Mitchard, 2018), the lack of model representations that include coupled C-N-P dynamics in these systems remains a key knowledge gap for projecting how forests will respond to climate change (Bonan, 2008; Reed et al., 2015). Thus, to accurately predict future changes in the land C sink, next-generation models need to incorporate coupled C-N-P dynamics.
Over the past few decades, a suite of global models have been developed to support C-N-P dynamics (see Achat et al., 2016), and by accounting for N and P limitation, these models project reductions in global NPP by as much as 25% (Wang et al., 2010; Goll et al., 2012; Yang et al., 2014), with some models predicting that within the next century the terrestrial biosphere will become a net C source (Wieder et al., 2015). Although these estimates could be considered a more accurate representation of C cycling under nutrient limitation, many of these models still lack explicit plant–microbial interactions that drive nutrient cycling (Achat et al., 2016; Jiang et al., 2019; Medvigy et al., 2019). Symbiotic mycorrhizal fungi often act as the liaison between plants and soil and effectively couple the C cycle with N and P cycles. Almost all terrestrial land plants associate with either arbuscular mycorrhizal (AM) or ectomycorrhizal (ECM) fungi, and these symbiotic associations provide a key uptake pathway for soil N and P (van der Heijden et al., 2015), using C as the main currency for nutrient acquisition. Based on empirical evidence and theory, ECM fungi are thought to be most beneficial to plants in N-limited environments, while AM fungi dominate in P-limited environments (Soudzilovskaia et al., 2019), with the potential to shift under elevated atmospheric CO2 where ECM fungi can be more sensitive to soil P (Terrer et al., 2019). Previous modeling efforts including both nutrient limitations and mycorrhizal strategies emphasize the important role these organisms play in allocating and storing C to maximize plant productivity (Fitter, 1991; Johnson et al., 1997; Meyer et al., 2010; Orwin et al., 2011). However, these modeling efforts maintain complex model structures that cannot be easily integrated into ESMs and in most cases focus on either AM associations or ECM associations only.
We sought to provide a foundation for incorporating P dynamics into an existing C economics optimization modeling framework that includes dynamic differences between AM and ECM mycorrhizal associations in their ability to acquire nutrients. The Fixation and Uptake of Nitrogen model (hereafter, FUN 2.0; Fisher et al., 2010; Brzostek et al., 2014) provides an ideal basis for exploring P uptake strategies, N-P interactions, and their associated C costs across a range of forested systems. FUN 2.0 is an isolated model subcomponent that can be run using empirical inputs but is ultimately designed to be easily coupled within larger ESMs due to parallels in input parameters. Versions or components of the FUN model have already been coupled with the Joint UK Environmental Land Simulator (Clark et al., 2011), the Land surface Processes and eXchanges model (Prentice et al., 2011), the Jena-Diversity model (Pavlick et al., 2013), the Community Land Model (CLM; Lawrence et al., 2019), and the Energy Exascale Earth System Model land model (ELM; Golaz et al., 2019). Here, we refined FUN 2.0 by incorporating P dynamics that mirror the existing model structure for N but also include interactions between N and P due to the N cost of producing P-acquiring enzymes (Treseder and Vitousek, 2001; Houlton et al., 2008). We validated the model using C-N-P budgets from both N-limited temperate and P-limited tropical forest sites. We then used the new model version, FUN 3.0, to investigate differences in N and P interactions and the consequences of reducing N vs. P limitation between temperate and tropical forest sites.
Materials and Methods
The Fixation and Uptake of Nitrogen Model
FUN 2.0 uses an optimal allocation framework that optimizes the C invested in growth vs. the C invested in acquiring N to support NPP (detailed description in Fisher et al., 2010 and Brzostek et al., 2014). To meet plant N demand, C gained from NPP is allocated to four N acquisition strategies: (1) mycorrhizal and (2) non-mycorrhizal uptake by roots via soil; (3) retranslocation of senescing leaves; and (4) N2 fixation. The amount of C transferred through each pathway and the resulting N return depend on its C cost and the mycorrhizal status of the system. The C cost of mycorrhizal and non-mycorrhizal root uptake varies as a function of soil N (i.e., availability) and fine root biomass (i.e., access). Arbuscular mycorrhizal root uptake is the least costly strategy when N is relatively abundant as AM fungi increase the surface area-to-volume ratio of the root system to enhance N scavenging (Phillips et al., 2013; Brzostek et al., 2014). Ectomycorrhizal root uptake is the least costly strategy when N is strongly limiting, as ECM fungi can actively mine N using enzymes that degrade soil organic matter (Phillips et al., 2013; Brzostek et al., 2014). Non-mycorrhizal root uptake occurs regardless of AM or ECM status, reflecting that not all roots of mycorrhizal-associated plants are colonized. The C cost of retranslocation increases as leaf N decreases due to diminishing returns. Finally, the C cost of N fixation by both symbiotic and free-living microbes in the rhizosphere is calculated as a function of temperature and does not take into account the distribution of N-fixing plants in the system (Houlton et al., 2008).
FUN 2.0 was specifically designed to be an optimal plant allocation subroutine that can easily be coupled into ESMs (Fisher et al., 2010). As such, the ESMs dynamically predict the relatively few model inputs necessary to drive FUN 2.0 (e.g., NPP, soil N, and leaf N; see Table S1). Then, FUN 2.0 feedbacks on the prediction of nutrient limitation in the ESMs by downregulating NPP owing to the C that plants invest to relieve N limitation. The optimal allocation framework of FUN 2.0 has been validated across six temperate forest sites, as well as for the temperate and tropical sites used in our current model simulations (see Model Validation and Figure S1) and has been coupled into CLM 4.0 and 5.0 (Brzostek et al., 2014; Shi et al., 2016, 2019; Fisher et al., 2019; Lawrence et al., 2019). Here, we take a similar approach to integrating and validating P dynamics in FUN 3.0 by using empirical data to drive the development of a subroutine that will rely on ESM predictions of plant and soil P pools (e.g., Yang et al., 2014) once it is fully coupled.
Integration of P Into the FUN Optimal Allocation Framework
To integrate P, we built upon the C cost framework in FUN 2.0 to dynamically predict the optimal allocation of C to acquire N and P simultaneously and also to incorporate an N cost of acquiring P due to the investment of N into phosphatase enzymes (Figure 1). Below, we describe the key model structures including the C cost of P acquisition equations, the integration of N and P dynamics, and the C and N allocation to phosphatase enzymes.
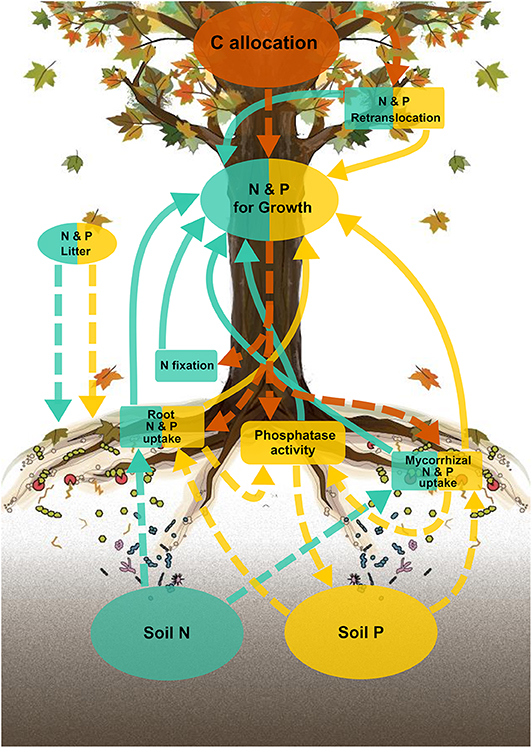
Figure 1. Schematic diagram of the active uptake pathways for the FUN 3.0 model. Carbon (C), nitrogen (N), and phosphorus (P) pools and uptake pathways are colored either orange, blue-green, or yellow, respectively. Boxes represent nutrient uptake pathways (either N or P), and circles represent C, N, and P pools. Solid lines represent N and P acquired for growth, and dashed lines represent C, N, and P allocated from associated pools.
P Dynamics in FUN 3.0
Phosphorus dynamics (Figure 1; yellow arrows, boxes, and circles) in FUN 3.0 mirrors the structure of N dynamics (Figure 1; blue arrows, boxes, and circles) in FUN 2.0. Carbon (Figure 1; orange arrows and circles) is optimally allocated to acquire P from soil using mycorrhizal root uptake and non-mycorrhizal root uptake fueled by phosphatase enzyme activity and from senescing leaves using retranslocation. Here, we briefly describe the key attributes of the model and provide the model input parameters (Table S1), cost parameters (Table S2), fixed parameters (Table S3), a more detailed description of the model equations (Appendix 1), and the model code, input, and output in the Supplementary Material.
At each time step, the model calculates the amount of P required (i.e., P demand) to support NPP by multiplying the NPP (CNPP) by the C-to-P ratio of the plant tissue (rC:P). Then, the model calculates the C cost of acquiring P to meet this P demand from the soil and from senescing leaves using the same cost structure functions for N in FUN 2.0. The C cost of active mycorrhizal and non-mycorrhizal root uptake of P from soil is calculated as a function of availability of soil P and the amount of fine root biomass that can access P:
where CostactiveP is the C cost to acquire P directly from the soil (e.g., from ELM's soil P pool; Yang et al., 2013), and kP and kCP are parameters that control the degree to which available soil P (Psoil) and fine root biomass (Croot) impact the C cost of active root uptake (Table S2). The parameters kP and kCP vary among non-mycorrhizal root uptake, AM root uptake, and ECM root uptake to account for differences in the costs between P-acquisition mechanisms used by each strategy (Raven et al., 2018). For example, the ECM cost parameter (EkP) is reduced in relation to the AM cost parameter (AkP) to reflect the greater efficiency of the C-intensive strategies ECM fungi use to acquire P at low concentrations (Raven et al., 2018). The mycorrhizal cost parameters are balanced to reproduce empirical thresholds across latitudinal and fertility gradients in P availability and root biomass where non-mycorrhizal, AM, or ECM root uptake of P is more advantageous to plant growth (Allen et al., 1995; Lilleskov et al., 2001; Phillips et al., 2013). The C cost for P retranslocation is calculated as function of leaf P (Pleaf):
where kRP is a parameter that controls the diminishing returns on C investment as foliar P decreases. In addition to C-mediated root uptake of P, the model also calculates the amount of P acquired passively through the transpiration stream (Ppassive).
Using the resistance network approach of FUN 2.0, C-P dynamics in the FUN 3.0 model simultaneously calculates a C cost integrated across all three P acquisition pathways (Costacqp) with more C flowing to the cheapest strategy and more P returning from the cheapest strategy. The resistance framework ensures that the plant optimizes P uptake using the least C costly combination of all three strategies.
Linkages Between N and P Dynamics
We integrated the P cost equations with the N cost equations in FUN 2.0 to dynamically predict the total C costs of N and P uptake. The combined model uses the same structure to calculate the N and P demand and the C cost of N and P uptake. We merged the optimization equations from FUN 2.0 with those equations mirrored for P. To optimize the C allocated to growth vs. the C allocated to N acquisition while maintaining stoichiometric constraints, the model simultaneously solves the following system of five equations and five unknowns:
where the C available for growth (Cgrowth) is a function of NPP (CNPP) minus the C expended to gain P (CacqP) or N (CacqN) to meet plant demand (Equation 3). The total N (Nacq) or P acquired (Pacq) is a function of the total C spent to gain N (CacqN) or P (CacqP) divided by the integrated resistance cost for N (CostacqN) or P (CostacqP) across all uptake pathways (Equations 4a,b). Finally, the model maintains stoichiometric constraints of N (rC:N) or P (rC:P) to C in plant biomass as a function of the C available to growth divided to total N (Npassive + Nacq) or P (Ppassive + Pacq) acquired passively through the transpiration stream or through root uptake and retranslocation (Equations 5a,b).
The FUN 3.0 model includes two additional linkages between N and P: (1) an N cost of P acquisition (NinvestP) to account for N required to produce phosphatase enzymes by roots and mycorrhizae and (2) phosphatase enzyme activity to increase access to P (Treseder and Vitousek, 2001; Wang et al., 2010). Given that C expended in the rhizosphere to both symbiotic and free-living microbes has been shown to enhance phosphatase activity (Spohn and Kuzyakov, 2013; Finzi et al., 2015), this model version calculates the N investment in phosphatase enzymes by assuming that the C spent on nonmycorrhizal (Cacq_non_myco) and mycorrhizal root uptake (Cacq_active) is used to produce enzymes:
where C:ENZ is the C to enzyme ratio and %NENZ is the N content of enzyme. This additional N needed to support P uptake is then added to the N demand of the plant and incurs a C cost upon its uptake. The activity of the enzymes produced is calculated using the enzyme concentration and Michaelis–Menten kinetics assuming a Vmax of 1,250 μmol P enzyme−1 and a Km of 1.1 (Treseder and Vitousek, 2001). The P liberated by these enzymes is then added to the available soil pool where mycorrhizal and non-mycorrhizal roots can take it up (Duff et al., 1994). We acknowledge that this formulation of phosphatase enzyme activity is simplistic and assumes limited competition between plants and microbes for the products of these enzymes and no direct impact of temperature on the activity of these enzymes. However, this simplicity reflects the prime application for the model as a subroutine in a larger ESM where FUN 3.0 could predict plant C expenditures in phosphatase enzymes, and the ESM could use more complex representations to predict the P return on that C investment (e.g., Wang et al., 2007; Yang et al., 2014).
Model Validation
To evaluate the ability of FUN 3.0 to predict observed nutrient uptake and retranslocation across temperate and tropical forested systems, we parameterized and validated the model using plot data from three replicated and well-characterized temperate forests (n = 45) and tropical dry forest plots (TDF; n = 18). The temperate forest plots are located within Griffy Woods (39° 1′ N, 86°30′ W), Lilly–Dickey Woods (39°14′ N, 86°13′ W), and Morgan Monroe State Forest (39°19′ N, 86°25′ W) in Indiana, USA. Mean annual temperature for all temperate sites is 11.6°C, and mean annual precipitation is 1,200 mm. The temperate forest soils are characterized as unglaciated, silty-loams derived from sandstone, shale, and limestone (Cheeke et al., 2017). Species compositions in these forests are mixed and are dominated by a diverse assemblage of AM and ECM trees (Cheeke et al., 2017) including sugar maple (Acer saccharum); tulip poplar (Liriodendron tulipifera); white, red, and chestnut oaks (Quercus alba, Quercus rubra, Quercus montana); and hickories (Carya spp.). The TDF plots are located within the Sector Santa Rosa of Guanacaste Conservation Area (10°50′ N, 85°40′ W) and the Parque Nacional Palo Verde of Arenal-Tempisque Conservation Area (10°21′ N, 85°21′ W). Mean annual temperature at both sites is 25°C and mean annual precipitation ranges between 1,690 and 1,834 mm (2008–2017 average). Soils at the Palo Verde sites are derived from colluvial deposits or limestone with mean soil C:N and N:P ratios across the six sites of 11.7 and 14 and a mean clay content of 33%. Sector Santa Rosa soils are volcanic and have higher variation among the 12 sites (Santa Rosa TDF and Santa Rosa Oak; Table 1) compared to the Palo Verde soils. At the Santa Rosa sites, clay content ranges between 16 and 35%, and soil C:N and N:P ratios range between 10.7 and 13.1, and 2.5 and 60.5, respectively. A diverse assemblage of TDF tree species can be found inhabiting the Palo Verde and Santa Rosa TDF sites, with 0 to 39% of the basal area comprising leguminous species across these 12 sites. While a species-poor TDF assemblage dominated by a single species of oak, the ECM Quercus oleoides can be found inhabiting the Santa Rosa Oak sites, with 2 to 19% of the basal area of these six sites comprising leguminous species (Powers et al., 2009).
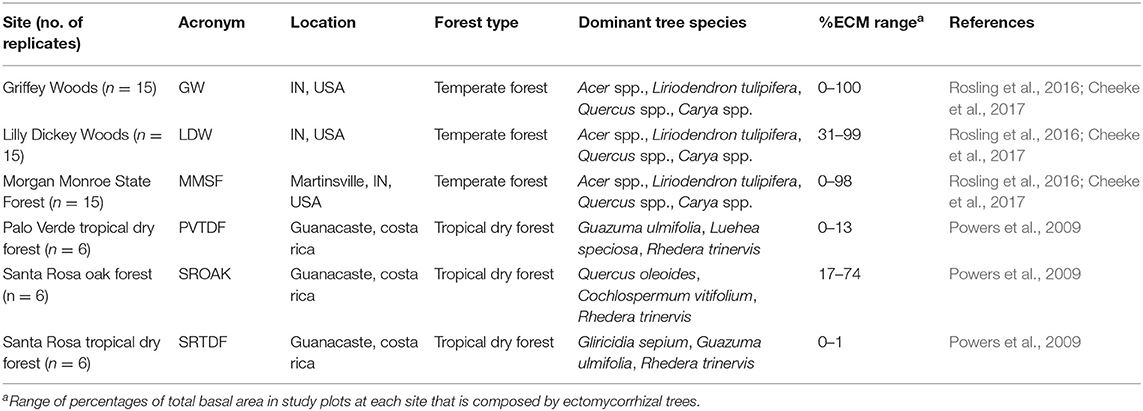
Table 1. Validation data site characteristics.
Both forest types have varied disturbance histories and represent different stages of forest succession with an average age of 20 years for the TDF and 90 years for the temperate forests. Each site also varies in mycorrhizal association, which is characterized by the standing basal area of known ECM- and AM-associated tree species [Table 1; see also Phillips et al. (2013) and Table S4 for more detailed list of ECM- and AM-associated tree species in each region]. These sites also represent a natural P gradient, with available soil P ranging from 0.037 to 1.85 g m−2 in the TDF sites and 1.00 to 7.02 g m−2 in the temperate forest sites. To conduct our model simulations, we utilized detailed C, N, and P budgets from each site for model inputs (e.g., soil chemistry, plant tissue chemistry, aboveground, and belowground biomass, and NPP; Table S1) and outputs (e.g., retranslocation). Primarily, we validated the ability of the model to predict retranslocation of N and P across all the sites. To do this, we used half of the data to calibrate the model and the remaining half of the data for validation (Figure S2). We chose retranslocation given the limited measurement error and uncertainty in assessing foliar nutrient and litterfall nutrient concentrations. For further information on site characteristics and data sources, see Table 1.
Model Experiments
We ran three model experiments to assess the sensitivity of the model to linkages between N and P acquisition and the degree to which the temperate and tropical forest sites varied in their sensitivities. In the first experiment, we investigated the impacts of the N cost of P acquisition on the total C spent to gain nutrients and the amount of N fixation required to support P acquisition. To do this, we turned off the N cost of P acquisition by changing the %N of phosphatase enzymes (%NENZ) in Equation 6 to zero. We then calculated the difference in the total C cost of nutrient acquisition and N fixation in model runs where the N cost of P acquisition was turned on vs. when it was turned off. In the second model experiment, we performed model simulations to determine the sensitivity of the model to elevated N, elevated P, or elevated N and P. To elevate nutrient availability, we added 10 g m−2 of N or P to the soil pool to increase availability across the three model simulations. We chose a constant stepwise increase over doubling availability to ensure that N or P limitation was significantly reduced in all plots, particularly tropical plots with extremely low P. Finally, we performed a third model experiment to assess the sensitivity of the model to mycorrhizal association. In this simulation, we prescribed either all of the plots as being dominated by all AM trees or all ECM trees across the temperate and tropical sites. We then calculated the difference in the total C cost of nutrient acquisition in model runs under ambient and elevated nutrient conditions for all three model runs.
Results
Validating P and N Retranslocation
Across the temperate and tropical forest sites, the model performed well in predicting the retranslocation of P and N from senescing leaves to meet nutrient demand for growth (Figure 2). For P, the FUN 3.0 model had minimal bias in predicting retranslocation rates with a slope of 0.95 and was able to capture 68% of the variability in P retranslocation (Figure 2A). FUN 3.0 overestimated retranslocation rates across two of the tropical plots from the most P-limited site (SROAK). For N, the FUN 3.0 model also had minimal bias in predicting retranslocation rates with a slope of 0.92 and was able to capture 71% of the variability in N retranslocation (Figure 2B). This low bias was primarily due to FUN 3.0 underpredicting retranslocation rates for the tropical PVTDF site. Earth system models that assume 50% of N or P is retranslocated from the canopy upon senescence (Lawrence et al., 2019) have a much larger bias in predicting N and P retranslocation than FUN 3.0, with a slope of 0.71 and 0.83 for P and N, respectively (Figure S3).
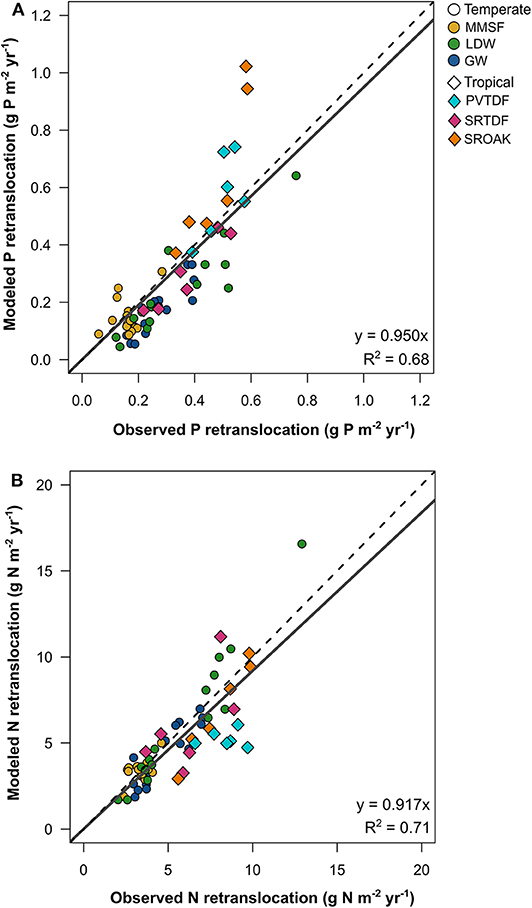
Figure 2. Model predictions of (A) phosphorus and (B) nitrogen retranslocation across three temperate forest sites (n = 45) and three tropical forest sites (n = 18) that vary in mycorrhizal association. The dashed line represents the 1:1 relationship and the solid line represents the relationship between modeled and observed values.
C Cost of N and P Acquisition Differences Between Temperate and Tropical Sites
FUN 3.0 estimated that temperate sites have a lower C cost of nutrient acquisition than tropical sites (Figure 3). On a percentage of NPP basis, temperate and tropical sites had similar C costs of N uptake in FUN 3.0. By contrast, FUN 3.0 predicted that the C cost of P uptake was nearly three times larger for tropical sites than temperate sites. Collectively, this greater C cost of P uptake predicted by FUN 3.0 drove the nearly twofold greater C cost of nutrient acquisition in tropical than temperate sites. There were also differences between temperate and tropical sites in the distribution of C spent across the different pathways to acquire N and P (Figure S4). Temperate sites invested more C in gaining nutrients from mycorrhizae, whereas tropical sites invested more C in retranslocation and N fixation.
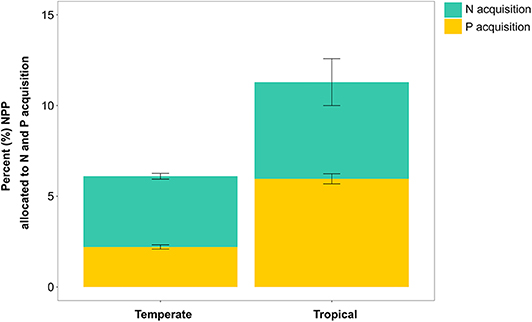
Figure 3. Percent (mean ± SE) of NPP allocated to modeled N and P acquisition across temperate (n = 45) and tropical (n = 18) forest sites.
Impacts of the N Cost of P Acquisition
Turning off the N cost of P acquisition in FUN 3.0 had a greater impact on the C cost of nutrient uptake in tropical sites than in temperate sites. Overall, FUN 3.0 predicted that tropical sites have greater N costs of P uptake than temperate sites (Figure 4A). This N cost of P acquisition led to tropical sites having over double the amount of NPP expended on nutrient acquisition than temperate sites (Figure 4B). As a direct consequence of this added N cost of P uptake, FUN 3.0 predicted that tropical sites had a threefold greater increase in N fixation to support P uptake than temperate sites (Figure 4C). Across the tropical sites, the plots with the most NPP required to meet the N cost of P uptake also had the largest increases in N fixation.
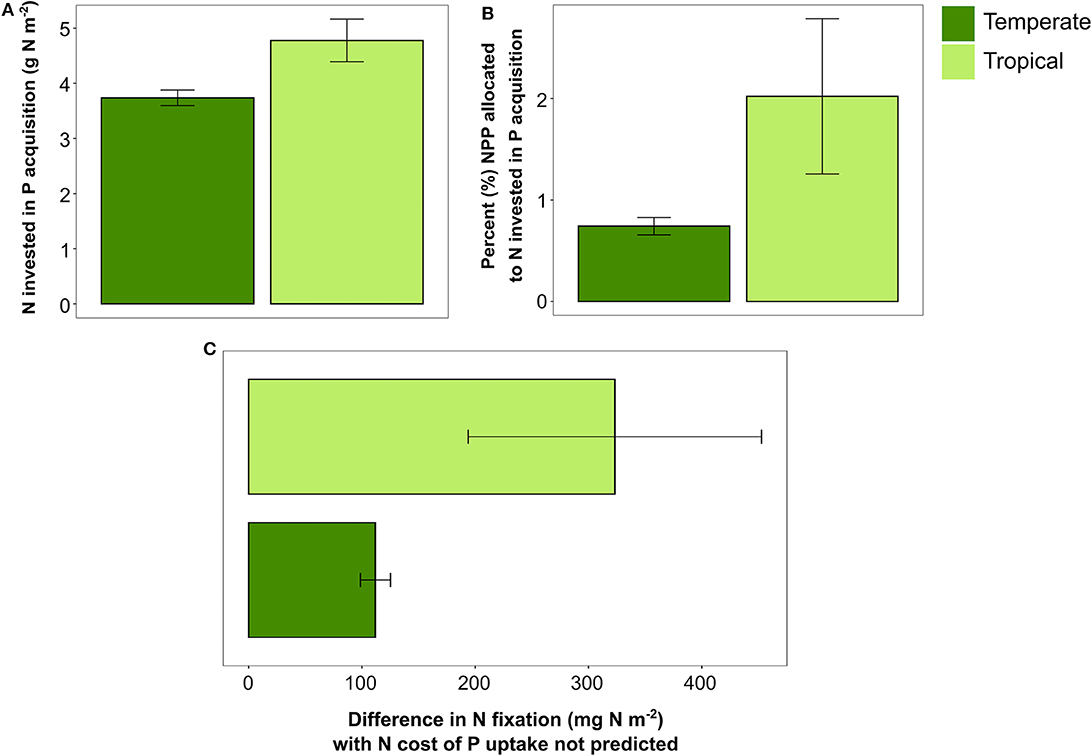
Figure 4. (A) Nitrogen invested in phosphorus acquisition across temperate (n = 45) and tropical (n = 18) forest sites. (B) Percent NPP (mean ± SE) allocated to N invested in P acquisition in temperate and tropical forest sites. (C) Difference in N fixation between ambient fixation and N fixation with N cost of P turned off. Bars represent means ± SE, and points represent each site in temperate and tropical sites.
Sensitivity of the FUN Model to a Reduction in N and P Limitation
The removal of nutrient limitation had divergent impacts on the C cost of nutrient acquisition between temperate and tropical sites (Figure 5). When N limitation was removed, FUN 3.0 predicted that temperate sites had a modestly greater reduction in the C costs of nutrient acquisition than the tropical sites (Figure 5A). By contrast, the removal of P limitation led to greater differences in model predictions. Tropical sites had a 50% reduction in the C cost of nutrient acquisition, which was nearly double that observed in temperate sites (Figure 5B). The impacts of a reduction in both N and P appeared to be additive in the model, with the tropical sites reducing their C expenditures to a greater extent than the temperate sites.
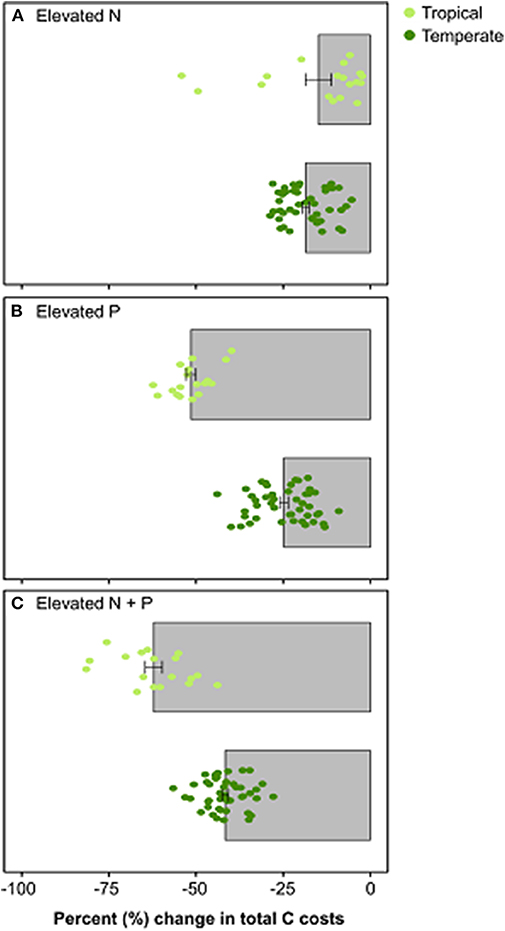
Figure 5. Percent change in total C costs when (A) nitrogen is elevated by 10 g m−2, (B) phosphorus is elevated by 10 g m−2, and (C) both nitrogen and phosphorus are elevated by 10 g m−2. Bars represent the mean percent change in total C costs from ambient conditions ± SE across each forest type [top bar in panel: tropical sites (n = 18); bottom bar in panel: temperate sites (n = 45)]. Circles represent value for each site and are color-coordinated by biome (light green: tropical sites; dark green: temperate sites).
Sensitivity of the C Cost of N and P Uptake to Shifts in Mycorrhizal Association
Across both sites, when we shifted the mycorrhizal association to be solely dominated by one mycorrhizal strategy, the C cost of nutrient acquisition was slightly lower for the all-AM scenario than the all-ECM scenario (Figure 6). However, the temperate and tropical sites varied in the degree to which mycorrhizal association impacted the C cost of nutrient acquisition. In temperate sites, the all-AM scenario led to 0.9% less of NPP spent on N acquisition and little or no change in the C cost of P compared with the all-ECM scenario. By contrast, the tropical forests sites were more sensitive with the all-AM scenario spending 2.4 and 0.6% less of NPP on N and P acquisition, respectively, than the all-ECM scenario.
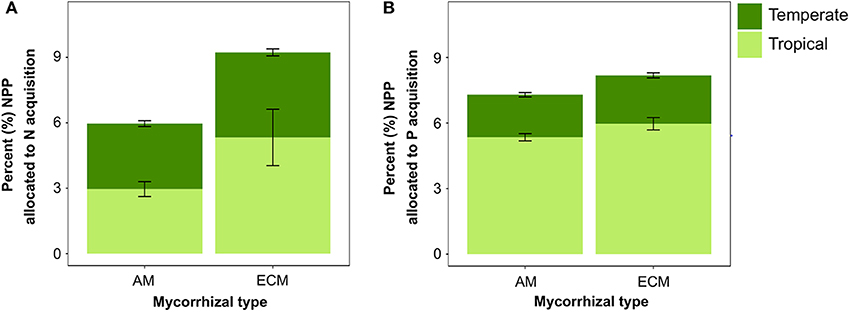
Figure 6. Percent (mean ± SE) of NPP allocated to modeled (A) N and (B) P acquisition across temperate (n = 45) and tropical (n = 18) forest sites when mycorrhizal association is prescribed as either all AM or all ECM.
Discussion
Representations of N limitation in ESMs have increasingly grown in complexity to account for the impacts of mycorrhizal symbionts on the C cost of N acquisition (Shi et al., 2016; Sulman et al., 2019). Models that include a C cost of N acquisition have shown that this cost can significantly reduce the amount of C stored in vegetation and soils and impact climate trajectories and biome-level differences in the ability of ecosystems to maintain productivity responses to elevated CO2 (Shi et al., 2016, 2019; Sulman et al., 2018, 2019). However, there have been limited efforts to apply this framework to P limitation (Wang et al., 2007, 2010). Here, we developed a novel optimal allocation framework in FUN 3.0 that can be used by ESMs to dynamically link the C cost of N and P. We show that this framework can accurately predict the retranslocation of N and P across 63 temperate and tropical forest plots that vary in mycorrhizal association (Figure 2), thereby improving upon common ESM assumptions that retranslocation is fixed at 50% of foliar nutrient concentrations (Figure S4). Moreover, we show tropical sites expend more C than temperate sites to relieve nutrient limitation (Figures 3, 5), with a substantial portion of this C being spent on N to support P uptake in tropical sites (Figure 4). Given that C expended belowground by plants primes soil decomposition (e.g., Cheng et al., 2014; Finzi et al., 2015), FUN 3.0's ability to predict C transfers to rhizosphere soil microbes to gain P provides a conceptual framework for ESMs to evaluate priming in P-limited biomes.
FUN 3.0's prediction that P uptake incurs a greater N cost in tropical P-limited systems than temperate N-limited systems (Figure 4A) follows empirical frameworks that suggest that P limitation promotes N fixation in the tropics (Houlton et al., 2008; but see Batterman et al., 2018; Waring et al., 2019). In this empirical framework, tropical plants are posited to ramp up N fixation to provide N to directly synthesize N costly acid phosphatase enzymes. FUN 3.0 moves this framework forward by showing that there is a substantial C cost by tropical plants in ramping up N fixation to drive P uptake. The model predicted that nearly 2% of NPP was directly allocated to taking up N to support phosphatase enzyme production (Figure 4B). This C investment directly led to an increase in N fixation in the tropical sites that outpaced rate increases in the temperate sites (Figure 4C). Importantly, this C cost was greater in tropical plots where existing soil N resources were not sufficient, and there was a greater need to invest C in fixation. This result suggests that there is important interaction between soil N availability and P limitation on rates of N fixation in tropical systems.
Several different factors may explain why FUN 3.0 predicted that the tropical sites had a larger C cost of nutrient acquisition than the temperate sites (Figure 3). First, as outlined above, a significant portion of the C expended on N uptake in tropical sites appears to be P limitation in disguise. Second, there is considerable empirical uncertainty in the total P mobilized per unit C invested in phosphatase enzyme activity (Treseder and Vitousek, 2001; Wang et al., 2007, 2010). This uncertainty is also mirrored in the model where the lack of an explicit temperature control or microbial competition for the products of phosphatase enzyme activity in model makes the P return on C investment uncertain. Finally, the tropical sites used in our modeling efforts come from tropical dry forests in Costa Rica where there is a distinct dry and wet season that limits microbial decomposition and the overall soil availability of N and P (Gei and Powers, 2014; Powers et al., 2015). As such, these sites differ from the classic paradigm of low P availability and high N availability in soils. Overall, the tropical sites had nearly an order of magnitude less soil P available than the temperate sites; subsequently, this increased the C cost of P acquisition predicted by the model for the tropical sites. By contrast, both sites had similar levels of soil N, which contributed to the model predicting equivalent C investments between biomes to gain N. This pattern highlights an important empirical research need to generate detailed C-N-P budgets from more mesic tropical sites to assess whether FUN 3.0's predictions hold in tropical sites with greater soil N.
The results of the model experiment reducing N and P limitation suggest that P limitation is more severe in the tropical sites and that the temperate sites are colimited by N and P (Figure 5). The dominance of P limitation in the tropical sites predicted by the model is supported by traditional paradigms of increasing P limitation in older tropical soils (Walker and Syers, 1976), although more recent evidence points to N and P colimitation in the tropics as well (Fisher et al., 2013) that could be driven by species specific differences in N and P uptake (Batterman et al., 2018; Turner et al., 2018). However, our model predictions contrast with the commonly held assumption that temperate forests are primarily N-limited (Finzi, 2009). In support of the model predictions, there is increasing empirical evidence that microbes and trees in these systems can be colimited by N and P (Fisk et al., 2015; Goswami et al., 2018). There is also evidence that this colimitation is greater in unglaciated soils in the temperate forest biome (DeForest and Snell, 2019), which lends further support to the model prediction of colimitation for the unglaciated Indiana sites used here (Figure 5). As such, FUN 3.0 addresses a critical need for a modeling framework that predicts interactions between N and P limitation in tropical as well as temperate forest ecosystems that can be integrated into ESMs.
The C cost of nutrient acquisition in the model was less sensitive to mycorrhizal association than nutrient additions (Figure 6). When we shifted the mycorrhizal associations of the plots to either all-AM or all-ECM in the third model experiment, the impacts on the C cost were nearly an order of magnitude less than when we elevated N and P availability in the soil (Figures 5, 6). However, there appeared to be a mycorrhizal control on the degree to which nutrient additions reduced the C cost. For N additions, the reductions in the C cost of nutrient acquisition were independent of mycorrhizal associations. By contrast, there was a significant negative correlation between the percentage of AM trees and the C cost of nutrient acquisition under P additions (slope = −0.016; p < 0.001). This ability of AM trees to respond positively to P addition is supported by recent evidence for P additions leading to greater AM tree growth but not ECM tree growth (DeForest and Snell, 2019).
In addition to the model uncertainty in tropical systems highlighted above, there remains a clear need to generate P data for both ecosystems that is on par with the data available for N to assist model development. N pools and fluxes are widely available in the literature due to well-developed methodology and considerable amounts of empirical studies conducted across a variety of ecosystems. This abundance of data demonstrates our understanding of the N cycle and has provided the empirical observations needed by modelers to accurately portray C-N nutrient dynamics in ESMs. By contrast, data quantifying P pools and fluxes in a variety of ecosystems remains limited and has hindered coupled C-N-P models. Traditional methods for quantifying available P are operationally defined (Cross and Schlesinger, 1995) and drive uncertainty in the model given the high sensitivity to soil P (Figure 5). However, recent efforts to assay P availability using pools defined by plant accessibility hold promise for informing future model development (DeLuca et al., 2015). Given FUN 3.0's predictions for the importance of P in both tropical and temperate ecosystems (Figure 3), generating P budgets across broader ecological and environmental gradients has the potential to improve predictions of ecosystem responses to global change.
Conclusions
The coupled N and P limitation C cost framework in FUN 3.0 identified two important processes that have the potential to alter predictions of the terrestrial biosphere to global change: (1) the N cost of P incurs a substantial C cost in tropical systems that drives enhanced N fixation (Figure 4), and (2) P limitation is not only an important process in tropical forests but can also limit NPP through colimitation with N in temperate forests (Figure 5). Moreover, FUN 3.0 expands upon recent inclusions of P dynamics in ESMs (Wang et al., 2010; Goll et al., 2012; Yang et al., 2014) not only by limiting NPP due to stoichiometric constraints but also by accounting for the C and N invested by plants into acquiring P from soil. Ongoing efforts to incorporate FUN 3.0 into ESMs hold exciting promise (Braghiere et al., 2019). Given the widespread occurrence of P limitation and N and P colimitation across terrestrial biomes (Fisher et al., 2012), FUN 3.0 provides a robust optimal allocation framework that can address recent calls for integrating P dynamics into ESMs (Reed et al., 2015).
Data Availability Statement
The data used in this study was extracted from literature or through personal communication and is cited in Table 1. The FUN 3.0 model code as well as the input and output data of the model are available in the Supplementary Material.
Author Contributions
EB, JF, and RP conceived and designed the study. EB and KA constructed the model and ran model simulations. RP and JP contributed data. KA and EB drafted the first version of the manuscript. All authors contributed the final edits of the manuscript.
Funding
This material is based in part upon work supported by the U.S. Department of Energy, Office of Science, Office of Biological and Environmental Research, Terrestrial Ecosystem Science program under Award Numbers DE-SC0008317, DE-SC0016188, and DE-SC0014363.
Conflict of Interest
The authors declare that the research was conducted in the absence of any commercial or financial relationships that could be construed as a potential conflict of interest.
Acknowledgments
JF carried out the research in part at the Jet Propulsion Laboratory, California Institute of Technology, under a contract with the National Aeronautics and Space Administration. California Institute of Technology. Government sponsorship acknowledged. Copyright 2020. All rights reserved. We would like to thank the Indiana University Research and Teaching Preserve for supporting research at the temperate forest sites.
Supplementary Material
The Supplementary Material for this article can be found online at: https://www.frontiersin.org/articles/10.3389/ffgc.2020.00043/full#supplementary-material
References
Achat, D. L., Augusto, L., Gallet-Budynek, A., and Loustau, D. (2016). Future challenges in coupled C–N–P cycle models for terrestrial ecosystems under global change: a review. Biogeochemistry 131, 173–202. doi: 10.1007/s10533-016-0274-9
Allen, E. B., Allen, M. F., Helm, D. J., Trappe, J. M., Molina, R., and Rincon, E. (1995). Patterns and regulation of mycorrhizal plant and fungal diversity. Plant Soil 170, 47–62. doi: 10.1007/Bf02183054
Batterman, S. A., Hall, J. S., Turner, B. L., Hedin, L. O., LaHaela Walter, J. K., Sheldon, P., et al. (2018). Phosphatase activity and nitrogen fixation reflect species differences, not nutrient trading or nutrient balance, across tropical rainforest trees. Ecol. Lett. 21, 1486–1495. doi: 10.1111/ele.13129
Bonan, G. B. (2008). Forests and climate change: forcings, feedbacks, and the climate benefits of forests. Science 320, 1444–1449. doi: 10.1126/science.1155121
Braghiere, R. K., Fisher, J. B., Shi, M., Yang, X., Sulman, B. N., Soudzilovskaia, N. A., et al. (2019). Considering Carbon Costs of Plant Phosphorus Acquisition in Earth System Models. San Fransisco, CA: American Geophysical Union.
Brzostek, E. R., Fisher, J. B., and Phillips, R. P. (2014). Modeling the carbon cost of plant nitrogen acquisition: mycorrhizal trade-offs and multipath resistance uptake improve predictions of retranslocation. J. Geophys. Res. G Biogeosci. 119, 1684–1697. doi: 10.1002/2014JG002660
Cheeke, T. E., Phillips, R. P., Brzostek, E. R., Rosling, A., Bever, J. D., and Fransson, P. (2017). Dominant mycorrhizal association of trees alters carbon and nutrient cycling by selecting for microbial groups with distinct enzyme function. New Phytol. 214, 432–442. doi: 10.1111/nph.14343
Cheng, W. X., Parton, W. J., Gonzalez-Meler, M. A., Phillips, R., Asao, S., McNickle, G. G., et al. (2014). Synthesis and modeling perspectives of rhizosphere priming. New Phytol. 201, 31–44. doi: 10.1111/Nph.12440
Clark, D. B., Mercado, L. M., Sitch, S., Jones, C. D., Gedney, N., Best, M. J., et al. (2011). The joint UK land environment simulator (JULES), model description - part 2: carbon fluxes and vegetation dynamics. Geosci. Model Dev. 4, 701–722. doi: 10.5194/gmd-4-701-2011
Crews, T. E., Kitayama, K., Fownes, J. H., Riley, R. H., Herbert, D. A., Mueller-dombois, D., et al. (1995). Changes in soil phosphorus fractions and ecosystem dynamics across a long chronosequence in hawaii. Ecology 76, 1407–1424.
Cross, A. F., and Schlesinger, W. H. (1995). A literature review and evaluation of the. Hedley fractionation: applications to the biogeochemical cycle of soil phosphorus in natural ecosystems. Geoderma 64, 197–214. doi: 10.1016/0016-7061(94)00023-4
DeForest, J. L., and Snell, R. S. (2019). Tree growth response to shifting soil nutrient economy depends on mycorrhizal associations. New Phytol. 225, 2557–2566. doi: 10.1111/nph.16299
DeLuca, T. H., Glanville, H. C., Harris, M., Emmett, B. A., Pingree, M. R. A., de Sosa, L. L., et al. (2015). A novel biologically-based approach to evaluating soil phosphorus availability across complex landscapes. Soil Biol. Biochem. 88, 110–119. doi: 10.1016/j.soilbio.2015.05.016
Duff, S. M. G., Sarath, G., and Plaxton, W. C. (1994). The role of acid phosphatases in plant phosphorus metabolism. Physiol. Plant. 90, 791–800. doi: 10.1111/j.1399-3054.1994.tb02539.x
Elser, J. J., Bracken, M. E. S., Cleland, E. E., Gruner, D. S., Harpole, W. S., Hillebrand, H., et al. (2007). Global analysis of nitrogen and phosphorus limitation of primary producers in freshwater, marine and terrestrial ecosystems. Ecol. Lett. 10, 1135–1142. doi: 10.1111/j.1461-0248.2007.01113.x
Finzi, A. C. (2009). Decades of atmospheric deposition have not resulted in widespread phosphorus limitation or saturation of tree demand for nitrogen in southern New England. Biogeochemistry 92, 217–229. doi: 10.1007/s10533-009-9286-z
Finzi, A. C., Abramoff, R. Z., Spiller, K. S., Brzostek, E. R., Darby, B. A., Kramer, M. A., et al. (2015). Rhizosphere processes are quantitatively important components of terrestrial carbon and nutrient cycles. Glob. Chang. Biol. 21, 2082–2094. doi: 10.1111/gcb.12816
Fisher, J. B., Badgley, G., and Blyth, E. (2012). Global nutrient limitation in terrestrial vegetation. Global Biogeochem. Cycles 26:GB3007. doi: 10.1029/2011gb004252
Fisher, J. B., Malhi, Y., Torres, I. C., Metcalfe, D. B., van de Weg, M., Meir, P., et al. (2013). Nutrient limitation in rainforests and cloud forests along a 3000 m elevation gradient in the peruvian andes. Oecologia 172, 889–902. doi: 10.1007/s00442-012-2522-6
Fisher, J. B., Sitch, S., Malhi, Y., Fisher, R. A., Huntingford, C., Tan, S.-Y., et al. (2010). Carbon cost of plant nitrogen acquisition: a mechanistic, globally applicable model of plant nitrogen uptake, retranslocation, and fixation. Gloabl Biogeochem. Cycles 24, 1–17. doi: 10.1029/2009GB003621
Fisher, R. A., Wieder, W. R., Sanderson, B. M., Koven, C. D., Oleson, K. W., Xu, C., et al. (2019). Parametric controls on vegetation responses to biogeochemical forcing in the CLM5. J. Adv. Model. Earth Syst. 11, 2879–2895. doi: 10.1029/2019MS001609
Fisk, M. C., Santangelo, S., and Minick, K. J. (2015). Carbon mineralization is promoted by phosphorus and reduced by nitrogen addition in the organic horizon of northern hardwood forests. Soil Biol. Biochem. 81, 212–218. doi: 10.1016/j.soilbio.2014.11.022
Fitter, A. H. (1991). Costs and benefits of mycorrhizae - implications for functioning under natural conditions. Experientia 47, 350–355. doi: 10.1007/bf01972076
Fleischer, K., Rammig, A., De Kauwe, M. G., Walker, A. P., Domingues, T. F., Fuchslueger, L., et al. (2019). Amazon forest response to CO2 fertilization dependent on plant phosphorus acquisition. Nat. Geosci. 12, 736–741. doi: 10.1038/s41561-019-0404-9
Gei, M. G., and Powers, J. S. (2014). “Nutrient cycling in tropical dry forests,” in Tropical Dry Forests in the Americas: Ecology, Conservation, and Management, eds. G. A. Sanchez-Azofeifa, J. S. Powers, G. W. Fernandes, and M. Quesada (Boca Raton: CRC Press), 141–155.
Golaz, J. C., Caldwell, P. M., Van Roekel, L. P., Petersen, M. R., Tang, Q., Wolfe, J. D., et al. (2019). The DOE E3SM coupled model version 1: overview and evaluation at standard resolution. J. Adv. Model. Earth Syst. 11, 2089–2129. doi: 10.1029/2018MS001603
Goll, D. S., Brovkin, V., Parida, B. R., Reick, C. H., Kattge, J., Reich, P. B., et al. (2012). Nutrient limitation reduces land carbon uptake in simulations with a model of combined carbon, nitrogen and phosphorus cycling. Biogeosciences 9, 3547–3569. doi: 10.5194/bg-9-3547-2012
Goswami, S., Fisk, M. C., Vadeboncoeur, M. A., Johnston, M., Yanai, R. D., and Fahey, T. J. (2018). Phosphorus limitation of aboveground production in northern hardwood forests. Ecology 99, 438–449. doi: 10.1002/ecy.2100
Harpole, W. S., Ngai, J. T., Cleland, E. E., Seabloom, E. W., Borer, E. T., Bracken, M. E. S., et al. (2011). Nutrient co-limitation of primary producer communities. Ecol. Lett. 14, 852–862. doi: 10.1111/j.1461-0248.2011.01651.x
Houlton, B. Z., Wang, Y. P., Vitousek, P. M., and Field, C. B. (2008). A unifying framework for dinitrogen fixation in the terrestrial biosphere. Nature 454, 327–330. doi: 10.1038/nature07028
Hungate, B. A., Dukes, J. S., Shaw, M. R., Luo, Y., and Field, C. B. (2003). Nitrogen and climate change. Science. 302, 1512–1513. doi: 10.1126/science.1091390
Jiang, M., Caldararu, S., Zaehle, S., Ellsworth, D. S., and Medlyn, B. E. (2019). Towards a more physiological representation of vegetation phosphorus processes in land surface models. New Phytol. 222, 1223–1229. doi: 10.1111/nph.15688
Johnson, N. C., Graham, J. H., and Smith, F. A. (1997). Functioning of mycorrhizal associations along the mutualism-parasitism continuum. New Phytol. 135, 575–586.
Lawrence, D. M., Fisher, R. A., Koven, C. D., Oleson, K. W., Swenson, S. C., Bonan, G., et al. (2019). The community land model version 5: description of new features, benchmarking, and impact of forcing uncertainty. J. Adv. Model. Earth Syst. 2, 1–43. doi: 10.1029/2018ms001583
Lilleskov, E. A., Fahey, T. J., and Lovett, G. M. (2001). Ectomycorrhizal fungal aboveground community change over an atmospheric nitrogen deposition gradient. Ecol. Appl. 11, 397–410. doi: 10.2307/3060897
Medvigy, D., Wang, G., Zhu, Q., Riley, W. J., Trierweiler, A. M., Waring, B. G., et al. (2019). Observed variation in soil properties can drive large variation in modeled forest functioning and composition during tropical forest secondary succession. New Phytol. 223, 1820–1833. doi: 10.1111/nph.15848
Meyer, A., Grote, R., Polle, A., and Butterbach-Bahl, K. (2010). Simulating mycorrhiza contribution to forest C- and N cycling-the MYCOFON model. Plant Soil 327, 493–517. doi: 10.1007/s11104-009-0017-y
Mitchard, E. T. A. (2018). The tropical forest carbon cycle and climate change. Nature 559, 527–534. doi: 10.1038/s41586-018-0300-2
Orwin, K. H., Kirschbaum, M. U. F., St. John, M. G., and Dickie, I. A. (2011). Organic nutrient uptake by mycorrhizal fungi enhances ecosystem carbon storage: a model-based assessment. Ecol. Lett. 14, 493–502. doi: 10.1111/j.1461-0248.2011.01611.x
Pavlick, R., Drewry, D. T., Bohn, K., Reu, B., and Kleidon, A. (2013). The jena diversity-dynamic global vegetation model (JeDi-DGVM): a diverse approach to representing terrestrial biogeography and biogeochemistry based on plant functional trade-offs. Biogeosciences 10, 4137–4177. doi: 10.5194/bg-10-4137-2013
Phillips, R. P., Brzostek, E., and Midgley, M. G. (2013). The mycorrhizal-associated nutrient economy : a new framework for predicting carbon – nutrient couplings in temperate forests. New Phytol. 199, 41–51. doi: 10.1111/nph.12221
Powers, J. S., Becklund, K. K., Gei, M. G., Iyengar, S. B., Meyer, R., O'Connell, C. S., et al. (2015). Nutrient addition effects on tropical dry forests: a mini-review from microbial to ecosystem scales. Front. Earth Sci. 3, 1–8. doi: 10.3389/feart.2015.00034
Powers, J. S., Becknell, J. M., Irving, J., and Peréz-Aviles, D. (2009). Diversity and structure of regenerating tropical dry forests in costa rica: geographic patterns and environmental drivers. For. Ecol. Manage. 258, 959–970. doi: 10.1016/j.foreco.2008.10.036
Powers, J. S., Treseder, K. K., and Lerdau, M. T. (2005). Fine roots, arbuscular mycorrhizal hyphae and soil nutrients in four neotropical rain forests: patterns across large geographic distances. New Phytol. 165, 913–921. doi: 10.1111/j.1469-8137.2004.01279.x
Prentice, I. C., Kelley, D. I., Foster, P. N., Friedlingstein, P., Harrison, S. P., and Bartlein, P. J. (2011). Modeling fire and the terrestrial carbon balance. Global Biogeochem. Cycles 25, GB3005. doi: 10.1029/2010gb003906
Raven, J. A., Lambers, H., Smith, S. E., and Westoby, M. (2018). Costs of acquiring phosphorus by vascular land plants: patterns and implications for plant coexistence. New Phytol. 217, 1420–1427. doi: 10.1111/nph.14967
Reed, S. C., Cleveland, C. C., and Townsend, A. R. (2011). Functional ecology of free-living nitrogen fixation: a contemporary perspective. Annu. Rev. Ecol. Evol. Syst. Syst. 42, 489–512. doi: 10.1146/annurev-ecolsys-102710-145034
Reed, S. C., Yang, X., and Thornton, P. E. (2015). Incorporating phosphorus cycling into global modeling efforts: a worthwhile, tractable endeavor. New Phytol. 208, 324–329. doi: 10.1111/nph.13521
Rosling, A., Midgley, M. G., Cheeke, T., Urbina, H., Fransson, P., and Phillips, R. P. (2016). Phosphorus cycling in deciduous forest soil differs between stands dominated by ecto- and arbuscular mycorrhizal trees. New Phytol. 209, 1184–1195. doi: 10.1111/nph.13720
Schulte-Uebbing, L., and de Vries, W. (2017). Global-scale impacts of nitrogen deposition on tree carbon sequestration in tropical, temperate, and boreal forests: a meta-analysis. Glob. Chang. Biol. 24, e416–e431. doi: 10.1111/gcb.13862
Shi, M., Fisher, J. B., Brzostek, E. R., and Phillips, R. P. (2016). Carbon cost of plant nitrogen acquisition: global carbon cycle impact from an improved plant nitrogen cycle in the community land model. Glob. Chang. Biol. 22, 1299–1314. doi: 10.1111/gcb.13131
Shi, M., Fisher, J. B., Phillips, R. P., and Brzostek, E. R. (2019). Neglecting plant-microbe symbioses leads to underestimation of modeled climate impacts. Biogeosciences 16, 457–465. doi: 10.5194/bg-16-457-2019
Soudzilovskaia, N. A., van Bodegom, P. M., Terrer, C., Zelfde, M. V., McCallum, I., McCormack, M. L., et al. (2019). Global mycorrhizal plant distribution linked to terrestrial carbon stocks. Nat. Commun. 10:5077. doi: 10.1038/s41467-019-13019-2
Spohn, M., and Kuzyakov, Y. (2013). Distribution of microbial- and root-derived phosphatase activities in the rhizosphere depending on P availability and C allocation - coupling soil zymography with 14C imaging. Soil Biol. Biochem. 67, 106–113. doi: 10.1016/j.soilbio.2013.08.015
Sulman, B. N., Moore, J. A. M., Abramoff, R., Averill, C., Kivlin, S., Georgiou, K., et al. (2018). Multiple models and experiments underscore large uncertainty in soil carbon dynamics. Biogeochemistry 141, 109–123. doi: 10.1007/s10533-018-0509-2
Sulman, B. N., Shevliakova, E., Brzostek, E. R., Kivlin, S. N., Malyshev, S., Menge, D. N. L., et al. (2019). Diverse mycorrhizal associations enhance terrestrial C storage in a global model. Global Biogeochem. Cycles 33, 501–523. doi: 10.1029/2018GB005973
Tanner, E., Vitousek, P. M., and Cuevas, E. (1998). Experimental investigations of nutrient limitation of forest growth on wet tropical mountains. Ecology 79, 10–22. doi: 10.2307/176860
Terrer, C., Jackson, R. B., Prentice, I. C., Keenan, T. F., Kaiser, C., Vicca, S., et al. (2019). Nitrogen and phosphorus constrain the CO2 fertilization of global plant biomass. Nat. Clim. Chang. 9, 684–689. doi: 10.1038/s41558-019-0545-2
Thornton, P. E., Lamarque, J.-F., Rosenbloom, N. A., and Mahowald, N. M. (2007). Influence of carbon-nitrogen cycle coupling on land model response to CO2 fertilization and climate variability. Global Biogeochem. Cycles 21, GB4018. doi: 10.1029/2006GB002868
Treseder, K. K., and Vitousek, P. M. (2001). Effects of soil nutrient availability on investment of N and P in Hawaian rain forest. Ecology 82, 946–954. doi: 10.1890/0012-9658(2001)082[0946:EOSNAO]2.0.CO2
Turner, B. L., Brenes-Arguedas, T., and Condit, R. (2018). Pervasive phosphorus limitation of tree species but not communities in tropical forests. Nature 555, 367–370. doi: 10.1038/nature25789
van der Heijden, M. G. A., Martin, F. M., Selosse, M. A., and Sanders, I. R. (2015). Mycorrhizal ecology and evolution: the past, the present, and the future. New Phytol. 205, 1406–1423. doi: 10.1111/nph.13288
Vitousek, P. M., and Sandford, R. L. Jr. (1986). Nutrient cycling in moist tropical forest. Annu. Rev. Ecol. Syst. 17, 136–167.
Walker, T. W., and Syers, J. K. (1976). Fate of phosphorous during pedogenesis. Geoderma 15, 1–19. doi: 10.1016/0016-7061(76)90066-5
Wang, Y. P., Houlton, B. Z., and Field, C. B. (2007). A model of biogeochemical cycles of carbon, nitrogen, and phosphorus including symbiotic nitrogen fixation and phosphatase production. Global Biogeochem. Cycles 21, 1–15. doi: 10.1029/2006GB002797
Wang, Y. P., Law, R. M., and Pak, B. (2010). A global model of carbon, nitrogen and phosphorus cycles for the terrestrial biosphere. Biogeosciences 7, 2261–2282. doi: 10.5194/bg-7-2261-2010
Waring, B. G., Pérez-Aviles, D., Murray, J. G., and Powers, J. S. (2019). Plant community responses to stand-level nutrient fertilization in a secondary tropical dry forest. Ecology 100, 1–12. doi: 10.1002/ecy.2691
Wieder, W. R., Cleveland, C. C., Smith, W. K., and Todd-Brown, K. (2015). Future productivity and carbon storage limited by terrestrial nutrient availability. Nat. Geosci. 8, 441–444. doi: 10.1038/NGEO2413
Wright, S. J. (2019). Plant responses to nutrient addition experiments conducted in tropical forests. Ecol. Monographs. 89:e01382. doi: 10.1002/ecm.1382
Yang, X., Post, W. M., Thornton, P. E., and Jain, A. (2013). The distribution of soil phosphorus for global biogeochemical modelling. Biogeosciences, 10, 2525–2537. doi: 10.5194/bg-10-2525-2013
Yang, X., Thornton, P. E., Ricciuto, D. M., and Post, W. M. (2014). The role of phosphorus dynamics in tropical forests - a modeling study using CLM-CNP. Biogeosciences 11, 1667–1681. doi: 10.5194/bg-11-1667-2014
Zaehle, S., Friend, A. D., Friedlingstein, P., Dentener, F., Peylin, P., and Schulz, M. (2010). Carbon and nitrogen cycle dynamics in the O-CN land surface model: 2. Role of the nitrogen cycle in the historical terrestrial carbon balance. Global Biogeochem. Cycles 24, GB1006. doi: 10.1029/2009gb003522
Keywords: earth system model, mycorrhizae, plant-soil interactions, nutrient limitation, optimal allocation
Citation: Allen K, Fisher JB, Phillips RP, Powers JS and Brzostek ER (2020) Modeling the Carbon Cost of Plant Nitrogen and Phosphorus Uptake Across Temperate and Tropical Forests. Front. For. Glob. Change 3:43. doi: 10.3389/ffgc.2020.00043
Received: 23 December 2019; Accepted: 20 March 2020;
Published: 21 May 2020.
Edited by:
Laurent Augusto, INRA Centre Bordeaux-Aquitaine, FranceReviewed by:
Lucia Fuchslueger, University of Vienna, AustriaMingkai Jiang, Western Sydney University, Australia
Copyright © 2020 Allen, Fisher, Phillips, Powers and Brzostek. This is an open-access article distributed under the terms of the Creative Commons Attribution License (CC BY). The use, distribution or reproduction in other forums is permitted, provided the original author(s) and the copyright owner(s) are credited and that the original publication in this journal is cited, in accordance with accepted academic practice. No use, distribution or reproduction is permitted which does not comply with these terms.
*Correspondence: Kara Allen, allenk@landcareresearch.co.nz; Edward R. Brzostek, erbrzostek@mail.wvu.edu