The Thermal Tolerances, Distributions, and Performances of Tropical Montane Tree Species
 Kenneth Feeley1,2*
  Johanna Martinez-Villa3,4
  Timothy Perez1,2
  Andres Silva Duque3
  David Triviño Gonzalez3 Alvaro Duque3
- 1Department of Biology, University of Miami, Coral Gables, FL, United States
- 2Fairchild Tropical Botanic Garden, Coral Gables, FL, United States
- 3Departamento de Ciencias Forestales, Universidad Nacional de Colombia Sede Medellín, Medellín, Colombia
- 4Department of Biological Sciences, Université du Québec à Montréal, Montreal, QC, Canada
Due to global warming, many species will face greater risks of thermal stress, which can lead to changes in performance, abundance, and/or geographic distributions. In plants, high temperatures above a species-specific critical thermal maximum will permanently damage photosystem II, leading to decreased electron transport rates, photosynthetic failure, and eventual leaf and plant death. Previous studies have shown that plant thermal tolerances vary with latitude, but little is known about how they change across smaller-scale thermal gradients (i.e., with elevation) or about how these thermal tolerances relate to species' local performances and geographic distributions. In this study, we assess the maximum photosynthetic thermal tolerances (T50) of nearly 200 tropical tree species growing in 10 forest plots distributed across a >2,500 m elevation gradient (corresponding to a 17°C temperature gradient) in the northern Andes Mountains of Colombia. Using these data, we test the relationships between species' thermal tolerances and (1) plot elevations and temperatures, (2) species' large-scale geographic distributions, and (3) changes in species' abundances through time within the plots. We found that species' T50 do in fact decrease with plot elevation but significantly slower than the corresponding adiabatic lapse rate (−0.4 vs. −5.7°C km−1) and that there remains a large amount of unexplained variation in the thermal tolerances of co-occurring tree species. There was only a very weak association between species' thermal tolerances and their large-scale geographic distributions and no significant relationships between species' thermal tolerances and their changes in relative abundance through time. A potential explanation for these results is that thermal tolerances are adaptations to extreme leaf temperatures that can be decoupled from regional air temperatures due to microclimatic variations and differences in the species' leaf thermoregulatory properties.
Introduction
With anthropogenic climate change driving rapid increases in global temperatures, many plant species will face greater risks of thermal stress (Saxe et al., 2001; Parmesan and Hanley, 2015). If severe enough, thermal stress can limit the performance of individuals and populations, eventually leading to the retraction of some species' ranges (or shifts in species' ranges if local extinctions are offset by simultaneous invasions into cooler areas) and local extinctions (Chen et al., 2011; Feeley, 2012; Lenoir and Svenning, 2015). These local extinctions can in turn lead to decreased diversity through biotic attrition (Colwell et al., 2008; Wiens, 2016), changes in community composition (Feeley et al., 2011, 2013; Duque et al., 2015; Fadrique et al., 2018) and potential changes in important ecosystem services such as carbon sequestration/storage (Clark et al., 2003; Brienen et al., 2015), regional climate regulation (Cox et al., 2000; Luo, 2007), and food production (Tito et al., 2018).
In plants, thermal stress can be caused by the increase in respiration and/or the decrease in photosynthesis due to decreased efficiency or damage to leaf metabolic processes. At high temperatures, photosystem II (PSII) can be permanently damaged leading to decreased electron transport rates, photosynthetic failure, and eventual leaf death (Baker, 2008). The temperature (generally 40-60°C) at which irrecoverable damage occurs to PSII, can be referred to as a plant's maximum physiological thermal tolerance. The heat tolerances of plants can vary markedly between species and previous studies have found that they are generally correlated with large-scale latitudinal gradients in temperature, such that plants growing in hot equatorial habitats (e.g., rainforests) have higher heat tolerances on average compared to plants from colder, higher latitude habitats (e.g., temperate or boreal forests) (O'sullivan et al., 2017; Zhu et al., 2018). However, the change in thermal tolerances across latitude is not as steep as the corresponding change in air temperature. This suggests that many tropical species may have reduced thermal safety margins (difference between temperatures and tolerances) compared to temperate species and thus will be at elevated risk of thermal stress due to global warming (Perez et al., 2016; O'sullivan et al., 2017).
A similar relationship between plant thermal tolerances and temperature should also exist along smaller-scale environmental gradients, for example across elevational gradients. In other words, plant species at lower, hotter elevations should have higher tolerances than species at higher, colder elevations (e.g., O'sullivan et al., 2013). However, this hypothesis remains almost entirely untested (but note that measurements of tree species in a single highland plot in Peru do show lower thermal tolerances than species in lowland forests at similar latitudes; O'sullivan et al., 2017). Consequently, we do not know if tropical plant species in general are at elevated risk of thermal stress or if highland tropical species have relatively greater thermal safety margins that can help protect them against the negative effects of rising temperatures. Likewise, it is unknown how leaf thermal tolerances relate to plant species' performances across large-scale spatial and temporal thermal gradients. For example, are the ranges of species with lower thermal tolerances spatially restricted to areas with lower regional temperatures? And, within specific sites, are species with higher thermal tolerances experiencing performance advantages, and hence increasing in their relative abundances compared to less-tolerant species, as temperatures rise under global climate change?
To answer these questions, we assess the thermal tolerances of >550 individuals of 164 tropical canopy tree species growing in 10 forest inventory plots, each 1-hecatare in area (= 189 species × site populations). Study plots are distributed across a steep elevation gradient ascending from near sea level to near treeline (~3,000 m asl) in the northern Andes Mountains of Colombia (Duque et al., 2015; Peña et al., 2018; Agudelo et al., 2019). We analyze changes of plant thermal tolerances between elevations at the species and community level (intraspecific patterns were not analyzed but will be investigated in future studies). We conduct two sets of analyses to investigate the relationship between the thermal tolerances of species and their ability to tolerate high temperatures. In the first, we test the relationship between species' thermal tolerances and their observed geographic distributions in relation to regional-scale mean annual and maximum temperatures. In the second set of analyses, we test the relationship between species' thermal tolerances and their changes in abundance through time as recorded in each of the study plots. These analyses are used to test the hypotheses that (1) species with higher thermal tolerances will have geographic distributions including hotter areas than species with lower thermal tolerances, and that (2) due to rising temperatures, species with higher thermal tolerances will experience performance advantages over co-occurring species with lower thermal tolerances and thus will increase in relative abundance over time. Together these analyses provide valuable insight into the importance of temperature and thermal tolerances in setting current and future species distributions.
Methods
Study Area
This study was conducted using data collected from 10 permanent forest inventory plots in the northwest Andes Mountains of Colombia, located between 5°50′ and 8°61′ N Latitude and 74°61′ and 77°33′ W Longitude. Plot elevations range from 192 to 2,880 m asl. The average total annual rainfall recorded in the plots varies from ~ 1,750 to 3,500 mm year−1, and mean annual temperature (MAT, °C) varies from 10 to 27°C (Table 1; Figure 1) with an adiabatic lapse rate of ~5.7°C km−1 elevation. Mean Annual Temperatures in this area have been increasing steadily at the rate of approximately 1°C per century since the early 1900s (Rohde et al., 2013).
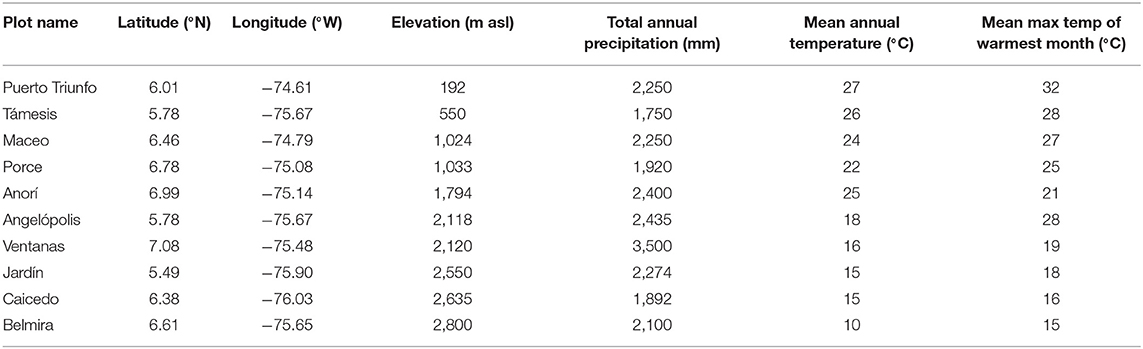
Table 1. Location and climate of study plots.
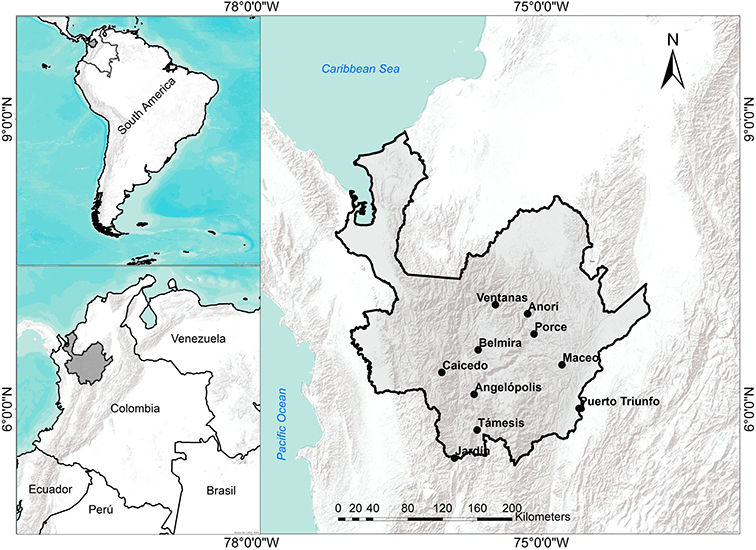
Figure 1. Map of study area showing the locations of the 10 study plots (1-ha each) in the Antioquia department of Colombia. Plot elevations are Puerto Triunfo: 192 m; Támesis: 550 m; Maceo: 1,024 m; Porce: 1,033 m; Anorí: 1,794 m; Angelópolis: 2,118 m; Ventanas: 2,120 m; Jardín: 2,550 m; Caicedo: 2,635 m; Belmira: 2 800 m.
Plot Data
The study plots are all 1-ha in area and were initially established between 2006 and 2009. In the initial plot censuses, all trees, palms and tree ferns with stem diameter at breast height (DBH) ≥ 10 cm were tagged, mapped, measured, and identified. In all cases, the point of DBH measurement was painted on the stem to ensure that re-measurements in subsequent censuses were at the same stem location. The study plots were all recensused multiple times. During each plot recensuses, DBH growth, individual recruitment, and mortality were recorded. In cases where the recorded diameter growth was either < -0.1 cm year−1 or larger than 7.5 cm year−1, the DBH of the second census was adjusted to avoid growth values out of this range (Condit, 1998; Condit et al., 2004). The Angelópolis, Anorí and Belmira plots were each recensused three times (4 total censuses including initial) with the last census completed in 2017. The Caicedo, Jardín, Maceo, Porce, Puertro Triunfo, Támesis, and Ventanas plots were each recensused twice. In all censuses, all plants were identified to the lowest possible taxonomic level using voucher samples deposited at the University of Antioquia's Herbarium (HUA) in Medellin, Colombia.
Previous studies have indicated that these forests are undergoing a process of compositional change called “thermophilization,” possibly due to rising temperatures (Duque et al., 2015). In thermophilization, species with distributions centered on lower, hotter elevations (i.e., more-thermophilic species) increase in relative abundance and species with distributions centered on higher, cooler elevations (i.e., less-thermophilic or cryophilic species) decrease in relative abundance through time. This pattern mirrors that observed at other neotropical montane sites (Feeley et al., 2011, 2013; Fadrique et al., 2018).
Study Species
Thermal tolerances were estimated for a total of 15 to 22 species in each of the 10 study plots (Table S1). Species were chosen to include the 10 most-abundant canopy tree species in each plot as well as an additional ~10 species spanning a wide range of geographic-based thermal optima and observed changes in abundance through time (see below). To estimate thermal tolerances, we collected sun-exposed leaves from three mature individuals of each species. Leaf samples were obtained using specialized pruning equipment and/or professional tree climbers. Once collected, the leaf samples were placed immediately in plastic “ziplock” bags with moistened paper towels and transported in coolers to laboratories at the National University of Colombia in Medellin for testing. In total, we sampled 164 species. The majority of species were sampled from just one plot each; 21 species were sampled from two plots each and two species were each sampled from three plots (Table S1). Hereafter, all species by plot combinations are treated as “species.”
Estimating Photosynthetic Thermal Tolerances
We estimated the maximum thermal tolerance (T50) of each of the study species to be the temperature at which photosystem II suffers ≥50% irrecoverable damage as determined through measurements of leaf fluorescence (FV/FM) in leaf samples exposed to different temperature treatments. Methods for estimating T50 were based on standard protocols modified from Krause et al. (2010, 2013). Prior to tests, we first measured the initial status of each leaf based on their pre-treatment FV/FM. Leaves were dark adapted for ~20 min. After dark adaptation, we measured initial fluorescence emission (F0) and maximum total fluorescence (FM) using an OS30p+ handheld fluorometer (Opti-Science, Hudson, NH USA). FV/FM was then calculated as the ratio of maximum variable (FV = FM-F0) to maximum total fluorescence. Subsequently, we cut 2 cm disks from each leaf (avoiding major veins). Leaf disks were placed in Miracloth fabric pouches (abaxial and adaxial leaf surfaces covered by three and one layer of fabric, respectively) to prevent anaerobiosis (Krause et al., 2010) and placed inside waterproof plastic bags. Air was removed from the bags and bags were completely submerged for 15 min in preheated circulating water baths maintained at set temperatures of 22.0, 40.0, 42.2, 44.5, 47.0, 49.3, 51.5, 53.2, and 56.5°C. During heat treatments, leaves were kept under dim light and thus were not likely exposed to adequate quantities of light needed to induce the production of violaxanthin and zeaxanthin, which can ameliorate damage at high temperatures and possibly lead to lower estimates of heat tolerances (Krause et al., 2015). After 15 min, the leaf disks were removed from the water baths and bags, and placed in petri dishes lined with moist paper towels where they were left under dim light (~1 μmol photons m−2 s−1) at room temperature (20–23°C) and allowed to recover for ~24 h. After this recovery period, the leaf disks were dark-adapted for 20 min and FV/FM was measured.
To estimate the T50 for each species, we modeled the relationship of FV/FM vs. treatment temperature for each species using a logistic non-linear least squares model with the “nls” function in the R stats package [i.e., nls(FV/FM ~ θ1/(1 + exp(–(θ2 + θ3 × Temperature)))] where θ1 is the control value of FV/FM (≈ 0.8) and θ2 and θ3 are the intercept and slope coefficients of the logit(Fv/Fm) ~ Temperature relationship, respectively; R Core Team, 2018). T50 was then calculated as the temperature modeled to cause a 50% reduction in FV/FM compared to the control (Figure S1). To generate bootstrapped mean and 95% confidence level estimates of T50 for each species, we reiterated the model of FV/FM vs. temperature 100 times. During each iteration, FV/FM and temperature data were sampled randomly with replacement to recalculate T50. For some species (n = 18), estimates of T50 were deemed unreliable due to unreasonable values (i.e., T50 >55 or <40oC) or very large 95% confidence intervals (i.e., 95% CI > 5°C; Table S1, Figure S1). These species were excluded from any subsequent analyses that used T50.
Species Abundances and Changes in Abundance
We calculated the relative abundance (BArel) of each study species in each plot census as the total basal area of the focal species (= summed cross sectional area of all conspecific stems in a plot at breast height [1.33 m above ground]) relative to the total basal area for all stems in the plot (including stems of species not assessed for T50; Table S2). We then estimated the annualized rate of change in relative abundance through time for each species as the slope of the linear regression of BArel vs. census date (ΔBArel, % year−1; Table S1). Using the ΔBArel estimates, we also classified each species as either increasing or decreasing in relative abundance through time.
Geographic-Based Thermal Niches
In order to assess how the study species' T50 relate to the species' large-scale geographic distributions, we used natural history observation records to estimate the range of temperatures over which each study species is known to occur. Specifically, for each of the study species, we downloaded all available collection and observation records using the BIEN data portal (queried via R package BIEN in March 2019). The BIEN data portal provides access to a number of different public data sources including the Global Biodiversity Information Facility (GBIF), SpeciesLink and various inventory plot networks, and records have undergone a base level of cleaning to minimize taxonomic and georeferencing errors (Maitner et al., 2018). For each georeferenced observation, we extracted the mean annual temperature (MAT, BIOCLIM1) and mean maximum daily temperatures of the warmest month (MTWM, BIOCLIM5) from the CHELSA extrapolated climate database (Karger et al., 2017) at a spatial resolution of 30 arc seconds (~1-km resolution at the equator). Any records with obvious georeferencing errors (e.g., falling in large bodies of water or outside of the neotropics) were discarded. We also masked the records to include only those from within the “Tropical & Subtropical Moist Broadleaf Forests” and “Tropical & Subtropical Dry Broadleaf Forests” (Dinerstein et al., 2017) in the Andean countries of Colombia, Venezuela, Ecuador, Peru, and Bolivia, in order to minimize potential errors and to reduce the influence of non-forest or non-Andean congeners when working at the genus level (see below). For each of the study species with ≥10 “clean” georeferenced records from Andean forests, we then calculated the geographic-based thermal optimum (GTopt) as the median of the extracted MAT values (analyses were repeated using the mean MAT values but results did not differ qualitatively). We calculated the geographic-based thermal maximum (GTmax) as the 95% quantile of the extracted BIOCLIM5 values (the 95% quantile was used rather than the absolute maximum in order to help minimize the influence of outliers or remaining georeferencing errors). For morphospecies (n = 37) and species with <10 records (n = 52), we estimated the GTopt and GTmax at the genus-level using all available records for congeners (Table S1). For a small number of species (n = 8), there were not sufficient records available from Andean forests to estimate GTopt and GTmax at either the species- or genus-level; these species were excluded from relevant analyses. We also conducted all analyses using just the species for which GTopt and GTmax could be estimated at the species-level but the results were not markedly changed (Table S3).
Relationships between variables (elevation, temperature, T50, GTopt and GTmax, ΔBArel) were assessed using ordinary linear least squares regressions. In the analyses of ΔBArel, species were weighted by the strength of the coefficient of determination (R2) of their BArel vs. census date relationship. We also used logistic regression to test if the probability of increasing in relative abundance (ΔBArel > 0) was related to T50, GTopt, or GTmax. All analyses were conducted in R version 3.6.1 (R Core Team, 2018).
Results
In accord with a priori predictions, the photosynthetic thermal tolerances (T50) of tree species were positively related to plot temperature and elevation, such that the species sampled from hot lowland plots tended to have higher T50 than species sampled from cold highland plots (T50 = 49.72°-0.0004 × Elevation, R2 = 0.07, P = 0.00101; T50 = 47.39° + 0.0827 × MAT, R2 = 0.07, P = 0.00115; T50 = 48.16° + 0.0372 × MTWM, R2 = 0.02, P = 0.0701; Figure 2). At the plot level, there was a tendency for the average T50 (with species weighted by their relative basal area) to vary with temperature and elevation, but the relationships were not significant (mean T50 = 49.92°-0.0004 × Elevation, R2 = 0.24, P = 0.149; mean T50 = 47.47° + 0.0866 × MAT, R2 = 0.23, P = 0.156; mean T50 = 48.04° + 0.0501 × MTWM, R2 = 0.12, P = 0.331; Figure 2).
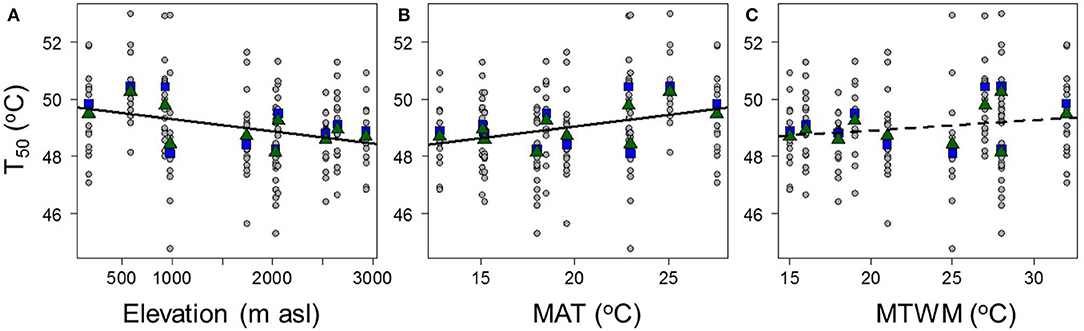
Figure 2. The relationships between species' thermal tolerances (T50) and (A) plot elevation, (B) mean annual temperature (MAT), and (C) mean maximum temperature of the warmest month (MTWM). Circle points and lines show species-level data; square points show plot-level averages with the species weighted by their relative abundances, and triangle points show unweighted plot averages. T50 = 49.72°-0.0004 × Elevation, R2 = 0.07, P = 0.00101; T50 = 47.39° + 0.0827 × MAT, R2 = 0.07, P = 0.00115; T50 = 48.16° + 0.0372 × MTWM, R2 = 0.02, P = 0.0701.
Similarly, tree species sampled from the lowland plots tended to have geographic distributions that were centered on hotter areas (i.e., higher GTopt) and that included hotter areas (i.e., higher GTmax) than species from highland plots (GTopt = 25.72°-0.0026 × Elevation, R2 = 0.45, P < 2 e−16; and GTmax = 31.29°-0.0012 × Elevation, R2 = 0.2; P = 1.07e−10; Figure 3). The plot-level average of GTopt and GTmax both decreased significantly with elevation (mean GTopt = 26.14°-0.0028 × Elevation, R2 = 0.82, P = 0.000282; and mean GTmax = 31.64°-0.0016 × Elevation, R2 = 0.64, P = 0.00567; Figure 3). Plot-level relationships did not change if the species were not weighted by their abundances.
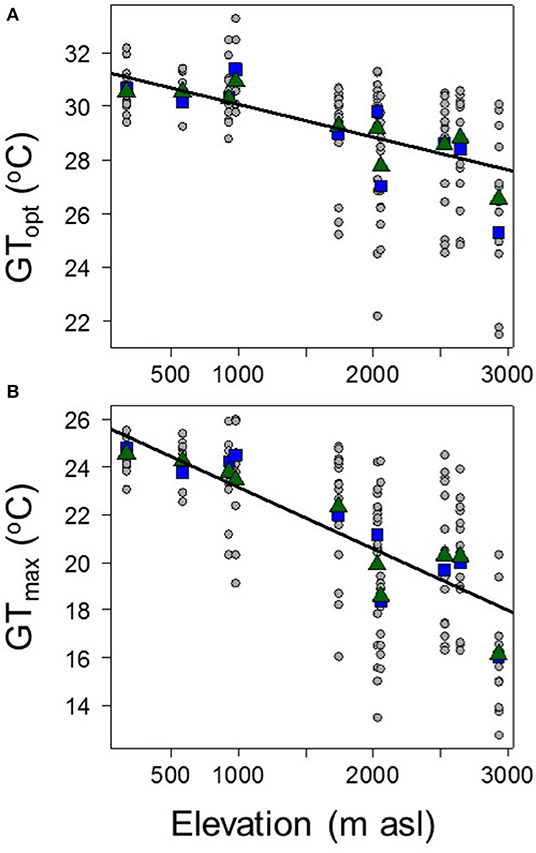
Figure 3. The relationships between plot elevation and species' (A) geographic-based thermal optima (Gtopt), and (B) geographic-based thermal maximum (GTmax). Circle points and lines show species-level data; square points show plot-level averages with the species weighted by their relative abundances, and triangle points show unweighted plot averages. GTopt = 25.72°-0.0026 × Elevation, R2 = 0.45, P < 2e−16; GTmax = 31.29°-0.0012 × Elevation, R2 = 0.2, P = 1.07 e−10.
There was a significant positive relationship between T50 and GTopt (GTopt = −2.93° + 0.4931 × T50, R2 = 0.05, P = 0.00858; Figure 4A). However, there was not a significant relationship between T50 and GTmax (GTmax = 20.95° + 0.1680 × T50, R2 = 0.01, P = 0.165037; Figure 4B).
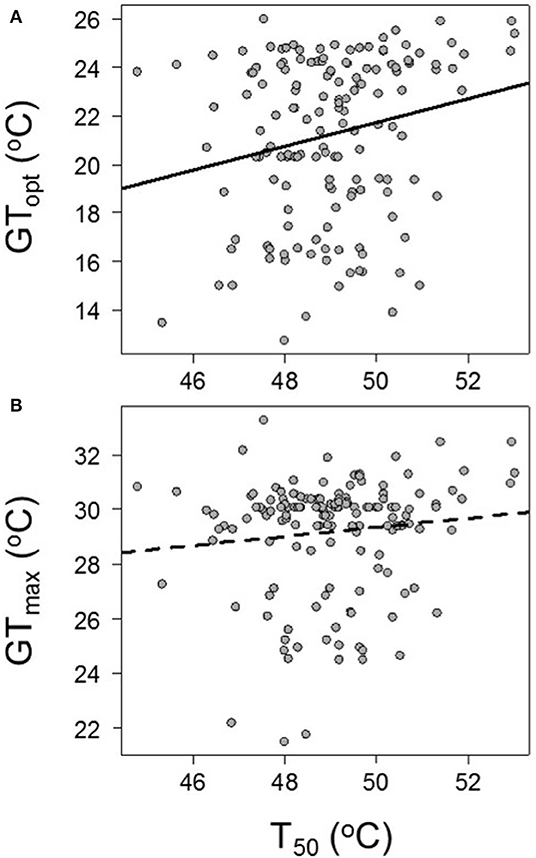
Figure 4. The relationships between species' physiological maximum thermal tolerance (T50) and (A) GTopt and (B) GTmax. GTopt = −2.93° + 0.4931 × T50, R2 = 0.05, P = 0.00858; GTmax = 20.95° + 0.1680 × T50, R2 = 0.01, P = 0.165037.
Contrary to predictions, there was no overall pattern for tree species with higher relative T50 (T50,relative = T50-Plot Average T50) to increase in relative abundance through time (ΔBArel = −3.506 e−06 + 1.046 e−05 × T50,relative, R2 = 0.01, P = 0.218; Figures 5A, 6). A significant positive relationship between thermal tolerances and changes in relative abundance was observed in only three of the plots (Maceo: ΔBArel = −3.125 e−03 + 6.368 e−05 × T50, R2 = 0.36, P = 0.009; Porce: ΔBArel = −2.835 e−03 + 5.843 e−05 × T50, R2 = 0.60, P = 0.005; Ventanas: ΔBArel = −3.994 e−03 + 8.320 e−05 × T50, R2 = 0.37, P = 0.021; Figure 6D). Likewise, while there were positive relationships between species' changes in relative abundance through time and both their relative GTopt (GTopt,relative = GTopt-Plot Average GTopt) and their relative GTmax (GTmax,relative = GTmax-Plot Average GTmax), these relationships were not significant (ΔBArel = −5.300 e−06 + 9.521 e−07 × GTopt,relative, R2 = 0.02, P = 0.0677; and ΔBArel = −7.945 e−06 + 9.9960 e−07 × GTmax,relative, R2 = 0.02, P = 0.120; Figures 5B,C). The probability of species increasing in abundance was not significantly associated with any measure of thermal tolerance [logit(ΔBArel >0) = 0.166 + 0.00268 × T50,relative, P = 0.982; logit(ΔBArel >0) = 0.172 + 0.0100 × GTopt,relative, P = 0.169; and logit(ΔBArel >0) = 0.137 + 0.0162 × GTmax,relative, P = 0.0821].
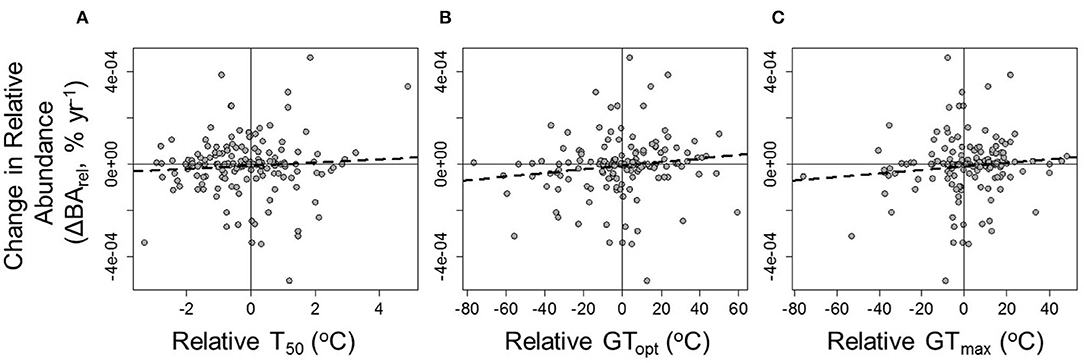
Figure 5. The relationships between annual changes in species' relative abundance (ΔBArel) and (A) relative T50, (B) relative GTopt, and (C) relative GTmax (see text). ΔBArel = −3.506e−06 + 1.046e−05 × T50,relative, R2 = 0.01, P = 0.218; ΔBArel = −5.300 e−06 + 9.521 e−07 × GTopt,relative, R2 = 0.02, P = 0.0677; and ΔBArel = −7.945 e−06 + 9.9960 e−07 × GTmax,relative, R2 = 0.02, P = 0.120.
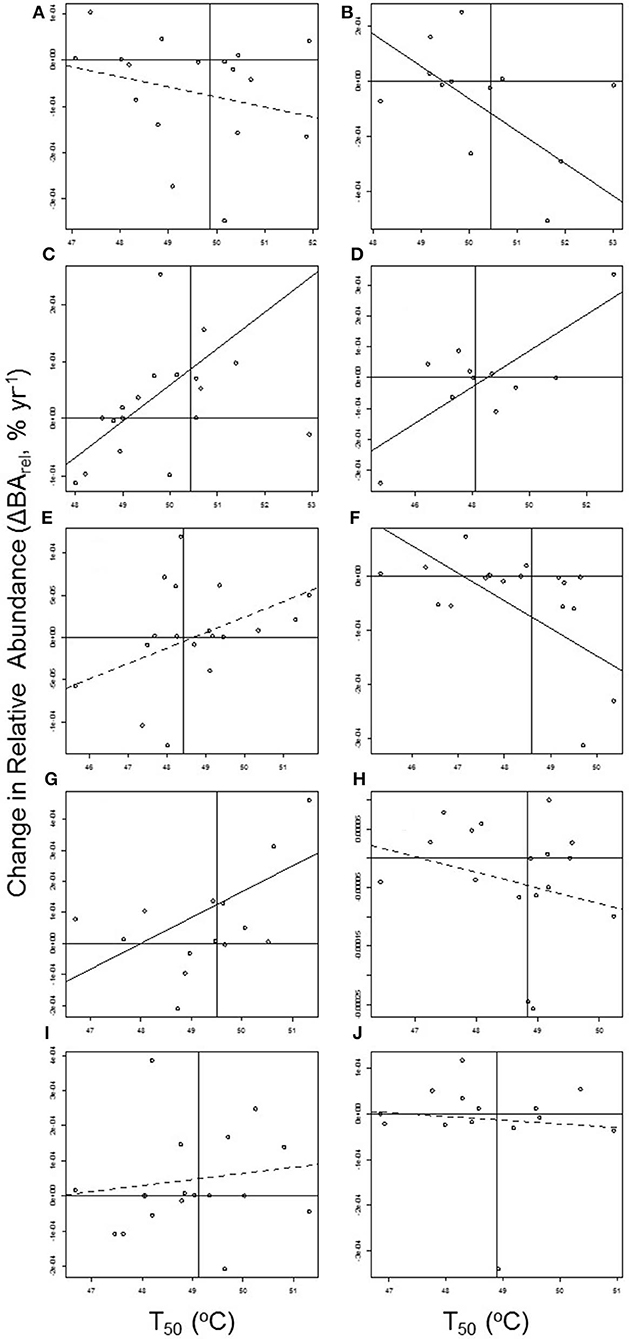
Figure 6. The within-plot relationships between annual changes in species' relative abundance (ΔBArel) and species' T50. Horizontal lines indicate no change in abundance through time and vertical lines indicate plot-average T50. Solid regression lines indicate significant (p ≤ 0.05) relationships (weighted regressions with species weighted by the coefficient of determination of their BArel vs. census date relationship). Plots are ordered by increasing elevation: (A) Puerto Triunfo: ΔBArel = 1.001 e−03-2.161 e−05 × T50, R2 = 0.06, P = 0.335; (B) Támesis: ΔBArel = 5.779 e−03-1.169 e−04 × T50, R2 = 0.47, P = 0.339; (C), Maceo: ΔBArel = −3.125 e−03 + 6.368 e−05 × T50, R2 = 0.36, P = 0.009; (D) Porce: ΔBArel = −2.835 e−03 + 5.843 e−05 × T50, R2 = 0.60, P = 0.005; (E) Anorí: ΔBArel = −8.976 e−04 + 1.844 e−05 × T50, R2 = 0.13, P = 0.150; (F) Angelópolis: ΔBArel = 2.400 e−03-5.094 e−05 × T50, R2 = 0.42, P = 0.004; (G) Ventanas: ΔBArel = −3.994 e−03 + 8.320 e−05 × T50, R2 = 0.37, P = 0.021; (H) Jardín: ΔBArel = 1.261 e−03-2.678 e−05 × T50, R2 = 0.06, P = 0.345; (I) Caicedo: ΔBArel = −7.950 e−04 + 1.718 e−05 × T50, R2 = 0.02, P = 0.567; and (J) Belmira: ΔBArel = 3.782 e−04-8.006 e−06 × T50, R2 = 0.01, P = 0.766.
Discussion
In this study, we tested several hypotheses about how the thermal tolerances of tropical montane tree species relate to their geographic distributions and performances under rising temperatures. First, we tested the hypothesis that species from cold, highland forest communities have lower thermal tolerances compared to species from lowland forests where ambient air temperatures are reliably hotter. Our results support this hypothesis since T50, GTopt, and GTmax all increased with plot temperature and decreased with plot elevation. Likewise, the plot-level average T50 tended to decrease with elevation (and increased with plot MAT), and plot-level averages of both GTopt and GTmax both decreased significantly with elevation.
We found a very high amount of variation in the T50 among species co-occurring within each plot such that elevation or temperature only explained a small, albeit highly significant, proportion of interspecific variation. A potential explanation for these patterns is that thermal tolerances are evolved in response to leaf temperatures and that leaf temperatures can be decoupled from regional air temperatures due to the fact that (1) even within a single plot, different species can occur predominantly in different thermal or moisture microhabitats and (2) co-occurring species can have different thermoregulatory behaviors and mechanisms.
Even over small areas (e.g., within single hectare inventory plots), there may exist many different microhabitats that create different thermal regimes for the leaves of co-occurring species. For example, leaves of canopy species will be exposed to more direct sunlight and thus reach higher temperatures than leaves of understory species (Smith, 1978; Rey-Sánchez et al., 2016; Slot et al., 2019). Air and leaf temperatures can also be strongly influenced by small-scale changes in topography (Geiger et al., 2009; Dobrowski, 2011; Sears et al., 2011; Curtis et al., 2016; Graae et al., 2018; Lembrechts et al., 2019). Many studies have found that tropical species are non-randomly distributed within plots. These studies, which have focused primarily on the relationships between the distributions of species and patterns of soil nutrients and soil water availability, have found good evidence that more drought-tolerant species occur in dryer microhabitats and that drought-intolerant species occur in wetter microhabitats (Harms et al., 2001; Valencia et al., 2004; Engelbrecht et al., 2007; Condit et al., 2013; Cosme et al., 2017; Zuleta et al., 2018). It is possible that species with higher or lower T50 are likewise selectively distributed in hotter or cooler microhabitats, respectively. Additional studies are needed to investigate the distribution of tropical tree species in relation to thermal microhabitats.
Another factor that can influence leaf temperatures is the thermal regulatory strategies of the plants themselves. Different leaf sizes, shapes, morphologies, and behaviors can all lead to markedly different leaf temperatures of co-occurring plants (Parkhurst and Loucks, 1972; Meinzer and Goldstein, 1985; Leigh et al., 2012; Fauset et al., 2018). For example, all else being equal, larger leaves will reach higher maximum temperatures than will smaller leaves (Leigh et al., 2017; Wright et al., 2017). Likewise, leaves that absorb more solar radiation (rather than reflecting or transmitting the light) will reach higher maximum temperatures (Smith, 1978; Rey-Sánchez et al., 2016). Another important leaf thermoregulatory mechanism is evapotranspiration, which cools leaves through latent heat loss (Nobel, 1999; Lambers et al., 2008). Evapotranspirative cooling requires access to water and thus is generally most effective in species that have developed mechanisms for the rapid uptake and transport of water (both to the leaf via xylem transport and out of the leaf via stomata) and/or species that occur in wetter microhabitats with abundant soil water availability (Gates, 1968; Oren et al., 1999; Meinzer et al., 2008). Because of habitat selection and thermoregulatory mechanisms, leaf temperatures can be decoupled from air temperature and may differ significantly between species under identical air temperatures (Michaletz et al., 2015). By extension, this also means that species under markedly different air temperatures can have similar or identical leaf temperatures (Helliker and Richter, 2008; Michaletz et al., 2016). If thermal tolerances are indeed adapted or acclimated to leaf temperatures rather than air temperatures, then this decoupling may explain the high amount of variation between species within plots as seen in our study, as well as in other studies looking at patterns of thermal tolerances across latitude (O'sullivan et al., 2017).
Another hypothesis that we tested in this study was that tropical tree species with higher thermal tolerances have geographic ranges that encompass hotter regional air temperatures (Zhu et al., 2018). In accord with this hypothesis, we did find a significant positive relationship between species' T50 and their thermal optima as based on their large-scale geographic distributions. However, T50 explained very little variation between species' GTopt and there was not a significant relationship between T50 and species' geographic-based thermal maximum (GTmax). As discussed above, microhabitat selection and thermoregulatory strategies may decouple leaf temperatures from air temperatures—especially when air temperatures are estimated at the scale of 1-km2 pixels. If this is true, then it may explain how some species with relatively low T50 are able to include areas with high mean annual or maximum temperatures in their distributions and likewise why some species with high T50 are geographically restricted to cooler areas. In order to better assess how thermal tolerances relate to geographic distributions, finer-scale climate models will need to be coupled with leaf biophysical models to map the distributions of leaf temperatures across species ranges (Kearney and Porter, 2017). Another possibility is that thermal tolerances are locally adapted or acclimated to plot conditions, which would obscure any relationships between T50 and large-scale species-wide distributions (Zhu et al., 2018).
The final hypothesis that we tested was that because of global warming, tree species that are more-thermophilic should increase in abundance through time within each plot relative to less-thermophilic species. Our results did not support this hypothesis. We did not find consistent or significant relationships between the direction or rates of changes in species' relative abundances (BArel) and any measure of the species' thermal tolerances or preferences (T50, GTopt, GTmax). As above, the lack of a strong relationship between thermal properties and their changes in abundance may be due at least in part to the decoupling of air temperature and leaf temperatures. In other words, some species may be better able to regulate their leaf temperatures and thus may experience less changes in leaf temperatures over time than other co-occurring species. It is also possible that other factors could be influencing changes in species' abundances besides rising temperatures, thus obfuscating patterns. More specifically, there is large stochastic component to tree mortality, especially in montane forests where landslides and other local disturbances are very common (Clark et al., 2016). These stochastic events lead to a large amount of demographic “noise.” To overcome this noise, large-scale spatial or temporal datasets are required (Wagner et al., 2010). It is possible that this study was simply too short of duration to detect a directional signal in abundance changes, especially since we were only looking at a small subset of focal species within individual 1-ha plots.
Conclusions
Global warming makes it imperative that we understand the ability of species to tolerate and perform at hotter temperatures. Here we assessed the maximum physiological thermal tolerance of photosystem II (T50) for nearly 200 species of tropical montane trees growing at different elevations along the flanks of the Colombian Andes Mountains. We used our estimates of T50 to test if thermal tolerances vary predictably across an elevation gradient of more than 2,500 m (corresponding to a ca 20°C gradient in mean annual and maximum temperatures). Our results showed that there is in fact a negative relationship between elevation and T50 such that species occurring at lower elevations are generally capable of tolerating hotter temperatures than species occurring at higher elevations. However, our results also indicate that the relationship between T50 and temperature is weak and extremely shallow (Figure 2). Indeed, the slope of the T50 vs. MAT relationship was only 0.08, and the slope of the T50 vs. MTWM relationship was only 0.05. Our findings mirror those of O'sullivan et al. (2017) who likewise found a shallower-than-expected relationship between plant thermal tolerances and temperature (specifically, Tmax = 49.155 + 0.264 × MTWM; unfortunately, differences in the methods used to estimate thermal tolerances prohibit a direct comparison of results).
The shallow relationships between plant thermal tolerances and plot temperatures across both elevational and latitudinal gradients suggest that species from hot low-elevation and low-latitude forests will have smaller average thermal safety margins (difference between temperature and thermal tolerance) than either high-latitude or high-elevation species, and consequently that lowland tropical plants may be at especially high risk of damage from rising global temperatures (Perez et al., 2016). However, we also found a large amount of variation in the T50 of species co-occurring in any given site (i.e., some species growing in low-elevation forests where MAT = 27°C can have lower T50 than species from high elevation forests where MAT = 10°C, and vice versa) and also very little relation between species' thermal tolerances and their large-scale geographic distributions (i.e., some species with low T50 have ranges that include hotter areas than species with higher T50). Consequently, many lowland species may potentially have larger thermal safety margins than highland species, making it hard to make generalized predictions about risk.
One possible explanation for the high variation in thermal tolerances of co-occurring species is that T50 (and other comparable measures) is evolved in response to extreme leaf temperatures that can be decoupled from air temperatures. A decoupling of air and leaf temperatures, and the potential ability of some plants to maintain relatively constant leaf temperatures despite global warming, could also explain why there was no significant relationship between species' T50 and changes in species abundances over time. The thermal regulatory behaviors of tropical plants, and the ability of these behaviors to respond to climate change, remains poorly studied and deserves further attention.
Data Availability Statement
All datasets generated for this study are included in the article/Supplementary Material.
Author Contributions
KF and AD designed the study. JM-V, AS, and DT collected the field data. KF and TP analyzed the data. KF wrote the manuscript. KF, TP, and AD edited the manuscript.
Funding
This work was funded through grants from the Swiss Agency for Development and Cooperation, and the U.S. National Science Foundation (NSF, DEB-1350125).
Conflict of Interest
The authors declare that the research was conducted in the absence of any commercial or financial relationships that could be construed as a potential conflict of interest.
Supplementary Material
The Supplementary Material for this article can be found online at: https://www.frontiersin.org/articles/10.3389/ffgc.2020.00025/full#supplementary-material
Figure S1. Species-level changes in FV/FM recorded in leaves exposed to different temperature treatments and model fits used to estimate T50.
Table S1. Study species, measures of thermal tolerance (T50, GTopt, GTmax), changes in abundance.
Table S2. Results of analyses using only species for which GTopt and GTmax could be estimated at the species-level.
Table S3. Basal area (cm2) of focal species and total tree basal area recorded in each census of the 10 study plots.
References
Agudelo, C. M., Benavides, A. M., Taylor, T., Feeley, K. J., and Duque, A. (2019). Functional composition of epiphyte communities in the Colombian Andes. Ecology 100:e02858. doi: 10.1002/ecy.2858
Baker, N. R. (2008). Chlorophyll fluorescence: a probe of photosynthesis in vivo. Annu. Rev. Plant Biol. 59, 89–113. doi: 10.1146/annurev.arplant.59.032607.092759
Brienen, R. J. W., Phillips, O. L., Feldpausch, T. R., Gloor, E., Baker, T. R., Lloyd, J., et al. (2015). Long-term decline of the Amazon carbon sink. Nature 519, 344–348. doi: 10.1038/nature14283
Chen, I.-C., Hill, J. K., Ohlemüller, R., Roy, D. B., and Thomas, C. D. (2011). Rapid range shifts of species associated with high levels of climate warming. Science 333, 1024–1026. doi: 10.1126/science.1206432
Clark, D. A., Piper, S. C., Keeling, C. D., and Clark, D. B. (2003). Tropical rain forest tree growth and atmospheric carbon dynamics linked to interannual temperature variation during 1984-2000. Proc. Natl. Acad. Sci. U.S.A. 100, 5852–5857. doi: 10.1073/pnas.0935903100
Clark, K. E., West, A. J., Hilton, R. G., Asner, G. P., Quesada, C. A., Silman, M. R., et al. (2016). Storm-triggered landslides in the Peruvian Andes and implications for topography, carbon cycles, and biodiversity. Earth Surf. Dynam. 4, 47–70. doi: 10.5194/esurf-4-47-2016
Colwell, R. K., Brehm, G., Cardelus, C. L., Gilman, A. C., and Longino, J. T. (2008). Global warming, elevational range shifts, and lowland biotic attrition in the wet tropics. Science 322, 258–261. doi: 10.1126/science.1162547
Condit, R. (1998). Tropical Forest Census Plots: Methods and Results From Barro Colorado Island, Panama and a Comparison With Other Plots. Berlin; New York, NY: Springer. doi: 10.1007/978-3-662-03664-8
Condit, R., Aguilar, S., Hernandez, A., Perez, R., Lao, S., Angehr, G., et al. (2004). Tropical forest dynamics across a rainfall gradient and the impact of an El Nino dry season. J. Trop. Ecol. 20, 51–72. doi: 10.1017/S0266467403001081
Condit, R., Engelbrecht, B. M., Pino, D., Pérez, R., and Turner, B. L. (2013). Species distributions in response to individual soil nutrients and seasonal drought across a community of tropical trees. Proc. Natl. Acad. Sci. U.S.A. 110, 5064–5068. doi: 10.1073/pnas.1218042110
Cosme, L. H., Schietti, J., Costa, F. R., and Oliveira, R. S. (2017). The importance of hydraulic architecture to the distribution patterns of trees in a central Amazonian forest. New Phytol. 215, 113–125. doi: 10.1111/nph.14508
Cox, P. M., Betts, R. A., Jones, C. D., Spall, S. A., and Totterdell, I. J. (2000). Acceleration of global warming due to carbon-cycle feedbacks in a coupled climate model. Nature 408, 184–187. doi: 10.1038/35041539
Curtis, E. M., Gollan, J., Murray, B. R., and Leigh, A. (2016). Native microhabitats better predict tolerance to warming than latitudinal macro-climatic variables in arid-zone plants. J. Biogeogr. 43, 1156–1165. doi: 10.1111/jbi.12713
Dinerstein, E., Olson, D., Joshi, A., Vynne, C., Burgess, N. D., Wikramanayake, E., et al. (2017). An ecoregion-based approach to protecting half the terrestrial realm. BioScience 67, 534–545. doi: 10.1093/biosci/bix014
Dobrowski, S. Z. (2011). A climatic basis for microrefugia: the influence of terrain on climate. Glob. Change Biol. 17, 1022–1035. doi: 10.1111/j.1365-2486.2010.02263.x
Duque, A., Stevenson, P., and Feeley, K. J. (2015). Thermophilization of adult and juvenile tree communities in the northern tropical Andes. Proc. Natl. Acad. Sci. U.S.A. 112, 10744–10749. doi: 10.1073/pnas.1506570112
Engelbrecht, B. M., Comita, L. S., Condit, R., Kursar, T. A., Tyree, M. T., Turner, B. L., et al. (2007). Drought sensitivity shapes species distribution patterns in tropical forests. Nature 447:80. doi: 10.1038/nature05747
Fadrique, B., Báez, S., Duque, Á., Malizia, A., Blundo, C., Carilla, J., et al. (2018). Widespread but heterogeneous responses of Andean forests to climate change. Nature 564:207. doi: 10.1038/s41586-018-0715-9
Fauset, S., Freitas, H. C., Galbraith, D. R., Sullivan, M. J., Aidar, M. P., Joly, C. A., et al. (2018). Differences in leaf thermoregulation and water use strategies between three co-occurring Atlantic forest tree species. Plant Cell Environ. 41, 1618–1631. doi: 10.1111/pce.13208
Feeley, K. J. (2012). Distributional migrations, expansions, and contractions of tropical plant species as revealed in dated herbarium records. Glob. Change Biol. 18, 1335–1341. doi: 10.1111/j.1365-2486.2011.02602.x
Feeley, K. J., Hurtado, J., Saatchi, S., Silman, M. R., and Clark, D. B. (2013). Compositional shifts in Costa Rican forests due to climate-driven species migrations. Glob. Change Biol. 19, 3472–2480. doi: 10.1111/gcb.12300
Feeley, K. J., Silman, M. R., Bush, M. B., Farfan, W., Cabrera, K. G., Malhi, Y., et al. (2011). Upslope migration of Andean trees. J. Biogeogr. 38, 783–791. doi: 10.1111/j.1365-2699.2010.02444.x
Gates, D. M. (1968). Transpiration and leaf temperature. Annu. Rev. Plant Physiol. 19, 211–238. doi: 10.1146/annurev.pp.19.060168.001235
Geiger, R., Aron, R. H., and Todhunter, P. (2009). The Climate Near the Ground. Plymouth: Rowman & Littlefield.
Graae, B. J., Vandvik, V., Armbruster, W. S., Eiserhardt, W. L., Svenning, J.-C., Hylander, K., et al. (2018). Stay or go–how topographic complexity influences alpine plant population and community responses to climate change. Perspect. Plant Ecol. Evol. Syst. 30, 41–50. doi: 10.1016/j.ppees.2017.09.008
Harms, K. E., Condit, R., Hubbell, S. P., and Foster, R. B. (2001). Habitat associations of trees and shrubs in a 50-ha neotropical forest plot. J. Ecol. 89, 947–959. doi: 10.1111/j.1365-2745.2001.00615.x
Helliker, B. R., and Richter, S. L. (2008). Subtropical to boreal convergence of tree-leaf temperatures. Nature 454:511. doi: 10.1038/nature07031
Karger, D. N., Conrad, O., Böhner, J., Kawohl, T., Kreft, H., Soria-Auza, R. W., et al. (2017). Climatologies at high resolution for the earth's land surface areas. Sci. Data 4:170122. doi: 10.1038/sdata.2017.122
Kearney, M. R., and Porter, W. P. (2017). NicheMapR–an R package for biophysical modelling: the microclimate model. Ecography 40, 664–674. doi: 10.1111/ecog.02360
Krause, G. H., Cheesman, A. W., Winter, K., Krause, B., and Virgo, A. (2013). Thermal tolerance, net CO2 exchange and growth of a tropical tree species, Ficus insipida, cultivated at elevated daytime and nighttime temperatures. J. Plant Physiol. 170, 822–827. doi: 10.1016/j.jplph.2013.01.005
Krause, G. H., Winter, K., Krause, B., Jahns, P., García, M., Aranda, J., et al. (2010). High-temperature tolerance of a tropical tree, Ficus insipida: methodological reassessment and climate change considerations. Funct. Plant Biol. 37, 890–900. doi: 10.1071/FP10034
Krause, G. H., Winter, K., Krause, B., and Virgo, A. (2015). Light-stimulated heat tolerance in leaves of two neotropical tree species, Ficus insipida and Calophyllum longifolium. Funct. Plant Biol. 42, 42–51. doi: 10.1071/FP14095
Lambers, H., Chapin, F. S. III, and Pons, T. L. (2008). Plant Physiological Ecology. New York, NY: Springer Science & Business Media. doi: 10.1007/978-0-387-78341-3
Leigh, A., Sevanto, S., Ball, M. C., Close, J. D., Ellsworth, D. S., Knight, C. A., et al. (2012). Do thick leaves avoid thermal damage in critically low wind speeds? New Phytol. 194, 477–487. doi: 10.1111/j.1469-8137.2012.04058.x
Leigh, A., Sevanto, S., Close, J., and Nicotra, A. (2017). The influence of leaf size and shape on leaf thermal dynamics: does theory hold up under natural conditions? Plant Cell Environ. 40, 237–248. doi: 10.1111/pce.12857
Lembrechts, J. J., Nijs, I., and Lenoir, J. (2019). Incorporating microclimate into species distribution models. Ecography 42, 1267–1279. doi: 10.1111/ecog.03947
Lenoir, J., and Svenning, J. C. (2015). Climate-related range shifts–a global multidimensional synthesis and new research directions. Ecography 38, 15–28. doi: 10.1111/ecog.00967
Luo, Y. (2007). Terrestrial carbon–cycle feedback to climate warming. Annu. Rev. Ecol. Evol. Sys. 38, 683–712. doi: 10.1146/annurev.ecolsys.38.091206.095808
Maitner, B. S., Boyle, B., Casler, N., Condit, R., Donoghue, J., Durán, S. M., et al. (2018). The bien r package: a tool to access the Botanical Information and Ecology Network (BIEN) database. Methods Ecol. Evol. 9, 373–379. doi: 10.1111/2041-210X.12861
Meinzer, F., and Goldstein, G. (1985). Some consequences of leaf pubescence in the Andean giant rosette plant Espeletia timotensis. Ecology 66, 512–520. doi: 10.2307/1940399
Meinzer, F. C., Woodruff, D. R., Domec, J.-C., Goldstein, G., Campanello, P. I., Gatti, M. G., et al. (2008). Coordination of leaf and stem water transport properties in tropical forest trees. Oecologia 156, 31–41. doi: 10.1007/s00442-008-0974-5
Michaletz, S. T., Weiser, M. D., Mcdowell, N. G., Zhou, J., Kaspari, M., Helliker, B. R., et al. (2016). The energetic and carbon economic origins of leaf thermoregulation. Nat. Plants 2:16129. doi: 10.1038/nplants.2016.129
Michaletz, S. T., Weiser, M. D., Zhou, J., Kaspari, M., Helliker, B. R., and Enquist, B. J. (2015). Plant thermoregulation: energetics, trait–environment interactions, and carbon economics. Trends Ecol. Evol. 30, 714–724. doi: 10.1016/j.tree.2015.09.006
Nobel, P. S. (1999). Physicochemical & Environmental Plant Physiology. San Diego, CA: Academic Press.
Oren, R., Sperry, J., Katul, G., Pataki, D., Ewers, B., Phillips, N., et al. (1999). Survey and synthesis of intra-and interspecific variation in stomatal sensitivity to vapour pressure deficit. Plant Cell Environ. 22, 1515–1526. doi: 10.1046/j.1365-3040.1999.00513.x
O'sullivan, O. S., Heskel, M. A., Reich, P. B., Tjoelker, M. G., Weerasinghe, L. K., Penillard, A., et al. (2017). Thermal limits of leaf metabolism across biomes. Glob. Change Biol. 23, 209–223. doi: 10.1111/gcb.13477
O'sullivan, O. S., Weerasinghe, K., Evans, J. R., Egerton, J. J., Tjoelker, M. G., and Atkin, O. K. (2013). High-resolution temperature responses of leaf respiration in snow gum (Eucalyptus pauciflora) reveal high-temperature limits to respiratory function. Plant Cell Environ. 36, 1268–1284. doi: 10.1111/pce.12057
Parkhurst, D. F., and Loucks, O. (1972). Optimal leaf size in relation to environment. J. Ecol. 60, 505–537. doi: 10.2307/2258359
Parmesan, C., and Hanley, M. E. (2015). Plants and climate change: complexities and surprises. Ann. Bot. 116, 849–864. doi: 10.1093/aob/mcv169
Peña, M. A., Feeley, K. J., and Duque, A. (2018). Effects of endogenous and exogenous processes on aboveground biomass stocks and dynamics in Andean forests. Plant Ecol. 219, 1481–1492. doi: 10.1007/s11258-018-0895-2
Perez, T. M., Stroud, J. T., and Feeley, K. J. (2016). Thermal trouble in the tropics. Science 351, 1392–1393. doi: 10.1126/science.aaf3343
R Core Team (2018). R: A Language and Environment for Statistical Computing. Vienna: R Foundation for Statistical Computing.
Rey-Sánchez, A. C., Slot, M., Posada, J. M., and Kitajima, K. (2016). Spatial and seasonal variation in leaf temperature within the canopy of a tropical forest. Clim. Res. 71, 75–89. doi: 10.3354/cr01427
Rohde, R., Muller, R., Jacobsen, R., Muller, E., Perlmutter, S., Rosenfeld, A., et al. (2013). A new estimate of the average earth surface land temperature spanning 1753–2011. Geoinfor Geostat An Overview 1. doi: 10.4172/2327-4581.1000101
Saxe, H., Cannell, M. G. R., Johnsen, Ø., Ryan, M. G., and Vourlitis, G. (2001). Tree and forest functioning in response to global warming. New Phytol. 149, 369–399. doi: 10.1046/j.1469-8137.2001.00057.x
Sears, M. W., Raskin, E., and Angilletta Jr, M. J. (2011). The world is not flat: defining relevant thermal landscapes in the context of climate change. Integr. Comp. Biol. 51, 666–675. doi: 10.1093/icb/icr111
Slot, M., Krause, G. H., Krause, B., Hernandez, G. G., and Winter, K. (2019). Photosynthetic heat tolerance of shade and sun leaves of three tropical tree species. Photosynth Res. 141, 119–130. doi: 10.1007/s11120-018-0563-3
Smith, W. K. (1978). Temperatures of desert plants: another perspective on the adaptability of leaf size. Science 201, 614–616. doi: 10.1126/science.201.4356.614
Tito, R., Vasconcelos, H. L., and Feeley, K. J. (2018). Global climate change increases risk of crop yield losses and food insecurity in the tropical Andes. Glob. Change Biol. 24, e592–e602. doi: 10.1111/gcb.13959
Valencia, R., Foster, R. B., Villa, G., Condit, R., Svenning, J. C., Hernández, C., et al. (2004). Tree species distributions and local habitat variation in the Amazon: large forest plot in eastern Ecuador. J. Ecol. 92, 214–229. doi: 10.1111/j.0022-0477.2004.00876.x
Wagner, F., Rutishauser, E., Blanc, L., and Herault, B. (2010). Effects of plot size and census interval on descriptors of forest structure and dynamics. Biotropica 42, 664–671. doi: 10.1111/j.1744-7429.2010.00644.x
Wiens, J. J. (2016). Climate-related local extinctions are already widespread among plant and animal species. PLoS Biol. 14:e2001104. doi: 10.1371/journal.pbio.2001104
Wright, I. J., Dong, N., Maire, V., Prentice, I. C., Westoby, M., Díaz, S., et al. (2017). Global climatic drivers of leaf size. Science 357, 917–921. doi: 10.1126/science.aal4760
Zhu, L., Bloomfield, K. J., Hocart, C. H., Egerton, J. J. G., O'sullivan, O. S., Penillard, A., et al. (2018). Plasticity of photosynthetic heat tolerance in plants adapted to thermally contrasting biomes. Plant Cell Environ. 41, 1251–1262. doi: 10.1111/pce.13133
Keywords: climate change, tropical cloudforests, thermophilization, leaf temperatures, microclimate, leaf traits
Citation: Feeley K, Martinez-Villa J, Perez T, Silva Duque A, Triviño Gonzalez D and Duque A (2020) The Thermal Tolerances, Distributions, and Performances of Tropical Montane Tree Species. Front. For. Glob. Change 3:25. doi: 10.3389/ffgc.2020.00025
Received: 12 September 2019; Accepted: 24 February 2020;
Published: 13 March 2020.
Edited by:
Yadvinder Malhi, University of Oxford, United KingdomReviewed by:
Giuliano Maselli Locosselli, University of São Paulo, BrazilBradley Christoffersen, University of Texas Rio Grande Valley Edinburg, United States
Copyright © 2020 Feeley, Martinez-Villa, Perez, Silva Duque, Triviño Gonzalez and Duque. This is an open-access article distributed under the terms of the Creative Commons Attribution License (CC BY). The use, distribution or reproduction in other forums is permitted, provided the original author(s) and the copyright owner(s) are credited and that the original publication in this journal is cited, in accordance with accepted academic practice. No use, distribution or reproduction is permitted which does not comply with these terms.
*Correspondence: Kenneth Feeley, kjfeeley@gmail.com