Assessing Boreal Peat Fire Severity and Vulnerability of Peatlands to Early Season Wildland Fire
 Laura Louise Bourgeau-Chavez1*
  Sarah L. Grelik1
  Michael Billmire1
  Liza K. Jenkins1
  Eric S. Kasischke2 Merritt R. Turetsky3
- 1Michigan Tech Research Institute, Michigan Technological University, Ann Arbor, MI, United States
- 2Department of Geographical Sciences, University of Maryland, College Park, College Park, MD, United States
- 3Department of Ecology and Evolutionary Biology, Institute of Arctic and Alpine Research, University of Colorado Boulder, Boulder, CO, United States
Globally peatlands store large amounts of carbon belowground with 80% distributed in boreal regions of the northern hemisphere. Climate warming and drying of the boreal region has been documented as affecting fire regimes, with increased fire frequency, severity and extent. While much research is dedicated to assessing changes in boreal uplands, few research efforts are focused on the vulnerability of boreal peatlands to wildfire. In this case study, an integration of field data collection, land cover mapping of peatland types and Landsat-based fire severity mapping was conducted for four early season (May to mid-June) wildfires where peatlands are abundant in northeastern Alberta Canada. The goal was to better understand if peatlands burn more or less preferentially than uplands in fires and how severely the organic soil layers (peat) of different peatland ecotypes burn. The focus was on early season wildfires because they dominated the research area in the decade of study. To do this, a novel Landsat-5 metric was developed to retrieve fire severity of the organic surface layer. Spatial comparisons and statistical analysis showed that proportionally bogs are more likely to burn in early season Alberta wildfires than other ecosystem types, even fire-prone upland conifer. Although for a small sample, we found that when fire weather conditions for the duff layers are severe, the fens of this study appear to become more susceptible to burning. In addition, overall bogs experienced greater severity of burn to the peat layers than fens. Due to the small sample size of peat loss from fire in uplands and limited geographic area of this case study, we were unable to assess if bogs are burning more severely than uplands. Further analysis and Landsat algorithm development for organic soil fire severity in peatlands and uplands are needed to more fully understand trends in belowground consumption for wildfires of all seasons and boreal ecotypes.
Introduction
Peatlands are a class of wetland that are defined as often having saturated soils, anaerobic conditions and large deposits of partially decomposed organic plant material (peat) belowground. For peat to accumulate, the long-term rate of primary production must exceed the decomposition rate and losses from other sources, such as wildfire (Wieder and Lang, 1983; Vitt, 2006). To be designated as a “peatland” in Canada organic soil layers (peat) must be more than 40 cm in depth (Halsey et al., 2003). With the accrual of peat over millennia, rich peat deposits form to depths as great as 15–20 m below the surface (Clymo et al., 1998; Limpens et al., 2008). Globally, 80% of peatlands are in boreal regions of the northern hemisphere (Wieder et al., 2006) representing an estimated 1,016 to 1,105 Gt C stored as peat (Nichols and Peteet, 2019).
Wildfire is common to the boreal forest regions of western Canada and Alaska, and during large fire seasons, vast areas of forests and peatlands are burned. In this boreal region, climate change is extending fire seasons, accelerating fire frequency, and increasing fire size (Flannigan et al., 2009). Since peat-rich ecosystems, such as bogs and fens, sequester and store large amounts of carbon belowground, the effects of changing fire regimes could result in an alteration of the role of peatlands in the carbon cycle. It is, therefore, important to understand the vulnerability of peatlands, and in particular, the peat-rich soils to wildfire. Vulnerability is defined by Weißhuhn et al. (2018) as having three elements: (1) exposure, which in this case is probability of wildfire disturbance; (2) sensitivity, which in this case is susceptibility to the wildfire hazard; and (3) adaptive capacity, which is related to resilience. In this study we address the first two of these elements directly and assess whether peatland ecotypes may be more or less vulnerable to wildfire in the early season.
During the 2004–2014 decade, large early season fires were more common than mid- to late- season fires in Alberta; with a total of 1,136 individual fires burning in the early season (May 20 to June 21) consuming 1.6 million ha versus 1,029 individual fires burning 1.2 million ha during the mid- to late-season (June 21–October 1; Canadian Forest Service, 2017). For the years of our fire study (2009–2011) early season fires were overwhelmingly more common; 435 fires burned in the early season consuming 1.0 million ha and 296 fires burned in the late season consuming approximately 138,000 ha. Given that in the later season moisture conditions are generally lower, fires may be burning less deeply in the early season.
While analyses of fire occurrence have shown that upland areas and peatlands have an equal probability of occurring within a perimeter of a large fire event (Turetsky et al., 2004), analyses of satellite imagery and aerial photographs have shown that during large fire events, not all portions of the landscape burn. Typically, unburned patches or islands exist within the burn perimeter (Fraser et al., 2004; Kasischke and Hoy, 2012). This leads to the question: What factors contribute to the occurrence of unburned areas within large boreal fires, especially in areas with extensive peatlands? Are the unburned islands more likely to be peatlands? Here, we present a case study of a series of wildland fires that occurred in northeastern Alberta during the late 2000s. For this study, we used a combination of field-based observations of fire severity, satellite remote sensing, and maps of peatland types to ask the following questions: (1) Are peatlands more or less susceptible to burning than upland areas during early season wildland fires?; and (2) How does peatland type contribute to vulnerability to burning and belowground consumption during early season wildland fires?
Northeastern Alberta, Canada is located in the Boreal Plains Ecozone and contains extensive peatland complexes (>30% of the area) intermixed with uplands among the low-lying valleys and plains. The northern Boreal Plains are vegetated primarily by three coniferous tree species Picea glauca (white spruce), Picea mariana (black spruce), and Pinus banksiana (jack pine), and two deciduous tree species, Populus balsamifera (balsam poplar) and Populus tremuloides (trembling apen). Larix laricina (tamarack), a deciduous conifer, also occurs in wetland areas with black spruce. Picea mariana is a fire-adapted, dominant tree species of northern Alberta and across boreal North America in both upland and lowland areas. Both tamarack and black spruce are flammable.
When wildfire occurs in upland and peatland ecosystems that are dominated by Picea mariana the fires are typically crown fires, i.e., the trees are killed and crown biomass is wholly or partially consumed (Figure 1). The organic soil layers (peat), where much of the organic carbon is stored, are also burned to various depths. However, in the early season the ground is often still frozen and the leaves on deciduous plants may not have flushed or they may be fully flushed depending on the year. If the leaves have not flushed then the surface fuels are well cured, ground cover and low trees and shrubs are more susceptible to burning, thus allowing fire to carry into the crowns of trees. Meanwhile, the deep organic layers of the soil profile may be less susceptible to burning because of the frozen condition near the surface, which typically results in poor drainage and high soil moisture immediately above the frozen layer.
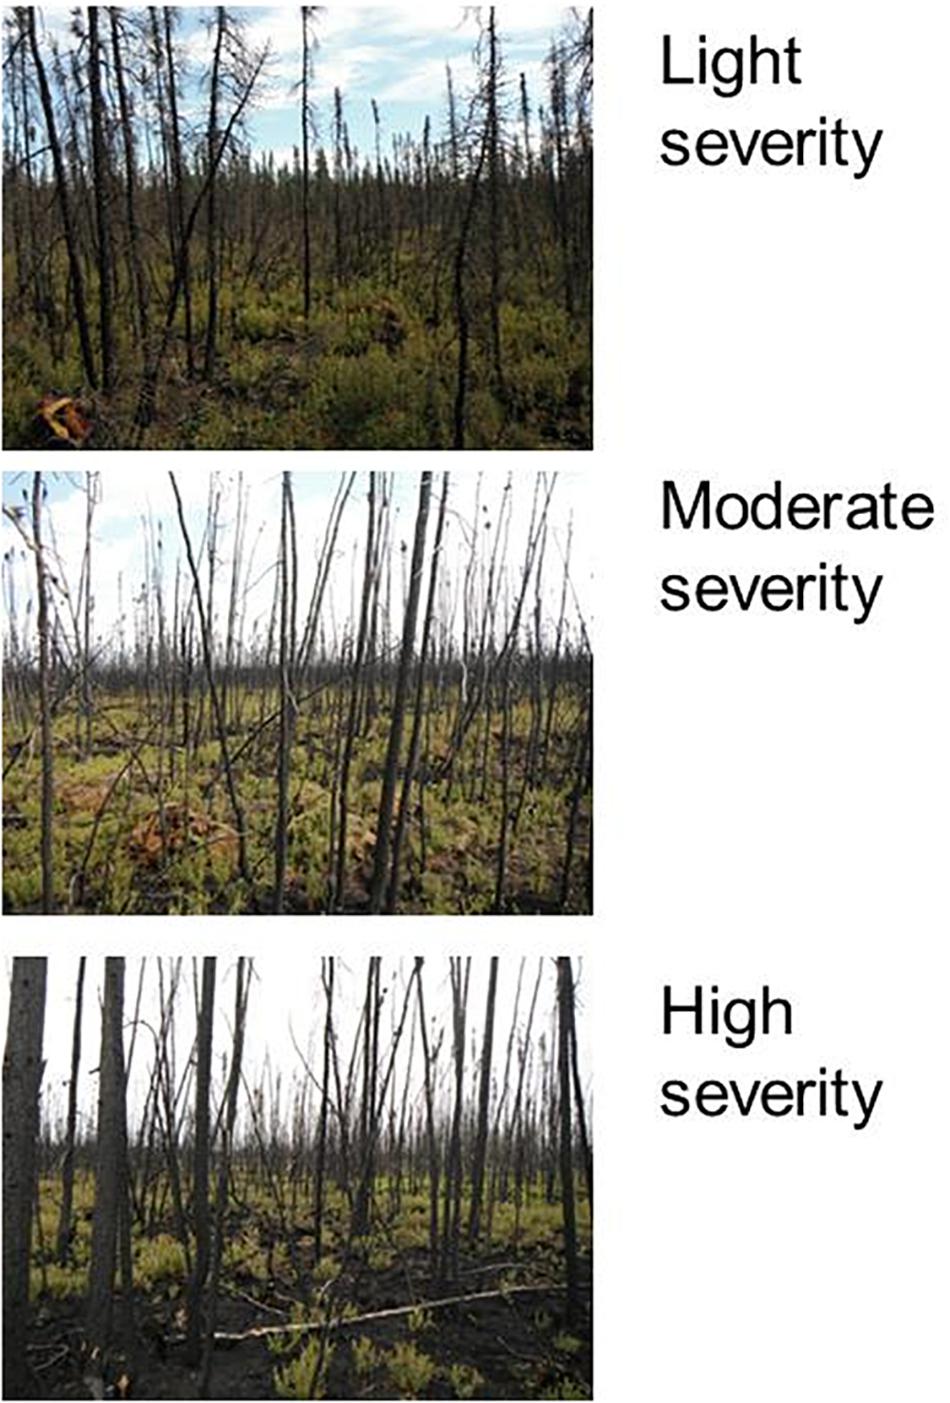
Figure 1. Example of light, moderate and high canopy consumption in the Alberta early season wildfires.
To answer the questions concerning vulnerability of peatlands to early season burning, an integration of field data collection, land cover mapping of peatland types (Bourgeau-Chavez et al., 2017) and Landsat-based fire severity mapping was conducted for four wildfires in northeastern Alberta Canada, approximately 175 km north of Edmonton. These fires were chosen due to the composition of large areas of peatland accessible from the road network.
Materials and Methods
Study Area
Four early season wildfires (Utikuma, Fort McMurray MWF24 & MWF27 and Kidney Lake) that together are comprised of 47% peatlands, 45% uplands and 8% other wetlands (marshes and swamps) were the focus of study (Figure 2 and Table 1). The wildfires ranged in size from 4,742 to 88,702 hectares (Table 1). Three of the fires were lightning-caused from June 2009 and one was human-caused from mid-May 2011.
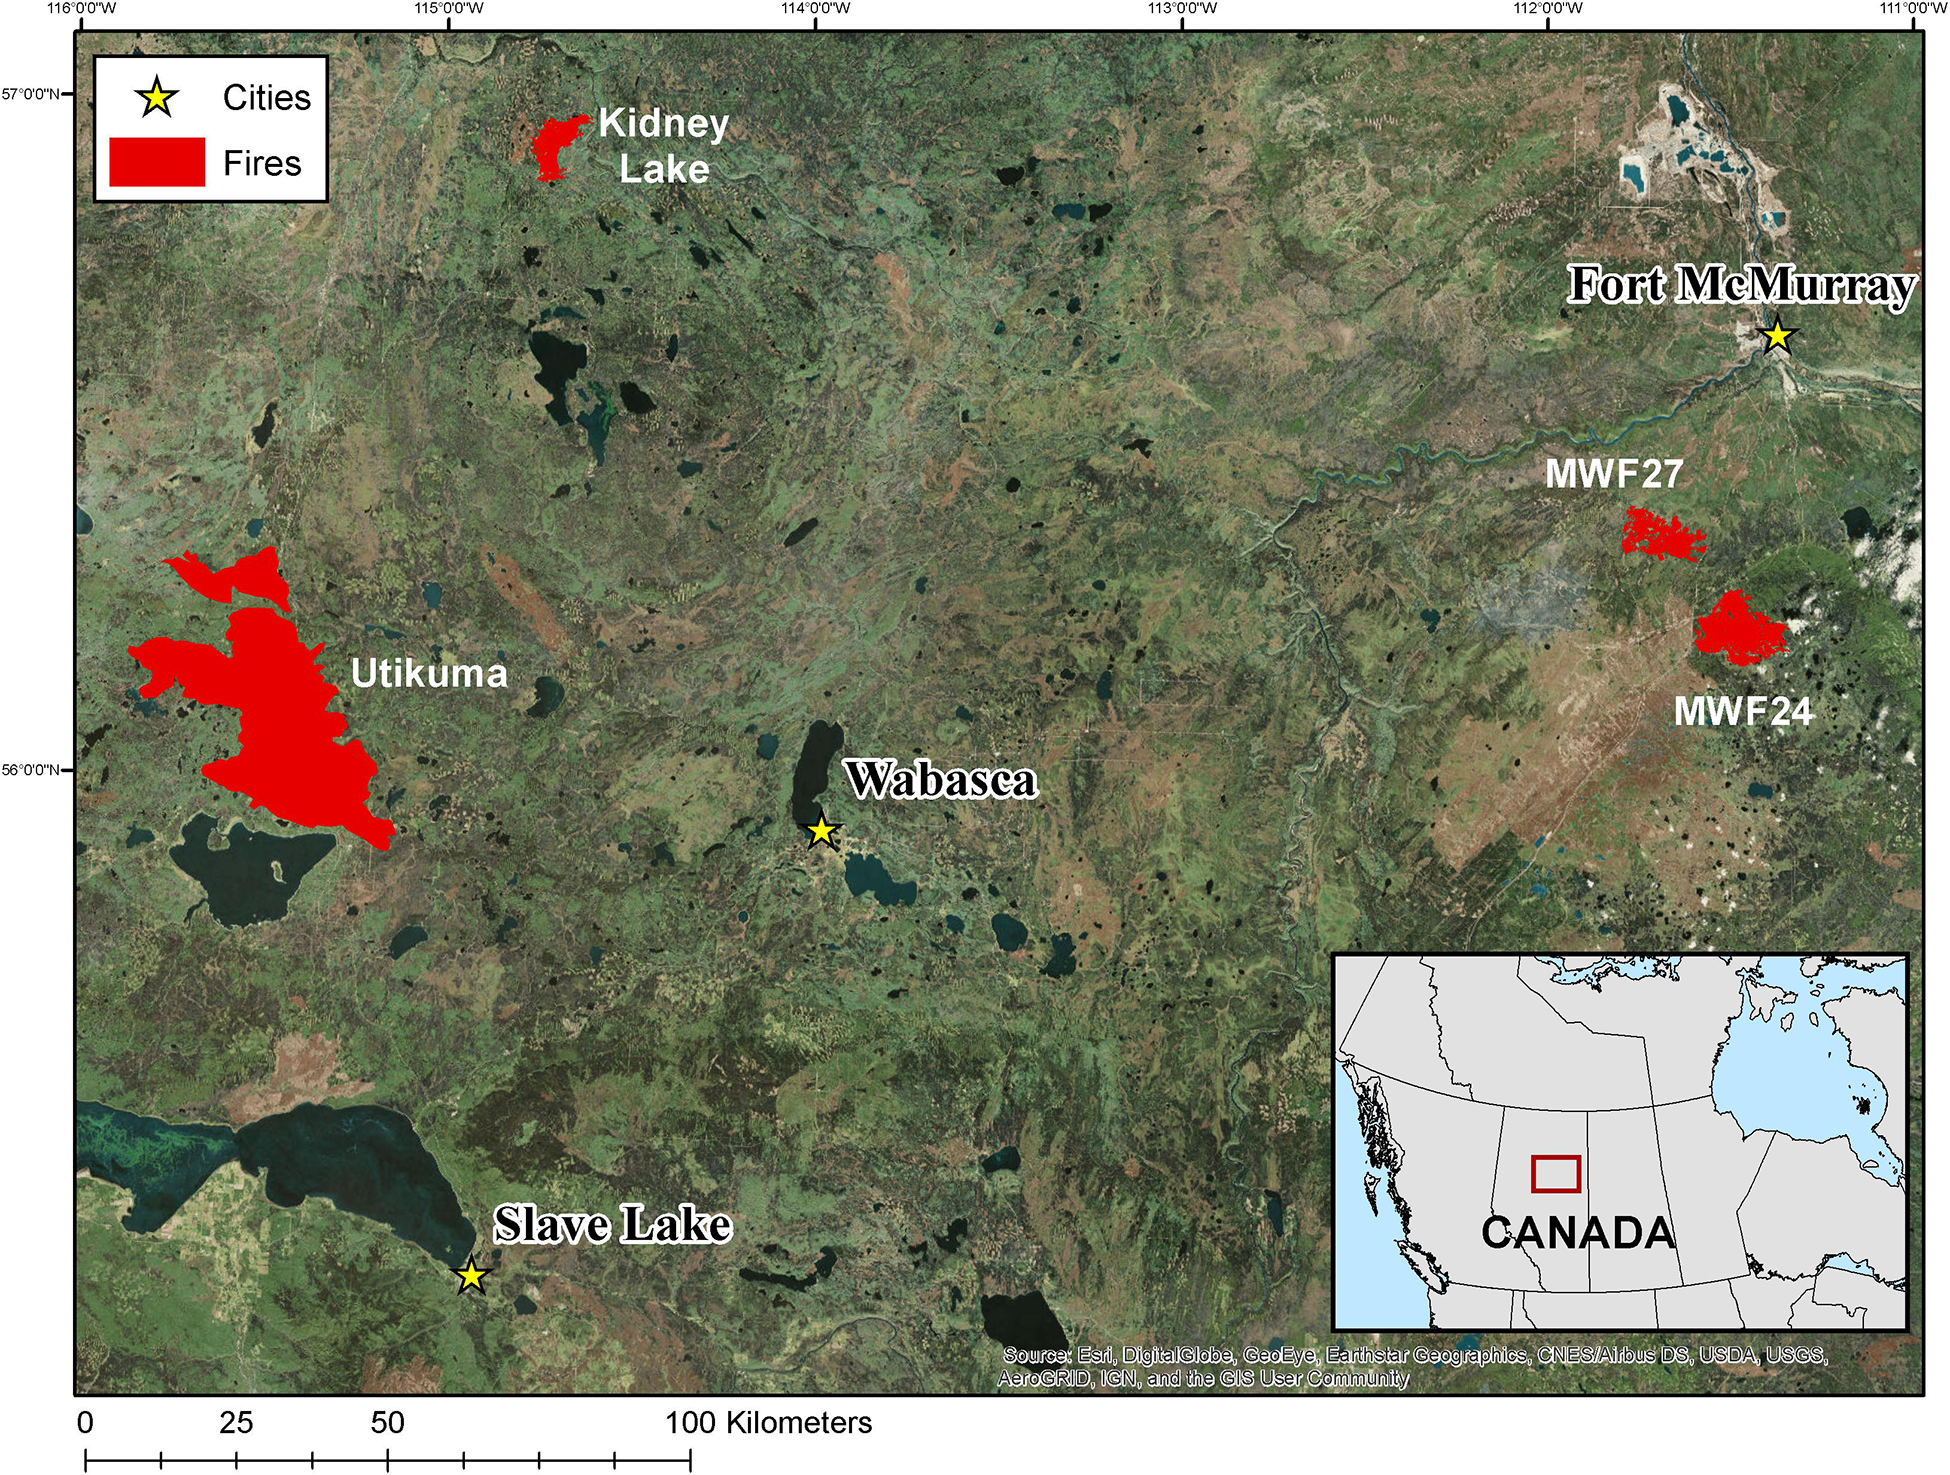
Figure 2. Map of the four early season wildfires of Northeastern Alberta under study.
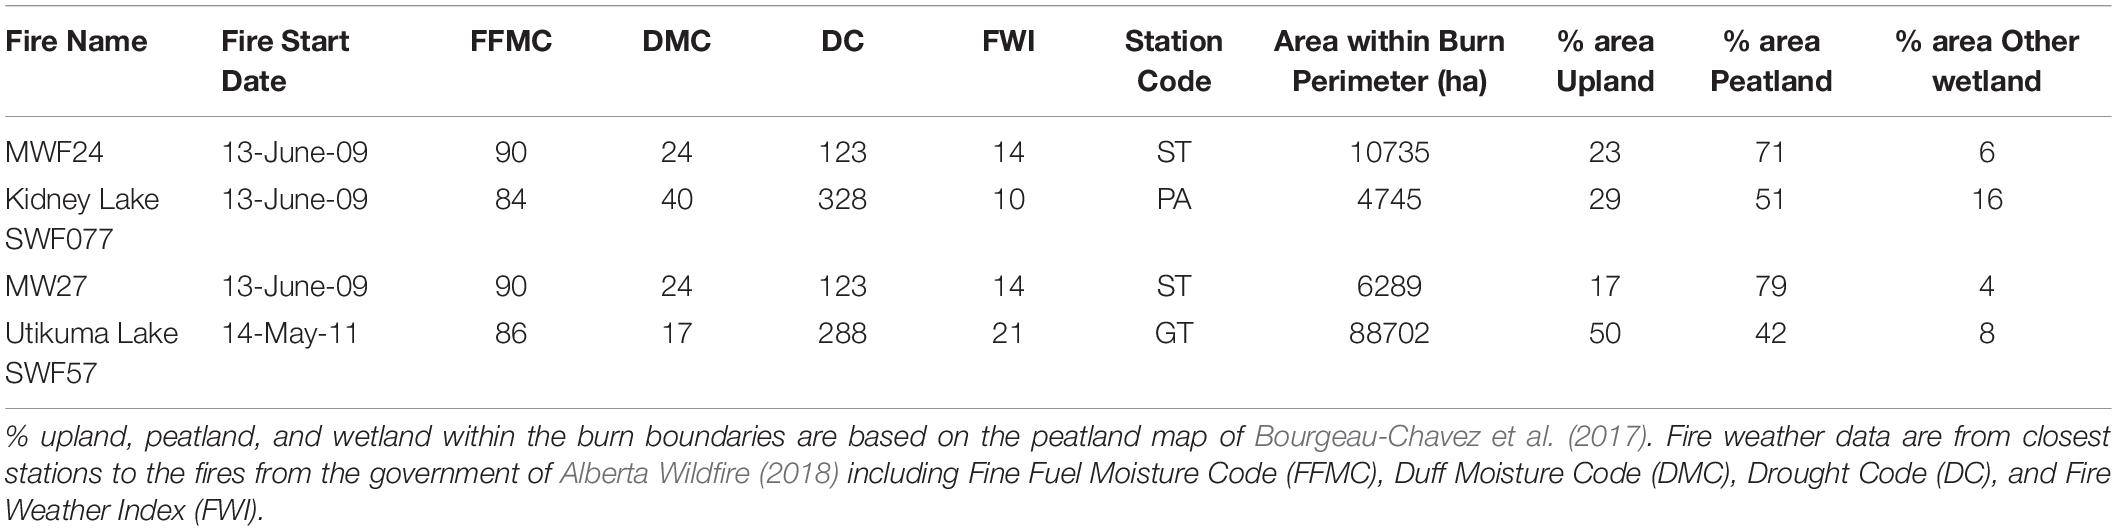
Table 1. Burn area statistics for four wildfires studied in Northeastern Alberta, Canada.
The regional climate of northeastern Alberta consists of short, warm summers and long, cold winters with low average annual precipitation (∼300 mm in the west to ∼625 mm in the east). Permafrost is isolated north of Ft. McMurray, at higher elevations and in the Birch Mountains, while it is non-existent in the remainder of the region (Ecological Stratification Working Group, 1995). Soils of these Alberta ecosystems are predominantly organic peat, capable of burning, smoldering or otherwise sustaining wildfire.
Peat is defined here as partially decomposed organic plant material below ground (organic soil layers). A peatland has large accumulations of peat (organic soil layers) which must be more than 40 cm in depth to be designated as a “peatland” in Canada.
As a controlling factor in fire danger, fuel moisture affects the potential for fire ignition, rate of spread and fire sustainability. For prediction of the potential for wildfire and wildfire behavior, resource managers rely on the Canadian Forest Fire Danger Rating System. This system includes a Fire Weather Index (FWI) system to predict the potential for wildfire (Taylor and Alexander, 2006). The FWI is a semi-empirically derived system based on daily accounting of weather parameters sampled at noon (local time) at designated weather stations. We used the FWI indices from the government of Alberta Wildfire (2018) to compare the fire weather conditions at the start of each of the four wildfires of study (Table 1). Three of the components are designed to estimate the moisture content in three distinct layers of organic soil (note that the exact depths will vary by site): (1) Fine Fuel Moisture Code (FFMC) represents moisture in the litter material to a nominal depth of 1.2 cm (Van Wagner, 1987) and ranges from 0 to 101; (2) Duff Moisture Code (DMC) represents moisture in the loosely compact upper duff material about 5–10 cm depth and it is open-ended but highest probable value is 150; and (3) Drought Code (DC) represents moisture in the deeper more compact lower duff layers, about 10–20 cm in depth and ranges from 15 to a maximum probable value of 800 (de Groot, 1988).
For our four fires, the first of these components, fine fuel moisture code (FFMC), showed high (84–90) values indicative of high fire ignition potential. The duff moisture code (DMC) was highest for the Kidney Lake fire (40), lower for the MWF fires (24) and lowest for the Utikuma fire (17). DMC indicates the probability of igniting fire and fuel consumption in moderate duff. Drought code (DC) which is an indication of a wildfire to sustain itself was moderate for Utikuma and Kidney Lake (288 and 328, respectively), and fairly low for the MWF024 and 027 fires (123). DC is also indicative of the potential for fuel consumption of deep organic layers.
FWI, an overall rating of fire danger, was on the moderate to low side for all fires (<21). These indices provide a general guide of fuel moisture conditions. Since they are based on a point location of weather parameters, they do not account for the variability that would likely occur across a landscape, particularly in the early season with variable thawing depending on insolating vegetation, moss and other organic layers as well as variability in rainfall.
Field Data Collection
Field observations were collected in each of the 2009–2011 wildfires, in 2012 and 2013 from 49 plots within the Utikuma Lake fire, and from 50 plots in the other three, smaller fires. Sample plots were 10 m × 10 m in size, and located in the center of areas on the ground representing 30 × 30 m Landsat pixels.
The sites were selected to obtain a range of ecotypes and fire severities using Landsat-based dNBR maps, aerial images, and preliminary land cover maps (Bourgeau-Chavez et al., 2017). Sites were randomly selected but limited to accessible areas via roads within a maximum 1.0 km walking distance.
For this study, three different metrics, focusing on the ground and peat layers, were sampled in the field plots to relate to remote sensing for mapping soil organic layer severity. These metrics also needed to be suitable for the fire emissions and effects model, CanFIRE (de Groot, 2012), for estimating carbon emissions, which is a second focus of the study. (1) The first metric sampled was the average depth of burn. This variable was estimated by sampling adventitious roots of black spruce present in the plots using methods of Kasischke et al. (2008). Adventitious root data were collected along three transect lines established within each plot and averaged. This provides a direct estimate of depth of burn. Adventitious roots typically sprout from black spruce trunks in the organic soil and moss layers. Post-fire some of these millimeter-sized roots are visible. Since these typically grow in the top of the organic layers they can be used to estimate where the top of the organic soil was pre-fire. (2) The second metric of severity was an ocular estimate of the percent of unburned moss present in each plot. This assumes that belowground consumption is related to the proportion of unburned moss at a site. (3) The final approach to measure severity was to collect data on spatial patterning of burning to the ground/belowground peat layers to estimate the Burn Severity Index (BSI - Bourgeau-Chavez, 1994; Loboda et al., 2013; Whitman et al., 2018). BSI is based on the field methods of Dyrness and Norum (1983) who defined a five-point system to categorize fire severity to the ground and organic soil layers using an ocular assessment of condition across the study plot. In the 5-point system, one is unburned moss/ground layer and five is severely burned (exposed mineral soil). It is different from Composite Burn Index (CBI) sampling (Key and Benson, 2005) in that it measures the proportion of burn in each of the five categories within the plot and is focused only on the ground surface. Since the metric is a spatial estimation of variability in a plot, it should provide a better indicator for relating to remote sensing. For peatlands, we modified the categories, using ratings from one to four because there were no exposed mineral soils in the study area. The BSI provides one number calculated from the sum of the proportion of each severity class (1–4) in the plot to correlate to Landsat data.
Peatland Type Map
The peatland type map used in this analysis was created from archival Landsat and ALOS PALSAR multi-date data using field data and air photo interpretation for training in a machine learning classifier and is described in Bourgeau-Chavez et al. (2015, 2017). This map included five wetland/peatland classes (marsh, swamp, open fen, treed fen, bog), two upland forest classes (coniferous, deciduous), and four non-vegetated classes (water, recently burned, barren/logged). The upland versus lowland classes were based on landscape position and dominant cover type as assessed in the field during collection of training data by Bourgeau-Chavez et al. (2017). The PALSAR data are sensitive to moisture and inundation beneath vegetation canopies. The SAR data were thus relied upon to distinguish “wetland” from “upland” classes in the classifier. The map had 93% overall accuracy and peatland classes had over 88% accuracy, upland forest (deciduous, coniferous) had accuracies of 93–98%. The map represents conditions circa 2007 (imagery ranged from 2002 to 2009), a few years before the wildfires of 2009–2011.
Landsat-5 Soil Organic Layer Severity Mapping
While standard difference normalized burn ratio (dNBR using Landsat-5 bands 4 = Near IR and 7 = SWIR 2) metrics for assessing upland fire severity in boreal forest regions in North America exist for Landsat data (French et al., 2008; Kasischke et al., 2008), they have not been tested in peatlands. For this study, we were interested in assessing the severity to the ground and organic soil (peat) layers, where most of the carbon is stored and the vulnerability to wildfire needed to be assessed. Most severity studies have focused on the aggregate of aboveground canopy and surface severity, such as the field-based composite burn index (CBI) which has been shown to relate well with dNBR. As this study is focused on soil organic layer severity (organic surface and belowground severity consumption), we explored relating our field-based metrics to dNBR along with other Landsat-5 band combinations in order to develop the best remote sensing algorithm for soil organic layer severity retrieval. The approach was similar to previously developed algorithms in that it used Landsat-5 pre- and post- anniversary date imagery (e.g., Key and Benson, 2005). The development deviated from other approaches by exploring additional radiometric bands outside of the commonly used dNBR to relate to fire severity (Miller and Thode, 2007; Hall et al., 2008; Parks et al., 2014).
In addition to Landsat-5 bands, dNBR, rdNBR, tasseled-cap greenness, brightness, and wetness were included in the evaluation (Table 2). Multivariate models were developed for each of the three metrics sampled in the field: %-unburned-moss, depth-of-burn, and burn severity index (BSI).
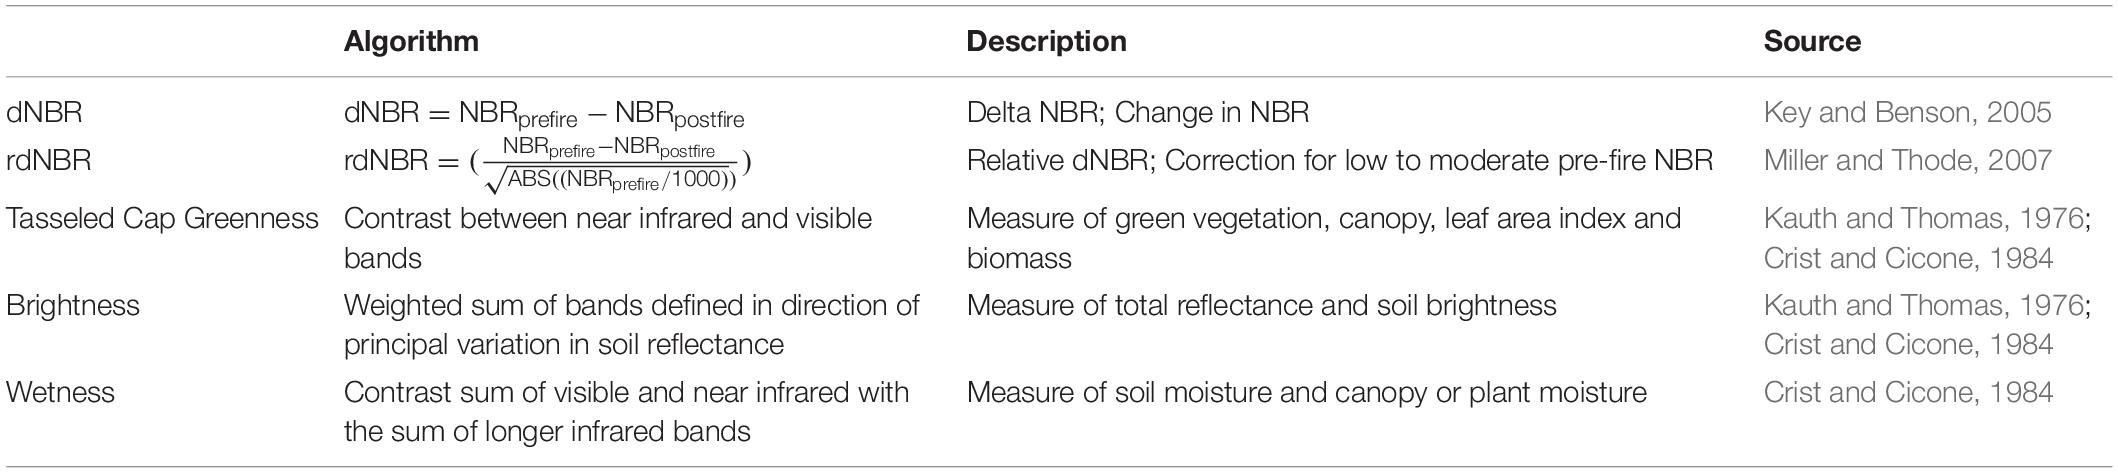
Table 2. Summary of Landsat indices used in developing the soil organic layer severity algorithm.
Differenced band ratios referred to here as Diff-BX/BY were calculated as the difference of pre-burn normalized ratio of Landsat-5 bands X and Y and the post-burn normalized ratio of bands X and Y. For example:
Where:
Landsat-5-based algorithms were developed using the field data from the three wildfires sampled in 2013. To evaluate model suitability, the field data collected in 2012 for the Utikuma wildfire was used as validation. All models developed are applicable to spring peatland fires of Alberta and were not tested elsewhere for transferability.
Spatial and Statistical Analysis
All statistical analyses were conducted in R statistical software. To answer the first research question: “Are peatlands more or less vulnerable to burning than upland areas during early season wildland fires?” a chi-square goodness of fit test was applied. This test allowed us to determine whether fires burned preferentially in one ecosystem type over another. To do this we assessed whether an ecotype burned more or less preferentially based on a null model of its availability on the landscape. Thus, we compared ratios of observed area burned in each ecotype and expected values of area burned in each type. The expected values assumed an even distribution of burn area in each ecotype (i.e., bog, treed fen, upland conifer, etc.). To obtain expected values for areas burned by ecotype we first calculated the probability of burning. To compute probability of burning, we used the pre-fire peatland (and upland) type map and the fire perimeters. The probability of burning was equal to the ratio of the total area available for each ecotype per wildfire by the total area of all ecotypes available within each wildfire perimeter. Next to calculate the expected area burned we multiplied each probability by the total area across all ecotypes that actually burned per wildfire.
To answer the second research question: “How does peatland type contribute to vulnerability to burning and belowground consumption during early season wildland fires?” we intersected the peatland type map and soil organic layer severity map and evaluated and compared the general statistics of what burned and by how much.
Results and Discussion
Landsat Early Season Soil Organic Layer (Peat) Fire Severity Mapping
Correlations between the three metrics to the Landsat pre- and post-burn band combinations and band derivatives that had significant (p < 0.05) correlations greater than 0.6 (Table 3) included differences of bands B4 (near-IR) and B5 (SWIR-1 1.547–1.749 μm), differences of band B4 and B7 (SWIR-2 2.064–2.345 μm) as dNBR is calculated, differences between bands B2 (green) and B7, differences in tasseled cap wetness and post-burn tasseled cap greenness. The differenced Landsat-5 bands B4 and B5 had the highest correlations to all three field-based severity metrics (Table 3). Soil organic layer severity retrieval algorithms were therefore developed using Diff-B4/B5 (Table 4) for each of the three field-based metrics. The multivariate model for depth-of-burn was least satisfactory due to a low coefficient of determination (adjusted R2 = 0.39). BSI provided a spatial metric that was relatable to the soil organic layer severity and had a reasonable coefficient of determination (0.59). Percent unburned moss had the highest adjusted R2, but it was not much improved over BSI and for the remainder of the analysis we selected BSI due to its direct relation to measures of fire severity. Note that the field data were primarily from peatland sites, but several upland sites were included in the training and validation of the Landsat algorithm.
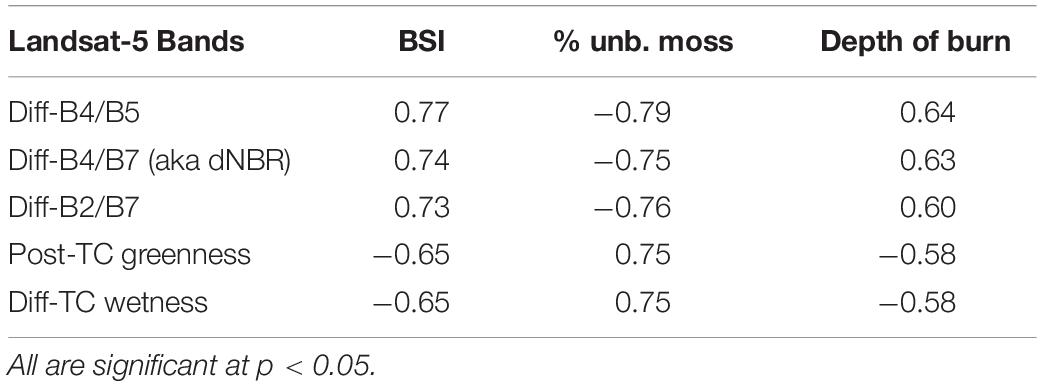
Table 3. Pearson correlations of Landsat difference (pre- and Post-burn) and post-burn band combinations to BSI, depth of burn and% unburned moss.
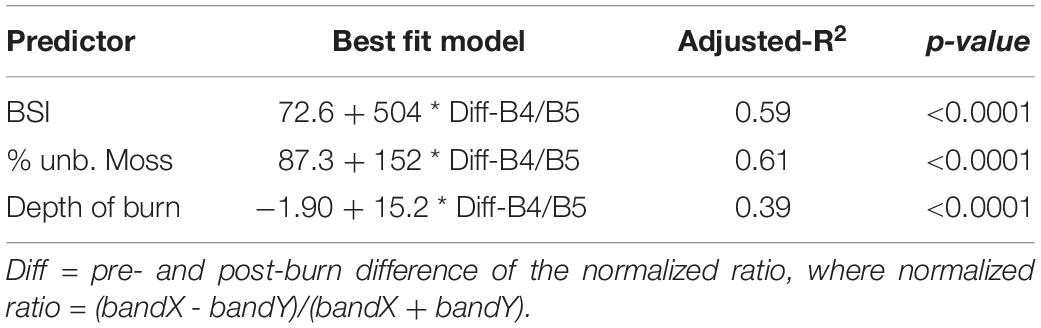
Table 4. Best fit models and adjusted coefficient of determination for each fire severity metric.
The best fit model (Supplementary Figure S1) for BSI is shown below using differenced band ratios as in equation 1:
We then tested this retrieval algorithm for suitability by applying it to the pre- and post-burn Landsat-5 data for the Utikuma Lake wildfire and using the reserved 2012 field dataset to assess model suitability. The predicted vs. actual (field-based) BSI assessment (Figure 3) for the 2012 dataset had a strong correlation of 0.78 (p < 0.0001). Since this model appeared suitable for retrieval of soil organic layer severity for the early season wildfires, Equation 2 was then applied to pre- and post-burn Landsat-5 data across the burned landscapes of the four wildfires of study.
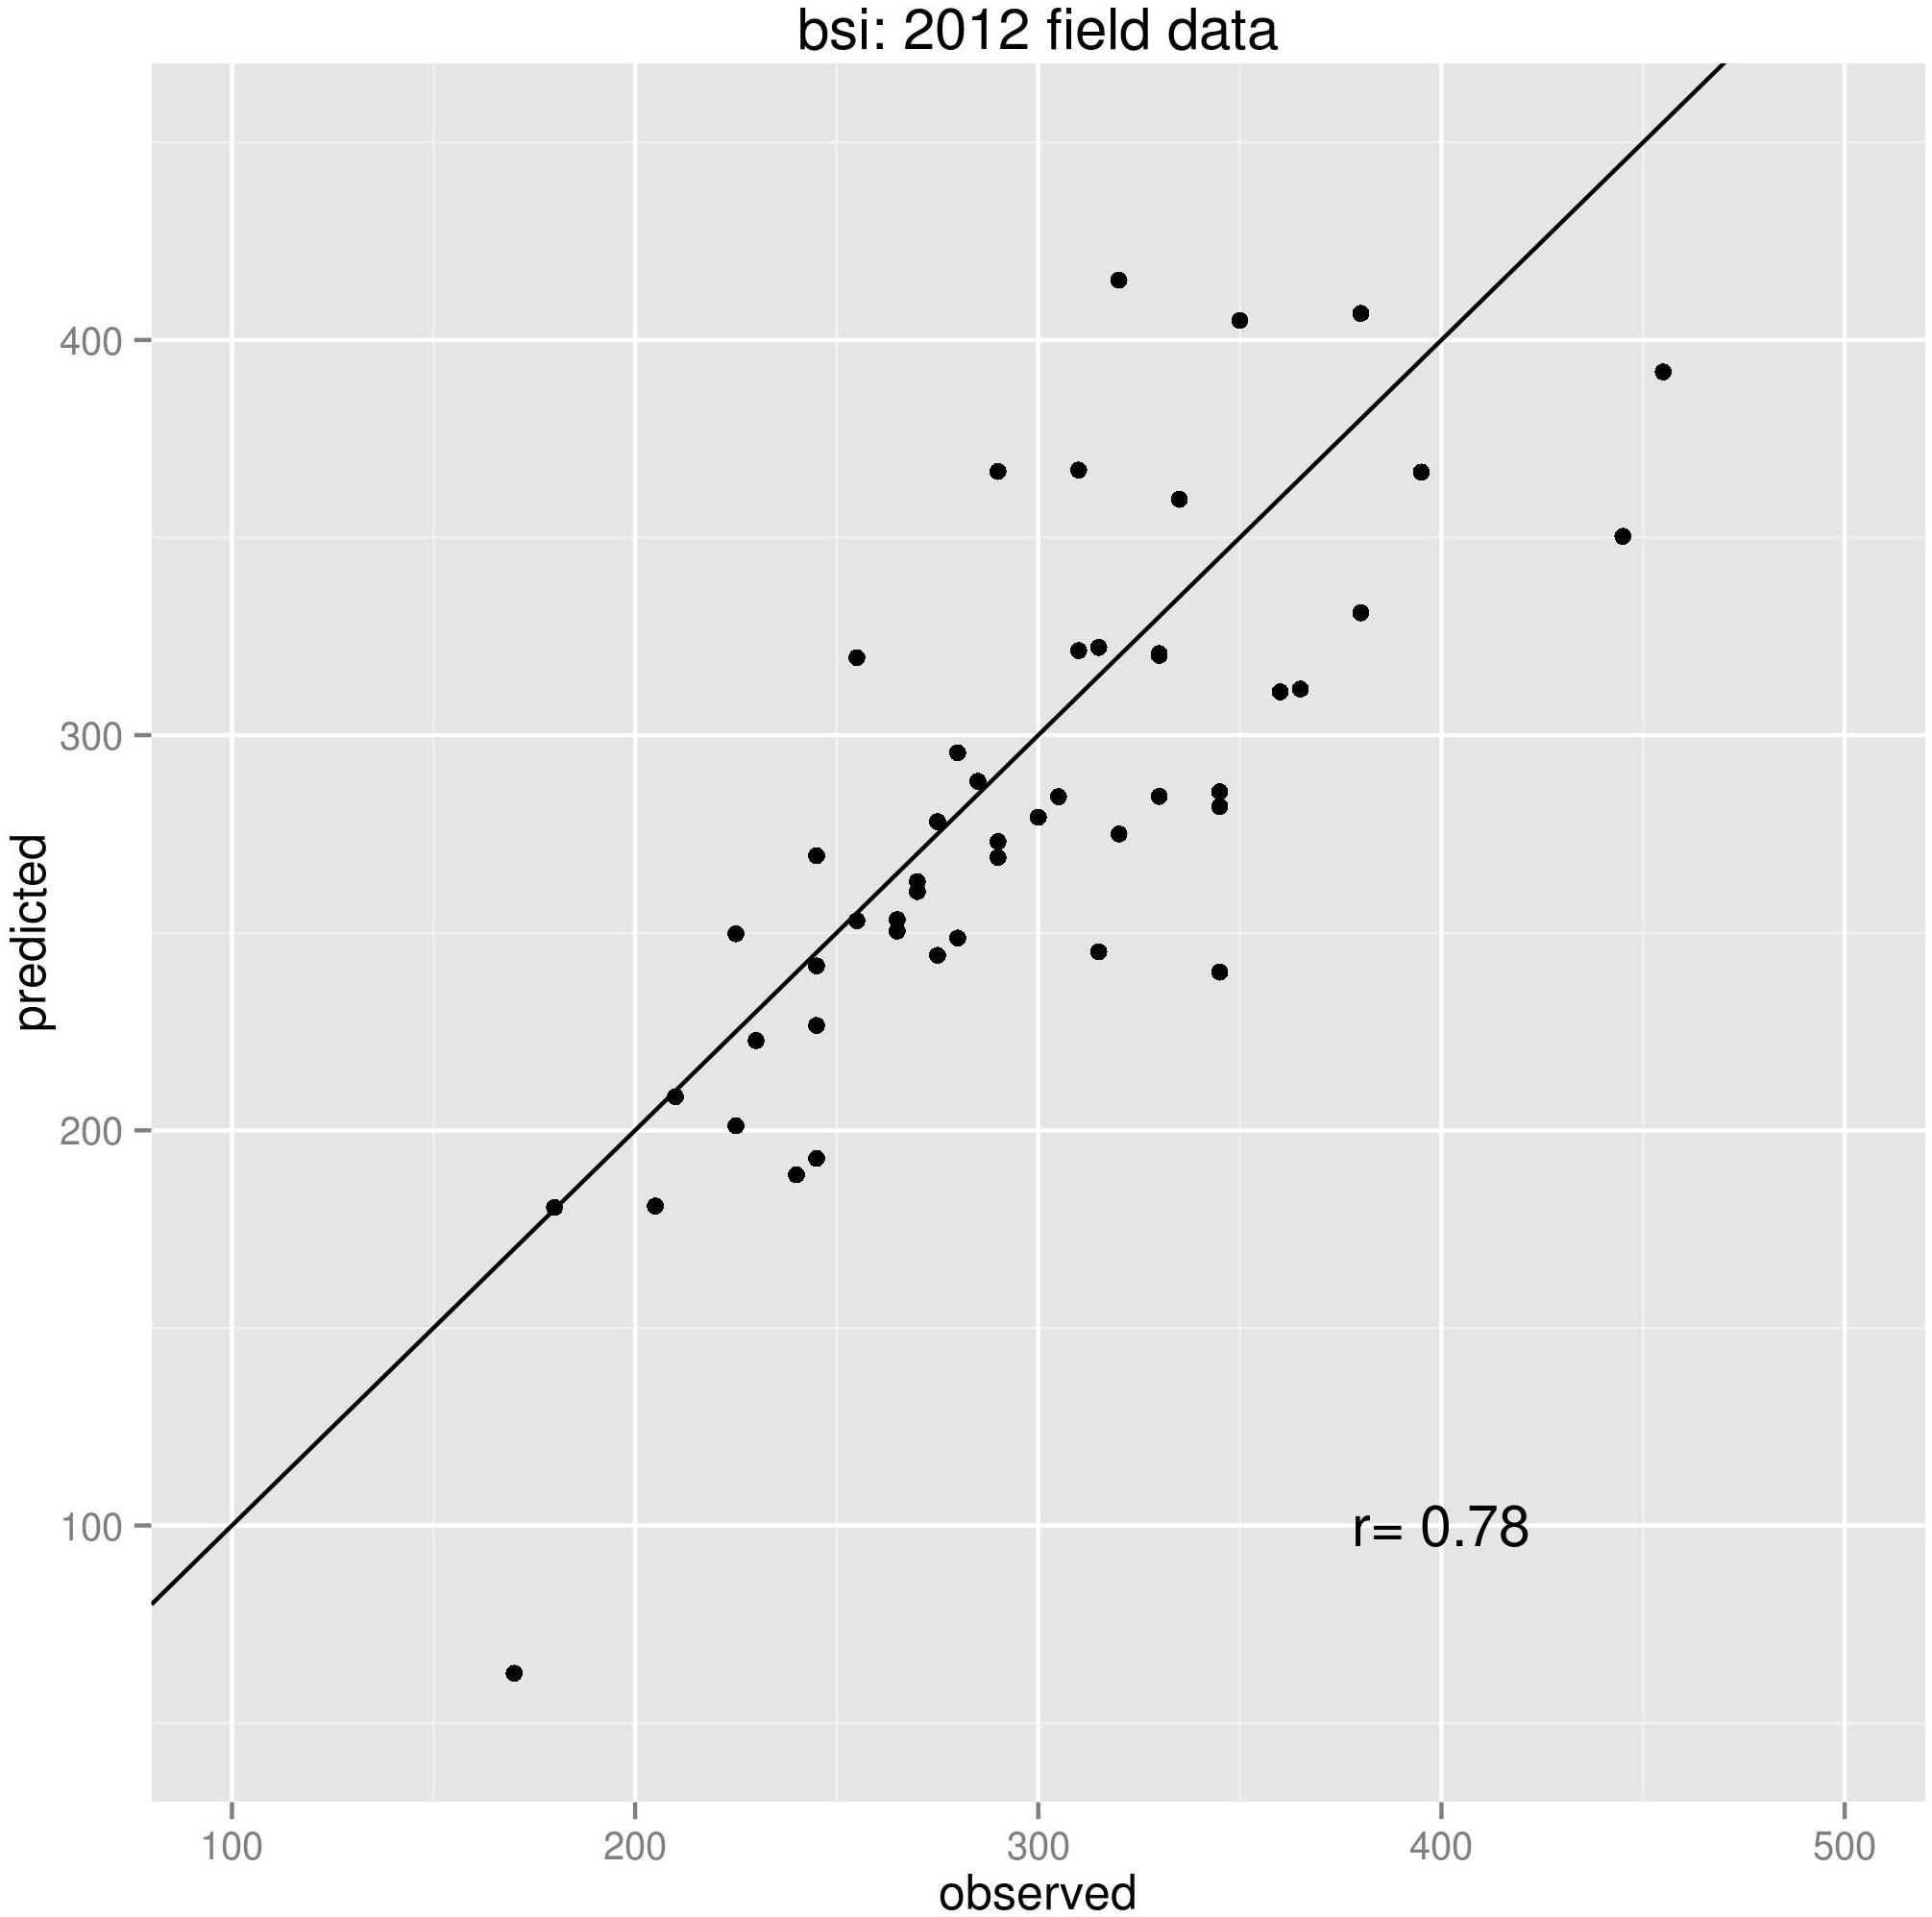
Figure 3. Landsat predicted vs. observed BSI for 2012 field data using the algorithm developed with 2013 field data.
In producing the soil organic layer severity maps for each fire, the range of Landsat values placed into each of the four BSI categories varied slightly due to differences in collection dates. It is known that differences in the timing of the collection of the Landsat-5 imagery can result in differences in the radiance measured by the system for the same surface, which in turn will result in differences in the metrics derived from the Landsat data (Verbyla et al., 2008). For each wildfire the Landsat pre- and post-burn imagery and Landsat mapped product were compared to field data to determine the breaks for the four BSI classes presented in Table 5.
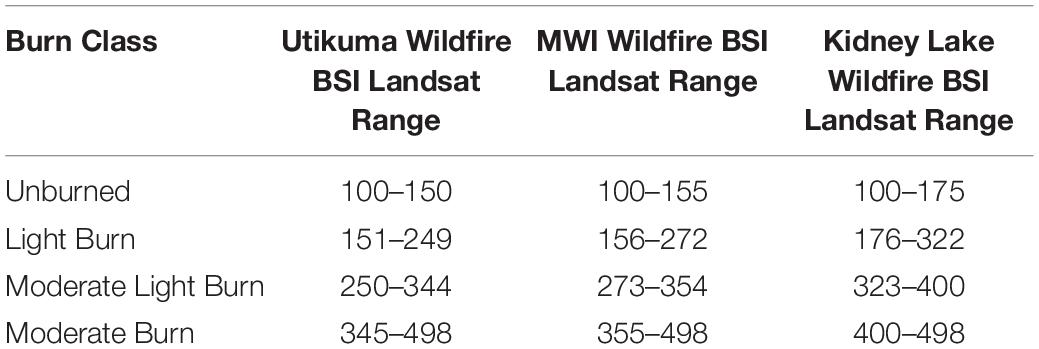
Table 5. Landsat BSI values binned for each burn class for each Landsat-image set/wildfire.
Comparison of Upland vs. Peatland Area Burned
To answer the question “Are peatlands more or less susceptible to burning than upland areas during early season wildland fires?” we needed binary maps of burned vs. unburned conditions for the four wildfires. Using the BSI maps of soil organic layer severity (Figure 4) we grouped BSI burn classes of Light, Moderate Light and Moderate (Table 5) into a single “burned” class versus the BSI “unburned” class (Table 5). The burned versus unburned maps were next intersected with the corresponding pre-burn peatland/upland landcover maps created from circa 2007 SAR and optical imagery (Bourgeau-Chavez et al., 2015, 2017Figure 4), thus allowing us to assess our first question (Table 6).
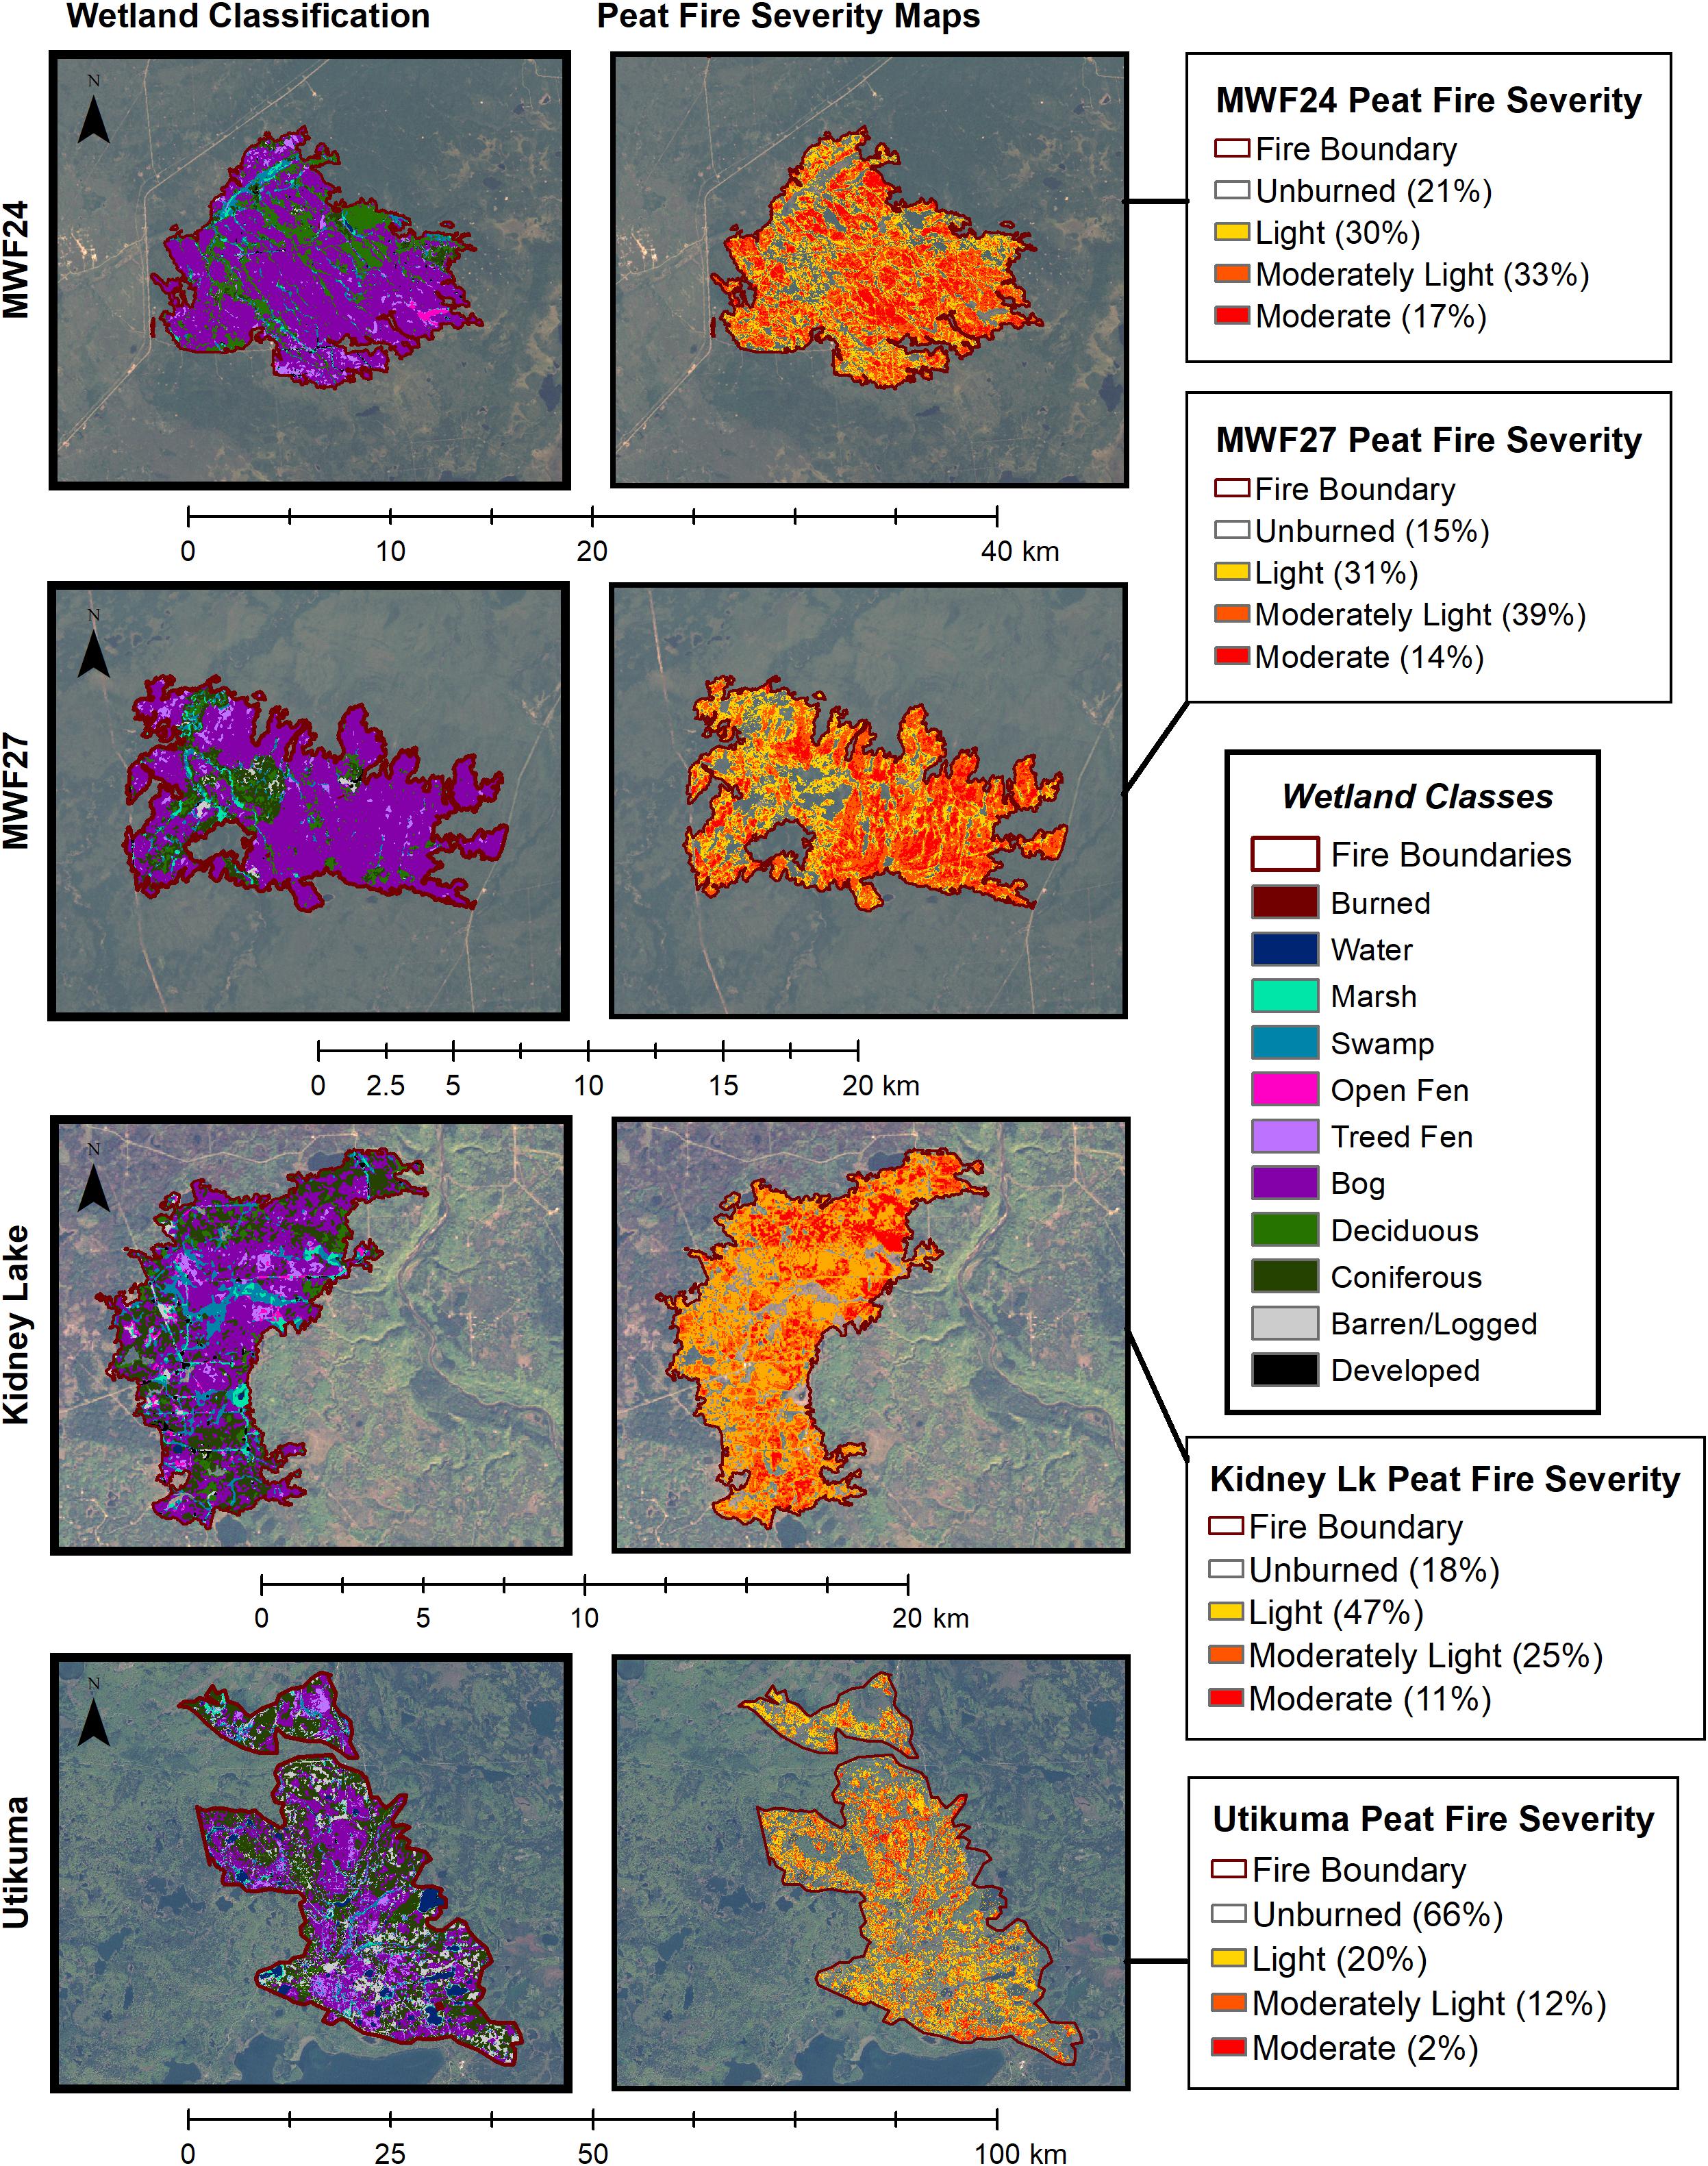
Figure 4. Wildfire mapped peatland classes (left, after Bourgeau-Chavez et al., 2015, 2017) and corresponding map to right showing the mapped burn severity based on Landsat model (equation 2) developed for peatlands (Bourgeau-Chavez et al., 2015) for: MWF24; MWF27; Kidney Lake; and Utikuma Lake fires.
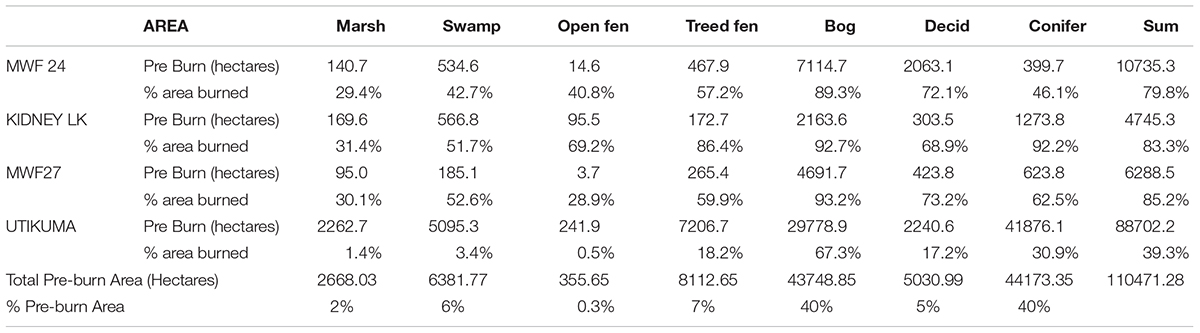
Table 6. Comparison of pre-burn ecotypes and area burned for each of the 4 early season wildfires of Alberta and summary statistics for all fires.
Based on the pre-fire landcover maps, conifer forest and bog each comprised 40% of the total area within the four wildfire perimeters (110,471 hectares). The next largest ecotype was treed fen covering 7% of the area (8,113 ha), deciduous upland 5% of the area (5,030.5 ha) while open fen covered only 0.3% of the area (356 ha) (Table 6). Of the 110,471 hectares exposed to wildfire within the perimeters of these four wildfires (Table 7), only 48% of land burned (52,737 of 110.471 ha) while the remaining area was left as unburned islands.
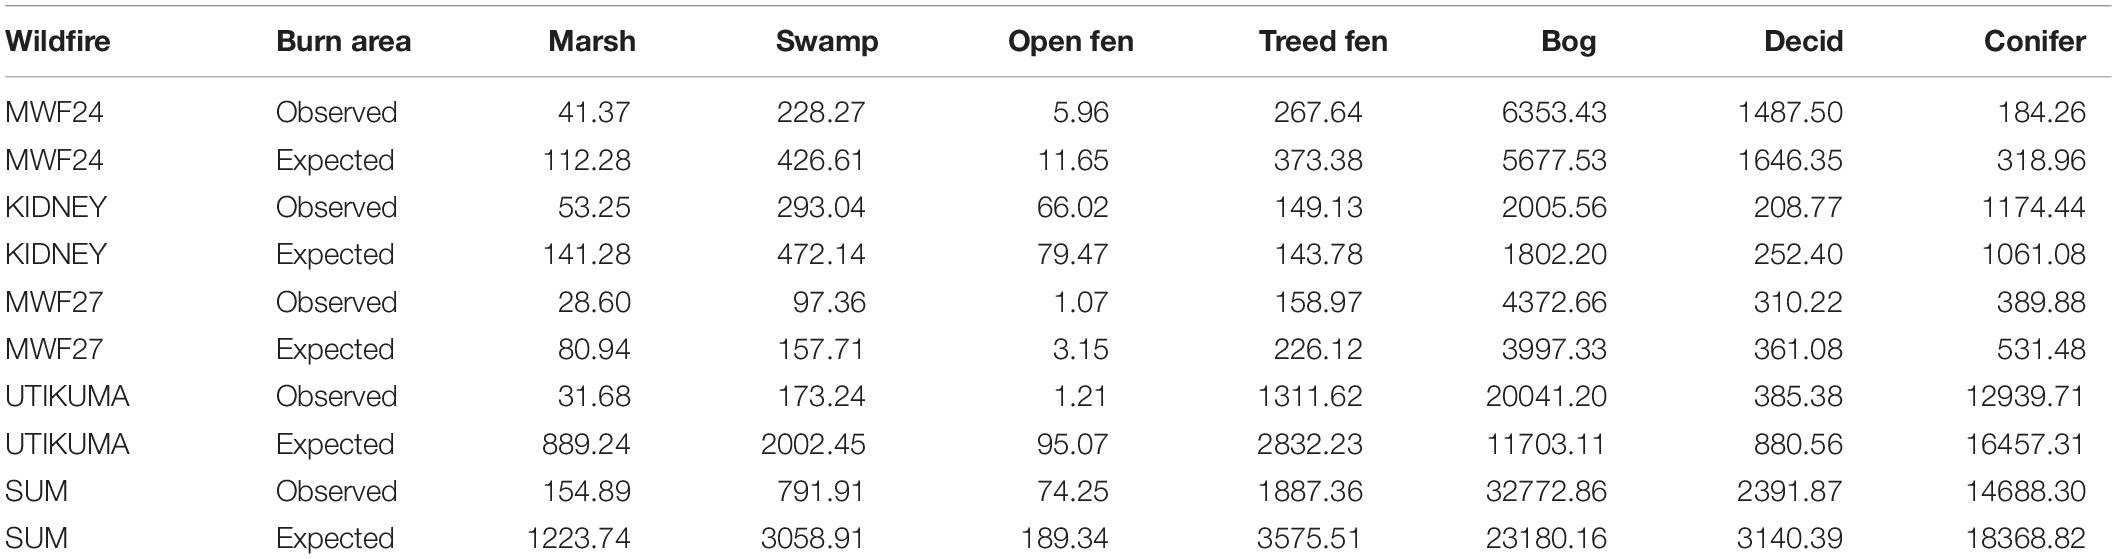
Table 7. The observed and expected burn areas by ecotype.
When assessing each of the four wildfires of this case study individually, the relative proportion of each ecotype available for burning and the amount that did burn within each of the four wildfire perimeters varied greatly (Tables 6, 7). In this section, we therefore focus on comparing the relative proportion of each ecotype that burned rather than absolute areas (Figure 5). The mean relative proportion of burned area by ecotype for the four fires (Figure 5) was greatest for bog (75%) with deciduous forest second (48%) and upland conifer third (33%), treed and open fen were in the 20% range (23 and 21%, respectively) with the marsh and swamp burned the lowest mean proportional area (6 and 12% respectively). The range in proportion of area burned across the four wildfires (maximum proportion – minimum proportion) was lowest for bog (26%), while it was 61% for upland conifer, 56% for deciduous and the most variable for the two fen types (∼68%). We suggest that a high mean relative proportion of area burned for a given ecotype and a low range in proportion burned between fires would indicate a higher susceptibility to early season wildfire (e.g., bogs). In contrast, those ecosystem types that have low mean proportional area burned and low range (max – min proportion) between fires would be suggestive of the least susceptible to early season wildfires (e.g., marsh). Fens had a low proportional area burned but high range, which may suggest a moderate susceptibility to early season wildfires. However, it needs to be noted that less than 10% of the landscape was dominated by fen, marsh and swamp in this Alberta study area.
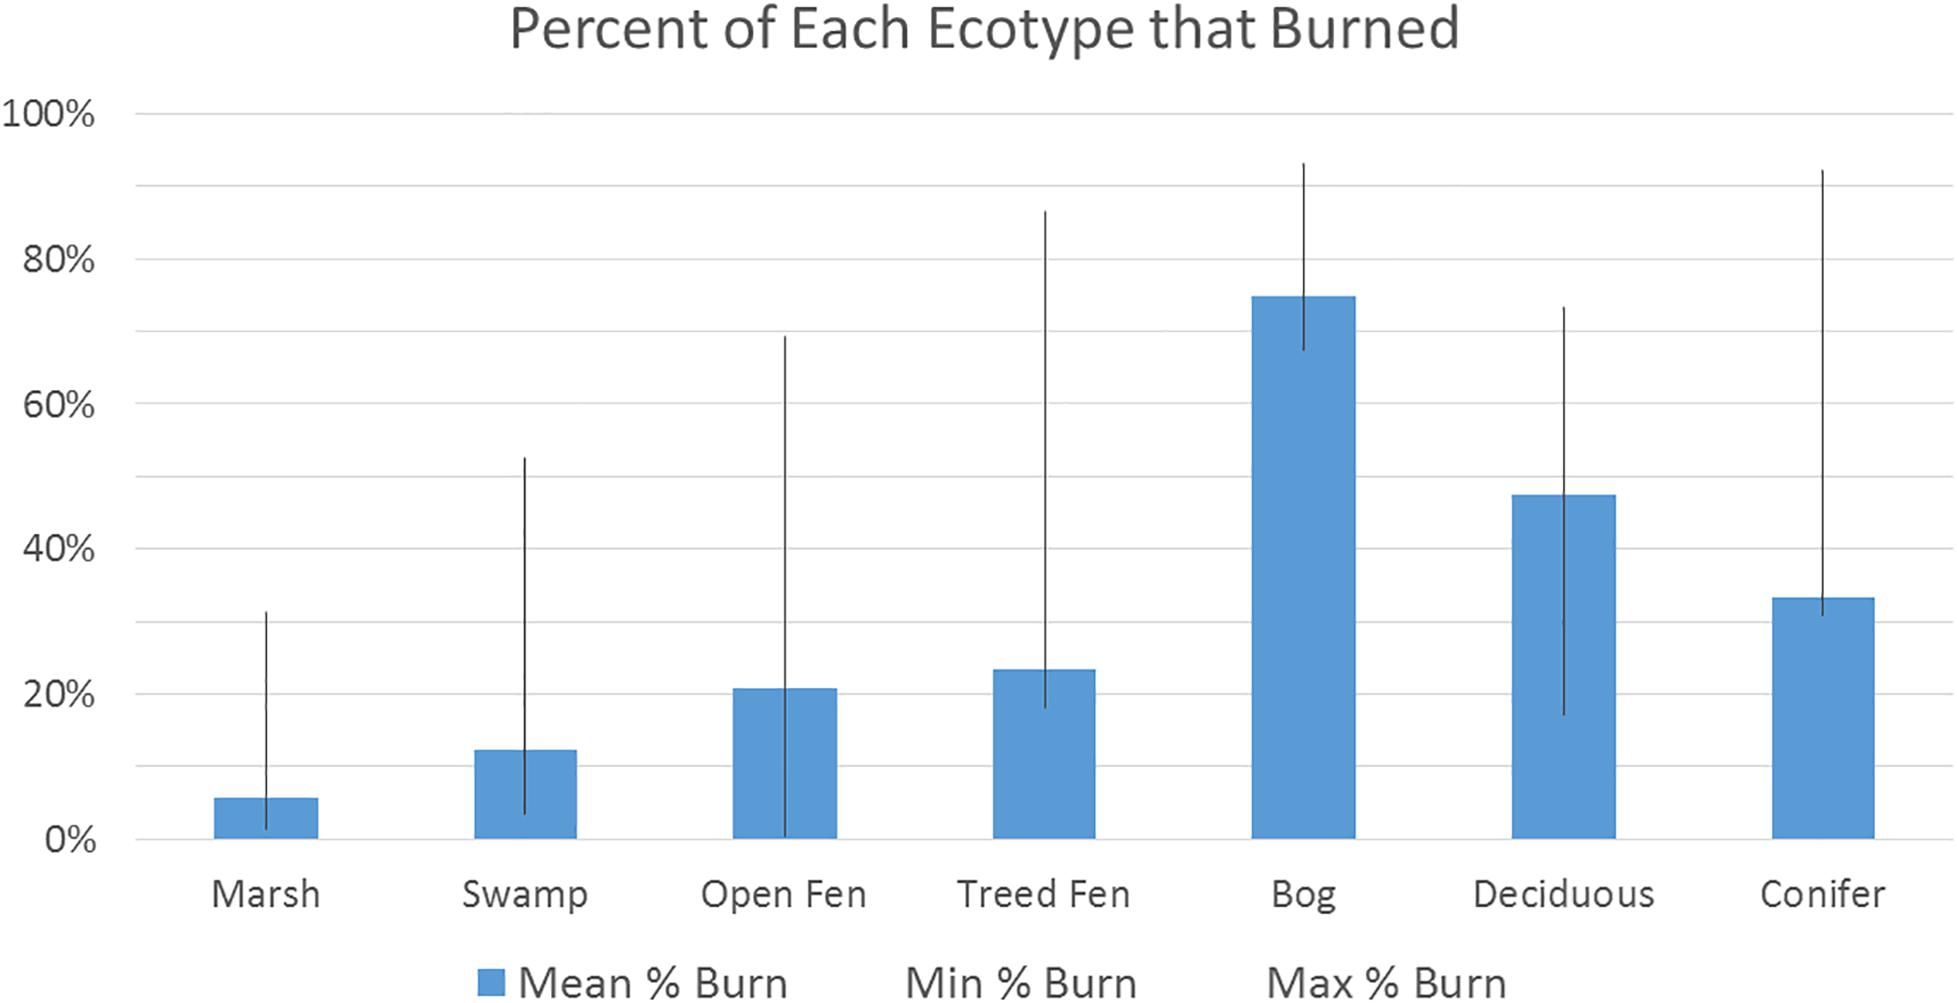
Figure 5. Bar chart showing the mean proportion of each ecotype burned in the four study wildfires. Lines show the range of observed proportions burned (minimum and maximum).
The June 2009 wildfires of this study affected much smaller areas (4,745–10,735 ha) than the single 2011 Utikuma wildfire, but left fewer unburned islands. The total area burned for the May 2011 Utikuma wildfire was 34,860 ha with many unburned islands (Table 7). There is a difference in the proportion of each ecotype burned in the May Utikuma wildfire versus the three June wildfires which may be due to phenological and hydrological differences (i.e., leaf flush vs. non-flushed and frozen vs. thawed ground conditions). The landscape within the three June 2009 wildfire perimeters were dominated by bog (46–75% of pre-burn area), while the May 2011 fire (Utikuma) consisted of 34% bog dominance and 47% upland conifer dominance. Despite these landscape and phenological differences, in each of the four wildfires most of the area burned was bog, even for the Utikuma fire which had about 44,000 ha of upland forest and 30,000 ha of bog within its border pre-fire, more bog burned (67%, 20,041 ha) than upland conifer (30% 12,940 ha). The proportion of upland burned for the three 2009 June wildfires was much greater (67–88%), but in all four wildfires the bog class experienced the greatest percentage of area burned. Also, in all circumstances treed sites experienced burning of a greater percentage of the total ecotype area than non-treed cover types.
Chi-square goodness-of-fit test results suggest that the area burned in these four early season wildfires was dependent on ecotype (Tables 7, 8 and Supplementary Figure S2). These results show that conifer forest burned (observed/expected ratio 0.70) less than expected based on its landscape availability, deciduous forest burned as expected (observed/expected ratio 1.0) while bog burned (observed/expected ratio 1.57) more than expected (Table 8). Marsh, swamp, and fens burned much less than expected given their availability on the landscape (ratios of 0.12–0.49). For the individual fires, bog is consistently burning more than expected. For the Kidney Lake fire, treed fen burned slightly more than expected as did conifer upland forest.
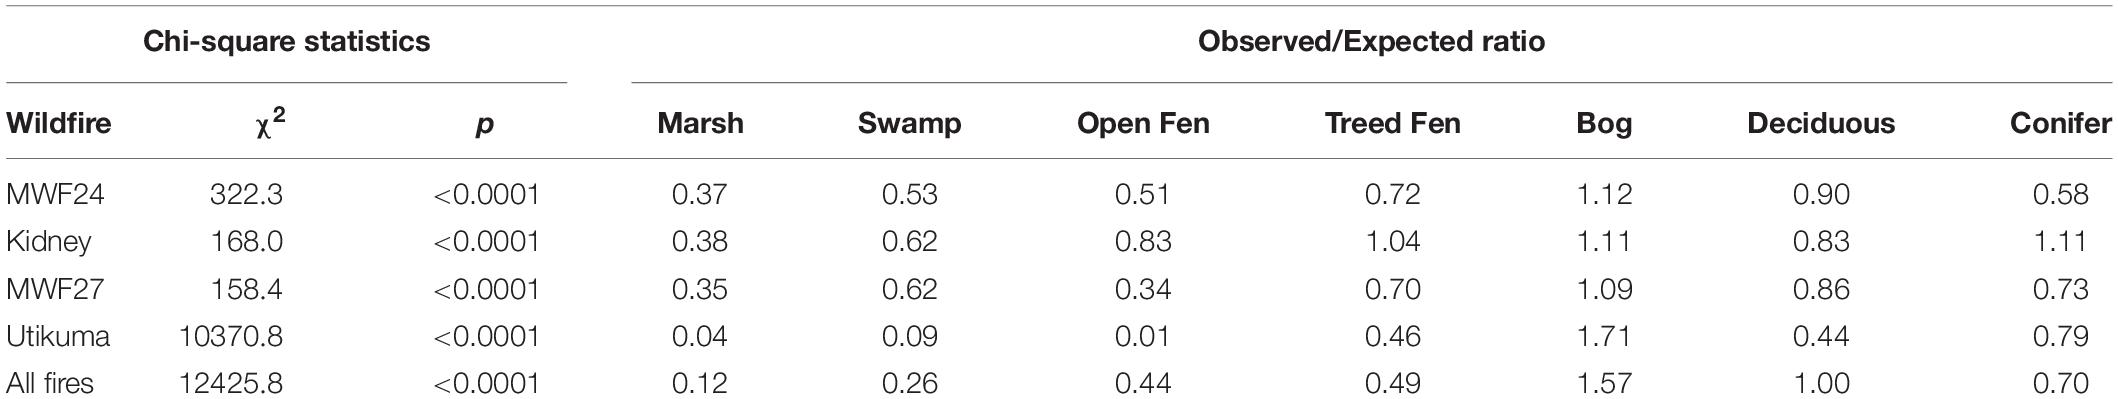
Table 8. Chi-square goodness-of-fit statistics using observed vs. expected ratios for each wildfire/ecotype combination.
Comparison of Soil Organic Layer Fire Severity by Peatland Ecotype
The assessment of burned versus unburned areas for each of the ecotypes provided information on what was burning within each of the spring fire perimeters and this showed that overall bog was burning in greater proportions than upland conifer. To understand the vulnerability of the ground surface and organic soil layers to consumption in these early season fires, an assessment of the severity for peat (organic soil layers) was conducted. By intersecting the peatland maps with the soil organic layer severity map products (Figure 4) we can begin to understand how severity of fire and vulnerability to belowground consumption varied across the three peatland cover classes to address our second research question: “How does peatland type contribute to vulnerability to burning and belowground consumption during early season wildland fires?”
Since the Landsat severity algorithm was trained primarily on peatland field data, with fewer upland sites (17 plots), we conducted this part of the analysis on only the bogs and fens and omit statistics for uplands, marsh and swamp in Figures 6, 7. Although there were some field data from uplands in the validation (Figure 2) of the Landsat algorithm, these were not robust enough to provide confidence in the distinction of severity classes in uplands using our current algorithm.
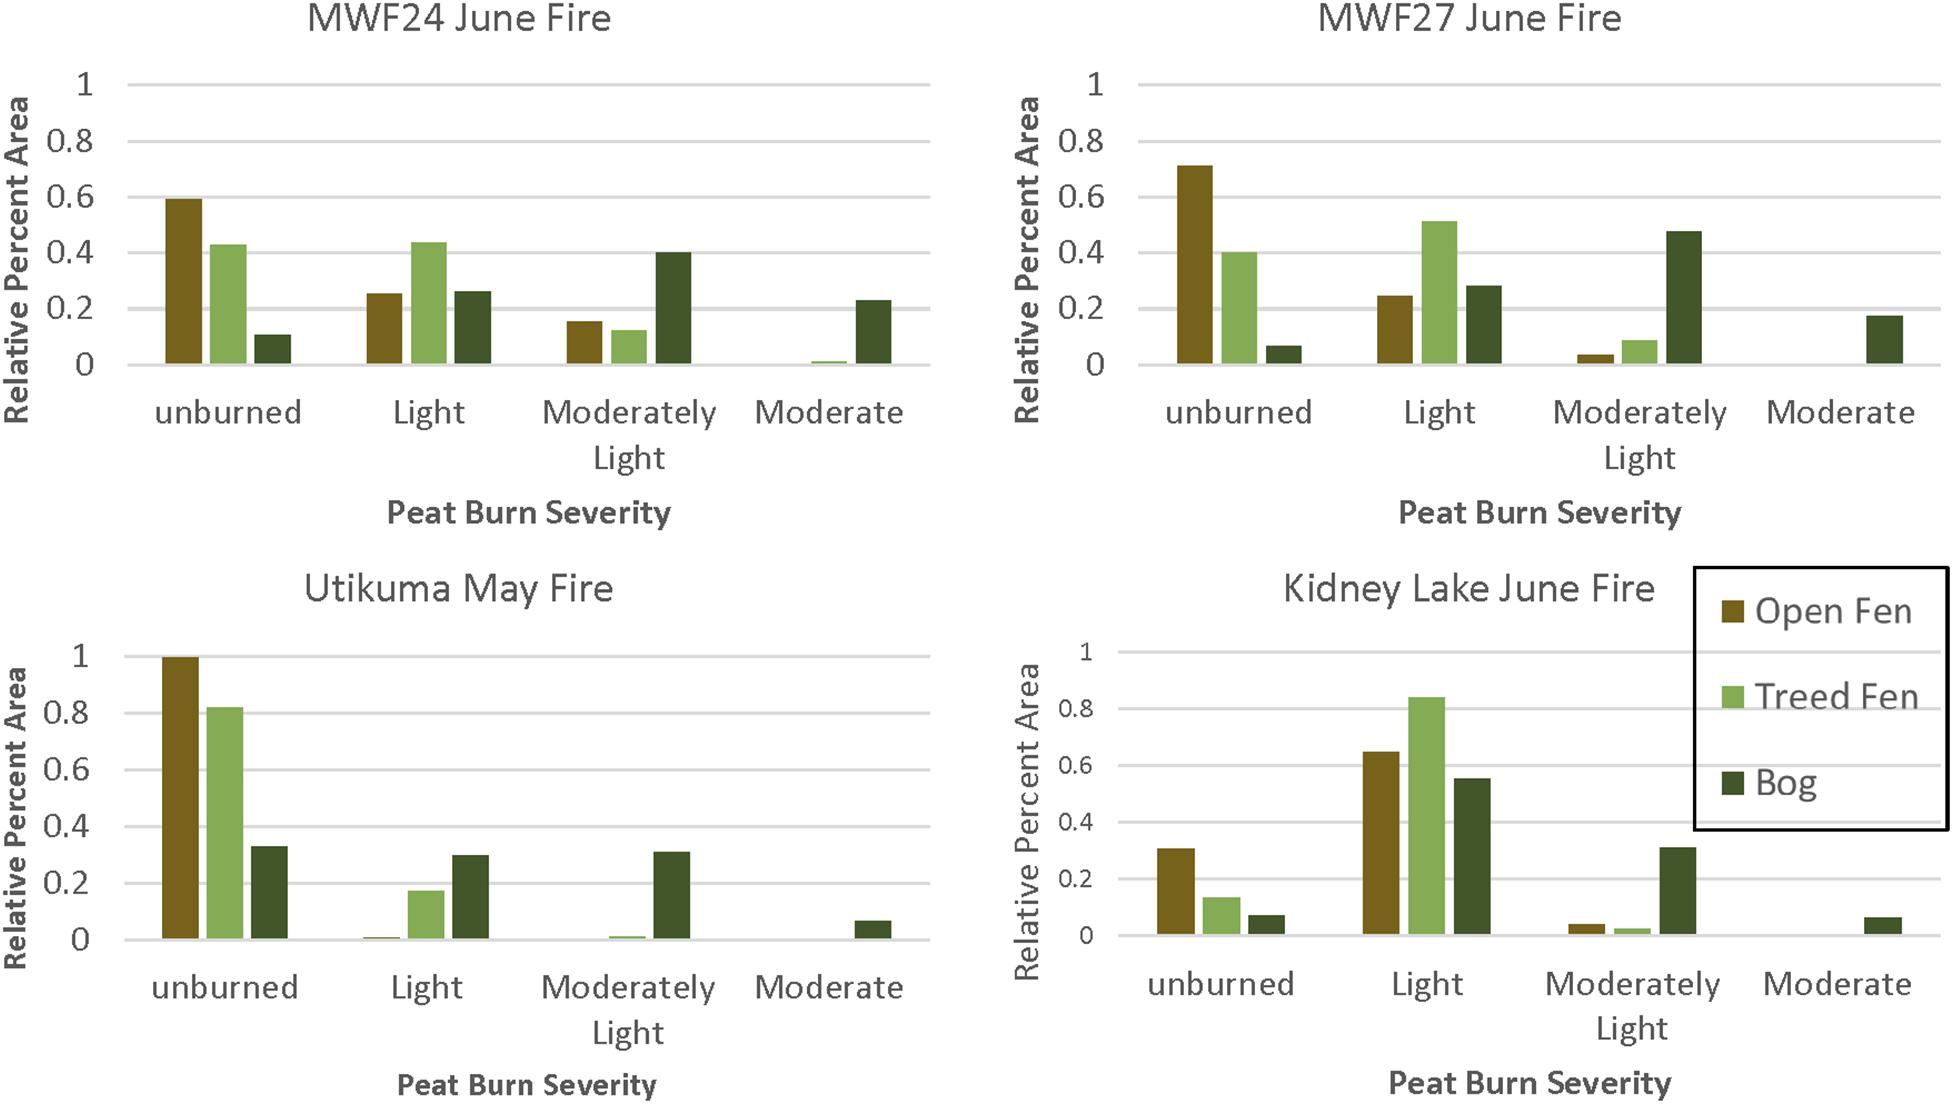
Figure 6. Comparison soil organic layer severity by relative percent area of peatland type for each wildfire: MW24, MW27, Kidney Lake, and Utikuma.
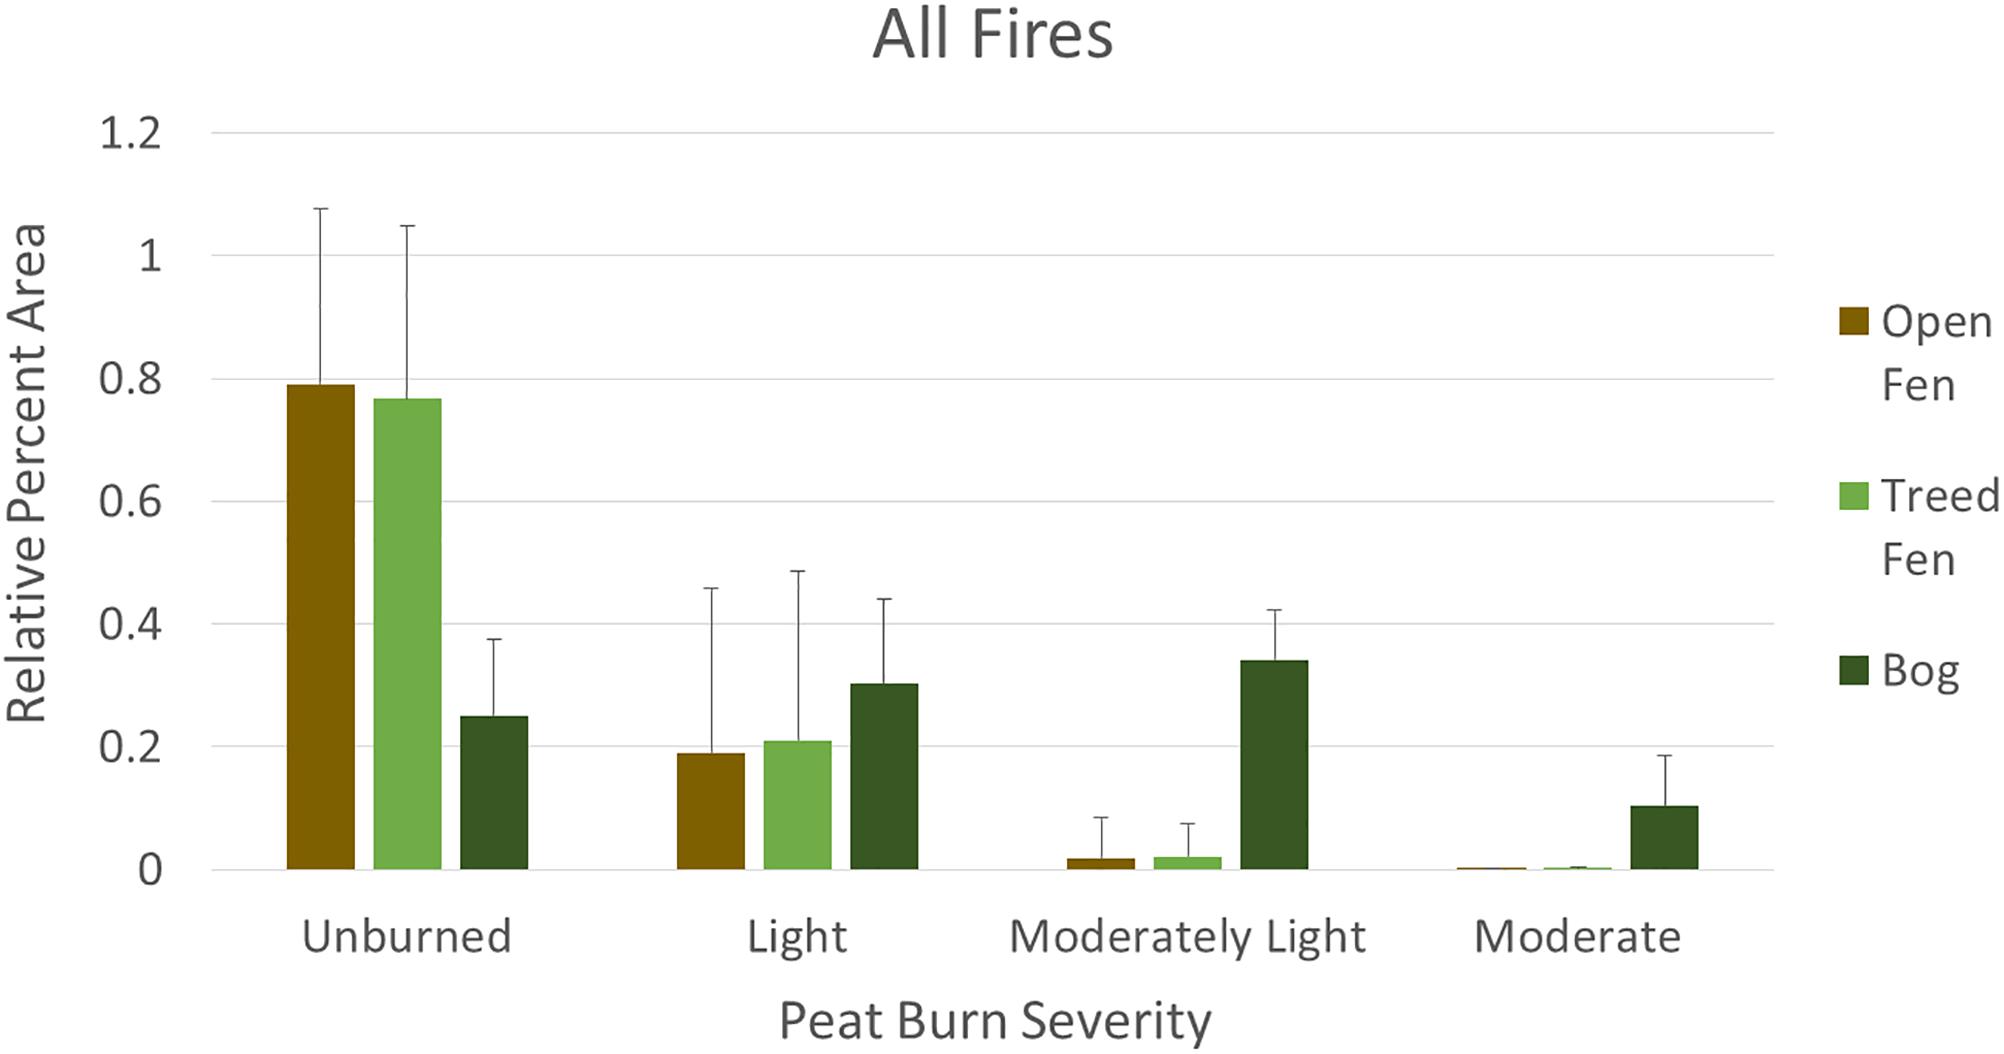
Figure 7. Comparison of burn severity classes by peatland type across all 4 wildfires. Relative percent area of each peatland type in each burn class is plotted with 1 standard deviation error bar.
The intersection of these two spatial datasets show that for the June 2009 fires, proportionally more of the burned peatland area experienced moderately light to moderate (except Kidney Lake) severity than did the May 2009 Utikuma fire. Much more of the peatland area was unburned in the Utikuma fire (Figure 6). This may be a result of less thawed ground conditions in May, leaf flush in June and the spotty nature of the May fire due to extreme winds.
To directly compare trends in belowground consumption (through BSI) in the peatlands (bogs and fens) across all four wildfires, we plotted the discrete classes of severity by proportion of peatland type (Figure 7). This bar chart shows greater low severity (light and moderately light) peat consumption for the bogs with lower amounts of unburned and moderate severity, while for the fens (both open and treed) the greatest proportion of these ecosystems was in the unburned class with dwindling areal proportions in the progressively higher severity classes.
Summary and Conclusion
Based on this case study of four early season wildfires occurring in a region of Alberta Canada where peatlands are abundant, we found bogs to be more susceptible to early season wildfire than open fens and treed fens. Open fens were the least susceptible of the peatlands to burning and marsh and swamp were less susceptible than all other ecotypes. Open fens tend to be wetter and have less available fuel to burn, so it makes sense that they are least susceptible. All treed sites were more susceptible to burning than non-forested sites (i.e., marshes and open fens). All of the wildfires were of light to moderate burn, without observation of high fire severity in any of the sites.
The fires of this study were dominated by bogs and upland conifer ecotypes with each representing 40% of the areas within the fire perimeters (∼42,000 and 44,000 ha, respectively, Table 6), but overall more than double the area of bog burned (32,773 ha) compared to upland conifer (14,688 ha). Thus, 59% of the upland conifer was left as unburned islands for the May fire (Utikuma) and 24% for the June fires. In contrast only 33% of the bog was in unburned islands for the May fire and merely 9% for the June fires. Bogs of the study region of Alberta are dominated by black spruce, a flammable species adapted to wildfire that tends to hold onto dead branches creating fuel ladders. Upland conifer stands of this region are dominated by black spruce or jack pine, which is another highly flammable, fire-adapted species.
Among the peatland ecotypes, different trends in soil organic layer (peat) fire severity/belowground consumption were observed, with fens having greater areas left unburned (proportionally) than bogs for all fires. Fens overall showed a decreasing trend in area burned for progressively higher soil organic layer severity classes (Figure 7), indicating fens tend to have lower peat consumption. The observed early season wildfires showed that bogs had proportionally small areas left unburned with an increasing trend in area burned for progressively higher soil organic layer severity classes that peaked in the moderately light class and then decreased for the moderate soil organic layer severity class (Figure 7). This suggests that bogs are generally more vulnerable to deeper burning than fens. However, many factors influence the susceptibility of peat to burning including pre-fire weather, peat moisture, water table, fuel type and continuity. Different conditions will lead to different fire severities. The Kidney Lake fire experienced very low unburned peat and mostly light fire severity with very little moderate severity. The Kidney Lake fire also exhibited the lowest proportion of unburned fen (both open and treed, Figure 6) of all the wildfires and had the highest DMC (40) and DC (328) on the fire start date (Table 1) which are indicative of the drier duff layers and of conditions right for a wildfire to sustain itself (DC). The high DMC and DC values may be indicators of susceptibility of fens to burning and should be further investigated.
The analysis of these 4 early season wildfires of central Alberta, indicate that for this region in early season a bog is more likely to burn than other ecosystem types, even upland conifer. In addition, of the peatland types, bogs experienced greater consumption to the peat layers than fens (which tend to be wetter). The peat consumption averaged 9 cm depth for plots of the June 2009 fires with a range of 4–24 cm, while plots of the May 2011 fire averaged 7.5 cm with a range of 4–13 cm. Given that in the late season, moisture conditions tend to be drier, fires may likely be burning less deep in the early season. This case study provides a glimpse into early season peatland fires to begin to understand if peatlands may be vulnerable and are in need of further monitoring. Due to the small sample size and geographic area of this case study, further analysis is needed to understand trends in unburned islands and soil organic layer severity/consumption in wildfires of all seasons and boreal ecoregions.
As fire seasons lengthen and climate warming and drying continues in the boreal region, it is important to understand and be able to monitor soil organic layer severity/consumption in both uplands and peatlands. It has been documented that as frequency and severity of wildfires continue to increase in boreal regions, it is likely that upland ecosystems will shift from black spruce dominant to jack pine or deciduous dominant (Johnstone et al., 2010). Such predicted trajectories for peatlands has not yet been established. Additional work to more fully develop a Landsat soil organic layer severity algorithm applicable to both uplands and peatlands as well as additional monitoring of post-fire succession is needed. The former will allow us to assess vulnerability of all ecotypes to wildfire and peat consumption and the latter to assess any shifts in post-fire trajectories related to severity and frequency of fire. In addition, the greatest unknown in modeling of carbon emissions is the peat or soil organic layer component (French et al., 2004; Prichard et al., 2019). Thus the ability to monitor soil organic layer severity from space will allow for improvements in spatial outputs of belowground carbon emissions.
Data Availability Statement
The datasets generated for this study are available on NASA’s ORNL DAAC (Bourgeau-Chavez et al., 2015) https://doi.org/10.3334/ORNLDAAC/1283.
Author Contributions
LB-C led the conception, design, analysis and interpretation, and writing of the work. SG and LJ were key in collecting the field data, assisting with the remote sensing data analysis, and writing the field collection methods. MB developed the Landsat-5 algorithms from the field and remote sensing data and wrote those sections of the manuscript. EK and MT contributed to the conception and design of the work, field data collection in 2012 and revising the manuscript critically for intellectual content.
Funding
This research was funded by NASA grants #NNX09AM15G and #NNX12AK31G.
Conflict of Interest
The authors declare that the research was conducted in the absence of any commercial or financial relationships that could be construed as a potential conflict of interest.
Acknowledgments
We would like to thank the many people who helped in collecting field data (Anne Santa Maria, Elizabeth Banda, Erik Boren, and A. J. Smith). We also thank Dorthea J. Leisman, for assistance with formatting text, figures and tables and Jeremy Graham and Karl Bosse with statistical analyses.
Supplementary Material
The Supplementary Material for this article can be found online at: https://www.frontiersin.org/articles/10.3389/ffgc.2020.00020/full#supplementary-material
FIGURE S1 | Landsat predicted vs. observed BSI for 2013 field data using the algorithm developed with 2013 field data.
FIGURE S2 | Plot of the observed vs. expected burn areas by ecotype and wildfire.
References
Alberta Wildfire (2018). Government. Historical Data. Historical Data | AAF - Agriculture and Forestry. Available at: https://wildfire.alberta.ca/resources/historical-data/default.aspx (accessed December 2, 2019).
Bourgeau-Chavez, L. L. (1994). Using ERS-1 SAR Imagery To Monitor Variations in Burn Severity in an Alaskan fire-Disturbed Boreal Forest Ecosystem: A Thesis Submitted in Partial Fulfillment for the Degree Of Masters Science. Master’s thesis, University of Michigan, Ann Arbor, MI.
Bourgeau-Chavez, L. L., Endres, S., Banda, E., Powell, R., Turetsky, M. R., Benscoter, B., et al. (2015). NACP Peatland Landcover Type and Wildfire Burn Severity Maps, Alberta, Canada. Oak Ridge, TN: ORNL DAAC. doi: 10.3334/ORNLDAAC/1283
Bourgeau-Chavez, L. L., Endres, S., Powell, R., Battaglia, M. J., Benscoter, B., Turetsky, M., et al. (2017). Mapping boreal peatland ecosystem types from multi-temporal radar and optical satellite imagery. Can. J. Forest Res. 47, 545–559. doi: 10.1139/cjfr-2016-0192
Canadian Forest Service (2017). National Fire Database - Agency Fire Data. Edmonton, AB: Northern Forestry Centre.
Clymo, R. S., Turunen, J., and Tolonen, K. (1998). Carbon accumulation in Peatland. Oikos 81, 368–388. doi: 10.2307/3547057
Crist, E. P., and Cicone, R. C. (1984). A physically-based transformation of thematic mapper data-The TM tasseled cap. IEEE Trans. Geosci. Remote Sens. 22, 256–263. doi: 10.1109/tgrs.1984.350619
de Groot, W. J. (1988). “Interpreting the canadian forest fire weather index (FWI) system,” in Proceedings of the Fourth Central Region Fire Weather Committee Scientific and Technical Seminar, Edmonton, AB.
Dyrness, C. T., and Norum, R. A. (1983). The effects of experimental fires on black spruce forest floors in interior Alaska. Can. J. Forest Res. 13, 879–893. doi: 10.1139/x83-118
Ecological Stratification Working Group (1995). A National ecological framework for Canada. Ottawa: Agriculture and Agri-Food Canada and Environment.
Flannigan, M. D., Krawchuk, M. A., de Groot, W. J., Wotton, B. M., and Gowman, L. M. (2009). Implications of changing climate for global wildland fire. Int. J. Wildl. Fire 18, 483–507. doi: 10.1080/10962247.2015.1040526
Fraser, R. H., Hall, R. J., Landry, R., Lynham, T., Raymond, D., Lee, B., et al. (2004). Validation and calibration of Canada-wide coarse-resolution satellite burned-area maps. Photogramm. Eng. Remote Sensing 70, 451–460. doi: 10.14358/PERS.70.4.451
French, N. H. F., Allen, J. L., Hall, R. J., Hoy, E. E., Kasischke, E. S., Murphy, K. A., et al. (2008). Using Landsat Data to assess fire and burn severity in the North American boreal forest region: an overview. Int. J. Wildl. Fire 17, 443–462.
French, N. H. F., Goovaerts, P., and Kasischke, E. S. (2004). Uncertainty in estimating carbon emissions from boreal forest fires. J. Geophys. Res. 109:D14S08.
Hall, R. J., Freeburn, J. T., de Groot, W. J., Pritchard, J. M., Lynham, T. J., and Landry, R. (2008). Remote sensing of burn severity: experience from western Canada boreal fires. Int. J. Wildl. Fire 17, 476–489.
Halsey, L., Vitt, D., Beilman, D., Crow, S., Mehelcic, S., and Wells, R. (2003). Alberta Wetlands Inventory Standards, Version 2.0.
Johnstone, J. F., Hollingsworth, T. N., Chapin, F. S., and Mack, M. C. (2010). Changes in fire regime break the legacy lock on successional trajectories in Alaskan boreal forest. Glob. Chang. Biol. 16, 1281–1295. doi: 10.1111/j.1365-2486.2009.02051.x
Kasischke, E. S., and Hoy, E. E. (2012). Controls on carbon consumption during Alaskan wildland fires. Glob. Chang. Biol. 18, 685–699. doi: 10.1111/j.1365-2486.2011.02573.x
Kasischke, E. S., Turetsky, M. R., Ottmar, R. D., French, N. H. F., Shetler, G., Hoy, E. E., et al. (2008). Evaluation of the composite burn index for assessing fire severity in Alaskan black spruce forests. Int. J. Wildl. Fire 17, 515–526.
Kauth, R. J., and Thomas, G. S. (1976). “The tasseled cap-A graphic description of the spectral-temporal development of agricultural crops as seen by Landsat,” in Proceedings the Symposium on Machine Processing of Remotely Sensed Data, West Lafayette.
Key, C. H., and Benson, N. C. (2005). “Landscape assessment: remote sensing of severity, the normalized burn ratio,” in FIREMON: Fire Effects Monitoring and Inventory System. General Technical Report, RMRS-GT-164-CD: LA1-LA51, ed. D. C. Lutes, (Ogden, UT: USDA Forest Service).
Limpens, J., Berendse, F., Blodau, C., Canadell, J., Freeman, C., Holden, J., et al. (2008). Peatlands and the carbon cycle: from local processes to global implications–a synthesis. Biogeosciences 5, 1475–1491. doi: 10.5194/bg-5-1475-2008
Loboda, T. V., French, N. H. F., Hight-Harf, C., Jenkins, L., and Miller, M. E. (2013). Mapping fire extent and burn severity in Alaskan tussock tundra: an analysis of the spectral response of tundra vegetation to wildland fire. Remote Sens. Environ. 134, 194–209. doi: 10.1016/j.rse.2013.03.003
Miller, J. D., and Thode, A. E. (2007). Quantifying burn severity in a heterogeneous landscape with a relative version of the delta Normalized Burn Ratio (dNBR). Remote Sens. Environ. 109, 66–80. doi: 10.1016/j.rse.2006.12.006
Nichols, J. E., and Peteet, D. M. (2019). Rapid expansion of northern peatlands and doubled estimate of carbon storage. Nat. Geosci. 12, 917–921. doi: 10.1038/s41561-019-0454-z
Parks, S. A., Dillon, G. K., and Miller, C. A. (2014). A new metric for quantifying burn severity: the relativized burn ratio. Remote Sens. 6, 1827–1844. doi: 10.3390/rs6031827
Prichard, S. J., Kennedy, M. C., Andreu, A. G., Eagle, P., French, N. H. F., and Billmire, M. (2019). Next-generation biomass mapping for regional emissions and carbon inventories: incorporating uncertainty in wildland fuel characterization. J. Geophys. Res. 124, 3699–3716. doi: 10.1029/2019jg005083
Taylor, S. W., and Alexander, M. E. (2006). Science, technology, and human factors in fire danger rating: the Canadian experience. Int. J. Wildl. Fire 15, 121–135.
Turetsky, M. R., Amiro, B. D., Bosch, E., and Bhatti, J. S. (2004). Historical burn area in western Canadian peatlands and its relationship to fire weather indices. Glob. Biogeochem. Cycles 18, 1–9.
Van Wagner, C. E. (1987). Development and Structure of the Canadian Forest Fire Weather Index system. Chalk River, ON: Canadian Forest Service.
Verbyla, D. L., Kasischke, E. S., and Hoy, E. E. (2008). Seasonal and topographic effects on estimating fire severity from Landsat TM/ETM+ data. Int. J. Wildl. Fire 17, 527–534.
Vitt, D. H. (2006). “Functional characteristics and indicators of boreal peatlands,” in Boreal Peatland Ecosystems. Ecological Studies (Analysis and Synthesis), eds R. K. Wieder and D. H. Vitt, (Berlin: Springer), 9–24. doi: 10.1007/978-3-540-31913-9_2
Weißhuhn, P., Müller, F., and Wiggering, H. (2018). Ecosystem vulnerability review: proposal of an interdisciplinary ecosystem assessment approach. Environ. Manag. 61, 904–915. doi: 10.1007/s00267-018-1023-8
Whitman, E., Parisien, M. A., Thompson, D. K., Hall, R. J., Skakun, R. S., and Flannigan, M. D. (2018). Variability and drivers of burn severity in the northwestern Canadian boreal forest. Ecosphere 9:e02128. doi: 10.1002/ecs2.2128
Wieder, R. K., and Lang, G. E. (1983). Net primary production of the dominant bryophytes in a Sphagnum-dominated wetland in West Virginia. Bryologist 86, 280–286.
Keywords: peatlands, wildfire, belowground consumption, boreal, Landsat-5, fire severity
Citation: Bourgeau-Chavez LL, Grelik SL, Billmire M, Jenkins LK, Kasischke ES and Turetsky MR (2020) Assessing Boreal Peat Fire Severity and Vulnerability of Peatlands to Early Season Wildland Fire. Front. For. Glob. Change 3:20. doi:10.3389/ffgc.2020.00020
Received: 25 October 2019; Accepted: 06 February 2020;
Published: 28 February 2020.
Edited by:
Robert Michael Scheller, North Carolina State University, United StatesReviewed by:
Daniel Thompson, Natural Resources Canada, CanadaHelene Genet, University of Alaska Fairbanks, United States
Copyright © 2020 Bourgeau-Chavez, Grelik, Billmire, Jenkins, Kasischke and Turetsky. This is an open-access article distributed under the terms of the Creative Commons Attribution License (CC BY). The use, distribution or reproduction in other forums is permitted, provided the original author(s) and the copyright owner(s) are credited and that the original publication in this journal is cited, in accordance with accepted academic practice. No use, distribution or reproduction is permitted which does not comply with these terms.
*Correspondence: Laura Louise Bourgeau-Chavez, lchavez@mtu.edu