Coupled biological and hydrological processes shape spatial food-web structures in riverine metacommunities
 Hsi-Cheng Ho1,2†‡
  Florian Altermatt
 Luca Carraro
- 1Department of Aquatic Ecology, Swiss Federal Institute of Aquatic Science and Technology (Eawag), Dübendorf, Switzerland
- 2Institute of Ecology and Evolutionary Biology, National Taiwan University, Taipei, Taiwan
- 3Department of Evolutionary Biology and Environmental Studies, University of Zurich, Zurich, Switzerland
Introduction: Understanding how species are distributed in space and how they interact with each other is central for scientific and conservation purposes. Species' distributions and interactions result from a complex interplay of local trophic dynamics, dispersal processes, resource availability, and abiotic factors governed by the landscape matrix, which also determines the spatial connectivity for organisms' dispersal and resource fluxes. River networks not only exhibit universal spatial structures, but their dendritic landscape structure is tightly linked to species and metacommunity processes therein.
Methods: Here, using a mechanistic model of spatially connected food webs integrating both essential biological and hydrological aspects, we investigate how food-web properties vary in space, and how these patterns are influenced by key model parameters. We then contrast our predictions with a suite of null models, where different aspects (such as spatial structure or trophic interactions) of the spatial food-web model are alternatively relaxed.
Results: We find that species richness is highest in areas where local nutrient load is maximal (lowland headwaters, according to our default assumption). Overall, species richness is positively associated with link density, modularity and omnivory, and negatively related to connectance, nestedness, and niche overlap. However, for metrics such as connectance and omnivory, stochasticity of trophic interactions is a much stronger predictor than spatial variables such as distance to outlet and drainage area. Remarkably, relationships between species richness and food-web metrics do not generally hold in null models, and are hence the outcome of coupled biological and physical (i.e., hydrological) processes characteristic to river networks.
Discussion: Our model generates realistic patterns of species richness and food-web properties, shows that no universal food-web patterns emerge as a result of the riverine landscape structure, and paves the way for future applications aimed at disentangling metacommunity dynamics in river networks.
1. Introduction
Assessing spatial patterns of biodiversity has been a central theme of ecology. The distributions of organisms of various species are driven by energy and material inputs, medium fluxes, environmental disturbances, and species interactions (Loreau, 2010; Paquette and Hargreaves, 2021) and exhibit characteristic spatial structures or gradients in association to the landscape inhabited. Understanding how species (and collectively, biodiversity) are spatially distributed can provide direct management implications, for example identifying “hotspots” of biodiversity threatened by human impacts (Reid, 1998). In ecological communities, species play different roles interacting with the abiotic environment as well as among themselves, perform various ecological processes, and drive ecosystem functions (Hooper et al., 2005). To infer the communities' structural or functional integrity, we need to consider aspects of communities that reflect their compositional and functional characteristics, such as species' various trophic roles and the food webs they form (Thompson et al., 2012). The spatial patterns of such characteristics can also indicate the key factors or processes that shape ecological communities across a landscape (Tylianakis and Morris, 2017; Pellissier et al., 2018).
River networks are ideal to study the relationship between landscape structure and spatial ecological patterns. First, rivers are highly spatially structured habitats, in which both patch connectivity and gradients of abiotic factors are inherently determined by the dendritic, fractal-like drainage structure (Altermatt, 2013; Rinaldo et al., 2020; Carraro and Altermatt, 2022). Second, the key factors and processes that drive composition of ecological communities within river networks have been comparatively well-studied. For example, the physical attributes (e.g., width and slope) of rivers, as well as the directional flows of materials (e.g., nutrients) and organisms from upstream to downstream reaches strongly influence the composition of local stream communities (Brown et al., 2011; Schmera et al., 2018; Jacquet et al., 2022). Moreover, the connectivity of rivers affects species dispersal and their overall persistence across the whole river network (Bertuzzo et al., 2015; Tonkin et al., 2018; Larsen et al., 2021). Finally, by viewing the biome within a river network as the ensemble of inter-connected communities, existing theories (e.g., metacommunity theory; Leibold et al., 2004) and empirical monitoring can be integrated to tackle the system's dynamics. This may provide a holistic perspective and efficient tool for larger-scale river biodiversity management, including restoration, conservation and invasive species control (Patrick et al., 2021). For these scientific and application purposes, it is pivotal to identify the spatial ecological patterns in river networks, and in particular to disentangle the local and regional forces that shape such patterns. Thereby, the use of mechanistic models combining metacommunity and hydrological aspects is crucial, as it allows both assessing the drivers of observed ecological patterns and investigating scenarios of changes in riverine landscape features (e.g., connectivity, nutrient dynamics; Jacquet et al., 2022).
While biological spatial patterns in rivers have been individually studied, the focus has mostly lain on species richness (Ward, 1998), organic matter budgets (Webster and Meyer, 1997; Demars et al., 2015), or roughly defined functional composition, such as in the seminal River Continuum Concept (Vannote et al., 1980; Doretto et al., 2020). However, the entangled structure of species interactions and the ensuing dynamics are much less investigated. Constrained by the enormous effort needed for measuring multiple taxa and their interactions, past empirical research on stream food webs has usually been localized (i.e., conducted at one or a few sites that could not be representative of the whole river network) and focused on a selected subset of species within the stream communities (Power and Dietrich, 2002; Romanuk et al., 2006). These works highlight the typical structures of stream food webs and suggest potential key drivers shaping such structures, yet remain a step shy of providing direct mechanistic understanding due to their limited spatial coverage. Only recently, with new datasets (e.g., meta-food webs; O'Connor et al., 2020; Saravia et al., 2022) and methodologies (such as environmental DNA; Taberlet et al., 2012; Deiner et al., 2016; Beng and Corlett, 2020) becoming available, research focus has been shifting toward the composition of stream communities at the scale of the whole river network (Altermatt et al., 2020; Carraro et al., 2022), and the food-web structure therein (Blackman et al., 2022). In general, these studies suggest a higher biodiversity in the downstream direction, but such a trend may not be consistent across all functional groups and river systems. Meanwhile, stream food webs can have structural changes across space that not necessarily mirror the changes in species richness. Such empirically detected patterns indicate that species interaction structure also responds to spatial ecological drivers in river networks. An integrated and systematic investigation of the interplay between hydrological and ecological dynamics in river networks is still lacking. Especially, it is not yet understood how food-web structure of riverine communities is shaped at local (individual sites) and regional (the whole river network) scales by both abiotic and biotic drivers.
Here, we explore how key hydrological and ecological drivers contribute to the formation of spatial biodiversity and food-web patterns in river networks. We conduct an in-silico study, integrating both hydrological and ecological modeling, to simulate community dynamics under a number of different yet realistic conditions. Our aim is threefold: first, we build a mechanistic spatial food-web (SFW) model allowing the assessment of spatial patterns of food-web metrics; second, we test the influence of ecologically critical parameters in shaping such patterns; third, we contrast our SFW model with alternative models, thus investigating whether and to which extent such patterns are universal, that is, solely driven by the landscape structure and connectivity. We expect that: (i) with certain, arguably more realistic parameter combinations, our model can qualitatively reproduce commonly observed spatial ecological patterns with respect to species richness and food-web structural properties. (ii) The model can identify key parameters that drive such spatial ecological patterns. (iii) Species richness, food-web properties, and their relationships are driven by trophic and spatial dynamics that are peculiar to riverine landscapes, and are thus not generally observed when some biological or hydrological processes are not accounted for in the model formulation.
2. Materials and methods
For our integrated investigation, realistic representations of the river network, its hydrology, the occurring species and their interactions are needed. The topology of river networks is best reflected by Optimal Channel Networks (OCNs), which are synthetic analogs of real river networks (Rinaldo et al., 2014; Carraro et al., 2020). Using synthetic river networks as the stage for ecological simulations allows the generation of multiple independent replicates (i.e., realizations) of ecological communities and their dynamics (including uncertainty) with overall fixed topological properties of a given river network. For species' feeding relationships, we adopt a regional meta-food web—i.e., defined over the whole river network—following the niche model (Williams and Martinez, 2000), which simulates species interaction structure and the ensuing Lotka-Volterra dynamics at all local sites. These local food webs are integrated to form a riverine metacommunity system, where nutrients and species travel across sites following the riverine connectivity. Such a system allows testing how changes in the focal parameters translate to different spatial structural patterns of riverine food webs. Specifically, we disentangle the influences of five ecologically critical parameters, namely nutrient load, nutrient distribution, nutrient uptake velocity, species dispersal rate, and species dispersal downstream bias. All these parameters are themselves influenced by rivers' hydrology and could impact species dynamics in riverine metacommunities.
In the following, we first detail the construction of the riverine landscape used in our simulations. We then explain the equations governing the SFW model and describe our assumptions with respect to meta-food-web generation and spatial processes (i.e., species dispersal and nutrient dynamics). Next, we provide details on simulation settings, choice of analyzed food-web metrics and assessment of their resulting spatial patterns. We conclude by presenting our sensitivity analysis and the null models against which the SFW model is contrasted. A list of all symbols used in the manuscript is provided in Supplementary Table 1.
2.1. River network model
Our riverine landscape is an OCN built via the R package OCNet (Carraro et al., 2020) spanning a 400 × 400 lattice (Figure 1C). We assume a pixel size of 100 m, hence the total drainage area spanned by the river network is A= 1,600 km2. The actual river network is extracted from the OCN drainage pattern by imposing a threshold area of 5 km2 (Carraro and Altermatt, 2022). River reaches are identified as portions of the river network between a source and a confluence, or consecutive confluences, but not longer than 4 km (i.e., if the distance between two consecutive confluences is longer than 4 km, the segment is partitioned into the minimum number of equally long reaches such that their length be < 4 km; Carraro et al., 2020). This results in M = 236 reaches of mean length 2.3 km. We consider these reaches as nodes hosting local food webs.
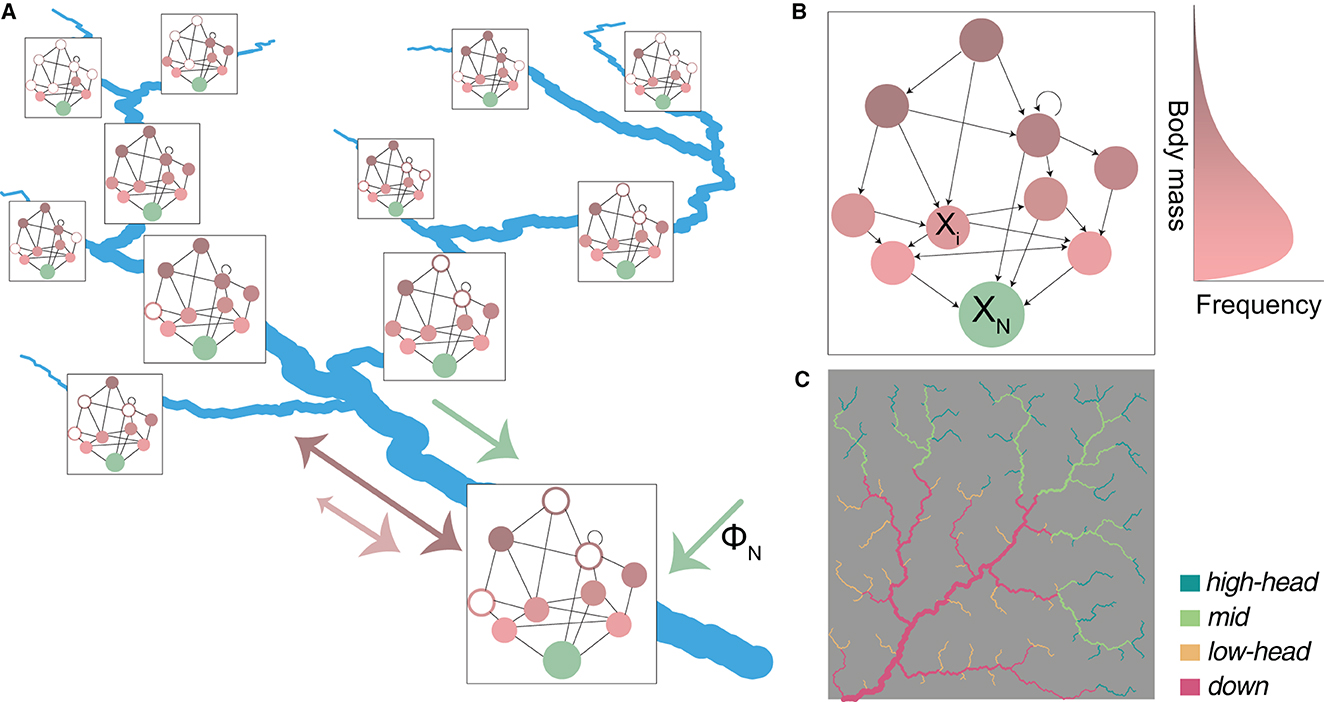
Figure 1. Schematic representation of the spatial food-web (SFW) model. (A) Spatial food web: every river reach corresponds to a spatial node hosting a local food web, which is derived from a regional meta-food web (B). Filled and open dots indicate local presence or absence of species at equilibrium, respectively. Local food webs are connected by downstream transport of nutrients (green arrow) and bidirectional dispersal of species (pink and brown arrows); the differences in arrows' shape indicate that larger species (in brown) tend to travel longer distances and are less prone to downstream-biased dispersal than smaller species (in pink). The box size scales with local available habitat (i.e., water volume). (B) Example of a regional meta-food web. Arrows indicate consumption. Nutrients XN are indicated in green, while living species Xi are indicated in a gradient from pink to brown, corresponding to their body mass (drawn from a log-normal distribution). Trophic interactions include the typical large-eat-small links of the niche model (see Section 2.2.1), while cannibalism (circular arrow), mutual feeding (bidirectional arrow), and small-eat-large dynamics (arrows pointing upwards) are allowed. (C) The OCN used for model simulations, showing the partitioning of the 236 river reaches into four groups: high-elevation headwaters (“high-head”); mid-positioned reaches (“mid”); lowland headwaters (“low-head”); large downstream reaches (“down”). Values of drainage area and distance to outlet for all reaches are shown in Supplementary Figure 1.
By using OCNet, we derive basic geomorphological features of any reach k such as its length L(k), drainage area A(k) and subcatchment area [i.e., the extent of the portion of (terrestrial) OCN landscape that directly drains into reach k]. Moreover, we evaluate hydraulic variables [i.e., stream width b(k), depth d(k), velocity v(k)] at any reach k by following the power-law scaling relationships on drainage area of Leopold and Maddock (1953):
where superscript (o) indicates hydraulic variables evaluated at the outlet reach. We assume b(o) = 24 m, d(o) = 1 m, v(o) = 1.7 ms−1, which are typical values for prealpine catchments (Leopold et al., 1964; Schädler and Weingartner, 1992). Under the hypothesis of rectangular reach cross sections, water discharge Q(k) = b(k)d(k)v(k) and water volume V(k) = b(k)d(k)L(k) are then calculated for any reach k.
2.2. Spatial food-web model
Our SFW model is based on a meta-food web (see Section 2.2.1 and Figure 1A) made up of N unknowns (i.e., species and nutrients), and a river network discretized into M reaches. Specifically, we consider N − 1 living species and a single nutrient compartment, which subsumes both organic detritus and inorganic elements such as nitrogen and phosphorous. We indicate by [SI dimensions: L−3] the numerical density of species i at reach k. The local food web at a node k (Figure 1B) is sustained by nutrients whose density we indicate by [L−3]. We assume that local consumer-resource interactions follow a generalized Lotka-Volterra model, with ri [T−1] being the (negative) growth rate of living species i (i = 1, …, N − 1), and aij [L3T−1] the interaction strength coefficient between species i and j (positive if i consumes j; i, j = 1, …, N). We model species' dispersal as a diffusive process, governed by a species-specific dispersal rate δi (i = 1, …, N − 1), which can be interpreted as the rate at which species i leaves a reach because of dispersal. The flux of species i out of reach k, , is partitioned among the reaches l that are directly connected with k, both upstream and downstream, according to weights .
As for nutrient dynamics, we consider a (reach-specific) fixed nutrient flux ϕ(k) originating from subcatchment k. Nutrients are consumed by some species within the food web; in analogy with consumer-resource interactions within the food web, we assume a type-I functional response with (negative) interaction strength coefficients aNj, where j is a nutrient-feeder species (i.e., any species feeding on detritus or uptaking inorganic elements, such as primary producers). Aside from consumption by nutrient feeders, nutrients are removed from a reach according to a rate , where vU [LT−1] is an uptake velocity, which subsumes transformation processes operated by microbial biofilm in the hyporheic zone (i.e., at the interface between stream water and pore water; Mulholland et al., 2008; Basu et al., 2011; Roche et al., 2019). We assume that nutrients are passively advected along the river network, i.e., they travel downstream at the same velocity of water. We indicate as Q(k) [L3T−1] and V(k) [L3] the water discharge and volume of reach k, respectively; furthermore, we express riverine connectivity via an adjacency matrix W with entries w(lk) = 1 if reach l drains into k and null otherwise.
For a given reach k, the system of ordinary differential equations (ODEs) expressing food-web dynamics reads:
System Equations (1, 2) can be generalized to the whole river network and written in matrix form as follows:
where the operator ◦ represents the Hadamard (element-wise) product;
is a vector of NM state variables; Φ = [0, …, 0, ϕ(1), …, 0, …, 0, ϕ(M)] is a vector of known input terms;
is a vector of loss terms; D is a NM-by-NM dispersal matrix, in which the entry corresponding to the effect of species i in reach l on species i in reach k is ; the effect of nutrients in reach l to nutrients in reach k is ; is a NM-by-NM species interaction matrix, defined as a block diagonal matrix:
where A is a N-by-N matrix with entries aij.
2.2.1. Food-web characteristics and parameterization
To assign trophic interactions among species, we adopt a meta-food web approach. Our meta-food webs are derived from the niche model of Williams and Martinez (2000), which mimics trait-driven trophic relationships that are similar to those observed in aquatic systems (Liem, 1990; Shurin et al., 2006). A meta-food web is an integration of all realized trophic interactions among species within a target region. By assuming that consumer species have respective fixed ability to feed on certain resources (as the niche model does), the locally realized trophic relationships can be derived by mapping species' local co-occurrence to the links in the meta-food web (Ho et al., 2022). Meta-food webs are identified by an array of N species and the corresponding N-by-N diet matrix B, with entries bij = 1 if species i is consumed by species j, and null otherwise. Specifically, we draw body mass values m (expressed in kg) for N − 1 living species by following a log-normal distribution with parameters μ = log10−2 and σ = log10 (i.e., with median equal to 0.01 kg and mode equal to 5·10−5 kg, which are reasonable values for freshwater species, see e.g., Hirt et al., 2017). Each species' diet is derived by assuming a theoretical connectance C = 0.1 (typical range for freshwater food webs is roughly 0.05–0.3; Schmid-Araya and Schmid, 2000; Ho et al., 2019). Diets' radii are drawn from a beta distribution with parameters α = 200C, β = 100(1 − 2C), while diets' centers are drawn from a uniform distribution bound between half the diet radius and the species' body mass m. Cannibalism and mutual feeding are allowed. Species that have no prey (other than possibly themselves) are labeled as nutrient feeders. We further assume that each meta-food web should have a minimum number of nutrient feeders equal to 0.05N: if a given meta-food web has a lower number of species without prey, species with lowest m among those with preys are additionally assumed to feed on nutrients, until the minimal number of nutrient feeders is satisfied. Finally, we assume a constant nutrient particles' mass kg; such value was chosen so as to be plausible with respect to the aforementioned body mass distribution, and at the same time with high probability to be the lowest in a random draw of body masses (70.9% probability when N = 100). The assumptions on minimum number of nutrient feeders and nutrient particles' mass allow avoiding degenerate food webs, in which an insufficient number of nutrient feeders or extremely small nutrient particles would not allow sustaining species at the higher trophic levels.
Metabolic and trophic interaction parameters are assigned by following Pawar et al. (2012) and Ho et al. (2021) as functions of species' body masses, representing the scaling rules driven by metabolic theory (Brown et al., 2004). In particular, growth rates are defined as (s−1); interaction strength coefficients between a resource R and a consumer C are defined as
i.e., by assuming a three-dimensional grazing behavior (Pawar et al., 2012; Ho et al., 2021). Preliminary simulations based on alternative feeding behaviors (Pawar et al., 2012) did not show any substantial effects in the resulting food-web patterns. As in Ho et al. (2021), the positive effect of a resource on a consumer is expressed as aCR = 0.5|aRC|mR/mC. If two species i, j are not involved in a consumer-resource relationship, then aij = aji = 0. Interaction coefficient values between nutrients and nutrient feeders are also calculated as in Equation (4). Species' intraspecific interactions coefficients aii are also assumed to depend on body mass as (m3s−1) (Ho et al., 2021).
2.2.2. Dispersal processes
In analogy with food-web parameters, we assume that dispersal rates δi also scale as a power law of body mass mi: , where δ is a baseline dispersal rate. The sign of the exponent z could in principle be either positive or negative, indicating higher dispersal propensity for species with higher or lower body mass, respectively (Anderson and Fahimipour, 2021). For modeling simplicity, we adopted z = 0.36, which was the estimated exponent for the relationship between maximum velocity and body mass in swimming individuals of small body size realistic in riverine systems (Hirt et al., 2017).
Dispersal weights are derived after Carraro et al. (2018) with the following rules: first, organisms can move both upstream and downstream to neighboring reaches. In headwater and outlet reaches, where an upstream and downstream connection is missing, respectively, organisms supposed to move toward the missing destination remain in the origin reach. Second, organisms' propensity to downstream movement pD,i is assumed to depend on body size: pD,i = 0.5[1+exp(kDmi)], where kD is a (negative) downstream bias coefficient. This relationship implies that no species have higher propensity to move upstream than downstream, while the tendency to move upstream is positively dependent on body mass: organisms with mi → 0 have pD,i ≈ 1 (i.e., they can only move downstream), while for very large organisms it is pD,i ≈ 0.5 (i.e., they can move in both directions indifferently). The larger (i.e., closer to zero) the downstream bias coefficient kD, the higher the downstream propensity pD,i is. Third, if multiple upstream connections are available from reach l, organisms moving upstream are partitioned in proportion to the cross-sectional areas of the upstream reaches. For a pair of connected reaches k, l it is then:
Note that the ratio of water volumes V(l)/V(k) appearing in the terms of D related to the species is necessary because the state variables contained in X are defined as densities (see also Jacquet et al., 2022). Such formulation of dispersal accounts for both passive and active modes, the latter being expressed as a diffusive process, which is justified for the analysis of large-scale processes in swimming organisms (Carraro et al., 2018). As such, our formulation encompasses the main dispersal modes of most freshwater organisms within a wide range of body sizes (Radinger and Wolter, 2014; Schmidt-Kloiber and Hering, 2015; Tonkin et al., 2018).
2.2.3. Nutrient dynamics
We express the nutrient input term as [L−3T−1], where [L−2T−1] is a local nutrient production factor (number of nutrient particles released in water per unit area and unit time), which can depend on the reach's position within the river network. Specifically, we set , where is the average nutrient load across the river network, and LU(k) a reach-specific non-dimensional coefficient. ϕ(k) also depends on subcatchment area (i.e., the larger the portion of terrain drained by a reach, the higher the local nutrient input) and water volume V(k).
We assume that nutrient removal from the water column occurs at a spatially constant uptake velocity vU (Basu et al., 2011; Yang et al., 2021). The reach-specific nutrient removal rate is then , i.e., it decreases downstream, where water depth is larger. In the case of nitrogen, it is known that denitrifying bacteria have an important role in removing organic nitrogen compounds from the water column, and that removal rates generally depend on the in-stream nitrogen concentration (Mulholland et al., 2008; Helton et al., 2018). However, given the conceptual nature of our simulation exercise and for the sake of simplicity, we here discard non-linear effects in the uptake process.
2.2.4. Simulation details
We generate meta-food webs by imposing N = 100, a value large enough to virtually encompass most trophically distinguished riverine species, while at the same time ensure computational feasibility. In order to account for uncertainties in both body size values and trophic interactions, we generate 10 random arrays of body sizes from the aforementioned distribution, and for each of these arrays we generate 10 different diet matrices, hence resulting in 100 different meta-food webs.
We derive equilibrium densities for the SFW model by simulating the ODE system Equation (3) via function ode23 in MATLAB. Simulations are initialized by attributing a density of 10−4 m−3 to all state variables (i.e., local species and nutrient densities). Because we are interested in observing the subsets of surviving species at the equilibrium state, and given that state variables in an ODE system are positive by construction, we impose a threshold density of 5·10−7 m−3 below which we set state variables to 0. Simulations are stopped as soon as the following condition is met:
where xi(t) is the generic component of the state variables vector X evaluated at time t (expressed in days).
2.3. Food-web metrics and assessment of spatial patterns
We study how food-web properties emerging from the equilibrium state of the SFW model Equation (3) vary across the river network. We first assess the local species richness as the number of surviving species at a reach and the relative local diet matrix (subset of the meta-food web diet matrix for the locally present species). From the local diet matrix, we compute the following structural food-web metrics: link density (ratio between number of links and species richness), connectance (proportion of realized-to-potential links in a web, which is the ratio between link density and species richness), modularity (via function multilevel.community of igraph R package; Csardi and Nepusz, 2006), nestedness (via function unodf of UNODF R package; Cantor et al., 2017), niche overlap (Horn's index from the resources' perspective, via function networklevel of bipartite R package; Dormann et al., 2009), and omnivory (standard deviation of every consumer's diets' trophic levels, averaged across all consumers). Specifically, nestedness reflects the level that the specialists' diets are subsets of generalists' diets in a web, and modularity reflects the level at which interactions are characterized into modules (i.e., frequently within but rarely between). The chosen metrics are among the most general and widely investigated for the study of food-web structural properties, ranging from some purely providing a holistic view of network structure (e.g., connectance) to some implying its ecological relevance (e.g., niche overlap; Thébault and Fontaine, 2010; Neff et al., 2021; Blackman et al., 2022; Ho et al., 2022).
To assess how the emerging species richness and food-web metrics vary across the river network, we partition the M = 236 reaches into four sub-groups, based on the median values of distance to outlet and drainage area. We hence identify groups of high-elevation headwaters (“high-head”); mid-positioned (“mid”) reaches; lowland headwaters (“low-head”); and large, downstream reaches (“down”). The partitioning of reaches into these four groups is shown in Figure 1C and Supplementary Figure 1. Beside a direct comparison of metric values among the groups, we also fit linear models using distance to outlet and (log-transformed) drainage area as predictors, and food-web metrics as response variables, which allows us to assess the direction and relevance of effects of these two continuous predictors. Note that both drainage area (or Strahler stream order, a categorical variable related to it; Rodriguez-Iturbe and Rinaldo, 2001) and distance to outlet have been used as variables identifying an upstream-to-downstream gradient in the literature (Muneepeerakul et al., 2008; Altermatt, 2013; Besemer et al., 2013; Jacquet et al., 2022). While these two predictors are monotonically related in a single river stem, this is no longer true when a river network perspective is adopted (Supplementary Figure 1). In particular, drainage area is a proxy of river cross-section and water discharge (Leopold and Maddock, 1953), and as such is associated to habitat availability and influence of upstream portions of the river network, while distance to outlet is correlated with elevation, and hence related to local abiotic factors (e.g., surrounding land use types and temperature).
2.4. Sensitivity analysis
Our sensitivity analysis aims to understand whether the generated spatial patterns of species richness and food-web properties are robust to parameter variation, such that river landscape structure itself may determine the metacommunity and food-web properties; if this were not the case, the emerging spatial patterns of species richness and/or food-web structure would be driven by certain hydrological or biological process(es).
Specifically, we investigate the effect of five free parameters on spatial characteristics of the food web: the mean nutrient load across the river network , the reach-specific nutrient load quota LU(k), the uptake velocity vU, the baseline dispersal rate δ, and the downstream bias kD. We firstly define a default parameter set, in which m−2 day−1, ms−1, δ = 10−7 s−1, kD = −10; as for LU(k), we adopt a downstream-skewed distribution of nutrient loads, where LU(k) is positively related to proximity to the river outlet (Mineau et al., 2015). This implies that flatter subcatchments, located close to the outlet, have a larger fraction of land covered by highly nutrient-producing agricultural and urban areas. Specifically, we assume the functional form
i.e., LU(k) decreases linearly with increasing along-stream distance from the outlet , while is a normalization factor ensuring that
Whenever possible, default parameter values are chosen in agreement with empirical observations (e.g., see observed values of vU in Mulholland et al., 2008). Alternatively, we resorted to plausible assumptions: the default value for δ implies a dispersal time scale of about 100 days for individuals of mass 1 kg (suggestive of seasonal spawning migration of fish; Carraro et al., 2018); the default kD is such that the propensity to downstream movement pD,i can assume the full range of possible values [0.5; 1] for body masses following our hypothesized log-normal distribution (in particular, the probabilities to pick a species with pD,i ≤ 0.51 and pD,i > 0.99 are 5.6 and 24.4%, respectively).
We then assess the sensitivity of our results to changes in these parameter values by altering one parameter at a time with respect to the default parameter set. Alternative parameter values are chosen as m−2 day−1; δ = [10−8; 10−6] s−1; ; ms−1, which identify a “low” and “high” level for each of these parameters. As for LU(k), we test an alternative uniform distribution of nutrient loads, in which LU(k) does not depend on k; and a random distribution, with values of LU(k) following a uniform distribution. In both cases, normalization is operated to ensure that Equation (5) is respected. Note that, as our comparisons are entirely based on simulations, we refrain from performing statistical tests, and rather describe similarities and differences of the models' outputs in a qualitative way (White et al., 2014).
2.5. Comparison with null models
To assess the contribution of trophic and spatial processes in shaping the spatial food-web patterns emerging from the default SFW model, we disentangle effects from other potential sources of food-web variation. Specifically, we contrast the simulation outcome of our SFW model with a series of null models. For the same rationale as the above, we here only report qualitative comparison outcomes with null models.
2.5.1. Unique water body (“UWB”) model
To contrast the spatially explicit river network with a spatially implicit scenario, we consider a well-mixed unique water body having the same water volume (i.e., total available habitat) as the total water volume of the river network. The nutrient load into the water body is equal to the total nutrient load to the river network (), while the water discharge flowing out of the water body is the same as in the most downstream reach of the river network. For each meta-food web, we run the corresponding UWB system (see equations and details in the Supplementary material) and compute food-web metrics from the set of surviving species and the related diet matrix (a subset of the meta-food web). We then compute differences between the at-a-reach values of species richness and food-web metrics for the spatial food web with the corresponding value from the unique water body model. We finally investigate how such differences in food-web metrics vary as a function of analogous differences in species richness. Therefore, the UWB model keeps basic hydrological settings as in the SFW, but disregards its spatial structure and processes.
2.5.2. Reshuffled meta-food web (“RMW”) model
For each meta-food web and reach we observe the equilibrium local species richness n for the SFW model, and we pick a random subset of n species from the meta-food web. We build the local diet matrix as the corresponding subset of the meta-food web diet matrix, and compute the related food-web metrics. We repeat this procedure 100 times and derive the mean of the food-web metrics across the 100 replicates (one value per reach and meta-food web). In other words, the RMW model keeps (presumably biologically sensible) interactions of the meta-food web and the site-by-site species richness, but randomizes the local composition of species. Different patterns between SFW and RMW would indicate that species identity matters: driven by the spatial processes and food-web dynamics, only certain species can retain at certain locations, and this shapes the overall spatial food-web patterns observed with SFW.
2.5.3. Fully random (“RND”) model
For each meta-food web and reach we observe the local species richness n and number of links nL for the SFW model. We then generate a local n-by-n diet matrix with (quasi-)random allocation of nL links, with the constraints that there be exactly one basal resource, and at least one species feeding on the basal resource (excluding the basal resource itself). We repeat this procedure 100 times and derive the mean of the food-web metrics across the 100 replicates (one value per reach and meta-food web). The RND model consists in a further randomization of the RMW model. It generates patterns that are purely driven by local species richness and number of links, but embeds no other biological realities. Note that connectance and link density for the RND model are equal to those for the SFW model by construction, hence the comparison is here restricted to the four other food-web metrics.
3. Results
3.1. Spatial patterns of species richness and food-web metrics
For the default SFW model simulation, we observe highest species richness in the lowland (“low-head”) headwaters, followed by the main downstream reaches (“down”), the high-elevation (“high-head”) headwaters and the mid-positioned (“mid”) reaches (Figure 2). The spatial patterns of food-web metrics are generally related to those of species richness: in particular, link density, modularity and, to a lesser extent, omnivory are positively related to species richness, while connectance, nestedness, and niche overlap are negatively related (Figure 2). Regardless of the spatial group, values of connectance are close to the expected value 0.1 imposed to the meta-food web (see Section 2). The niche overlap metric shows the largest variability across river reaches and meta-food-web realization (coefficient of variation CV = 0.430; Table 1), followed by nestedness (CV = 0.418), while connectance and modularity are the least variable food-web metrics (CV < 0.23). The specific meta-food-web realization explains the largest fraction of variance (Table 1) for all investigated metrics (totalling up to 72.9% for omnivory). Distance to outlet is the second most relevant predictor in terms of variance explained for species richness and niche overlap, and explains a larger fraction of variance than drainage area for all metrics (Table 1). In the case of omnivory, the fraction of variance explained by continuous spatial predictors (i.e., distance to outlet and drainage area) is as small as 5.9 and 1.6%, respectively.
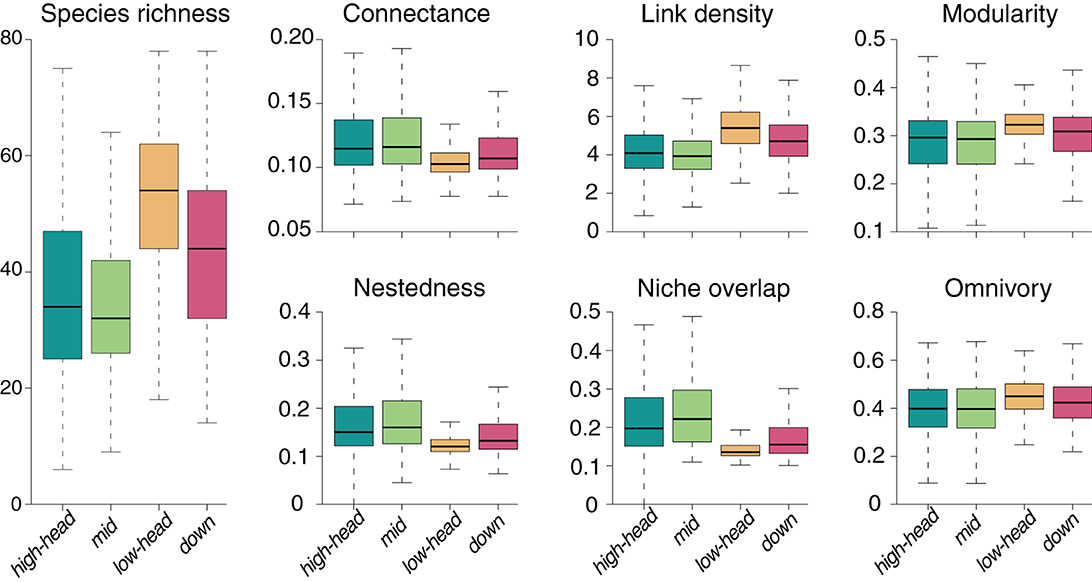
Figure 2. Spatial distribution of species richness and six food-web metrics obtained from default SFW model simulations.
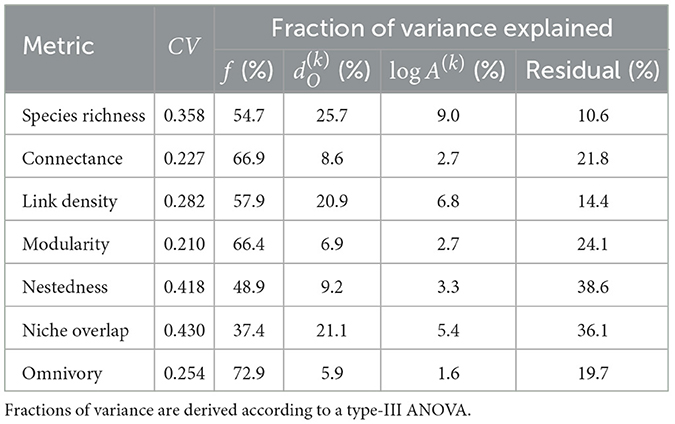
Table 1. Coefficient of variation (CV) in species richness and food-web metrics for the default SFW model and related fractions of variance explained by meta-food-web realization f, distance to outlet , and (log-scaled) drainage area log A(k).
The directions of trends of continuous spatial predictors are not equally consistent across food-web metrics and depend on the specific meta-food-web realization, particularly for the trend of drainage area (Figure 3). A negative trend of both distance to outlet and drainage area is observed across more than 95% of the meta-food webs for species richness and link density, and a positive trend across more than 95% of the meta-food webs is observed only with respect to distance to outlet for niche overlap. Conversely, the other metrics' directions vary depending on the meta-food webs. Specifically, a positive effect of continuous spatial predictors on connectance and nestedness is observed for <95% of the meta-food webs, with markedly lower values for the drainage area trend; analogously, the negative effect of distance to outlet and drainage area on modularity and omnivory is observed in <95% of the meta-food webs.
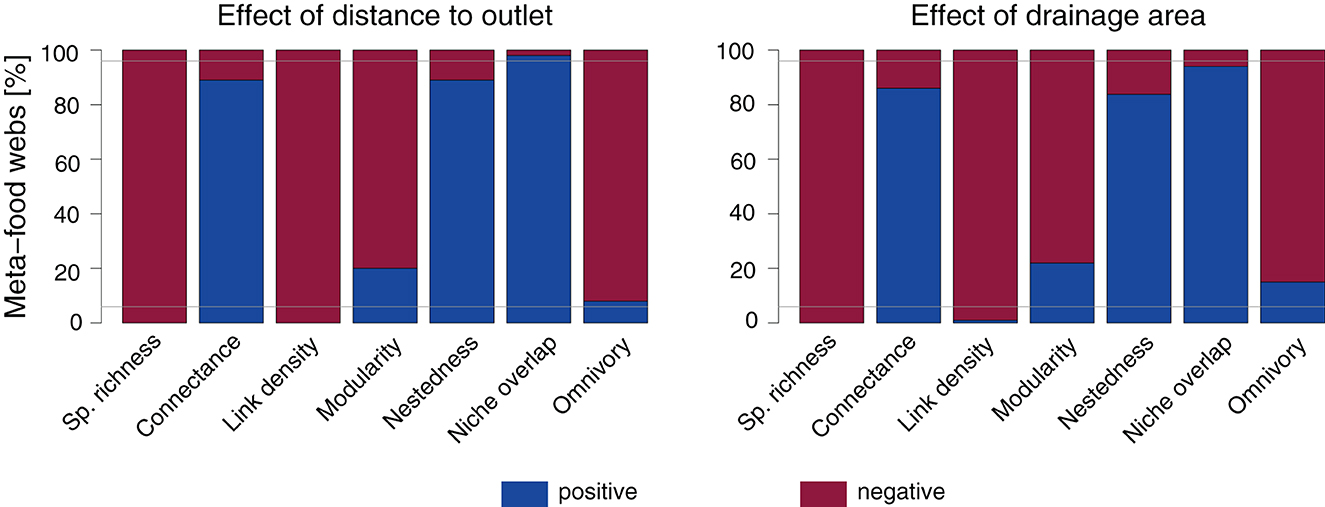
Figure 3. Direction of trends of distance to outlet and drainage area on species richness and food-web metrics (default SFW model). Linear models with both distance to outlet and (log-transformed) drainage area as predictors are fitted separately for each meta-food-web realization. Gray horizontal lines are drawn at values of 5 and 95%.
3.2. Sensitivity analysis
Total nutrient load is positively associated with species richness (Figure 4A). When nutrient load into the river network is high, spatial differences in species richness diminish; an analogous trend can be observed, although to a lesser extent, when nutrient load is low. Similarly, nutrient distribution patterns that are not downstream-skewed do not result in downstream-richer communities: conversely, a flat nutrient distribution yields a pattern of decreasing species richness in the downstream direction (Figure 4B), with both low and high headwaters being characterized by the highest local species richness. If nutrient loads are randomly distributed, the downstream decreasing pattern of species richness is preserved, although with higher variability than for a flat nutrient distribution. Both the flat and random nutrient distribution scenarios yield consistently higher mean species richness than for the default downstream-oriented nutrient distribution (Figure 4B). Overall, nutrient uptake velocity is negatively related to species richness (Figure 4C). However, the decrease in local species richness in response to increased uptake velocity is stronger in the downstream reaches than in the high elevation headwaters, such that this latter group has higher richness than the downstream one, which was not the case in the default simulation. Decreasing the dispersal rate by 10-fold does not substantially modify any of the spatial patterns of species richness observed in the default simulation (Figure 4D). However, when dispersal rate is increased by 10-fold, species richness generally decreases for all spatial groups of the river network. This decrease is more pronounced in the groups with higher species richness (lowland headwaters and downstream reaches), so that the general effect of increased dispersal rate appears to be a homogenization of species richness across the river network. Finally, we do not observe any major change in spatial species richness patterns in response to changes in downstream bias (Figure 4E).
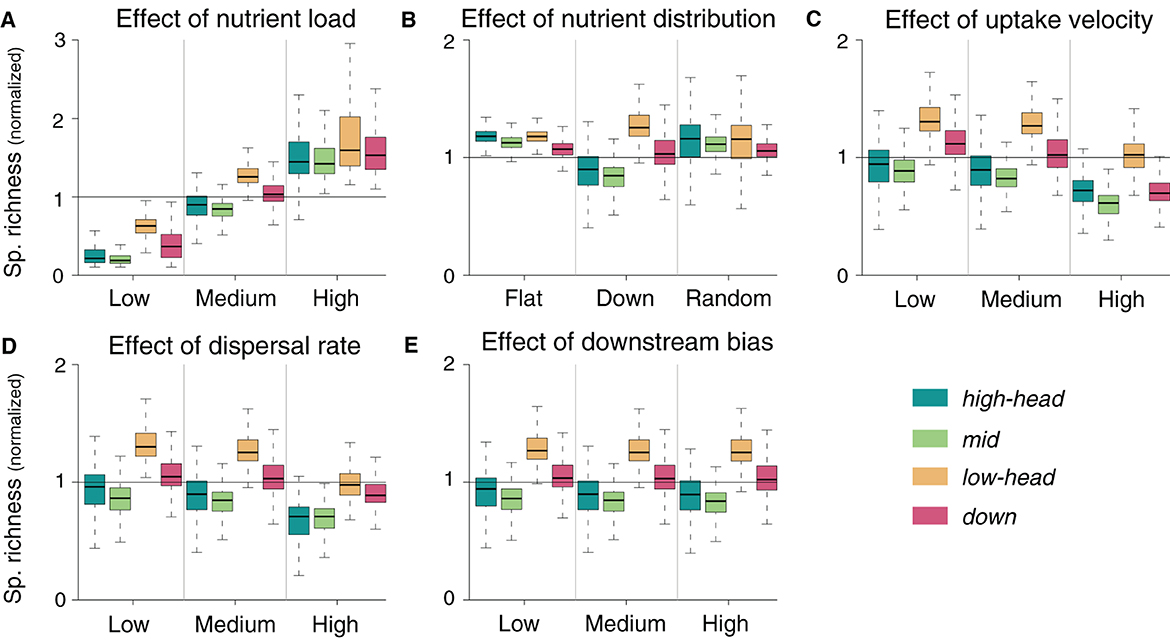
Figure 4. Sensitivity of normalized species richness to changes in parameter values. Normalization is performed by dividing the local species richness by the mean species richness of the default simulation relative to the corresponding meta-food web. Default simulations are shown in the central column of each panel.
Effects of nutrient load, nutrient distribution, uptake velocity and dispersal rate on connectance are generally reversed to species richness (Figure 5), that is, parameter values that increase species richness in a given spatial group decrease such food-web metric in the same group. However, the magnitude of variation in connectance in response to parameter variation is lower than it is the case for species richness. Higher connectance with respect to the default simulation is observed whenever species richness is decreased: this occurs, for instance, when total nutrient load is low, uptake velocity is high, or dispersal rate is high (Figure 5). Results of the sensitivity analysis for the other food-web metrics are presented in Supplementary Figures 2–6. Overall, the trend of increasing link density, modularity, and omnivory, and decreasing nestedness and niche overlap with increasing species richness observed in Figure 2 is maintained.
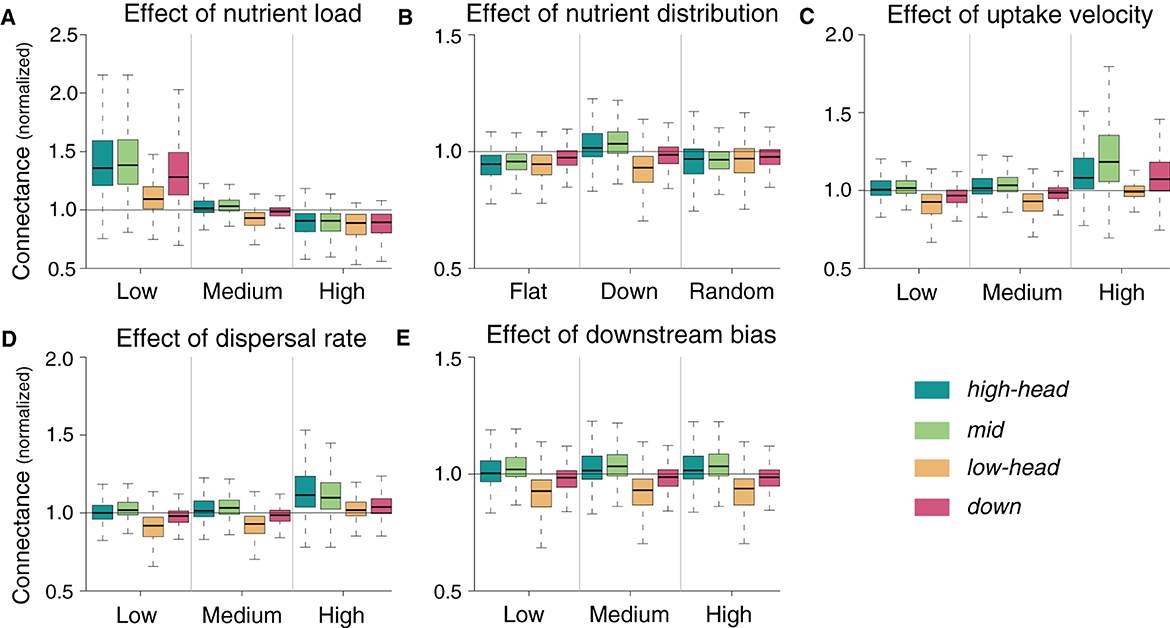
Figure 5. Sensitivity of normalized connectance to changes in parameter values. Normalization is performed by dividing the local connectance by the mean species richness of the default simulation relative to the corresponding meta-food web. Default simulations are shown in the central column of each panel.
3.3. Comparison with null models
3.3.1. UWB model
Local communities in the SFW model contain always less species than in the respective UWB model (as differences in species richness are always negative in Figure 6). Differences in link density between the SFW and UWB models appear to be linearly related to changes in species richness, with the local communities most depleted in species (i.e., high-elevation headwaters and mid-positioned reaches) that have the lowest link density as compared to the UWB model, while the decrease in link density for lowland headwaters is the smallest observed among the four spatial groups. Conversely, differences in the other food-web metrics show non-linear trends with respect to changes in species richness between the SFW and UWB models: in general, species-depleted communities (i.e., high-elevation headwaters and mid-positioned reaches) in the SFW model are associated with higher food-web connectance, lower modularity, higher nestedness, higher niche overlap, and lower omnivory than UWB. An exception are species-rich lowland headwaters, where differences in food-web metrics appear mostly unrelated to differences in species richness, with distributions of values that largely overlap zero.
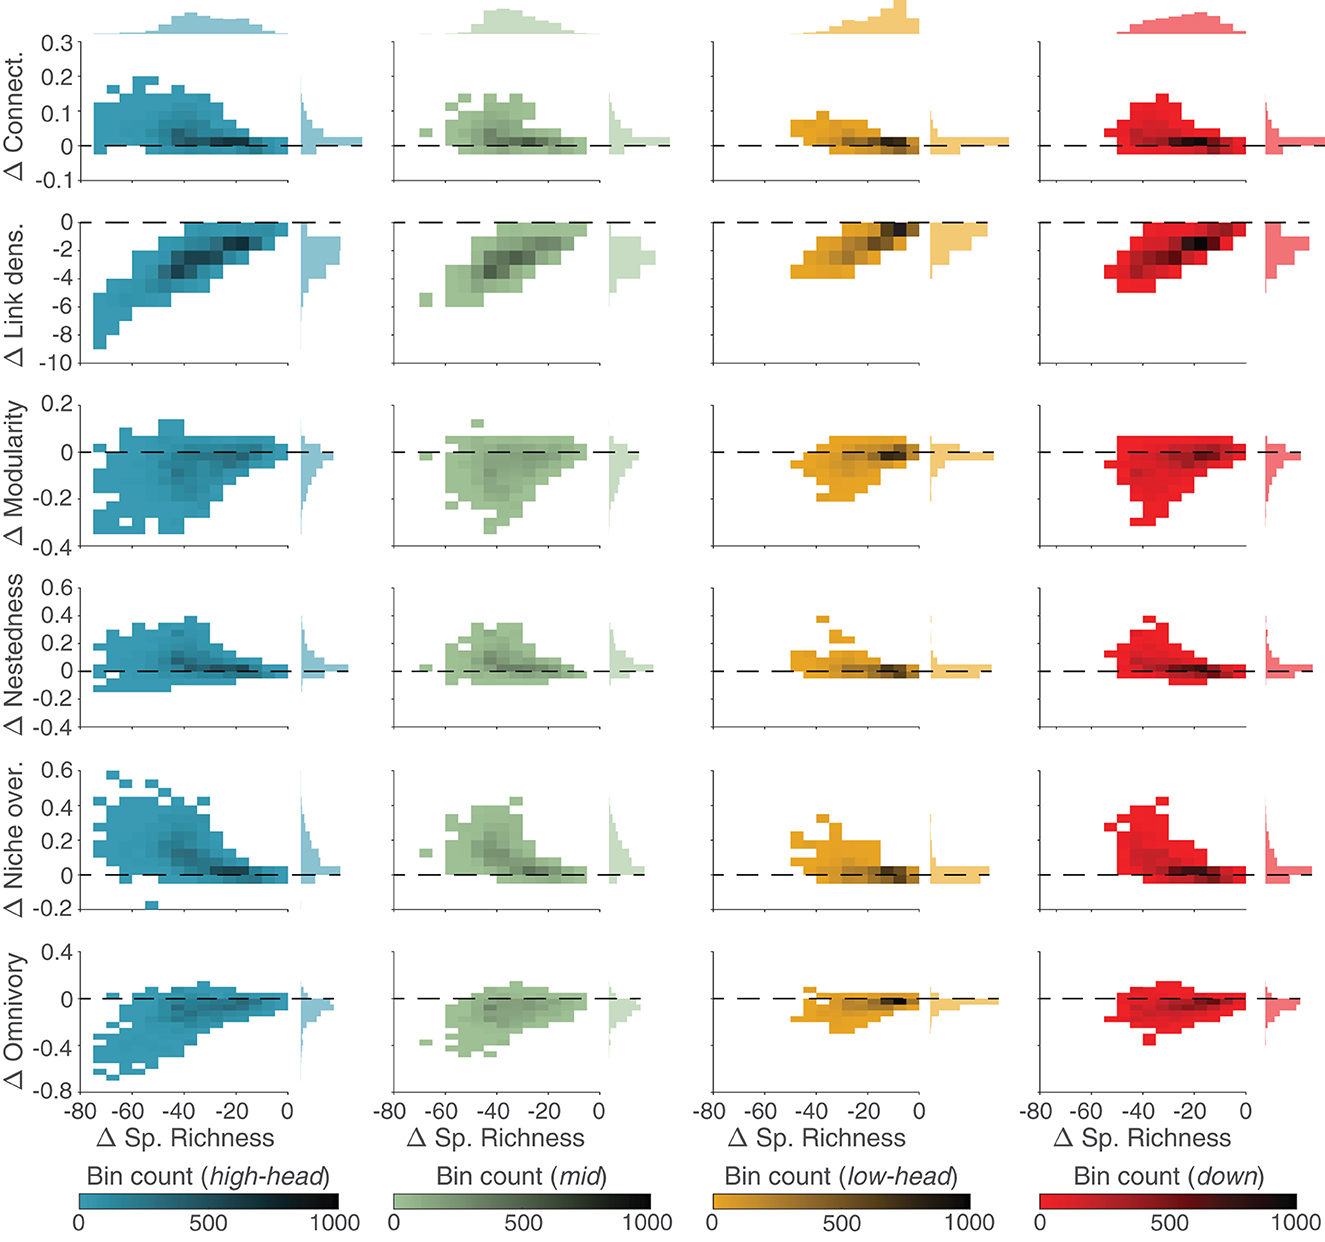
Figure 6. Comparison between SFW and UWB models. 2D histograms of differences (Δ) in food-web metrics (y-axis; different metrics are shown along rows) between SFW and UWB model as a function of respective differences in species richness (x-axis) for different spatial groups of the OCN (columns; color-coded as in Figure 2). 1D histograms of differences in food-web properties and species richness are shown on the right and top, respectively. Dashed lines indicate Δ = 0.
3.3.2. RMW model
Food-web metrics for the RMW model generally differ with respect to the SFW model, both in terms of absolute values and of spatial patterns (Figure 7). For most food-web metrics (in particular, connectance, modularity, nestedness, and niche overlap), the species-richest lowland headwaters are the sites where the differences between RMW and SFW values are the smallest; however, this is not the case for omnivory, where it is the species-depleted high-elevation headwaters and mid-positioned reaches that have values closest to the SFW ones.
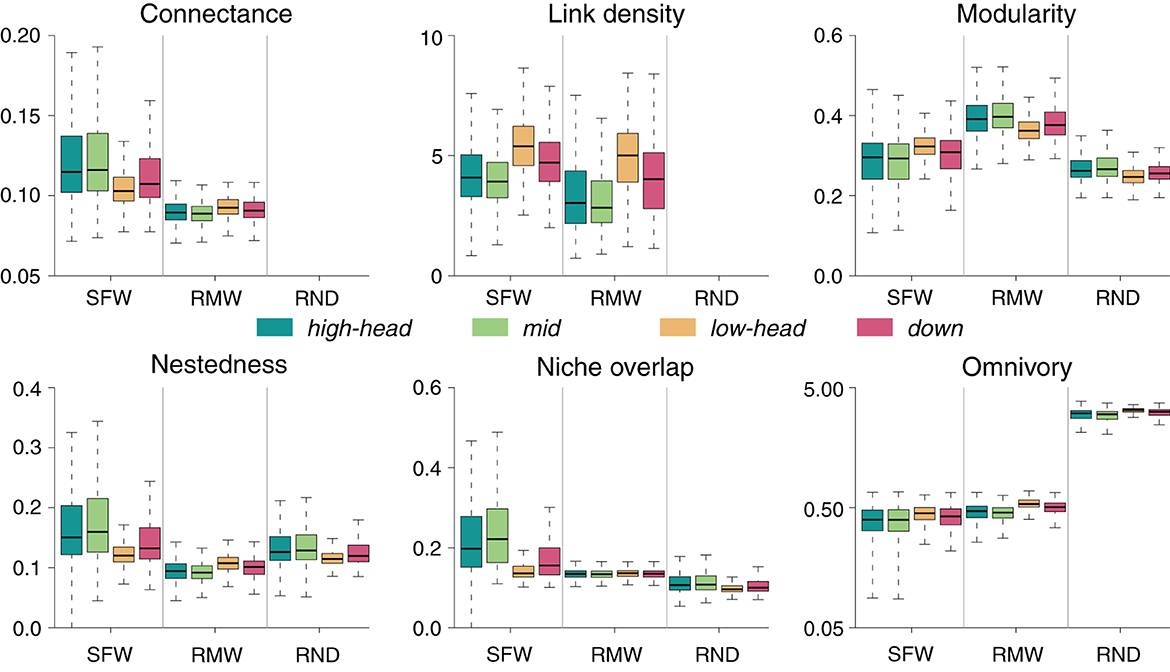
Figure 7. Comparison between SFW, RMW, and RND models. For the SFW model, food-web metrics are as in Figure 2. In the case of RMW and RND models, boxplots are constituted by mean values of food-web metrics for each meta-food web across 100 replicates (see Section 2). For visual purposes, omnivory is displayed in logarithmic scale.
Overall, local communities in the SFW model exhibit higher values of connectance, link density, nestedness, and niche overlap than in the RMW model, while an opposite trend is observed for modularity and omnivory (Figure 7). Interestingly, for most food-web metrics the RMW model shows spatial trends that are reversed with respect to the SFW model: for instance, connectance, nestedness, and niche overlap in the RMW model are lowest in species-richest communities (i.e., lowland headwaters), as opposed to the SFW model, in which these communities have highest values of these metrics. Furthermore, the positive trend of modularity with species richness is reversed in the RMW model (i.e., modularity is lowest in species-rich lowland headwaters in the RMW model). Finally, differences in link density and omnivory between the two models are relatively minor, although spatial variability (e.g., compare high- vs. low-elevation headwaters) is slightly enhanced in the RMW model.
3.3.3. RND model
Values of nestedness and niche overlap in the SFW model are much higher than in the RND model, while the reverse is true for omnivory (Figure 7). Values of modularity in the RND model are similar to the SFW model, but spatial variations are much milder. Moreover, the spatial pattern of modularity in the RND model is reversed with respect to the SFW model. In contrast, spatial patterns of nestedness and niche overlap in the RND model follow those of the SFW model (i.e., lowest food-web metric values in species-richest lowland headwaters), although with much more dampened spatial variations. As for omnivory, the spatial pattern of increasing metric with increasing species richness is preserved for both models.
4. Discussion
We present a spatial food-web (SFW) model that mechanistically integrates the underpinning landscape structure, hydrological connectivity, and species trophic interactions to predict metacommunity and local food-web structure across realistic synthetic river networks. Our SFW model with default parameter settings predicts higher species richness at lowland headwaters and downstream reaches than high-elevation headwaters and mid-positioned reaches, and both distance to outlet and drainage area are negative predictors of this spatial pattern. Notably, this pattern of downstream increasing species richness is generally consistent with well-supported understanding of stream biodiversity (Vannote et al., 1980; Oberdoff et al., 1995; Ward, 1998; Muneepeerakul et al., 2008; Carrara et al., 2012; Altermatt, 2013) as well as empirical data covering individual river networks (e.g., Blackman et al., 2022), indicating that our model captures the determining mechanisms that shape species richness in a riverine metacommunity. At a finer perspective, our model predicts higher species richness in headwaters (“high-head” and “low-head”) over respective downstream reaches (“mid” and “down”). Such an upstream-rich pattern—contradicting with the above classical understanding—is known from various empirical systems (Besemer et al., 2013), especially in the context of perturbations (Harvey et al., 2018). Thus, this finer-scale pattern in our model may help reconcile the contradiction: both patterns can be found within a river network depending on the spatial scale looked at. Of course, our model is based on simple synthetic species, thus represents a general prediction but does not explain taxon-specific spatial richness patterns driven by specific biology (e.g., fish vs. bacteria; Carraro et al., 2022).
Our sensitivity analysis identifies key drivers of predicted spatial patterns. Specifically, it shows that species richness is strongly, positively driven by nutrient availability. With low and high nutrient loads, local communities support, respectively, low and high richness, but interestingly in both cases spatial variations are attenuated. Such a homogenization may reflect that communities are close to their minimal/maximal possible size at the dynamical equilibrium, which is constrained by our niche model setting. Thus, spatial gradients of species richness, if driven by local incompatibility of species due to nutrient limitation, should be more prominent in river networks with intermediate nutrient loads. Furthermore, flat and random nutrient distributions generate overall higher species richness with an upstream-rich pattern, as opposed to the downstream-skewed nutrient distribution case. This is due to the comparatively higher nutrient load at upstream locations in the flat and random scenarios. Hence, a downstream-skewed nutrient distribution is theoretically sub-optimal for the overall richness in river networks: substantial downstream nutrient will quickly exit the system without being used by organisms. This is echoed by local communities in the SFW model always containing only a subset of species relative to the respective UWB model, because the total nutrient outflux in the latter is smaller: indeed, in both models, the water discharge exiting the system is set to be the same, but the nutrient concentration (and hence the output flux, which is the product between concentration and discharge) is much higher in the UWB model, due to the assumption of complete mixing within the water body volume. We set downstream-skewed nutrient distribution as the default, reflecting realistic scenarios of downstream-increased land use (Mineau et al., 2015). The interaction between local (nutrient input from terrestrial regions) and spatial (cumulative effects of hyporheic uptake subtracting nutrients as they travel downstream) processes on nutrient dynamics results in highest species richness observed in lowland headwaters, where local nutrient load is high and nutrient concentration is not diluted by nutrient-depleted (due to hyporheic uptake) water coming from upstream.
As for structural properties among local food webs, the SFW model predicts spatial patterns of link density, modularity, and omnivory to be positively associated with species richness, while the opposite is true for connectance, nestedness, and niche overlap. In other words, food webs at distal (i.e., high-elevation headwaters and mid-positioned) reaches tend to be composed of a smaller number of species that are relatively broad-feeders that overlap more in diets than those at proximal (lowland headwaters and downstream) reaches, while the latter are characterized by species forming differentiated dietary modules. Distance to outlet appears to be a superior spatial predictor of these food-web patterns, indicating that the spatially varying species composition is driven more by local processes (i.e., local terrestrial nutrient input) than by basin level processes (nutrient spatial dynamics and species dispersal). Local processes drive the spatial differences among reaches, whose effects on food-web structure can be seen in our sensitivity and null-model analyses: in comparison to the spatially lumped system hypothesized in the UWB model, nodes in the SFW model sustain fewer species due to limited nutrient available, and at more species-depleted nodes it is the more connected and nested food webs that prevail. Analogously, with high species dispersal rate, not only all spatial patterns are dampened (pointing toward a homogenization as expected by general metacommunity concepts; Meutter et al., 2007; Gross et al., 2020), but local food webs across the river network tend to become smaller in size and, again, more connected and nested (Figures 4, 5, Supplementary Figures 2–5). Therefore, spatial differences may provide niches for various species to persist at the river network scale; nonetheless, when nutrients are locally limited, or when species dispersal is so effective that the spatial differences among nodes become negligible, it is the dietary generalists that are favored to persist. Interestingly, however, the structure of food webs predicted by SFW at lowland headwaters is responsive to increased dispersal rate yet unresponsive to species richness deviation from UWB. This indicates a potential mediating interaction effect of distance to outlet and drainage area, whose underpinning mechanism remains to be explored. Among all metrics, omnivory exhibits the most modest spatial patterns and is largely determined by the specific meta-food-web realization. While this index may be intrinsically less responsive as the value is averaged across all species in a food web, this pattern is also in agreement with the empirical understanding that dietary specialists are rare in freshwater communities (Shurin et al., 2006; Ho et al., 2022), and consumers are mostly omnivores feeding from multiple trophic levels.
Comparing the SFW model with the RMW and RND null models, their divergent spatial food-web structural predictions imply that both biologically sensible trophic relationships (links embedded in the meta-food webs and dynamics modeled by the generalized Lotka-Volterra model) and spatial processes (other parameters included in our Equation 3) are important for determining “who is where.” It is not just the different species richness across nodes, but the interplay of trophic interactions, resource exchange and species dispersal that shapes riverine metacommunities and the properties of food webs therein. Intriguingly, regarding food-web patterns among spatial groups, the SFW model exhibits qualitatively reversed connectance patterns with respect to the RMW model, and modularity patterns with respect to both the RMW and RND models; moreover, the RMW model shows reversed nestedness and niche overlap patterns as opposed to the SFW and RND models. Together, this implies that the observed nestedness and niche overlap patterns in the SFW model are partly shaped by the spatial patterns of species richness, but may be more largely influenced by connectance; meanwhile, the observed modularity pattern is particularly shaped by the SFW metacommunity dynamics. Since species richness is not the sole driver of food-web structure, and we indeed observe that some food-web properties are more dependent on the specific meta-food-web realization than on continuous spatial predictors (distance to outlet and drainage area), it is plausible that different river systems with similar trends of downstream-increasing species richness would show different trends in food-web properties (or even the same river in different seasons—see Blackman et al., 2022).
Despite its complexity, our SFW model necessarily contains several simplifications for the sake of manageable simulations. For example, we only model the predator-prey kind of trophic interaction yet ignore other types of biological or biochemical interactions that may also influence species' local existence (Kéfi et al., 2012; Müller et al., 2012). We assume a fixed nutrient uptake velocity per unit water column, while it could be nutrient-load dependent (Mulholland et al., 2008). Also, we do not include species-specific responses to abiotic factors (see Thompson et al., 2020), nor habitat heterogeneity, which could modulate predation risk in certain areas of the river network (Mikheev et al., 2010). Furthermore, even for the factors that we consider, real-world dynamics can be more complicated than what is represented in our model: for example, excess nutrient load can lead to eutrophication, and algal blooms can deplete oxygen concentration in the water column and be detrimental for fish and other organisms (Le Moal et al., 2019), but this is beyond our model's scope. Our study is thus to be seen as a mechanism exploration and an extendable framework that lays a solid mathematically foundation and provides null hypotheses for future work. For instance, a possible expansion could investigate the effect of elevation (which can be assumed as proportional to temperature) as a key abiotic factor, and bio-energetic constraints of each species (Brown et al., 2004) could be incorporated to determine their respective fitness in population dynamics. Additionally, the use of ecosystem network analysis tools and weighted food webs (Bersier et al., 2002; Kones et al., 2009; Borrett and Lau, 2014) would allow the assessment of quantitative food-web metrics and hence a deeper understanding of the ecological patterns. Our SFW model is thus a useful tool promoting the examination of a broad spectrum of aspects of metacommunity dynamics in rivers.
In conclusion, our mechanistic spatial food-web model can generate realistic spatial patterns of species richness and food-web structural properties in a river network given realistic parameters. Since most of the key parameters chosen appear to be influential in our sensitivity analysis, we identify no universal spatial patterns in river networks solely driven by the landscape structure. Instead, we reveal respective influences of the hydrological and biological processes that contribute to these patterns. Our study highlights the importance of considering river networks in their entirety, not only as a sequence of sites following a gradient of a single explanatory variable (e.g., stream order or drainage area). Physical constraints and ensuing land-use heterogeneity (i.e., larger incidence of agricultural surfaces in lowlands) lead to differences in community composition between high- and low-elevation headwaters. Thus, it is important to consider such double dimension of river networks (i.e., drainage area and distance to outlet, Supplementary Figure 1), and future research should particularly focus on the role of lowland headwaters given our simulation outcome: if they are indeed pools of species, they should be adequately protected.
Data availability statement
The datasets presented in this study can be found in online repositories. The names of the repository/repositories and accession number(s) can be found at: https://doi.org/10.5281/zenodo.7962082.
Author contributions
H-CH and LC conceptualized the study, developed the model, analyzed model output, and wrote the first manuscript draft. FA and LC secured funding. All authors contributed to the final version of the manuscript.
Funding
This study was funded by the Swiss National Science Foundation to LC (Grant No. PZ00P2_202010) and FA (Grant No. 310030_197410), as well as the University of Zurich Research Priority Programme on Global Change and Biodiversity (URPP GCB).
Conflict of interest
The authors declare that the research was conducted in the absence of any commercial or financial relationships that could be construed as a potential conflict of interest.
Publisher's note
All claims expressed in this article are solely those of the authors and do not necessarily represent those of their affiliated organizations, or those of the publisher, the editors and the reviewers. Any product that may be evaluated in this article, or claim that may be made by its manufacturer, is not guaranteed or endorsed by the publisher.
Supplementary material
The Supplementary Material for this article can be found online at: https://www.frontiersin.org/articles/10.3389/fevo.2023.1147834/full#supplementary-material
References
Altermatt, F. (2013). Diversity in riverine metacommunities: a network perspective. Aquat. Ecol. 47, 365–377. doi: 10.1007/s10452-013-9450-3
Altermatt, F., Little, C. J., Mächler, E., Wang, S., Zhang, X., and Blackman, R. C. (2020). Uncovering the complete biodiversity structure in spatial networks: the example of riverine systems. Oikos 129, 607–618. doi: 10.1111/oik.06806
Anderson, K. E., and Fahimipour, A. K. (2021). Body size dependent dispersal influences stability in heterogeneous metacommunities. Sci. Rep. 11:17410. doi: 10.1038/s41598-021-96629-5
Basu, N. B., Rao, P. S. C., Thompson, S. E., Loukinova, N. V., Donner, S. D., Ye, S., et al. (2011). Spatiotemporal averaging of in-stream solute removal dynamics. Water Resour. Res. 47, W00J06. doi: 10.1029/2010WR010196
Beng, K. C., and Corlett, R. T. (2020). Applications of environmental DNA (eDNA) in ecology and conservation: opportunities, challenges and prospects. Biodivers. Conserv. 29, 2089–2121. doi: 10.1007/s10531-020-01980-0
Bersier, L.-F., Banašek-Richter, C., and Cattin, M.-F. (2002). Quantitative descriptors of food-web matrices. Ecology 83, 2394–2407. doi: 10.1890/0012-9658(2002)083[2394:QDOFWM]2.0.CO;2
Bertuzzo, E., Rodríguez-Iturbe, I., and Rinaldo, A. (2015). Metapopulation capacity of evolving fluvial landscapes. Water Resour. Res. 51, 2696–2706. doi: 10.1002/2015WR016946
Besemer, K., Singer, G., Quince, C., Bertuzzo, E., Sloan, W., and Battin, T. J. (2013). Headwaters are critical reservoirs of microbial diversity for fluvial networks. Proc. R. Soc. B Biol. Sci. 280, 20131760. doi: 10.1098/rspb.2013.1760
Blackman, R. C., Ho, H.-C., Walser, J.-C., and Altermatt, F. (2022). Spatio-temporal patterns of multi-trophic biodiversity and food-web characteristics uncovered across a river catchment using environmental DNA. Commun. Biol. 5, 1–11. doi: 10.1038/s42003-022-03216-z
Borrett, S. R., and Lau, M. K. (2014). ENAR: an R package for ecosystem network analysis. Methods Ecol. Evol. 5, 1206–1213. doi: 10.1111/2041-210X.12282
Brown, B. L., Swan, C. M., Auerbach, D. A., Campbell Grant, E. H., Hitt, N. P., Maloney, K. O., et al. (2011). Metacommunity theory as a multispecies, multiscale framework for studying the influence of river network structure on riverine communities and ecosystems. J. North Am. Benthol. Soc. 30, 310–327. doi: 10.1899/10-129.1
Brown, J. H., Gillooly, J. F., Allen, A. P., Savage, V. M., and West, G. B. (2004). Toward a metabolic theory of ecology. Ecology 85, 1771–1789. doi: 10.1890/03-9000
Cantor, M., Pires, M. M., Marquitti, F. M., Raimundo, R. L., Sebastián-González, E., Coltri, P. P., et al. (2017). Nestedness across biological scales. PLoS ONE 12, e0171691. doi: 10.1371/journal.pone.0171691
Carrara, F., Altermatt, F., Rodriguez-Iturbe, I., and Rinaldo, A. (2012). Dendritic connectivity controls biodiversity patterns in experimental metacommunities. Proc. Natl. Acad. Sci. U.S.A. 109, 5761–5766. doi: 10.1073/pnas.1119651109
Carraro, L., and Altermatt, F. (2022). Optimal Channel Networks accurately model ecologically-relevant geomorphological features of branching river networks. Commun. Earth Environ. 3, 125. doi: 10.1038/s43247-022-00454-1
Carraro, L., Bertuzzo, E., Fronhofer, E. A., Furrer, R., Gounand, I., Rinaldo, A., et al. (2020). Generation and application of river network analogues for use in ecology and evolution. Ecol. Evol. 10, 7537–7550. doi: 10.1002/ece3.6479
Carraro, L., Blackman, R. C., and Altermatt, F. (2022). Modelling eDNA transport in river networks reveals highly resolved spatio-temporal patterns of freshwater biodiversity. bioRxiv. doi: 10.1101/2022.01.25.475970
Carraro, L., Mari, L., Gatto, M., Rinaldo, A., and Bertuzzo, E. (2018). Spread of proliferative kidney disease in fish along stream networks: a spatial metacommunity framework. Freshw. Biol. 63, 114–127. doi: 10.1111/fwb.12939
Csardi, G., and Nepusz, T. (2006). The igraph software package for complex network research. InterJ. Complex Syst. 1695, 1–9.
Deiner, K., Fronhofer, E. A., Mächler, E., Walser, J.-C., and Altermatt, F. (2016). Environmental DNA reveals that rivers are conveyer belts of biodiversity information. Nat. Commun. 7, 1–9. doi: 10.1038/ncomms12544
Demars, B. O., Thompson, J., and Manson, J. R. (2015). Stream metabolism and the open diel oxygen method: principles, practice, and perspectives. Limnol. Oceanogr. 13, 356–374. doi: 10.1002/lom3.10030
Doretto, A., Piano, E., and Larson, C. E. (2020). The river continuum concept: lessons from the past and perspectives for the future. Can. J. Fish. Aquat. Sci. 77, 1853–1864. doi: 10.1139/cjfas-2020-0039
Dormann, C. F., Frueund, J., Bluethgen, N., and Gruber, B. (2009). Indices, graphs and null models: analyzing bipartite ecological networks. Open Ecol. J. 2, 7–24. doi: 10.2174/1874213000902010007
Gross, T., Allhoff, K. T., Blasius, B., Brose, U., Drossel, B., Fahimipour, A. K., et al. (2020). Modern models of trophic meta-communities. Philos. Trans. R. Soc. B 375, 20190455. doi: 10.1098/rstb.2019.0455
Harvey, E., Gounand, I., Fronhofer, E. A., and Altermatt, F. (2018). Disturbance reverses classic biodiversity predictions in river-like landscapes. Proc. R. Soc. B Biol. Sci. 285, 20182441. doi: 10.1098/rspb.2018.2441
Helton, A. M., Hall, R. O. Jr, and Bertuzzo, E. (2018). How network structure can affect nitrogen removal by streams. Freshw. Biol. 63, 128–140. doi: 10.1111/fwb.12990
Hirt, M. R., Jetz, W., Rall, B. C., and Brose, U. (2017). A general scaling law reveals why the largest animals are not the fastest. Nat. Ecol. Evol. 1, 1116–1122. doi: 10.1038/s41559-017-0241-4
Ho, H.-C., Brodersen, J., Gossner, M. M., Graham, C. H., Kaeser, S., Reji Chacko, M., et al. (2022). Blue and green food webs respond differently to elevation and land use. Nat. Commun. 13, 1–12. doi: 10.1038/s41467-022-34132-9
Ho, H.-C., Tylianakis, J. M., and Pawar, S. (2021). Behaviour moderates the impacts of food-web structure on species coexistence. Ecol. Lett. 24, 298–309. doi: 10.1111/ele.13643
Ho, H.-C., Tylianakis, J. M., Zheng, J. X., and Pawar, S. (2019). Predation risk influences food-web structure by constraining species diet choice. Ecol. Lett. 22, 1734–1745. doi: 10.1111/ele.13334
Hooper, D. U., Chapin, F. S. III., Ewel, J. J., Hector, A., Inchausti, P., Lavorel, S., et al. (2005). Effects of biodiversity on ecosystem functioning: a consensus of current knowledge. Ecol. Monogr. 75, 3–35. doi: 10.1890/04-0922
Jacquet, C., Carraro, L., and Altermatt, F. (2022). Meta-ecosystem dynamics drive the spatial distribution of functional groups in river networks. Oikos 2022, e09372. doi: 10.1111/oik.09372
Kéfi, S., Berlow, E. L., Wieters, E. A., Navarrete, S. A., Petchey, O. L., Wood, S. A., et al. (2012). More than a meal integrating non-feeding interactions into food webs. Ecol. Lett. 15, 291–300. doi: 10.1111/j.1461-0248.2011.01732.x
Kones, J. K., Soetaert, K., van Oevelen, D., and Owino, J. O. (2009). Are network indices robust indicators of food web functioning? A Monte Carlo approach. Ecol. Model. 220, 370–382. doi: 10.1016/j.ecolmodel.2008.10.012
Larsen, S., Comte, L., Filipa Filipe, A., Fortin, M., Jacquet, C., Ryser, R., et al. (2021). The geography of metapopulation synchrony in dendritic river networks. Ecol. Lett. 24, 791–801. doi: 10.1111/ele.13699
Le Moal, M., Gascuel-Odoux, C., Ménesguen, A., Souchon, Y., Étrillard, C., Levain, A., et al. (2019). Eutrophication: a new wine in an old bottle? Sci. Tot. Environ. 651, 1–11. doi: 10.1016/j.scitotenv.2018.09.139
Leibold, M., Holyoak, M., Mouquet, N., Amarasekare, P., Chase, J. M., Hoopes, M. F., et al. (2004). The metacommunity concept: a framework for multi-scale community ecology. Ecol. Lett. 7, 601–613. doi: 10.1111/j.1461-0248.2004.00608.x
Leopold, L. B., and Maddock, T. (1953). The Hydraulic Geometry of Stream Channels and Some Physiographic Implications. Technical Report Geological Survey Professional Paper 252, Washington DC. doi: 10.3133/pp252
Leopold, L. B., Wolman, M. G., and Miller, J. P. (1964). Fluvial Processes in Geomorphology. New York, NY: Dover Publications Inc.
Liem, K. F. (1990). Aquatic versus terrestrial feeding modes: possible impacts on the trophic ecology of vertebrates. Am. Zool. 30, 209–221. doi: 10.1093/icb/30.1.209
Loreau, M. (2010). Linking biodiversity and ecosystems: towards a unifying ecological theory. Philos. Trans. R. Soc. B Biol. Sci. 365, 49–60. doi: 10.1098/rstb.2009.0155
Meutter, F. V. d., Meester, L. D., and Stoks, R. (2007). Metacommunity structure of pond macroinvertebrates: effects of dispersal mode and generation time. Ecology 88, 1687–1695. doi: 10.1890/06-0333.1
Mikheev, V., Afonina, M., and Pavlov, D. (2010). Habitat heterogeneity and fish behavior: Units of heterogeneity as a resource and as a source of information. J. Ichthyol. 50, 386–395. doi: 10.1134/S0032945210050048
Mineau, M. M., Wollheim, W. M., and Stewart, R. J. (2015). An index to characterize the spatial distribution of land use within watersheds and implications for river network nutrient removal and export. Geophys. Res. Lett. 42, 6688–6695. doi: 10.1002/2015GL064965
Mulholland, P. J., Helton, A. M., Poole, G. C., Hall, R. O. Jr, Hamilton, S. K., Peterson, B. J., et al. (2008). Stream denitrification across biomes and its response to anthropogenic nitrate loading. Nature 452, 202–205. doi: 10.1038/nature06686
Müller, J. P., Hauzy, C., and Hulot, F. D. (2012). Ingredients for protist coexistence: competition, endosymbiosis and a pinch of biochemical interactions. J. Anim. Ecol. 81, 222–232. doi: 10.1111/j.1365-2656.2011.01894.x
Muneepeerakul, R., Bertuzzo, E., Lynch, H. J., Fagan, W. F., Rinaldo, A., and Rodriguez-Iturbe, I. (2008). Neutral metacommunity models predict fish diversity patterns in Mississippi-Missouri basin. Nature 453, 220–222. doi: 10.1038/nature06813
Neff, F., Brändle, M., Ambarlı, D., Ammer, C., Bauhus, J., Boch, S., et al. (2021). Changes in plant-herbivore network structure and robustness along land-use intensity gradients in grasslands and forests. Sci. Adv. 7, eabf3985. doi: 10.1126/sciadv.abf3985
Oberdoff, T., Guégan, J.-F., and Hugueny, B. (1995). Global scale patterns of fish species richness in rivers. Ecography 18, 345–352. doi: 10.1111/j.1600-0587.1995.tb00137.x
O'Connor, L. M., Pollock, L. J., Braga, J., Ficetola, G. F., Maiorano, L., Martinez-Almoyna, C., et al. (2020). Unveiling the food webs of tetrapods across Europe through the prism of the Eltonian niche. J. Biogeogr. 47, 181–192. doi: 10.1111/jbi.13773
Paquette, A., and Hargreaves, A. L. (2021). Biotic interactions are more often important at species' warm versus cool range edges. Ecol. Lett. 24, 2427–2438. doi: 10.1111/ele.13864
Patrick, C. J., Anderson, K. E., Brown, B. L., Hawkins, C. P., Metcalfe, A., Saffarinia, P., et al. (2021). The application of metacommunity theory to the management of riverine ecosystems. WIREs Water 8, e1557. doi: 10.1002/wat2.1557
Pawar, S., Dell, A. I., and Savage, V. M. (2012). Dimensionality of consumer search space drives trophic interaction strengths. Nature 486, 485–489. doi: 10.1038/nature11131
Pellissier, L., Albouy, C., Bascompte, J., Farwig, N., Graham, C., Loreau, M., et al. (2018). Comparing species interaction networks along environmental gradients. Biol. Rev. 93, 785–800. doi: 10.1111/brv.12366
Power, M. E., and Dietrich, W. E. (2002). Food webs in river networks. Ecol. Res. 17, 451–471. doi: 10.1046/j.1440-1703.2002.00503.x
Radinger, J., and Wolter, C. (2014). Patterns and predictors of fish dispersal in rivers. Fish Fish. 15, 456–473. doi: 10.1111/faf.12028
Reid, W. V. (1998). Biodiversity hotspots. Trends Ecol. Evol. 13, 275–280. doi: 10.1016/S0169-5347(98)01363-9
Rinaldo, A., Gatto, M., and Rodríguez-Iturbe, I. (2020). River Networks as Ecological Corridors. Species, Populations, Pathogens. New York, NY: Cambridge University Press. doi: 10.1017/9781108775014
Rinaldo, A., Rigon, R., Banavar, J. R., Maritan, A., and Rodriguez-Iturbe, I. (2014). Evolution and selection of river networks: Statics, dynamics, and complexity. Proc. Natl. Acad. Sci. U.S.A. 111, 2417–2424. doi: 10.1073/pnas.1322700111
Roche, K. R., Shogren, A. J., Aubeneau, A., Tank, J. L., and Bolster, D. (2019). Modeling benthic versus hyporheic nutrient uptake in unshaded streams with varying substrates. J. Geophys. Res. 124, 367–383. doi: 10.1029/2018JG004684
Rodriguez-Iturbe, I., and Rinaldo, A. (2001). Fractal River Basins. Chance and Self-Organization. New York, NY: Cambridge University Press.
Romanuk, T. N., Jackson, L. J., Post, J. R., McCauley, E., and Martinez, N. D. (2006). The structure of food webs along river networks. Ecography 29, 3–10. doi: 10.1111/j.2005.0906-7590.04181.x
Saravia, L. A., Marina, T. I., Kristensen, N. P., De Troch, M., and Momo, F. R. (2022). Ecological network assembly: how the regional metaweb influences local food webs. J. Anim. Ecol. 91, 630–642. doi: 10.1111/1365-2656.13652
Schädler, B., and Weingartner, R. (1992). “Natural runoff 1961-1980,” in Hydrological Atlas of Switzerland, eds R. Weingartner and M. Spreafico (Bern: Swiss Federal Office for Water and Geology), 5.
Schmera, D., Árva, D., Boda, P., Bódis, E., Bolgovics, Á., Borics, G., et al. (2018). Does isolation influence the relative role of environmental and dispersal-related processes in stream networks? An empirical test of the network position hypothesis using multiple taxa. Freshw. Biol. 63, 74–85. doi: 10.1111/fwb.12973
Schmid-Araya, J., and Schmid, P. (2000). Trophic relationships: integrating meiofauna into a realistic benthic food web. Freshw. Biol. 44, 149–163. doi: 10.1046/j.1365-2427.2000.00594.x
Schmidt-Kloiber, A., and Hering, D. (2015). www.freshwaterecology.info-an online tool that unifies, standardises and codifies more than 20,000 European freshwater organisms and their ecological preferences. Ecol. Indic. 53, 271–282. doi: 10.1016/j.ecolind.2015.02.007
Shurin, J. B., Gruner, D. S., and Hillebrand, H. (2006). All wet or dried up? Real differences between aquatic and terrestrial food webs. Proc. R. Soc. B Biol. Sci. 273, 1–9. doi: 10.1098/rspb.2005.3377
Taberlet, P., Coissac, E., Hajibabaei, M., and Rieseberg, L. H. (2012). Environmental DNA. Mol. Ecol. 21, 1789–1793. doi: 10.1111/j.1365-294X.2012.05542.x
Thébault, E., and Fontaine, C. (2010). Stability of ecological communities and the architecture of mutualistic and trophic networks. Science 329, 853–856. doi: 10.1126/science.1188321
Thompson, P. L., Guzman, L. M., De Meester, L., Horváth, Z., Ptacnik, R., Vanschoenwinkel, B., et al. (2020). A process-based metacommunity framework linking local and regional scale community ecology. Ecol. Lett. 23, 1314–1329. doi: 10.1111/ele.13568
Thompson, R. M., Brose, U., Dunne, J. A., Hall, R. O. Jr, Hladyz, S., Kitching, R. L., et al. (2012). Food webs: reconciling the structure and function of biodiversity. Trends Ecol. Evol. 27, 689–697. doi: 10.1016/j.tree.2012.08.005
Tonkin, J. D., Altermatt, F., Finn, D. S., Heino, J., Olden, J. D., Pauls, S. U., et al. (2018). The role of dispersal in river network metacommunities: patterns, processes, and pathways. Freshw. Biol. 63, 141–163. doi: 10.1111/fwb.13037
Tylianakis, J. M., and Morris, R. J. (2017). Ecological networks across environmental gradients. Annu. Rev. Ecol. Evol. Syst. 48, 25–48. doi: 10.1146/annurev-ecolsys-110316-022821
Vannote, R. L., Minshall, G. W., Cummins, K. W., Sedell, J. R., and Cushing, C. E. (1980). The river continuum concept. Can. J. Fish. Aquat. Sci. 37, 130–137. doi: 10.1139/f80-017
Ward, J. (1998). Riverine landscapes: biodiversity patterns, disturbance regimes, and aquatic conservation. Biol. Conserv. 83, 269–278. doi: 10.1016/S0006-3207(97)00083-9
Webster, J., and Meyer, J. L. (1997). Stream organic matter budgets: an introduction. J. N. Am. Benthol. Soc. 16, 3–13. doi: 10.2307/1468223
White, J. W., Rassweiler, A., Samhouri, J. F., Stier, A. C., and White, C. (2014). Ecologists should not use statistical significance tests to interpret simulation model results. Oikos 123, 385–388. doi: 10.1111/j.1600-0706.2013.01073.x
Williams, R. J., and Martinez, N. D. (2000). Simple rules yield complex food webs. Nature 404, 180–183. doi: 10.1038/35004572
Keywords: stream network, freshwater food web, stream nutrient, niche model, meta-ecosystem, meta-food web, generalized Lotka-Volterra, Optimal Channel Network
Citation: Ho H-C, Altermatt F and Carraro L (2023) Coupled biological and hydrological processes shape spatial food-web structures in riverine metacommunities. Front. Ecol. Evol. 11:1147834. doi: 10.3389/fevo.2023.1147834
Received: 19 January 2023; Accepted: 16 May 2023;
Published: 02 June 2023.
Edited by:
Christopher Swan, University of Maryland, Baltimore County, United StatesReviewed by:
Adam Canning, James Cook University, AustraliaKurt Anderson, University of California, Riverside, United States
Copyright © 2023 Ho, Altermatt and Carraro. This is an open-access article distributed under the terms of the Creative Commons Attribution License (CC BY). The use, distribution or reproduction in other forums is permitted, provided the original author(s) and the copyright owner(s) are credited and that the original publication in this journal is cited, in accordance with accepted academic practice. No use, distribution or reproduction is permitted which does not comply with these terms.
*Correspondence: Luca Carraro, luca.carraro@eawag.ch
†These authors have contributed equally to this work
‡ORCID: Hsi-Cheng Ho orcid.org/0000-0002-0734-0249
Florian Altermatt orcid.org/0000-0002-4831-6958
Luca Carraro orcid.org/0000-0002-3933-1144