Ecological vulnerability assessment of coral islands and reefs in the South China Sea based on remote sensing and reanalysis data
 Yuan Ma1,2
  Changbo Jiang1,2*
  Shanshan Li1,2
  Yizhuang Liu1,2
  Xiaofeng Wen1,2 Yuannan Long1,2 Shuai Yuan1,2
  Yuantai Kang1,2 Yongjie Wang1,2 Ruixuan Wu1,2
- 1School of Hydraulic Engineering, Changsha University of Science & Technology, Changsha, China
- 2Key Laboratory of Dongting Lake Aquatic Eco-Environmental Control and Restoration of Hunan Province, Changsha, China
Coral reefs are ecosystems that are highly vulnerable to external environmental impacts, including changes associated with ocean acidification and global warming. Assessing the vulnerability of coral reef growth environments over large areas of the sea is a difficult and complex process, as it is influenced by many variables. There are few studies on environmental vulnerability assessment of coral islands and reefs in the South China Sea. It is therefore particularly important to understand the environmental sensitivity of corals and how coral communities respond to changes in climate-related environmental variables. In this study, indicators were selected mainly from natural environmental factors that hinder the development of coral reefs. The sea surface temperature (SST), sea surface salinity (SSS), wind velocity (WV) and direction, sea level height (SL), ocean currents (OC), and chlorophyll concentration (Chl) of coral reefs in South China Sea Island were integrated to calculate the coral reef environmental vulnerability region. In a GIS environment, Spatial Principal Component Analysis (SPCA) was used to develop sensitivity models and evaluate the ecological vulnerability of coral reefs. Based on the Environmental vulnerability indicator (EVI) values, the study area was classified as 5 grades of ecological vulnerability: Potential (0.000–0.577), Light (0.577–0.780), Medium (0.780–0.886), Heavy (0.886–0.993) and Very Heavy (0.993–1.131). Sensitivity models identified regional gradients of environmental stress and found that some coral reefs in western Malaysia and southwestern Philippines have higher vulnerability. Meanwhile, the study found that the reefs of Paracel Islands and Macclesfield Bank areas of medium vulnerability. Future use of high-precision data from long time series will allow better estimates of site-specific vulnerability and allow for the precise establishment of marine protected areas so that the ecological diversity of coral reefs can be sustained.
1 Introduction
The South China Sea (SCS), with its complex seafloor topography, has both multi-level flat land slope terraces and majestic submarine plateaus, with dramatic changes in water depth around coral reefs (Jiang et al., 2021).The ecological environment of coral reefs in the South China Sea region is also highly complex, as the development of reef-building corals depends mainly on external environmental conditions (e.g., temperature, salinity, light, chlorophyll concentration), resulting in coral reef ecology being vulnerable to damage or even extinction due to changes in external environmental factors (Liu et al., 2003; Hu et al., 2022). In particular, global changes have caused an increase in seawater surface temperature, ocean acidification, sea level rise and enhanced typhoon activity, which directly or indirectly cause different degrees of damage to coral reefs and threaten the global coral reef ecosystem (Barkley et al., 2015; Cotovicz et al., 2020). In recent years, in the context of increased frequency and diversity of human impacts on coral reefs (e.g., artificial island creation, tourism, fisheries) (Barnes & Hu, 2016; Yin et al., 2019), a large proportion of reefs in the South China Sea are under severe degradation due to both natural environment and human activities (Yu, 2012).
A scholarly survey found that stony coral cover in Daya Bay has declined from 76.6% to 15.3%, with a degradation of 80% (Chen et al., 2009); Sanya Luhuitou shore reef declined from 80% to 90% in 1960 to 12% in 2009 (Zhao et al., 2012); In July 2008, a survey of stony coral cover was carried out on the reef slope of Yongxing Island(Woody Island), and it was found that the corals along the reef slope in the eastern section were significantly reduced (Shi et al., 2011). Live coral cover was 0.40% in Panshi Yu (IQR: 7.74–0.27%) and 38.20% in Bei Jiao, (IQR: 43.00–35.90%) (Xiao et al., 2022). The decline of coral reefs is detrimental to the sustainable development of coral reef resources, while at the same time weakening their function of maintaining shoreline stability, which can lead to severe coastal erosion (Zhao et al., 2019). There are differences in the bleaching sensitivity and adaptability of different coral forms to global warming and local anthropogenic disturbance pressures, and relatively high latitudes are recognized as potential refugia for corals in the face of continued global warming (Qin et al., 2019). Since the early 1980s, primarily due to climate-induced ocean warming, the most severe events often accompany ocean–atmosphere coupling phenomena such as the El Niño-Southern Oscillation (ENSO)(Baker et al., 2008). In recent years, record-breaking temperatures have placed significant stress on coral reefs. The strong El Niño event from 2014 to 2017 exacerbated the overall warming trend, resulting in coral reefs worldwide experiencing the longest recorded bleaching event, severely affecting global coral reefs (Cerutti et al., 2020). As many coral reefs around the world are quite remote, satellite temperature data have been used to quantify global coral reef warming trends, spatial changes, and heat stress events. It has been found that 97% of over 60,000 global coral reef pixels showed a positive sea temperature trend during the study period, with 60% warming significantly (Heron et al., 2016). As one of the ecosystems most sensitive to climate change, coral reefs are in a symbiotic relationship with a tiny alga known as zooxanthellae. The photosynthesis of zooxanthellae provides up to 90% of the energy for coral reefs. During El Niño events, the interaction between the atmosphere and ocean within the climate system leads to an influx of warmer water. At the same time, global atmospheric circulation patterns change, causing a rise in the temperature of the tropical Pacific, which indirectly affects the sea surface temperature of the South China Sea. Changes in environmental pressure can disrupt this symbiotic relationship (Donner et al., 2010; Yu, 2012).
Modeling of coral reef ecological processes is a more complex study in which there is uncertainty in the choice of environmental factors and the subjective judgments inherent in the observer(Bosserman & Ragade, 1982). Several studies have attempted to use global climate models to assess natural climate change and anthropogenic forcing to simulate bleaching events (Donner et al., 2007). In the simulation process, the main source of environmental assessment data is the local government’s summary of historical information and field information from occasional visits, but it is difficult to achieve regular and high-frequency visits for coral reefs in more distant regions, so important data information is often missing in traditional coral reef environmental assessment, which limits the applicability of the model (Duan et al., 2016; Kordi & O’Leary, 2016). The use of valid and stable data for comprehensive environmental assessment of remote islands and reefs is a critical step, and at the same time, it is a serious challenge, especially in the selection and applicability of environmental factors (Yang & Chen, 2015). In the past decades, effective assessments of ecological environments have often been linked to global change and disaster mitigation issues. Vulnerability assessment mechanisms vary from region to region due to regional environmental differences (Shao et al., 2015). Therefore, it is difficult to develop an evaluation system with wide adaptability (Zou & Yoshino, 2017).
In past research, many methods have been developed for studies of this kind, such as the Comprehensive Evaluation Method (Li et al., 2005), the Indicator Weight Method (IWM) (Diakoulaki et al., 1995), and the Analytic Hierarchy Process (AHP) (Li et al., 2006). However, these methods rely on expert evaluations to measure the importance of factors, and the level of expertise directly influences the final assessment results. To provide objective results for the evaluation of ecological vulnerability and reduce human interference, it is essential to seek alternative methods. In this study, using SCS as the study area, remote sensing data and reanalysis data are selected as the basic data for environmental vulnerability calculation and used to solve the problem of data scarcity. The Spatial Principal Component Analysis (SPCA) method was used to establish a coral reef vulnerability distribution map for effective evaluation of the environmental vulnerability of SCS coral reefs. The regional gradient of environmental pressure is determined according to the model, and the comprehensive evaluation results of the static evaluation of ecological and environmental vulnerability are selected for spatial superposition to obtain the changes and distribution of each ecological vulnerability level, to analyze the development trend of regional ecological vulnerability and its spatial characteristics. The results of this study provide a scientific foundation for relevant departments when making decisions related to the protection of coral reefs, aiming to promote the sustainable development and preservation of coral reefs and islands.
2 Materials and methods
2.1 Study area
The SCS region is the western part of the Pacific Ocean, connected to the Pacific Ocean through straits or waterways, from Nanao Island in Guangdong Province in the north to Kalimantan Island and Sumatra Island in the south, near the Malay Peninsula in the west and the Philippines in the east. SCS is a northeast–southwest trending semi-enclosed sea, sometimes referred to as the “Asian Mediterranean” (Morton & Blackmore, 2001). In the South China Sea, there are hundreds of coral reefs, including islands, coasts and shoals, and the main islands are Spratly Islands, Macclesfield Bank, Pratas Islands and Paracel Islands (Zhang et al., 2018). The regions of (104°~121°E) and (2°~24°N) were selected as the study region in this study (Figure 1).
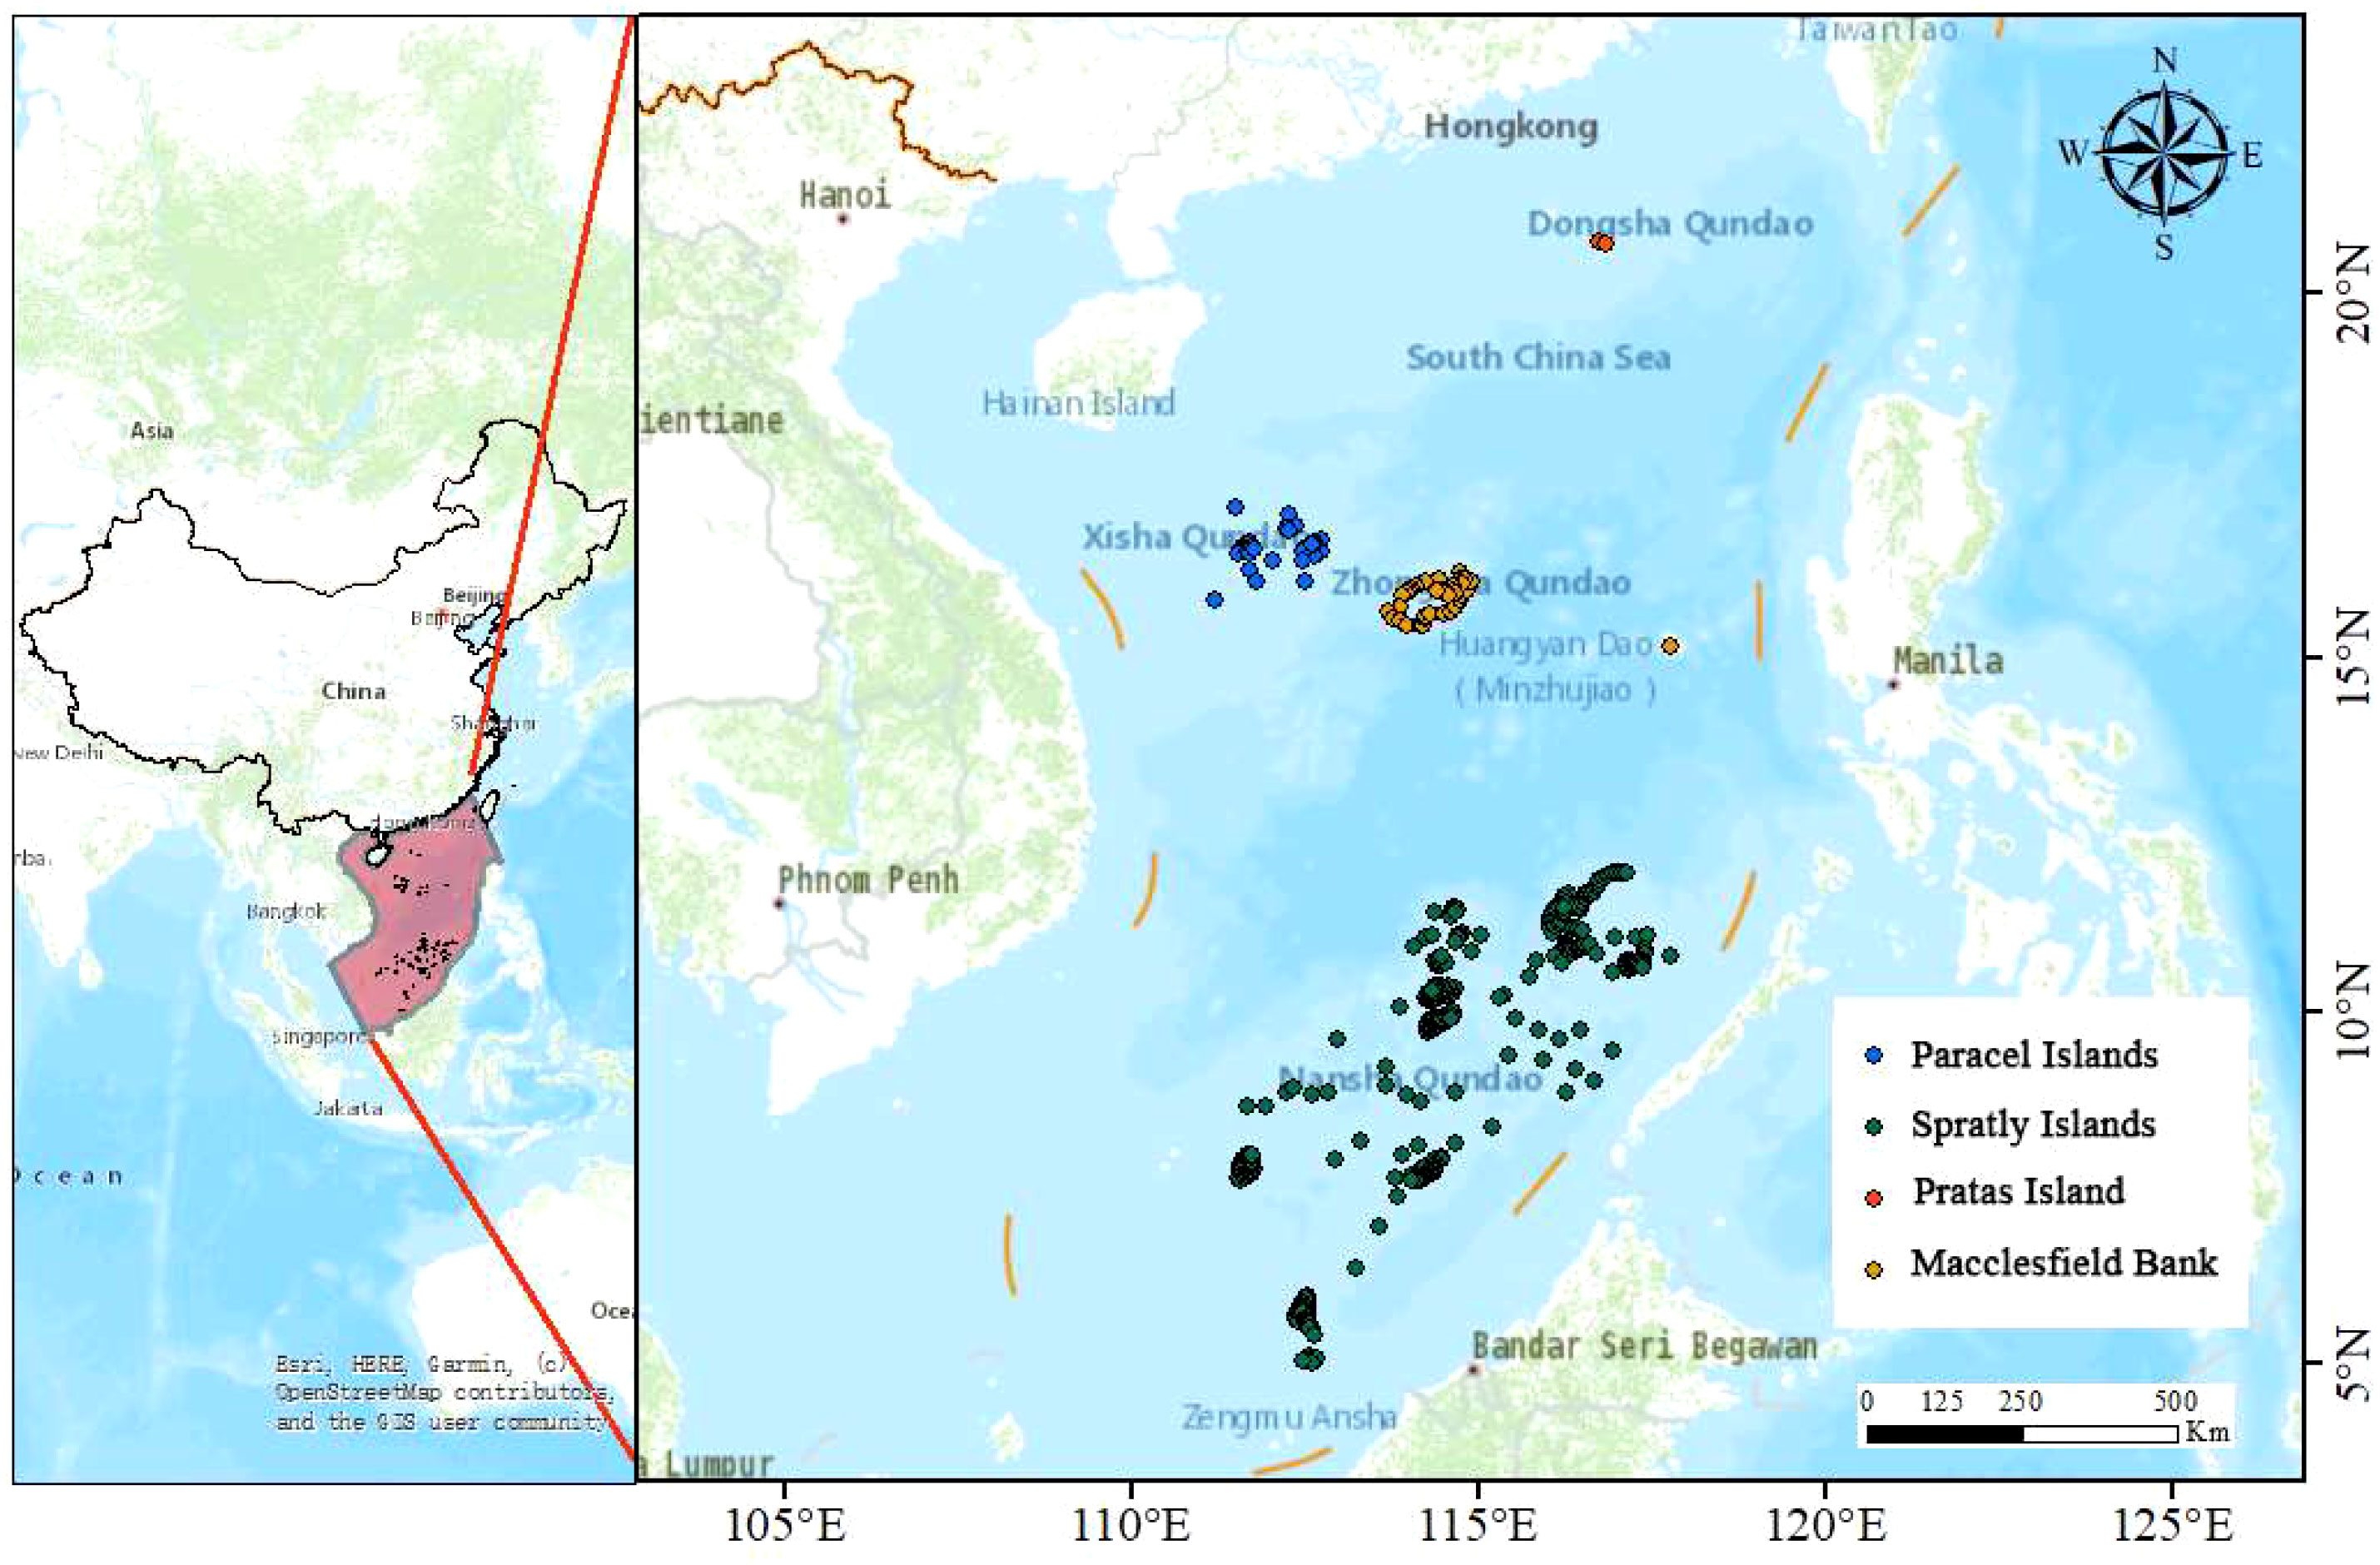
Figure 1 Map of the SCS showing coral reef locations.
2.2 Data and processing methods
Models were developed using variables known to affect coral ecosystems (Figure 2), data were retrieved from the National Science & Technology Infrastructure (NSTI) and the National Centers for Environment Information (NCEI) and pre-processed to obtain key variables (Table 1). The SPCA tool was used to determine the weights and scores of the parameters, and these maps were integrated using statistical methods to evaluate and map the ecological vulnerability of the study area using GIS 10.8 software.
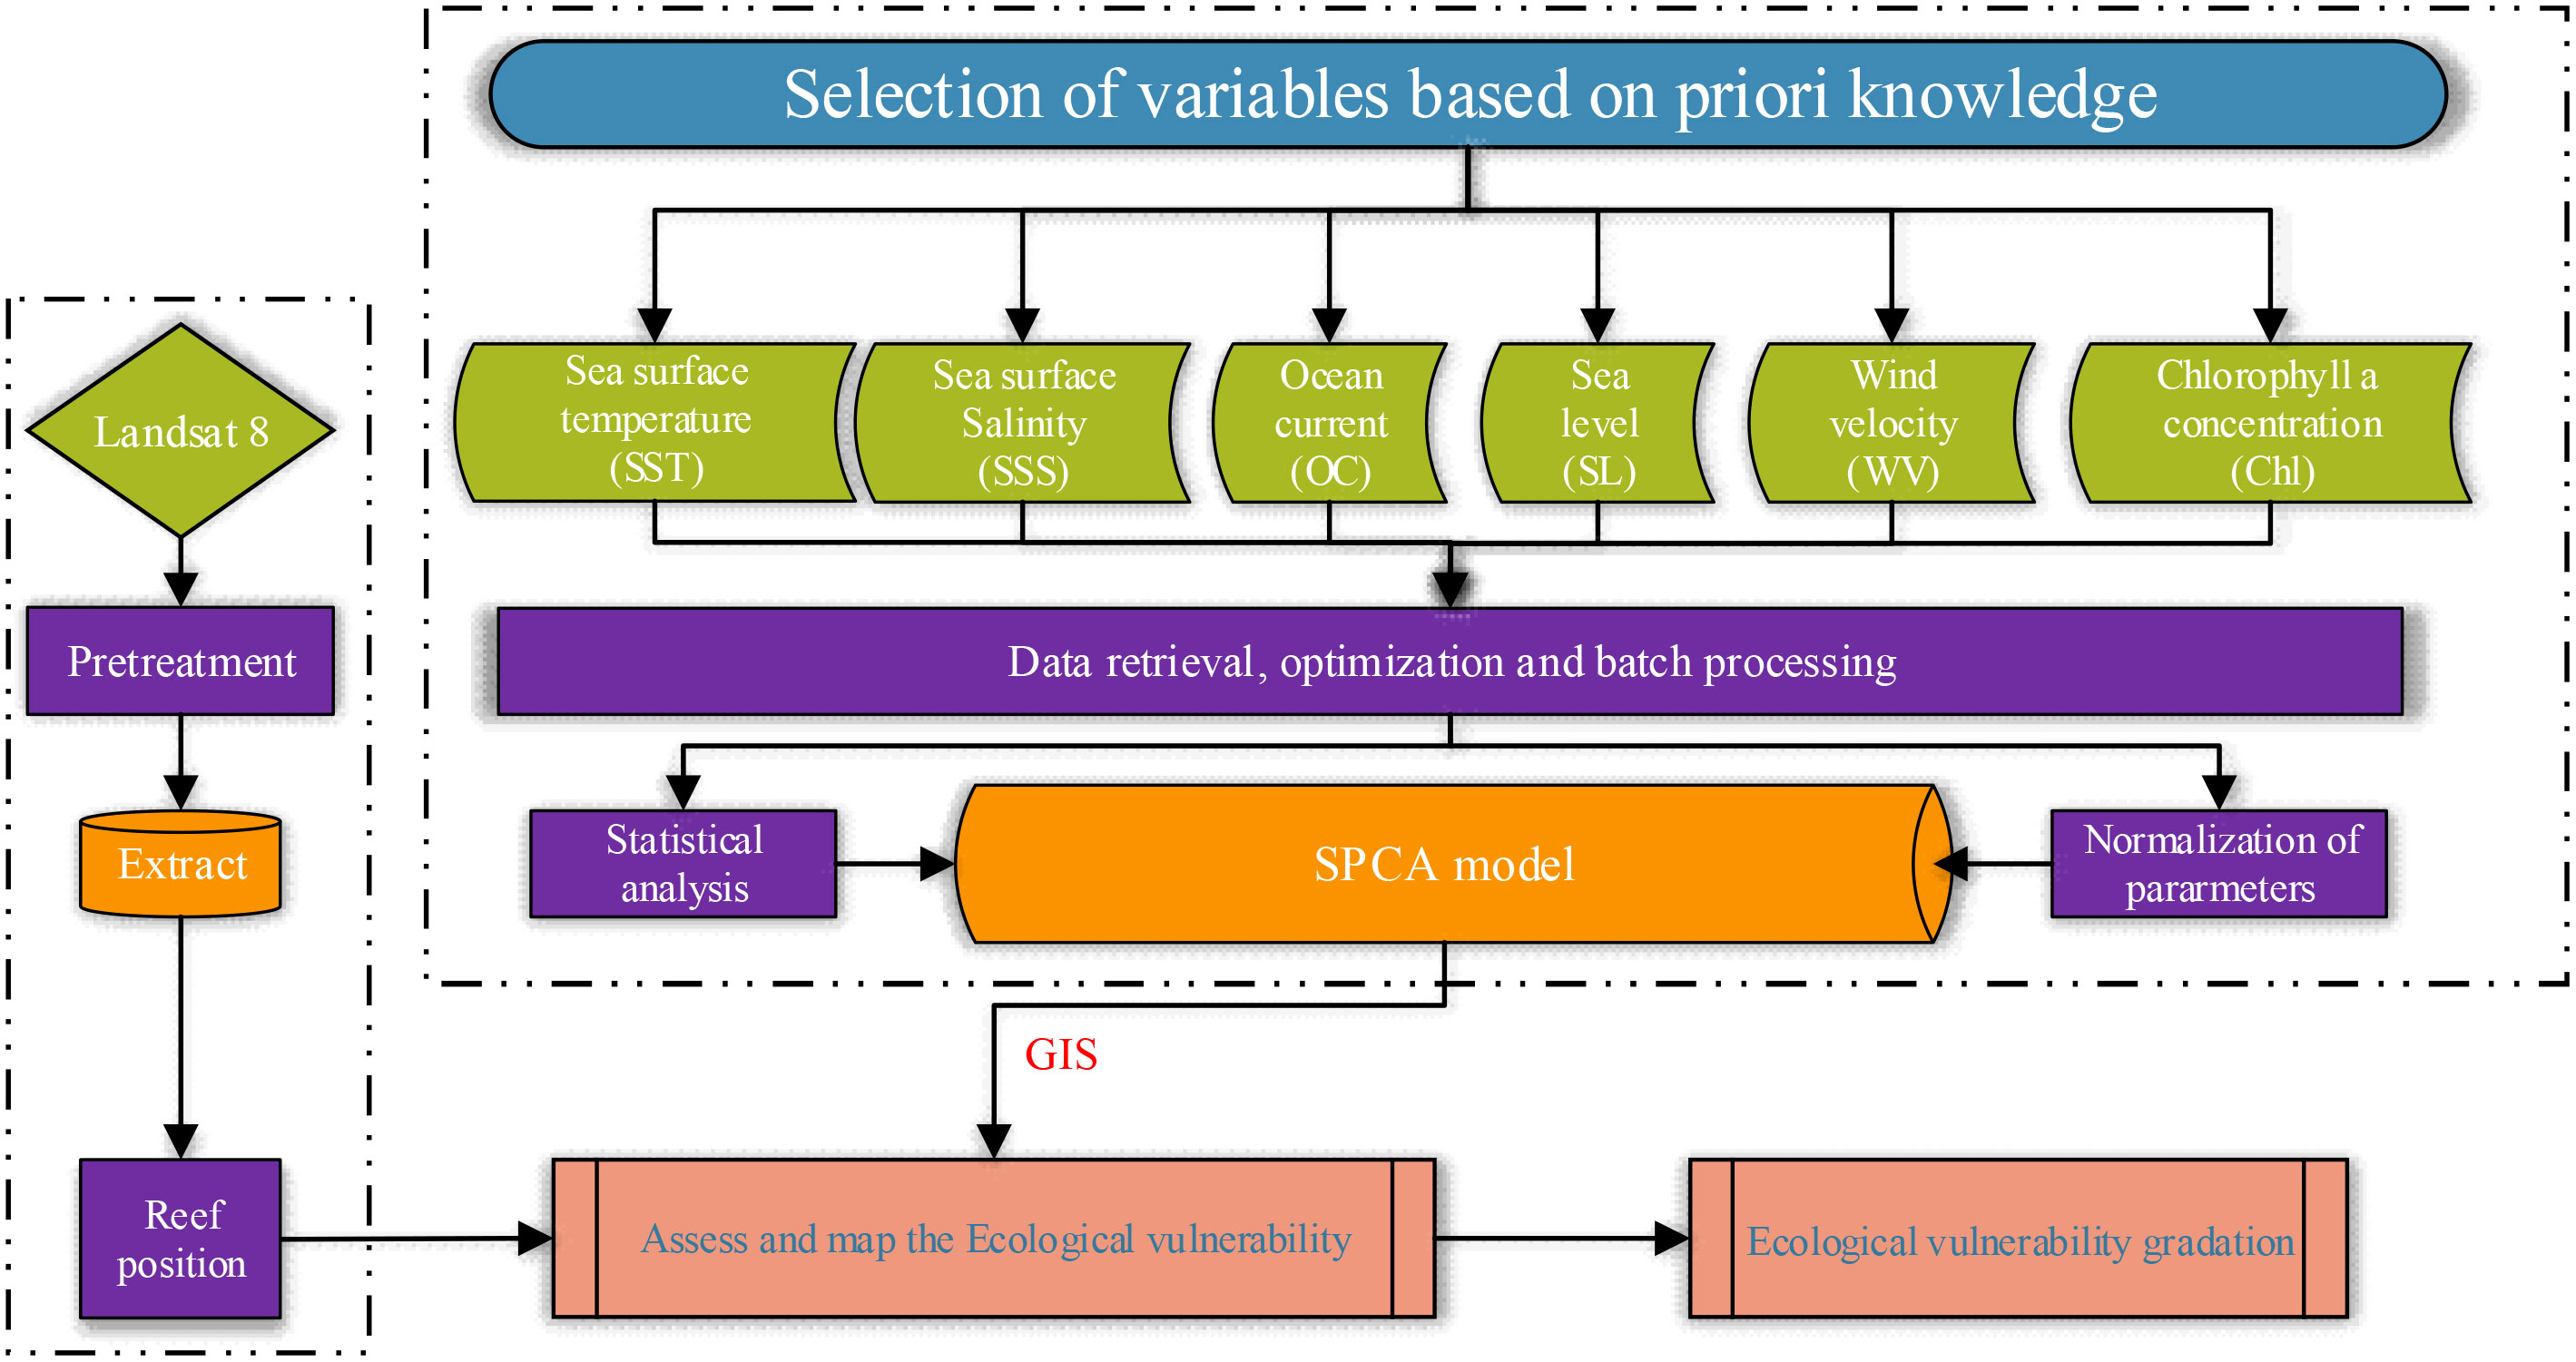
Figure 2 Conceptual framework of the susceptibility model.
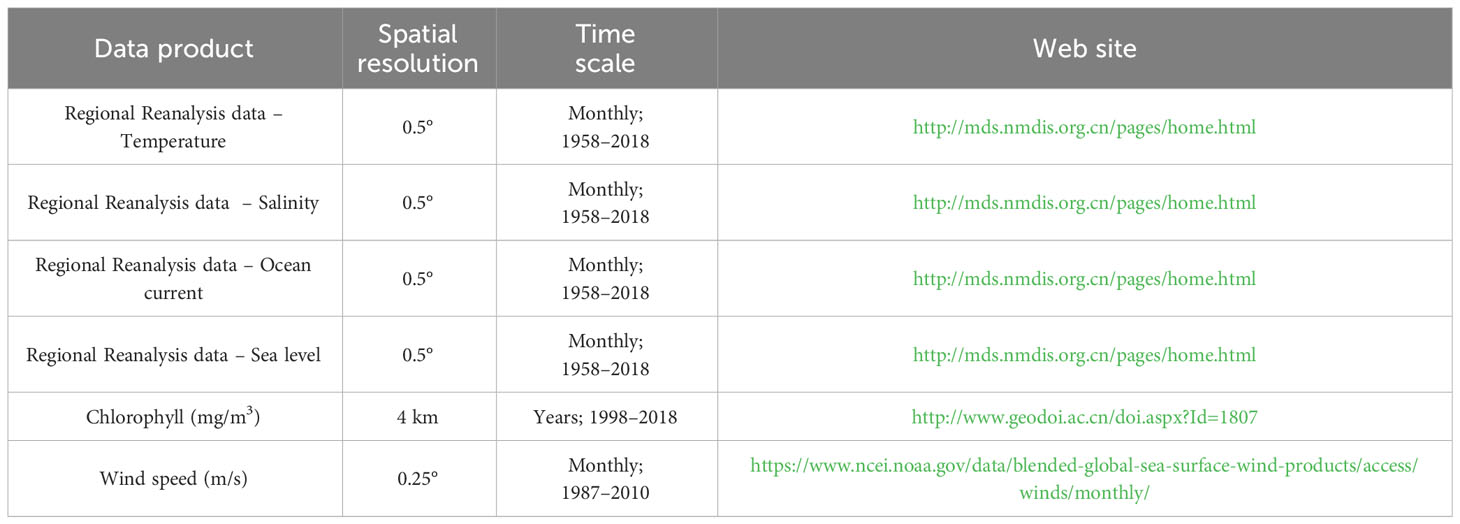
Table 1 Data format and sources used in this study.
2.3 Reef distribution data
Some of the coral reefs in the SCS area are very small and difficult to identify from low-resolution images. Therefore, Landsat 8 satellite data were used to interpret spatial features, and the data were obtained from remote sensing images from the United States Geological Survey website (www.usgs.gov). Details of the selected satellite images are shown in (Table 2).
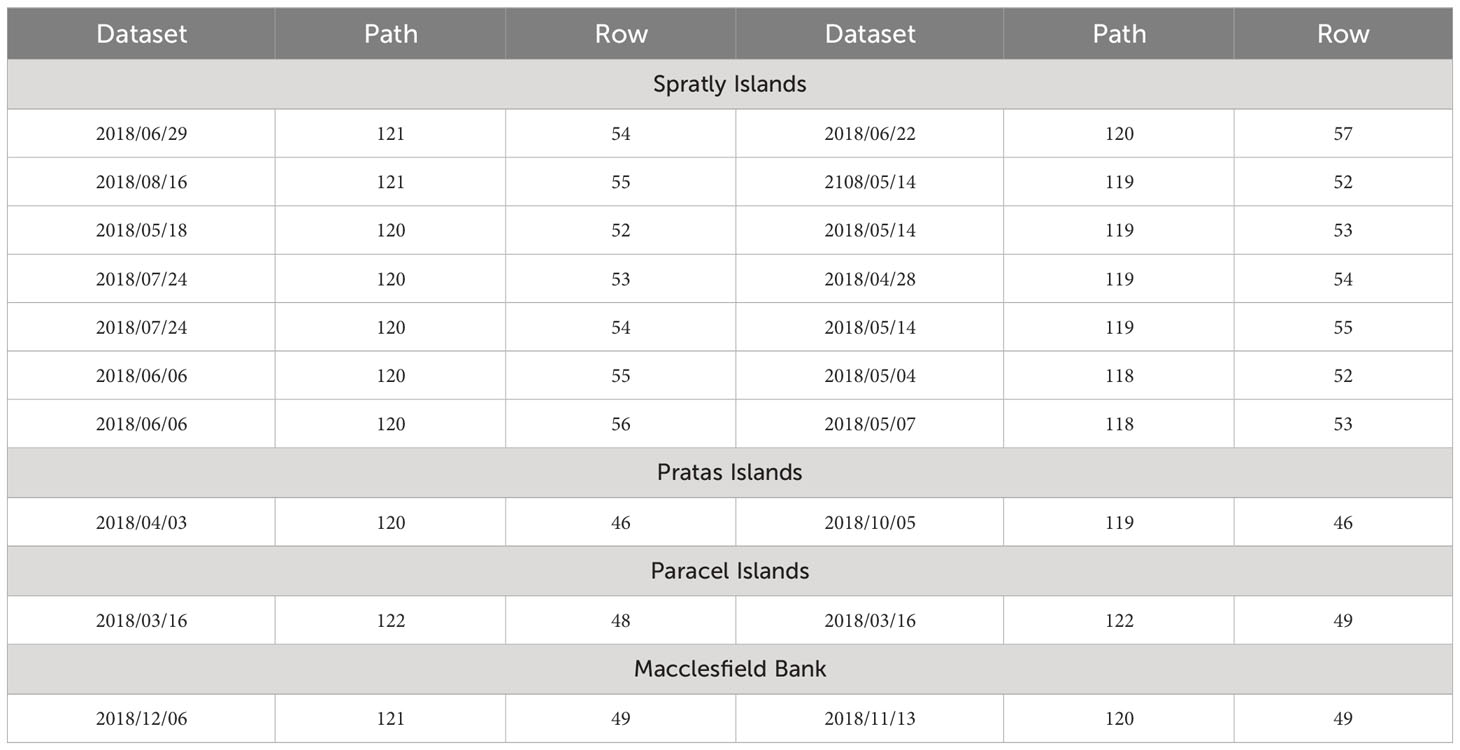
Table 2 List of remote sensing images.
The remote sensing data are pre-processed using ENVI 5.1 software, which includes processing for cloud removal, radiometric calibration, atmospheric correction, and image enhancement. The radiometric calibration of the data using the calibration tool is calculated using the calibration coefficients Gain and Bias, using the following equations.
In the formula (1~3), L is the analog signal of the sensor; Lmax is the maximum radiation brightness; Lmin is the minimum radiation brightness; DN is the brightness value of the image element, with value range 0~255. The default parameter calibration units in ENVI 5.1 software is W·m−2·sr−1·μm−1. Correction was performed using the QUick Atmospheric Correction (QUAC) tool, which approximates the radiative transfer model +/− 15% in accuracy. To improve image visualization, a 2% linear stretching tool was used to enhance the images. Lastly, supervised classification methods were employed to identify coral reefs, and moderate adjustments were made to lagoons and shallow reefs with relatively high openness, as well as to coral reefs that were difficult to distinguish.
2.4 Regional reanalysis data – temperature\ salinity\ocean current\sea level
The National Marine Science Data Center (NMDC) of China has developed a regional ocean reanalysis system for China’s offshore and adjacent seas and generated a dataset called CORA1.0(China Ocean ReAnalysis) (Chao et al., 2020), range in (99°E to 150°E, 10°S to 52°N). The elements contain sea level, sea surface temperature, sea surface salinity and ocean currents; the horizontal resolution is 0.5°×0.5°, and the vertical is 35 layers; the time range is (1958–2018); and the time resolution is the monthly average of calendar year. The selected ocean dynamics model is the Princeton Generalized Coordinate System Ocean Model (POMgcs), with a model original horizontal resolution of 1/2°~1/8°, variable grid; vertical 35 layers (Shen et al., 2014). The meteorological driving field used is the NCEP meteorological reanalysis field. The ocean data assimilation method used is the multiple grid 3D variational ocean data assimilation method. The assimilated ocean observations include in situ temperature and salt observations, satellite remote sensing sea surface height anomaly (SSHa) and sea surface temperature (Reynolds SST) information.
2.5 Chlorophyll pigment concentration
The data were based on the Chlorophyll-a concentration products retrieved from SeaWIFS, Terra-MODIS, Aqua-MODIS, MERIS and VIIRS from January 1998 to December 2018. This paper combines the wavelet transform and Kalman filtering to develop the multi-source remote sensing data fusion technology and integrates the look-up table and the maximum value composite to design the data fusion method. The algorithm completes the global sea surface chlorophyll-a concentration fusion dataset (1998–2018) at three temporal scales: monthly, seasonal and annual. The spatial resolution of the dataset is 4 km × 4 km, the data format is TIFF (Li et al., 2021).
2.6 Wind velocity
The hybrid wind dataset combines observations from multiple satellites and is used to create gridded wind speeds. The hybrid data fills the temporal and spatial data gaps that exist in each source dataset and reduces random errors. Global gridded hybrid wind data are available at a spatial resolution of 0.25° in NetCDF and IEEE formats from July 1987 to present, with six-hourly, daily, and monthly temporal resolutions.
2.7 Calculation of environmental vulnerability
2.7.1 Standardize the original value of indicators
Due to the different nature of each evaluation index, it is not possible to conduct ecological vulnerability evaluation directly. Therefore, it is necessary to standardize the evaluation indicators to eliminate the possible problems of inaccurate evaluation results caused by the non-uniformity of the indicator scale and order of magnitude. The contribution of indicators to ecological vulnerability can be divided into positive and negative indicators, where the higher the representative value of the positive indicator, the higher its ecological vulnerability, and the reverse for the negative indicator. The standardization of indicators is done by means of extreme difference standardization, using the formula (4)(5).
where Zi is the standardized value of the parameter i, Xi is the actual value of the parameter i, and Xmax, Xmin are the maximum and minimum of the parameter i respectively.
2.7.2 Determination of weights of the parameters
Spatial Principal Component Analysis (SPCA) is a statistical method that integrates traditional Principal Component Analysis (PCA) with a spatial weight matrix to account for spatial autocorrelation. Consider a dataset Y consisting of m variables and n observation samples. Each data element of Y can be represented as y_{i,j}, all i = 1,…, n and j = 1,…, m. The data matrix Y is standardized to the dataset X, ensuring the centroid of the entire dataset moves to the origin and follows a normal distribution. Each data element of X can be represented as x_{i,j}, all i = 1,…, n and j = 1,…, m. Calculate the eigenvalues and eigenvectors of matrix X, then arrange the eigenvectors in descending order based on their respective eigenvalues. These rearranged eigenvectors become the feature vectors (FV) of X, used to perform the SPCA transformation on X, forming m linear combinations of the principal components (Lee, 1998; Rajput et al., 2010). The new variables PC1(i), PC2(i),…, PCm(i) are the m transformed principal components (PCs). The calculation formulas are (6), (7), (8) and (9).
In this study, the contribution of each factor was measured by calculating the weights of each component using linear correlation coefficients in Spatial Principal Component Analysis (SPCA). The principal component analysis method is to transform the data in the multivariate attribute space to a new multivariate attribute space that rotates the axes with respect to the original space, and the axis attributes in the new space are not correlated with each other (Maina et al., 2008; Guo et al., 2019). The eigenvalues of the covariance matrix and its corresponding eigenvectors were calculated using the SPCA module on ArcGIS to derive a set of principal components (PCs) as the output. The main reason for transforming the data in the principal component analysis is the desire to compress the data by eliminating redundancy, where the first principal component will have the greatest variance, the second will show the second most variance not described by the first, and so forth (Hou et al., 2015).
2.7.3 Assessment of ecological vulnerability
When the cumulative variance contribution is greater than or equal to 85%, it is representative of the vast majority of the information of interest. The use of spatial principal component analysis does not require artificial determination of the weights of each index, which can avoid bias in the final results due to human factors. In this paper, the standardized evaluation indicators in the evaluation index system were subjected to spatial principal component analysis on ArcGIS software to calculate the ecological vulnerability evaluation index EVI. The calculation formula is (10):
where Y is the number of the principal component and α is the corresponding contribution. Using the values in Table 3.
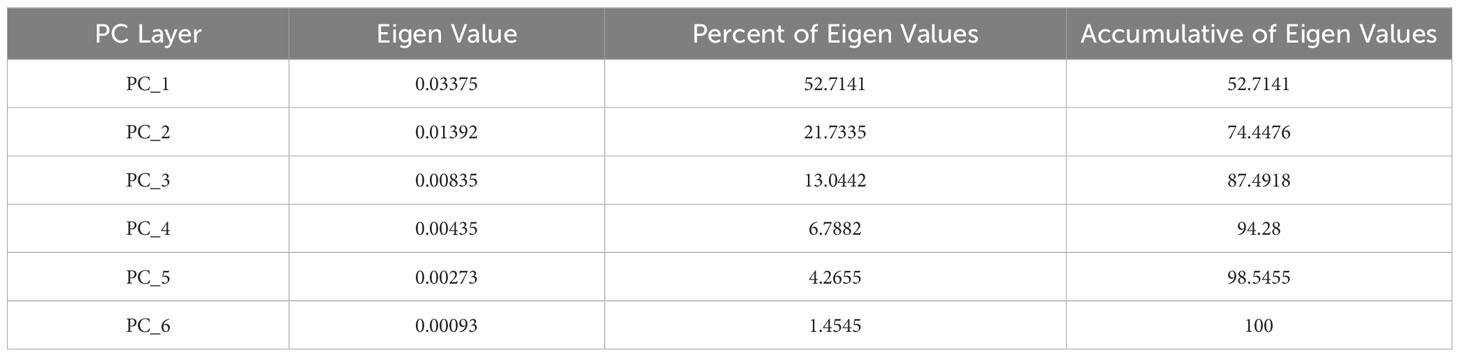
Table 3 Percent and accumulative eigenvalues.
3 Result
3.1 Distribution of environment vulnerability
The spatial distribution of the average environmental vulnerability in the SCS region is shown in Figure 3 The regions with high EVI values shown in the figure are relatively fragile environments. The overall EVI values ranged from (0.250~1.131). From the overall regional distribution, the environmental vulnerability value along the SCS northwest direction weakened, the main reason is that the more vulnerable areas are mainly distributed in the Spratly Islands, and the vulnerability value is significantly greater than other regions, heavy vulnerable areas accounted for 21.43%, very heavy areas accounted for 31.04%, and severely vulnerable areas have been more than half. The southwestern and northeastern regions of Malaysia’s western coastline have a high level of environmental vulnerability The distribution of environmental vulnerability decreases from both sides to the middle, i.e., from the northern Philippines and the Sematan Sea to the Zhenghe Group Reef area.
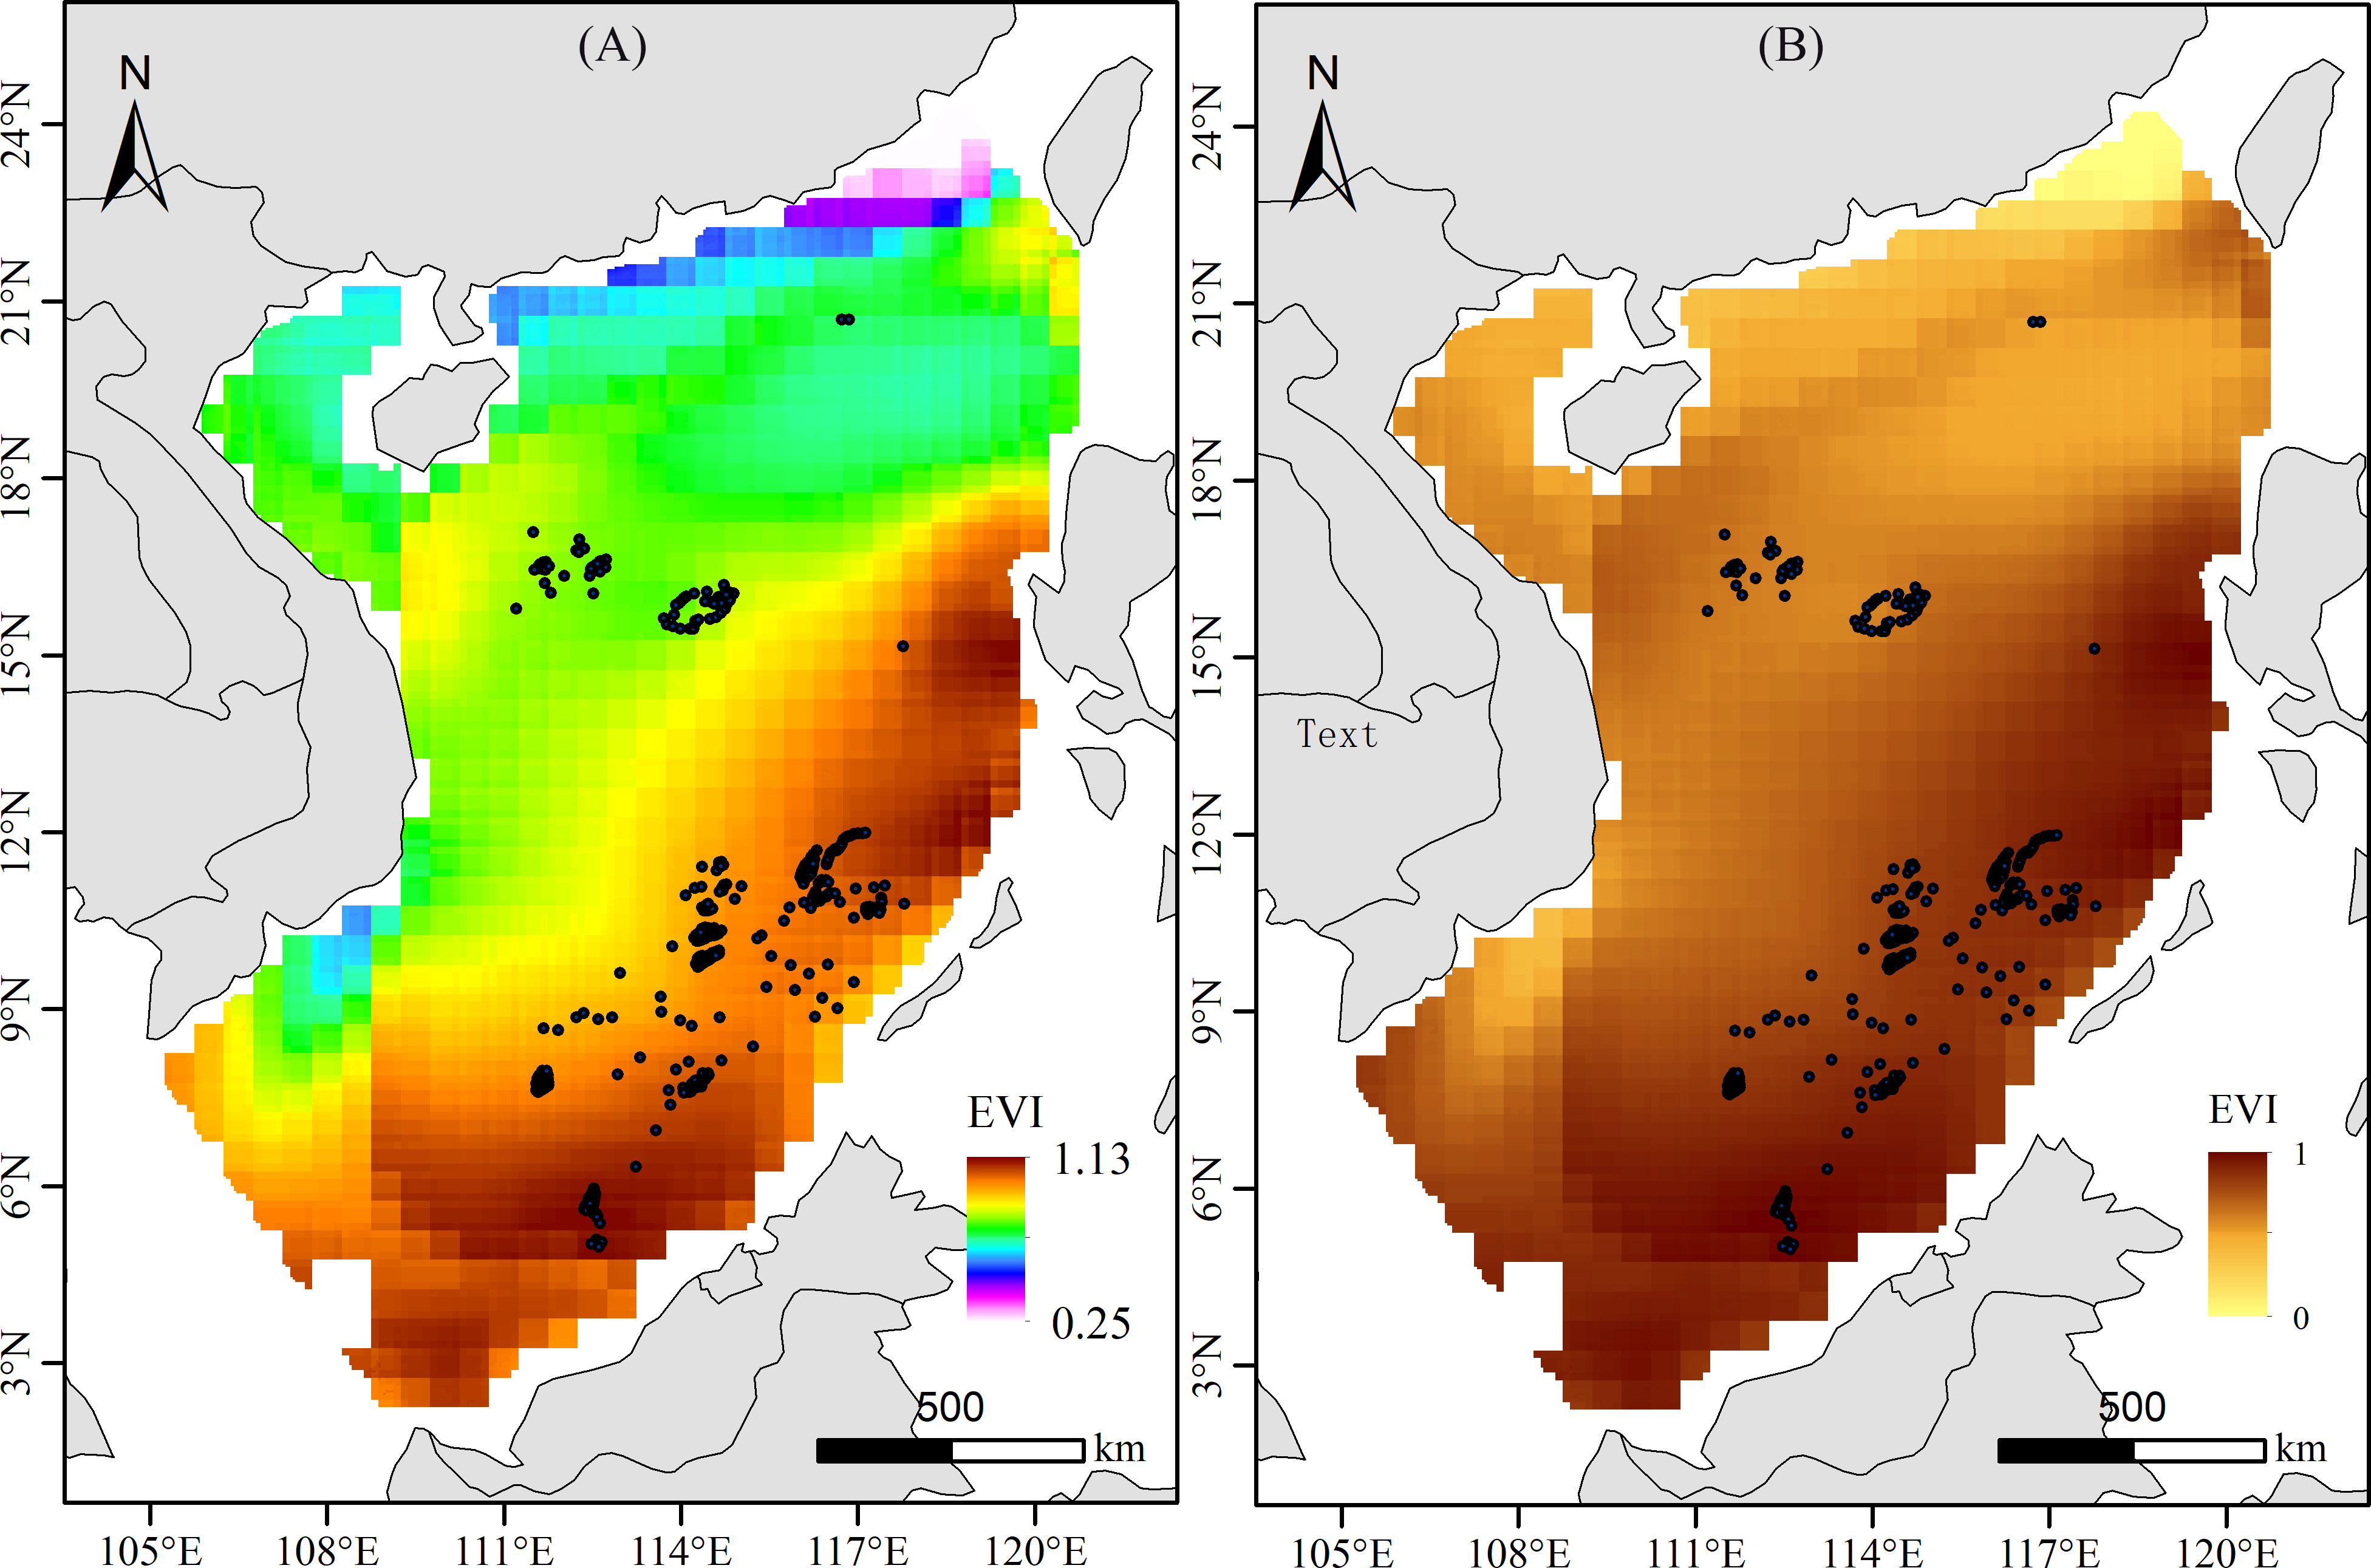
Figure 3 Spatial distribution of environmental vulnerability in SCS. (A) Spatial distribution of the EVI. (B) Distribution of the normalized data.
Statistical analysis showed that there were differences among the four regions (Figure 4), and the average environmental vulnerability was in the order of Spratly Islands, Macclesfield Bank, Paracel Islands and Pratas Islands from highest to lowest. Only the environmental vulnerability of Spratly Islands is much higher than the average level of SCS sea area. Paracel Islands and Macclesfield Bank are spatially and geographically located at the same latitude and therefore have similar environmental vulnerabilities. Since Huangyan Island is included in the statistics in the Macclesfield Bank and is far from the core area of the Macclesfield Bank and located close to the northern part of the Spratlys, the maximum value of the Macclesfield Bank is higher than the Overall average value of 0.994, when the maximum value is counted. In contrast, the Pratas Islands have the lowest environmental vulnerability value.

Figure 4 Statistics of environmental vulnerability at regional scale.
3.2 The changing trend of reef vulnerability
In the latitudinal direction, reef groups with different topography are scattered throughout the SCS sea area. Spratly Islands are widely distributed in the northwest continental shelf of Malaysia, and the number of coral reefs is much more than other regions, belonging to the low latitude region (4°0′0″–12°0′0″ N). From Figure 5, it is found that the mean value of environmental vulnerability of coral reefs in (4°0′0″–7°0′0″N) region is greater than 0.9, with significant geomorphic vulnerability, and the EVI value decreases gradually, among which the vulnerability value of Nanping Jiao (Hayes Reef) is the largest at 1.125. The environmental vulnerability values of other reefs also belonging to Spratly Islands (7°0′0″–12°0′0″N) did not decrease significantly with increasing latitude, but showed a cross-floating phenomenon, with the environmental vulnerability values fluctuating up and down between (0.943–1.058), and the average value was 1.003, among which the vulnerability value in the Yongshi Tan (Leslie Bank) was the largest at 1.058, and the vulnerability value in the Yongshu Jiao (Fiery Cross Reef) The lowest value is 0.943.
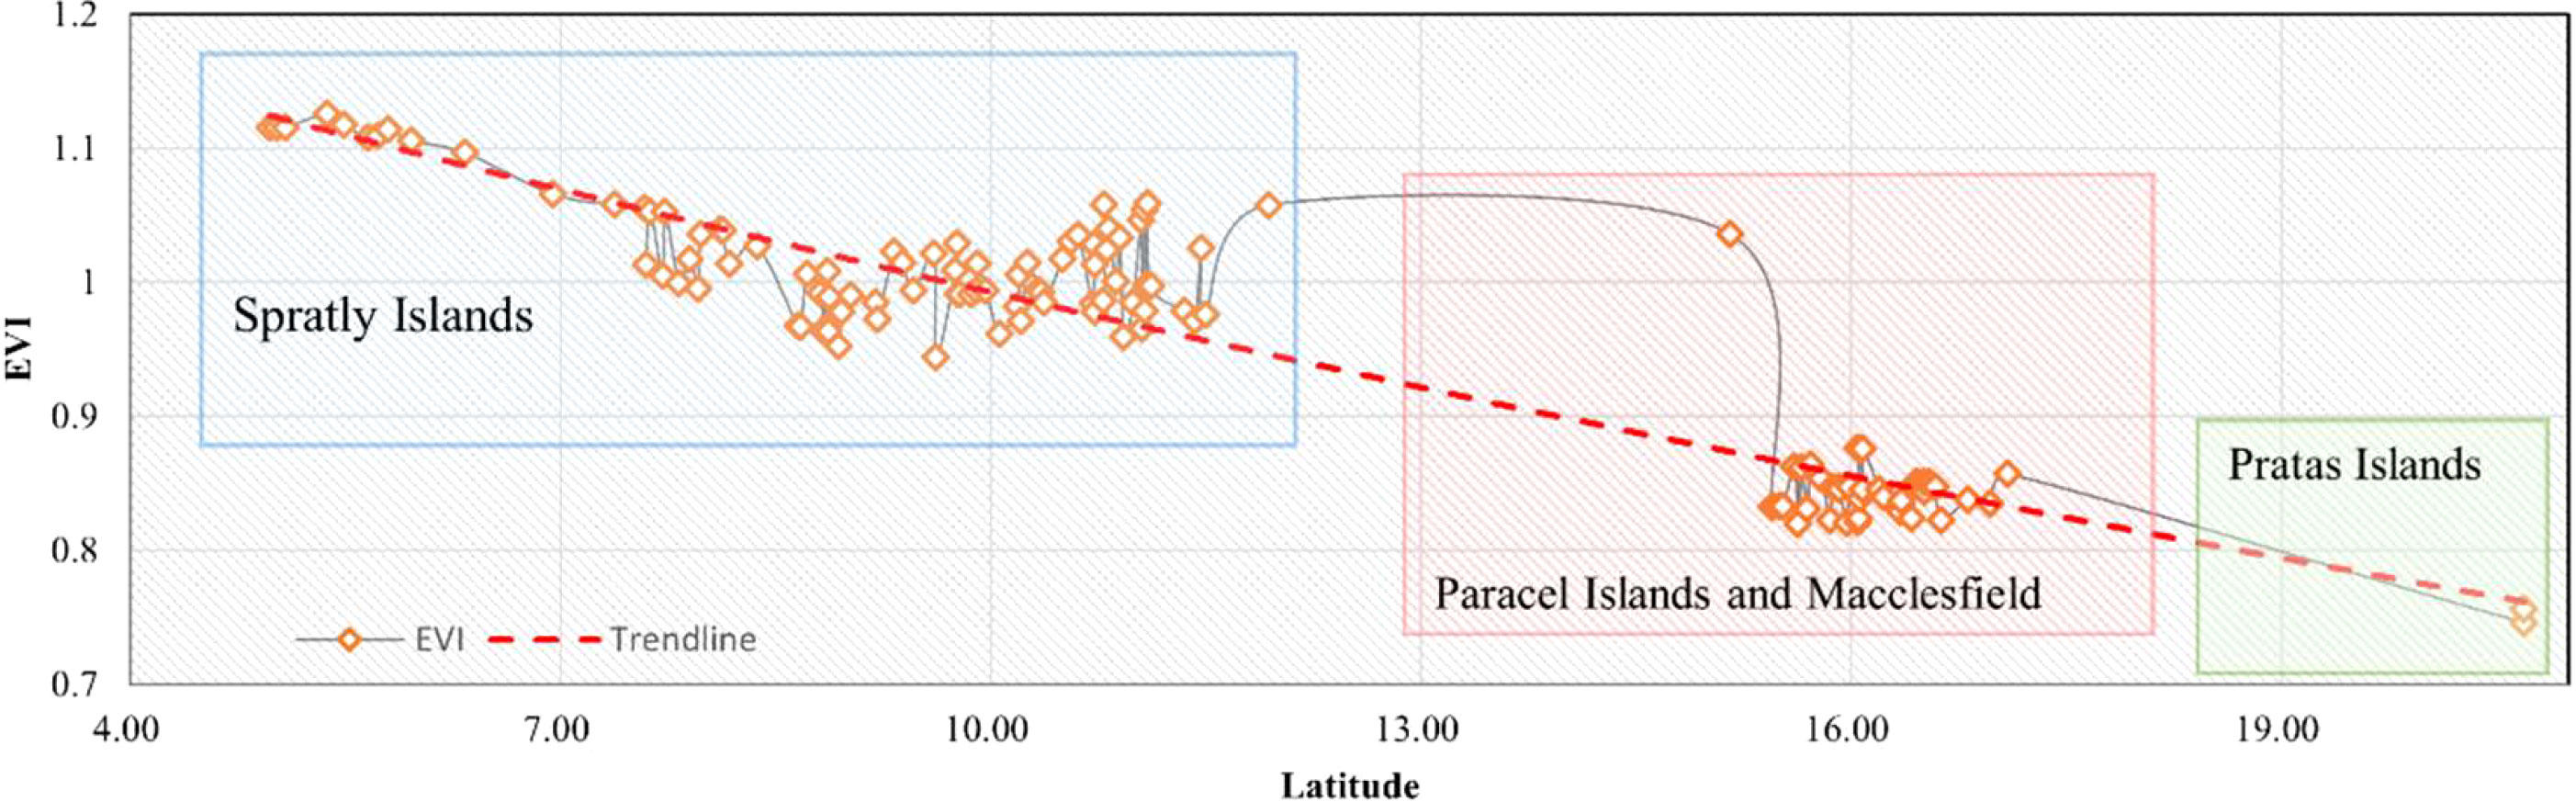
Figure 5 EVI variation in latitudinal direction.
The Paracel Islands and Macclesfield Bank are distributed in the central sea area of the South China Sea, mainly concentrated in the area of (15°0′0″–17°0′0″N), and the environmental vulnerability value of this sea area has a significant decrease, with the environmental vulnerability value of (0.819–1.035) and the average environmental vulnerability value of 0.846. The vulnerability value of Huangyan Island is the largest, with the vulnerability value of 1.035. The environmental vulnerability value of Paihong Tan (Penguin Bank) is the smallest, with the vulnerability value of 0.59. The Pratas Islands are in the northernmost part of the SCS (19°00′0″–12°00′0″ N), which has the least number of reefs, and the environmental vulnerability of both Pratas reef and island is below 0.8, with no significant vulnerability.
There is no obvious trend change in the environmental vulnerability values of coral reefs in the longitude direction. However, there are obvious regional variations in environmental vulnerability values, in which all the vulnerability values of Spratly Islands are greater than 0.9 and all other regions are less than 0.9. From the overall view (Figure 6), the number of reefs at (111°0′0″–115°0′0″ E) was the highest, and there was a significant cross-floating phenomenon of environmental vulnerability value with increasing longitude, with the environmental vulnerability value fluctuating up and down between (0.819–1.125), and the mean value was 0.943. With the continuation of longitude (115°0′0″–118°0′0″ E) the crossover phenomenon of environmental vulnerability value disappears and turns to a stable state, only in (116°18′42″–116°55′40″ E) in the Pratas Islands environmental vulnerability value is lower than the average value of 0.8.
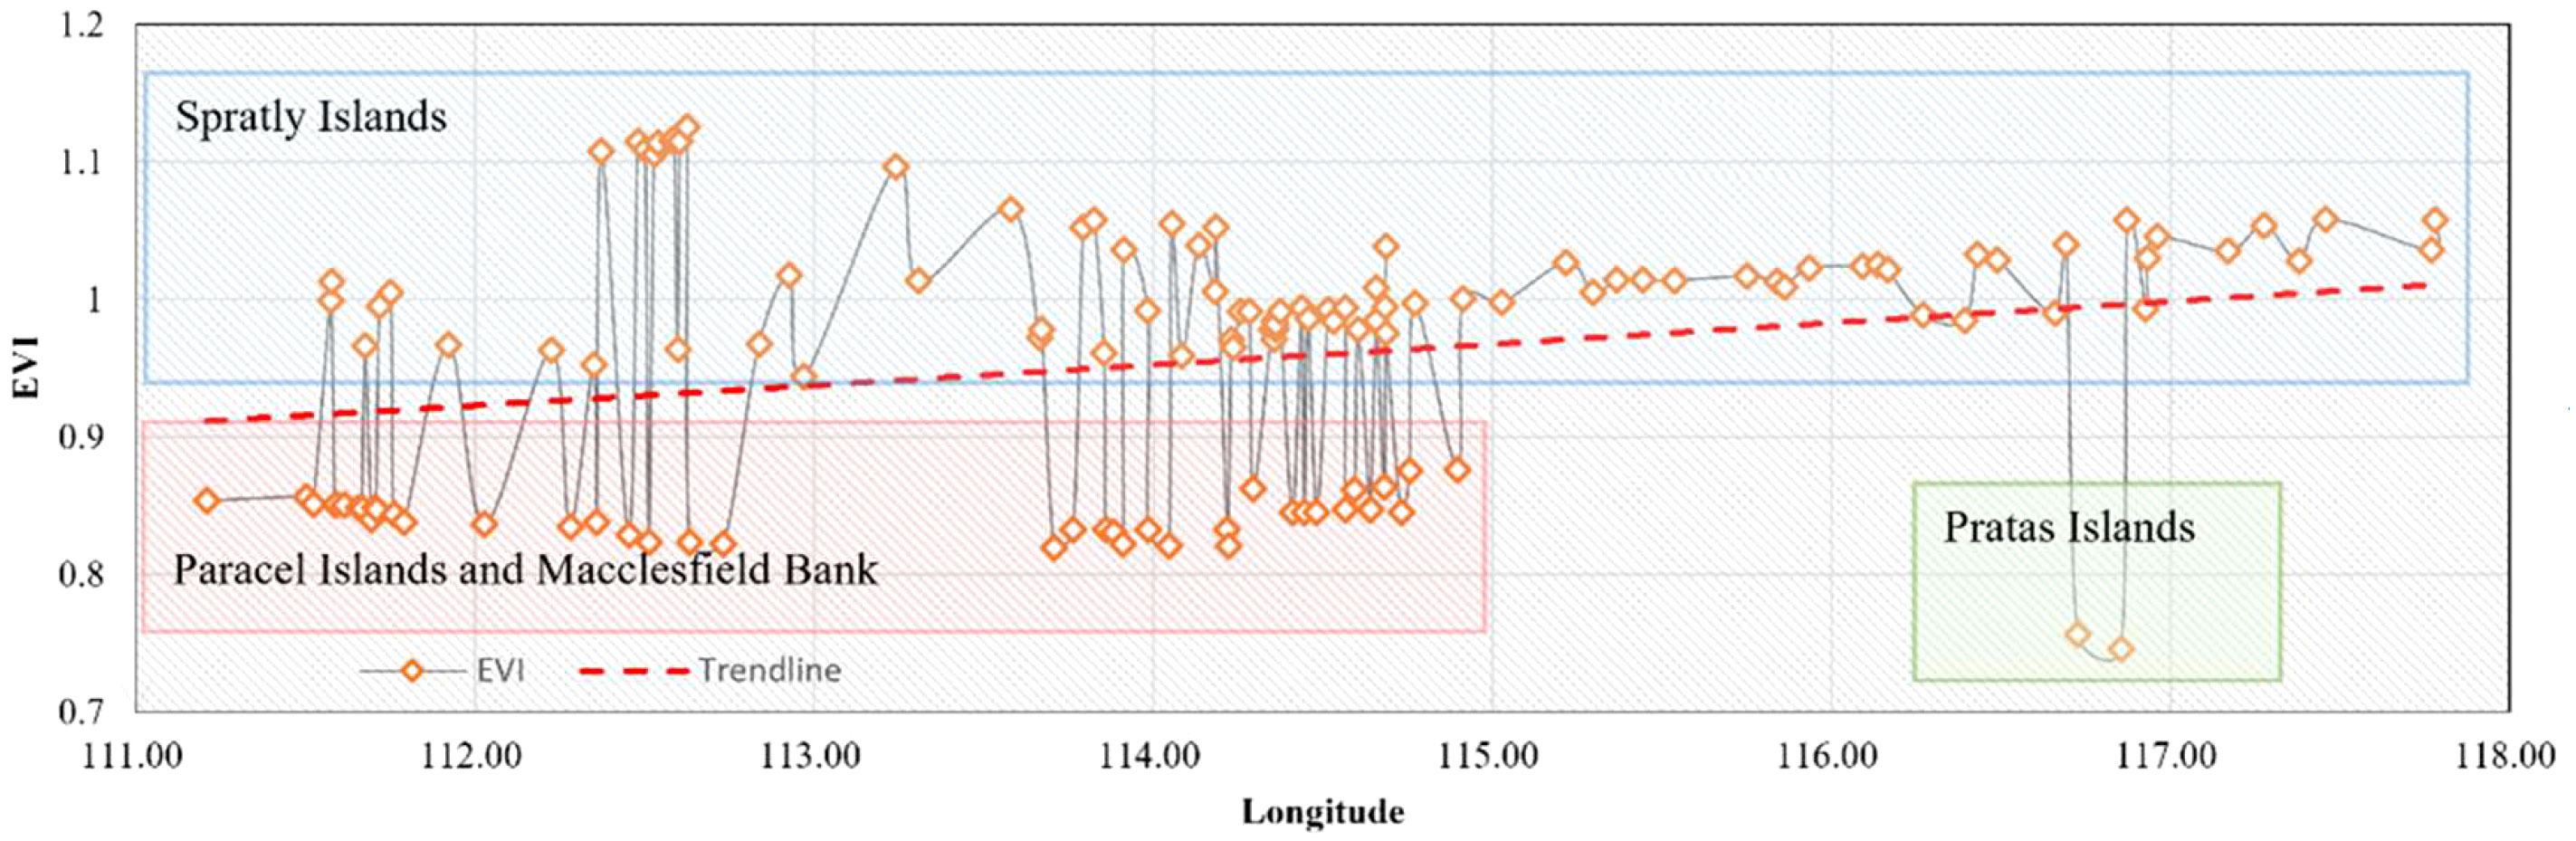
Figure 6 EVI variation in longitude direction.
The SCS is known for its northeast–southwest orientation and its semi-enclosed maritime characteristics, leading to its temperature gradient not simply distributed vertically but gradually decreasing in the southwest direction. This unique geographical feature prompts us to explore the variation in EVI values from a longitudinal perspective. Although the environmental vulnerability value of coral reefs does not show a clear trend in the longitudinal direction, the impact of the El Niño event cannot be ignored. This event can rapidly alter sea surface temperatures, especially in the eastern part of the SCS, potentially subjecting coral reefs to thermal stress, resulting in bleaching or damage. Even though the SCS is located at the westernmost part of the Pacific, its response to the El Niño event might be slightly delayed, but its impact is still significant. This is a crucial reason for our choice to analyze from a longitudinal perspective. This analytical approach allows us to better grasp the spatial impact of mixed environmental factors on the ecological vulnerability of coral reefs and reveals the specific trend of EVI on the islands in the longitudinal direction. Therefore, studying EVI longitudinally offers a macroscopic and in-depth perspective, helping us to understand more profoundly the ecological vulnerability of coral reefs in the SCS.
3.3 Environmental vulnerability gradation
There are many methods to classify environmental vulnerability, and in order to obtain the classification list objectively, the natural breakpoint method is chosen as the classification method in this paper. Because this method minimizes intra-class variation and inter-class variation, it is not subject to human factors. In ArcGIS (version 10.8), the natural breakpoint method was used to obtain a comprehensive environmental vulnerability rating. In this process, the environmental vulnerability is reclassified into five categories: Potential, Light, Medium, Heavy, and Very Heavy. The detailed classification results are shown in Table 4.
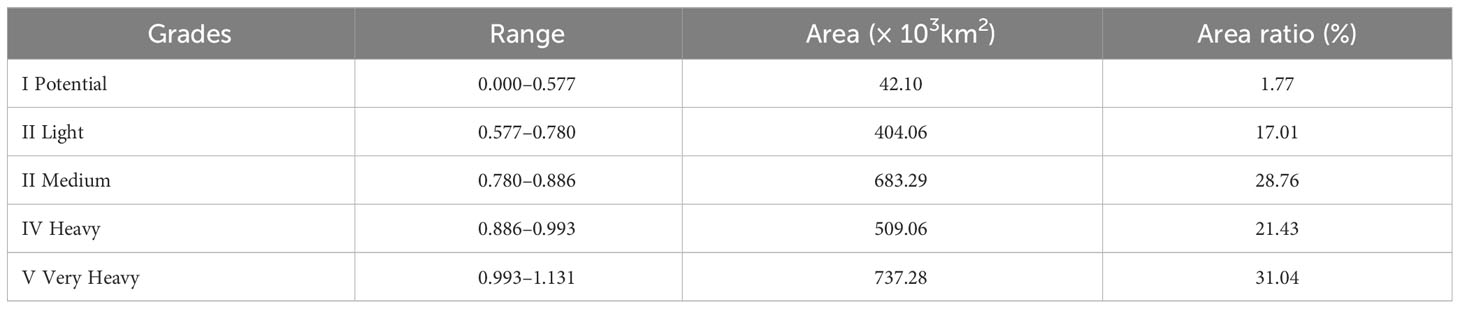
Table 4 Environmental vulnerability classification.
Different levels of vulnerability were evaluated comprehensively at the regional scale in the South China Sea, as shown in Figure 7. The sea area in the southwestern part of Taiwan Strait to the northern part of the Philippines and the eastern part of Hainan is dominated by potential vulnerability and light vulnerability, only a small part of the sea area near southern Taiwan is rated as moderate vulnerability, followed by a part of the sea area in the southeastern region of Vietnam is also classified as light vulnerability, which is much lower than the other classes, and there is no heavy vulnerability or extreme vulnerability. Most of the east coast of Vietnam is classified as moderately vulnerable, with the Paracel Islands and Macclesfield Bank scattered in moderately sensitive areas. Heavy and Very Heavy vulnerable areas are mainly distributed along the coast of Malaysia and the west coast of the Philippines. Some of the Heavy sensitive areas are distributed in the northernmost part of Malaysia and the junction of the southwestern Philippines, as well as in the southwestern part of Taiwan and the southern part of Hainan. Most of the Heavy sensitive areas are closely integrated with Very Heavy sensitive areas, and the Spratly Islands are in the sea area with more serious vulnerability.
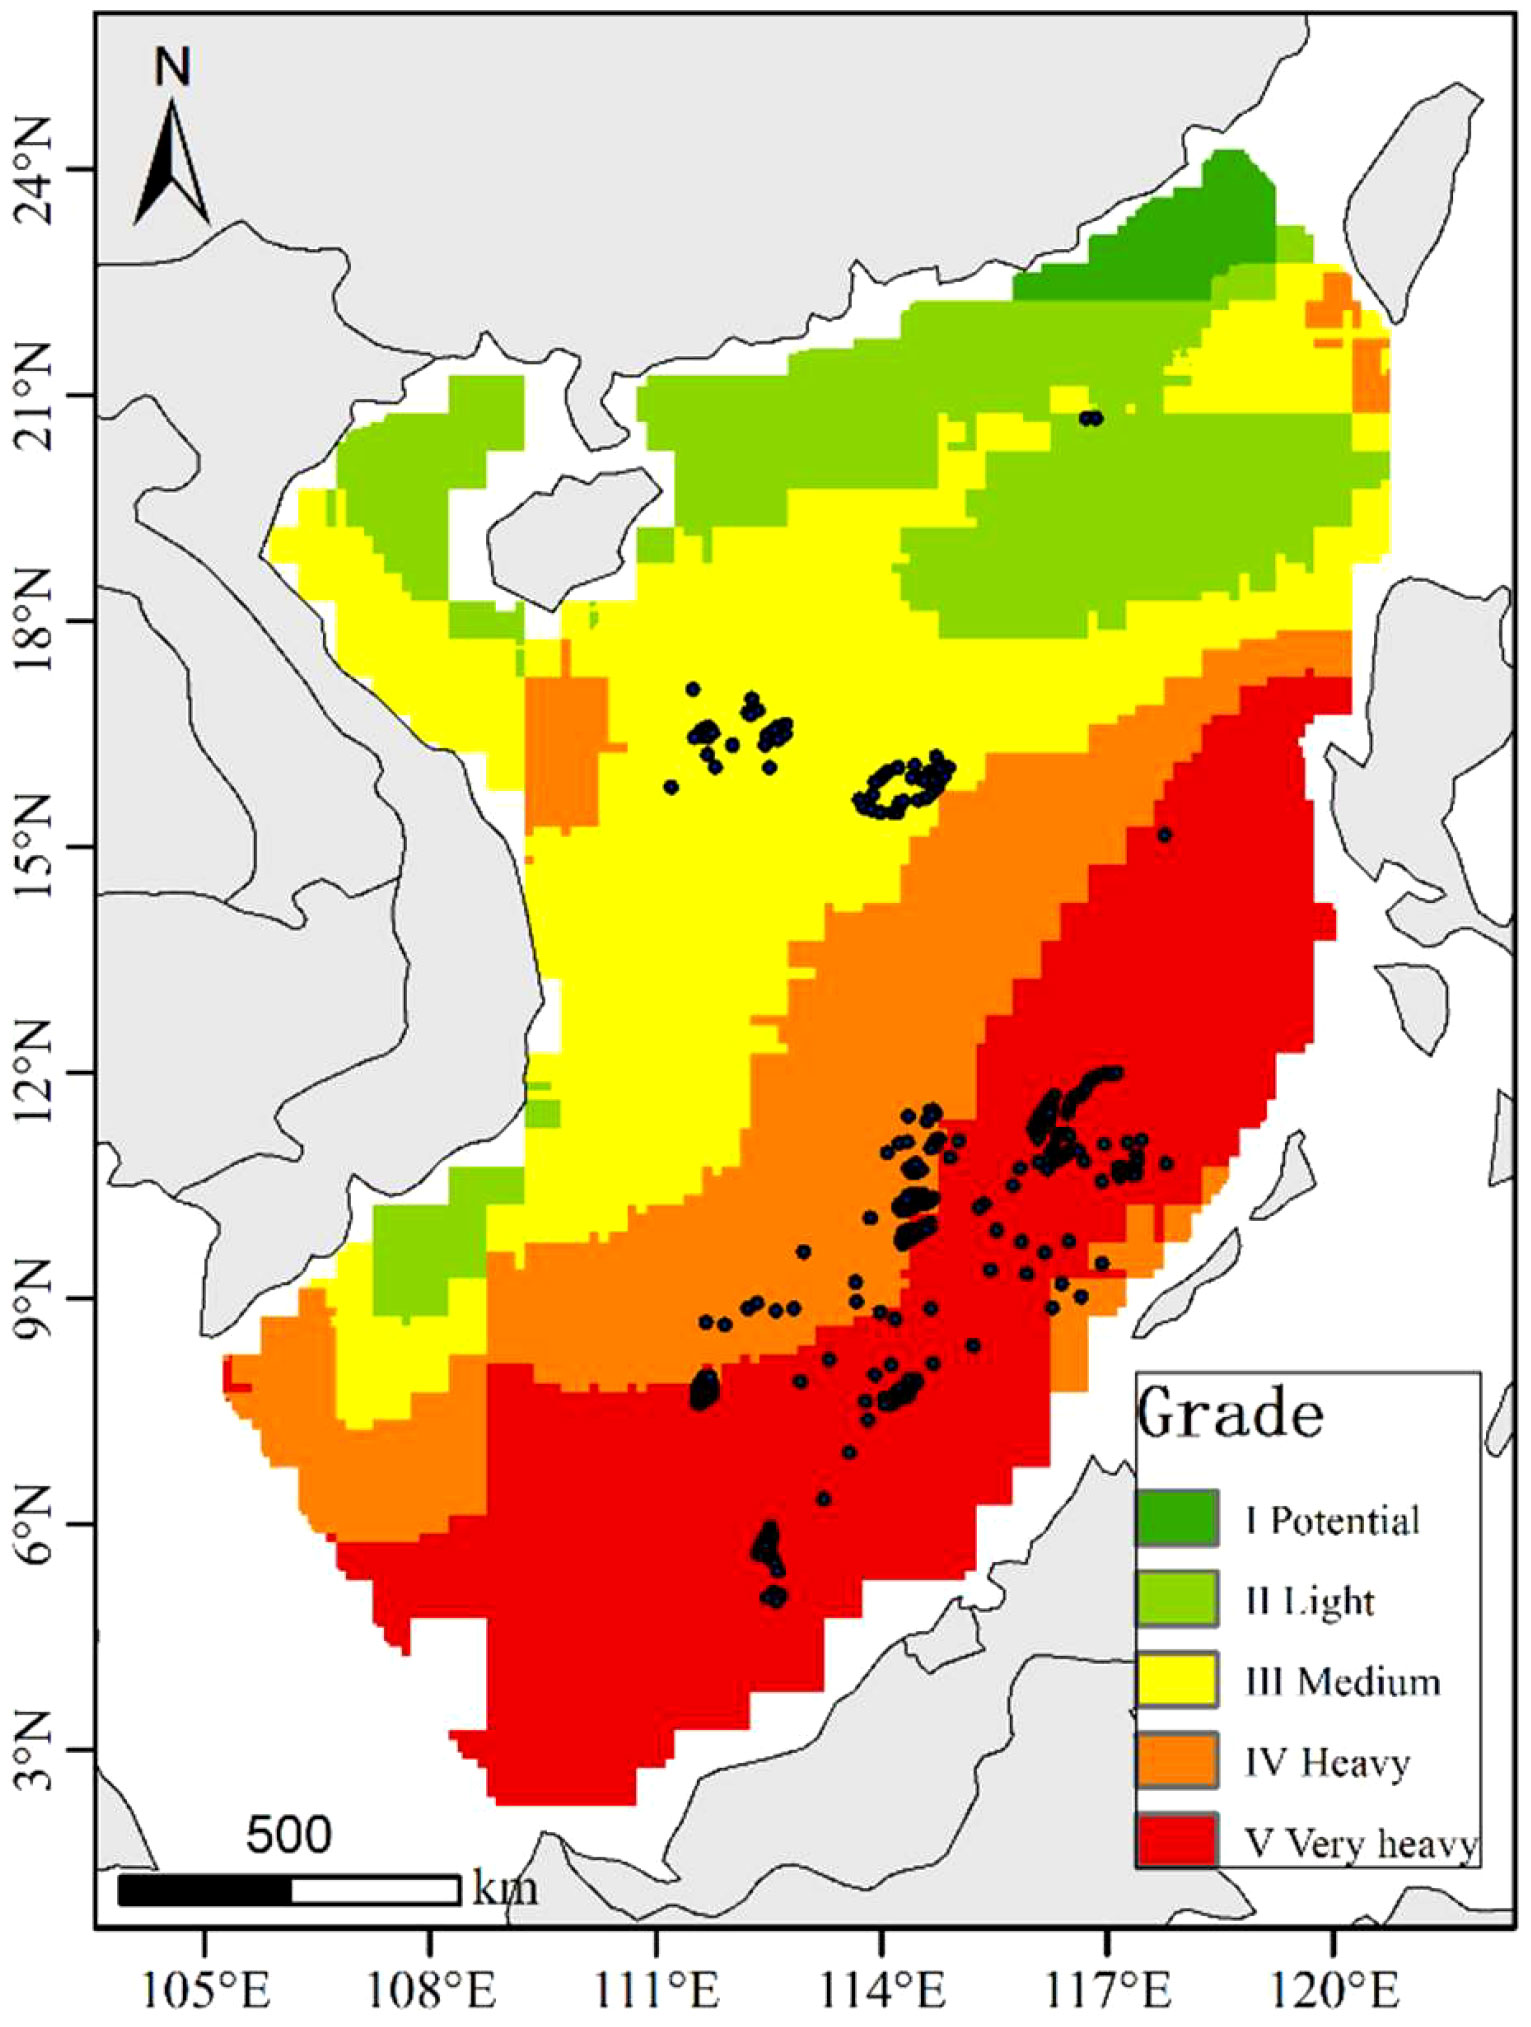
Figure 7 Spatial distribution of environmental vulnerability grades.
4 Discussion
4.1 Reasonableness of ecological vulnerability assessment
Due to the vast area of the South China Sea, the complex and diverse ecological environment, and the lack of sufficient and stable observatories to support accurate monitoring of local coral reef environmental factors, few scholars have studied the environmental vulnerability of coral reefs in the SCS. Usually, when based on remote sensing data and reanalysis data as the base data for calculation, there are certain correlations and redundancies among the spatial environmental variables in the evaluation model, which will directly affect the accuracy of the evaluation results.
In this paper, a sensitive model was constructed to evaluate the distribution of ecological vulnerability objectively and rapidly in the study area over a 60-year period without being constrained by human factors and subjective conditions. After careful selection the Spatial Principal Component Analysis (SPCA) was finally chosen for modeling (Maina et al., 2008), which has some advantages over conventional orthogonal functions (Hou et al., 2015). The standardized results for the variables of interest are shown in Figure 8. The original variable attribute space can be transformed into a new multivariate attribute space, making the axes in the new space uncorrelated, achieving a smaller information loss, having the effect of removing certain correlations among indicators and reducing data redundancy (Pan & Liu, 2015).
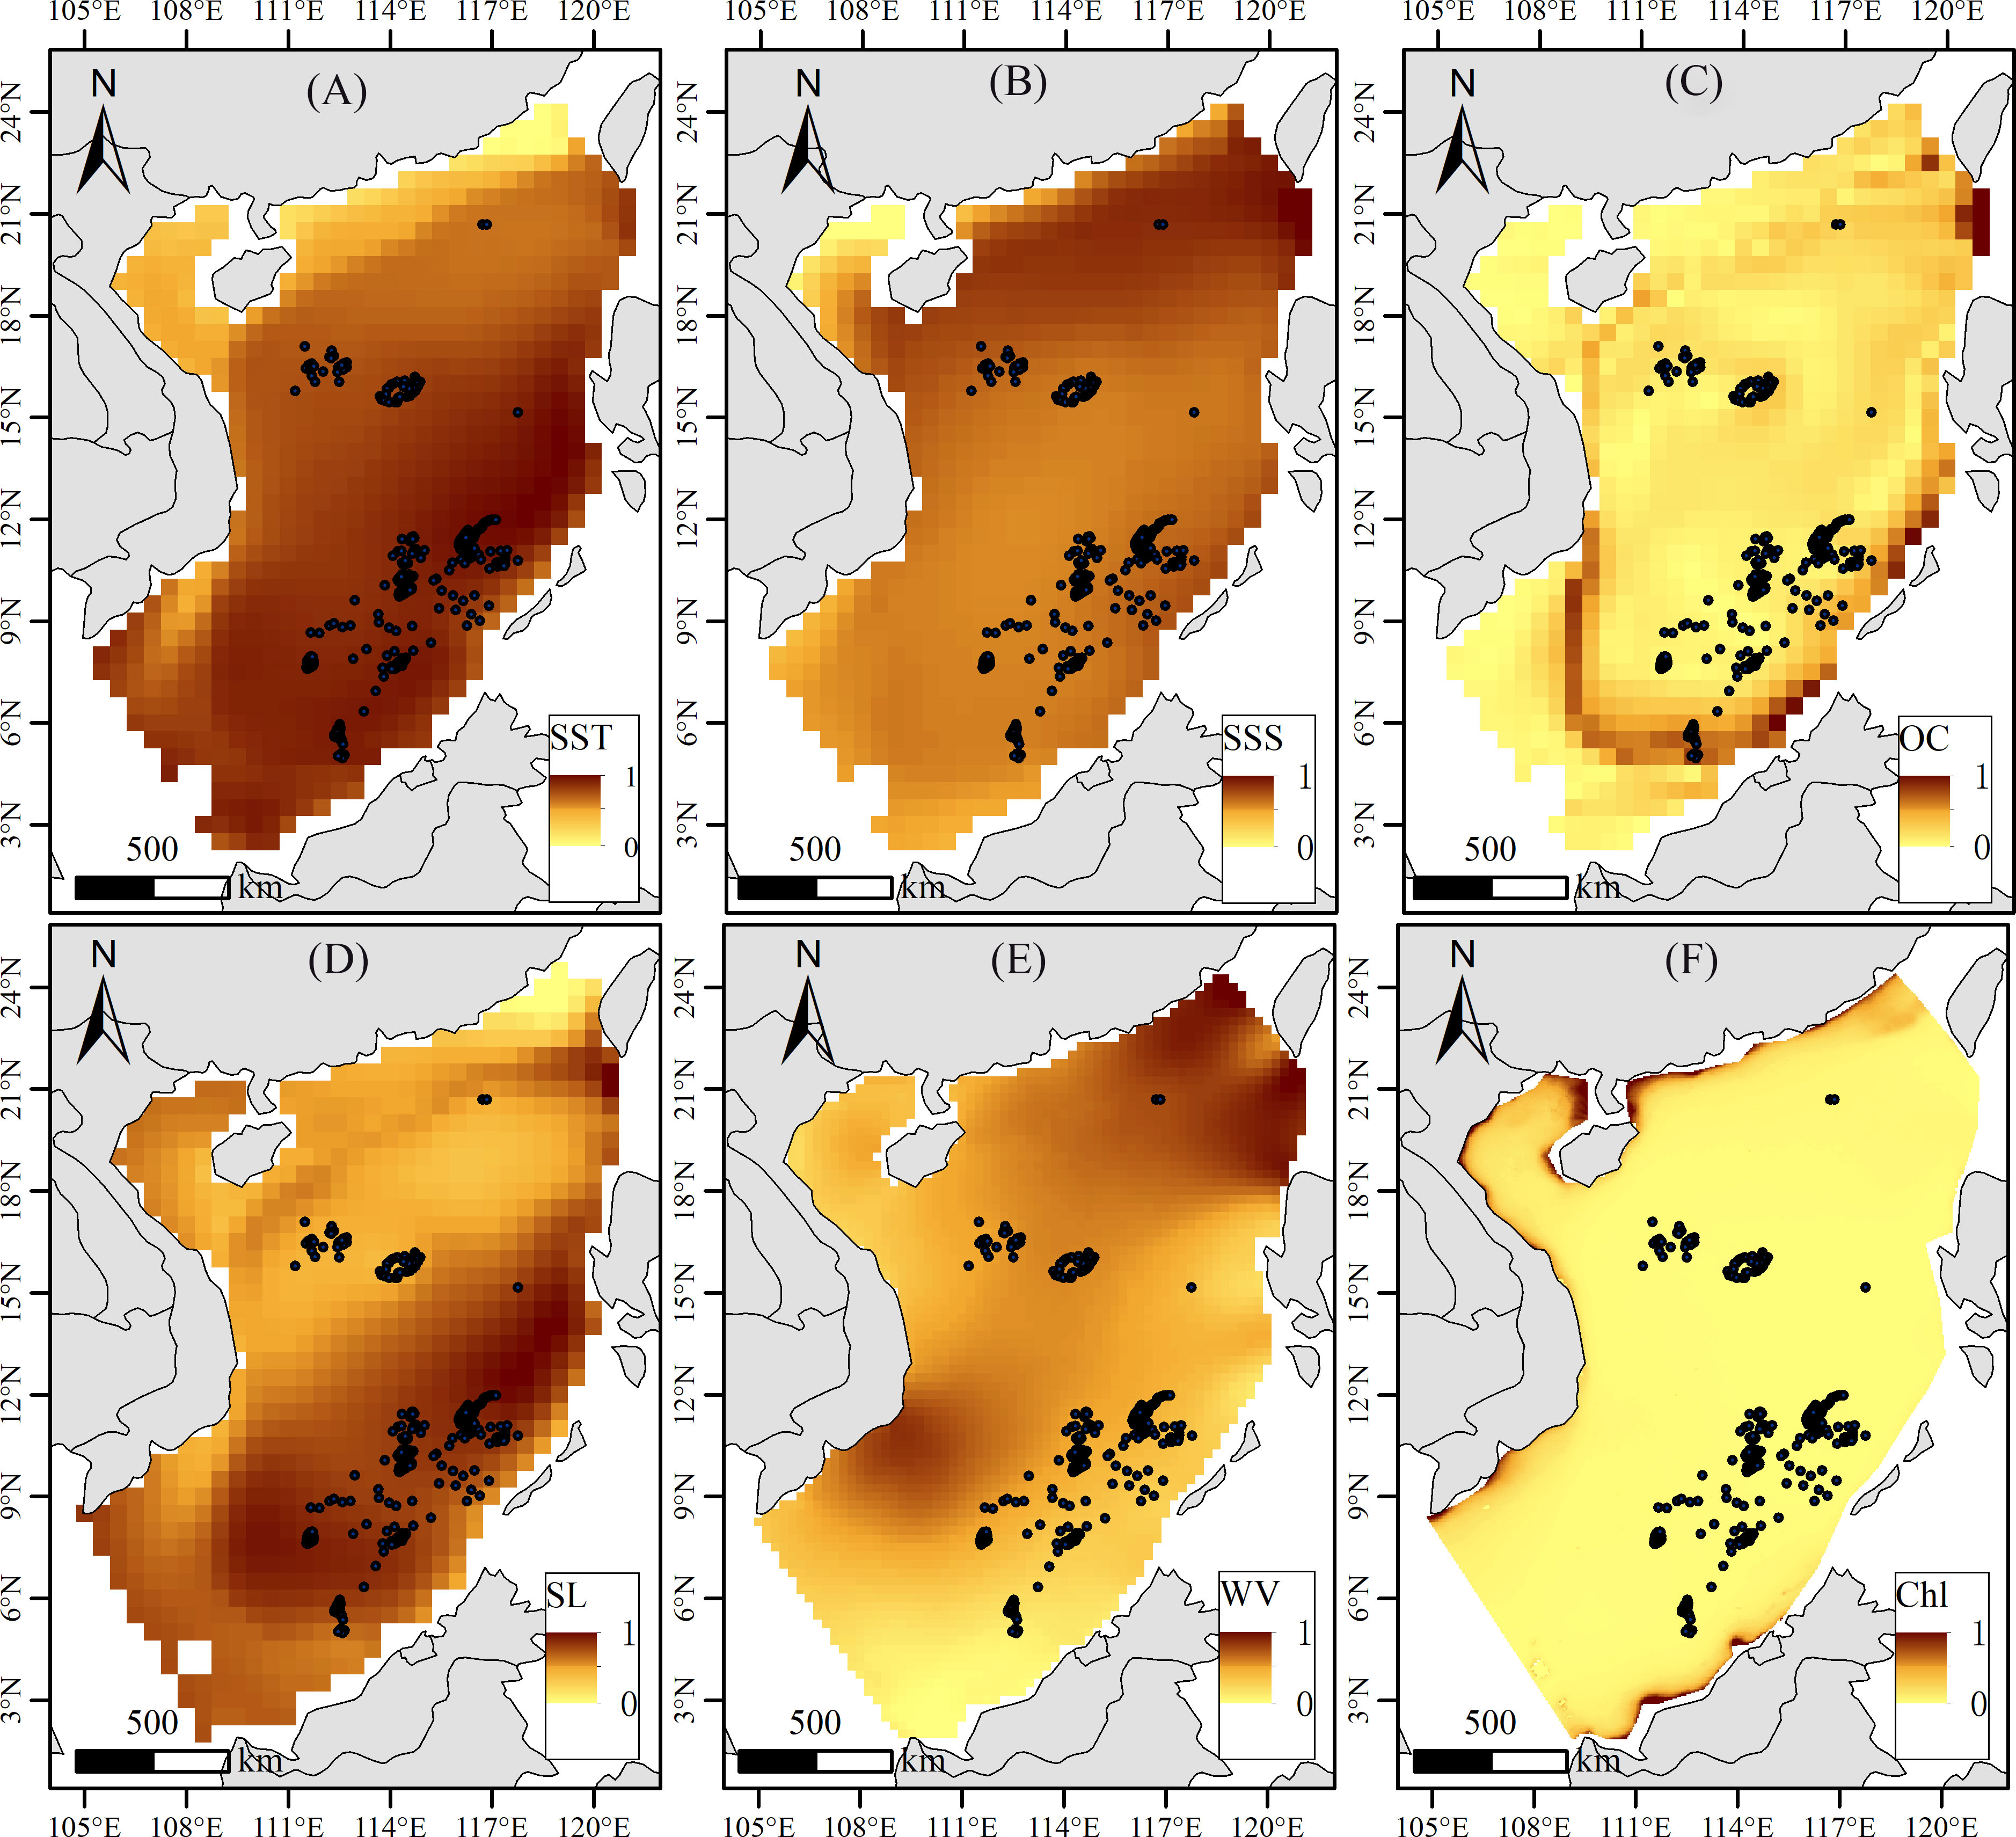
Figure 8 Normalized data based on each environmental variable, (A) Sea surface temperature; (B) Sea surface Salinity; (C) Ocean current; (D) Sea level; (E) Wind velocity; (F) Chlorophyll-a concentration.
In order to verify the correlation of each index, this paper uses the EVI value as the independent variable to diagnose the covariance of each index (Tian et al., 2016). There are two main covariance diagnostic indicators commonly used: variance inflation factor (VIF) and tolerance level (TOL). These two indicators are inverse of each other, and when VIF > 10 (i.e., TOL< 0.1), it indicates that the multicollinearity of the selected indicators is more serious.
In ArcGIS (version 10.8), a 30 km × 30 km grid was used to extract the sample data, and a total of 2197 points were generated uniformly for the study area. These points were then used to read the values of each indicator and EVI, and finally the VIF and TOL of each indicator were calculated using SPSS Statistics 25 (Table 5). From the calculation results, it can be seen that the VIF of each index is less than 10 and the TOL is greater than 0.1, indicating that there is no significant correlation between the indexes.
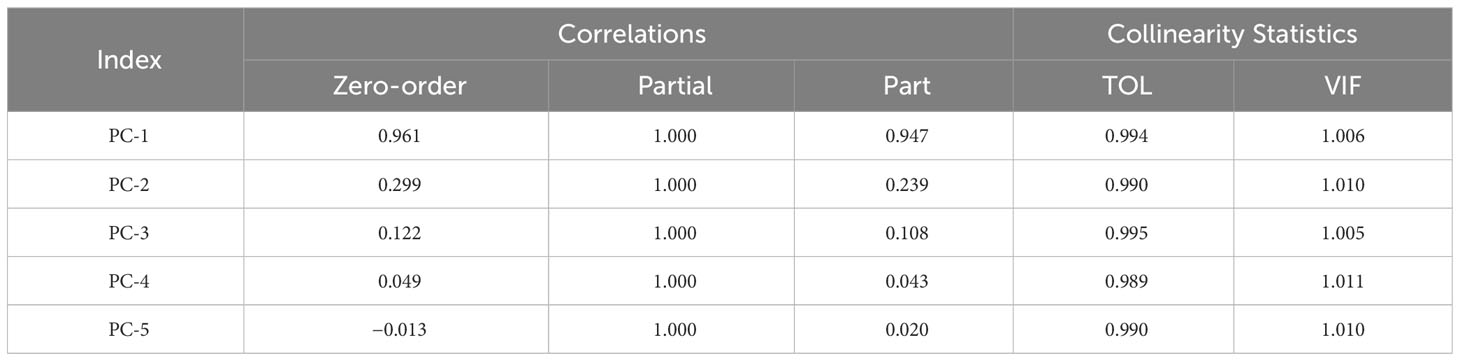
Table 5 Results of multicollinearity diagnostics.
In addition, the weights of each principal component variable can be obtained based on the contribution of the eigenvalues, which is more objective compared with the hierarchical analysis method. In summary, the evaluation indexes selected in this paper and the use of SPCA tool provided by ArcGIS for ecological sensitivity evaluation are desirable.
4.2 The evolutionary dynamics of ecological vulnerability
Overall, the environmental vulnerability values are relatively low in the northern and eastern regions of SCS, while they are higher in the southern and western regions. The northwestern region presents large contiguous areas of low and medium vulnerability, while the southeastern region is spatially divided into two interrupted areas of very high vulnerability. In addition, the spatial distribution of high vulnerability areas in the southwestern part of SCS is not significantly correlated with the increase of latitude, and it is noteworthy that the environmental vulnerability of the sea area near the coastline of Ninh Thuan and Binh Thuan Provinces in Vietnam is much lower than that of other areas at the same latitude.
It was found that the variables had different effects on the model, and the factor weights of each principal component obtained by SPCA showed that SST and WV were the most important factors, followed by SL, SSS, OS, and Chl. The top five principal components PC accounted for 98.5% of the overall when SPCA was performed (Table 3). By observing the key metrics associated with a PC, an approximate parameter can be associated for a specific PC. PC-1 and PC-2 contributed more, together accounting for 74.4% of the variance, with SST, WV, SL, and SSS having higher loadings; OS had a high contribution in PC-3, SSS, SL, and WV followed, while OS, SSS and SL, and SST had a high loading in PC-4. SL and SSS contribute more in PC-5. Since the contribution of Chl in PC-6 is much larger than other factors, and seawater chlorophyll is an important phenotype of phytoplankton and primary productivity, which is indicative of marine ecosystems and their changes (Stewart Round, 1981). Therefore, PC-6 is not included in the calculation of ecological vulnerability values. It is inferred that the SST and WV related variables have a significant effect on the model results. Except for SST and WV, OS and SSS had relatively large effects on the model, and SL and Chl had the smallest influence weights. The spatial distribution of the correlated factors is shown in Figure 9.
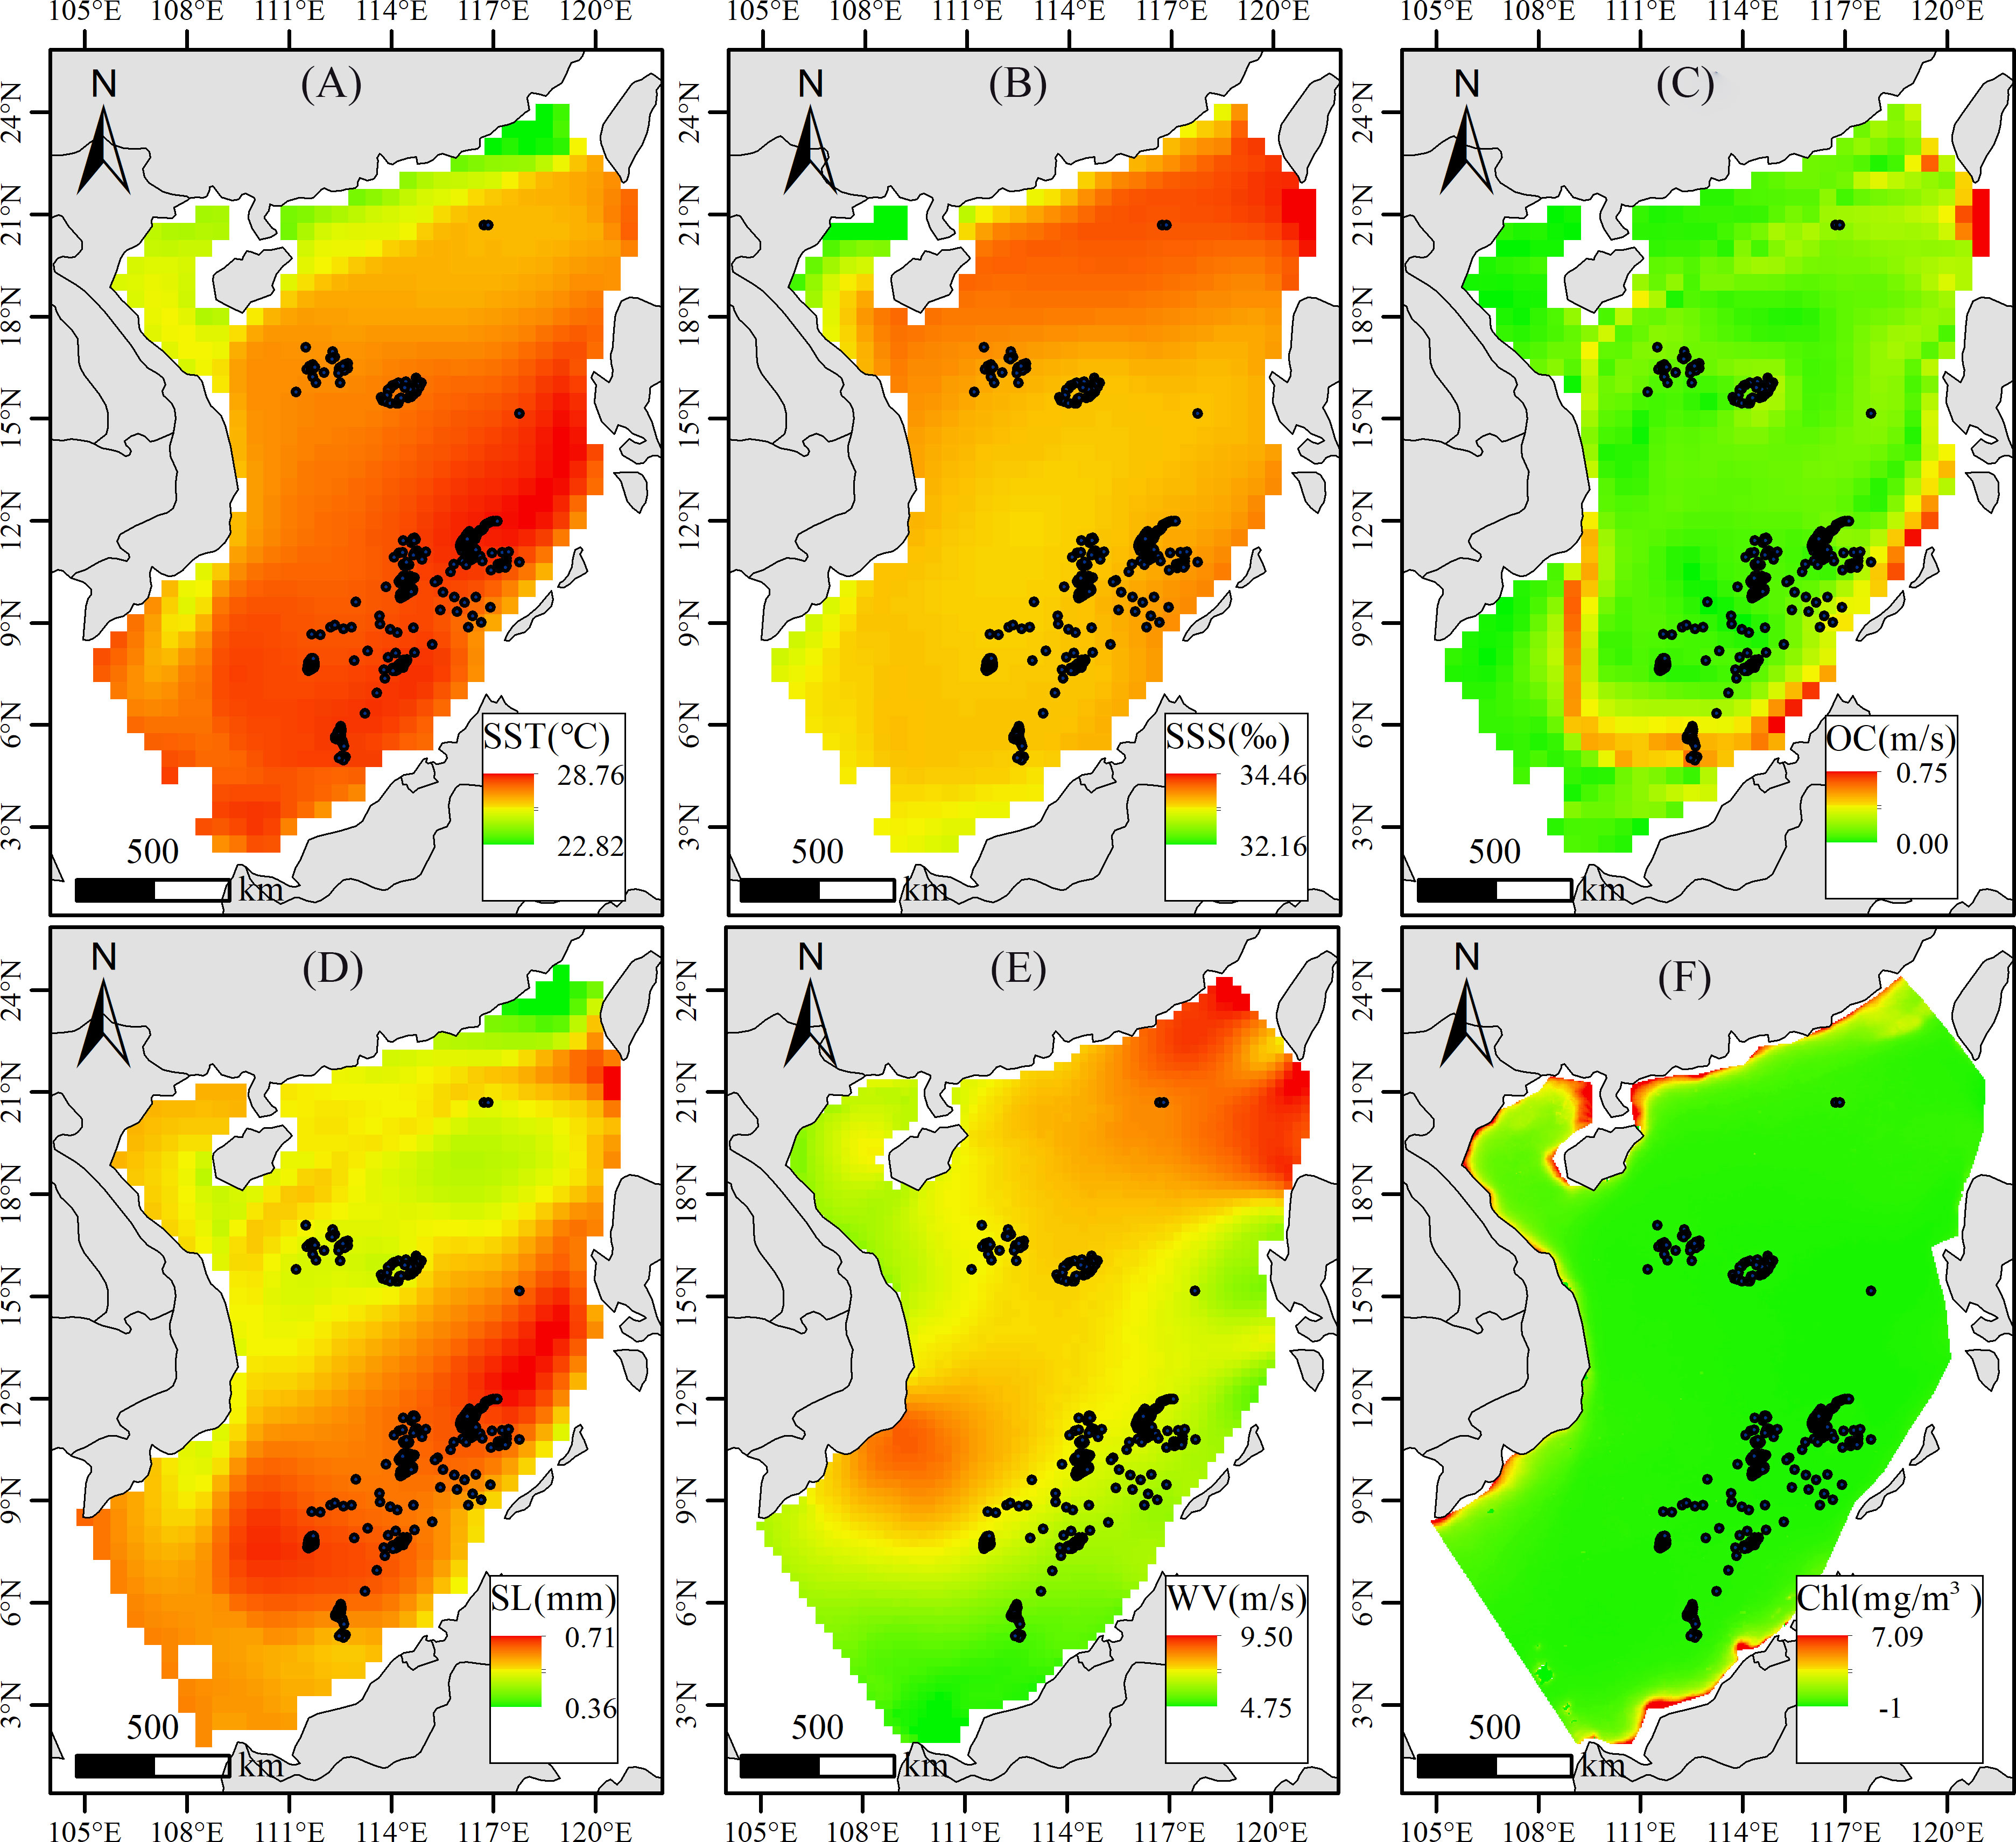
Figure 9 Distribution of each parameter, (A) Sea surface temperature; (B) Sea surface Salinity; (C) Ocean current; (D) Sea level; (E) Wind velocity; (F) Chlorophyll-a concentration.
To further explore the spatial and temporal evolution patterns of ecological vulnerability in SCS, this paper introduces Geodetector as an analytical tool (Wang & Xu, 2017) to diagnose the dominant influencing factors of ecological vulnerability. Geodetector includes 4 results: risk detector, factor detector, ecological detector, and interaction detector. Using one of the factor detectors, it is possible to detect whether environmental factors are responsible for the spatial and temporal distribution patterns of ecological vulnerability and to what extent they explain the spatially divergent mechanisms of ecological vulnerability.
The specific approach is to use the ecological vulnerability index (EVI) as the dependent variable and the 5 selected ecological factors as the independent variables, and stratify the independent variables from numerical quantities to typological quantities, and each indicator is divided into five categories using the natural breakpoint method, representing different degrees of ecological vulnerability types; Then, in ArcGIS (version 10.8), the dependent variable values and independent variables were matched by sampling points for factor detection analysis, using the 30km × 30km sampling points already acquired (Chen et al., 2023). The influence (Q) of each factor on the ecological vulnerability index (EVI) can be calculated (Q, the larger the value of Q indicates the greater the influence of the factor on ecological vulnerability); the explanatory power (P) of the factor (P, the larger the value of P indicates the smaller the explanatory power of the factor on ecological vulnerability). The results of the analysis showed that (Table 6): the P-values of all factors were 0, indicating that the explanatory power of all 6 factors on the ecological vulnerability of the South China Sea region was sufficient; the Q-values of SST, SL, and WV, all with values greater than 0.5, had a more significant effect on the ecological vulnerability of SCS, while 0.2< SSS< 0.5, had a moderate effect on the ecological vulnerability of SCS; OS, Chl< 0.2, had a weaker effect on the ecological vulnerability of SCS. The influence of OS and Chl< 0.1 on the ecological vulnerability of SCS was weak.
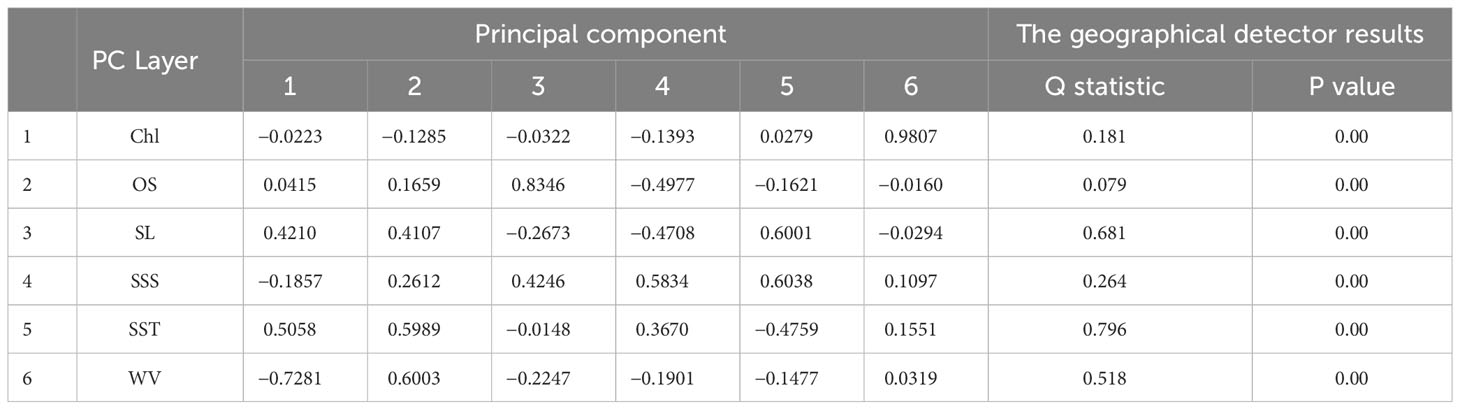
Table 6 SPCA output matrix denoting the transformation coefficients (calculated from the covariance matrix).
In view of the complex coupling relationship of the influencing factors on the ecological vulnerability of the South China Sea waters in different geographical units, the local government should improve and improve the policy system, implement the responsibilities of all parties, coordinate the balance between the economic development of local residents and ecological vulnerability management, take correct and appropriate measures and methods to inhibit the development of ecological vulnerability to a more fragile direction, accelerate the pace of ecological management of the South China Sea islands and reefs, and consolidate the results of ecological management construction, in order to manage the fragile ecological environment of the SCS islands and reefs from the root.
4.3 Shortcomings of the study results
Considering the comprehensive, complex and unclear characteristics of ecological vulnerability evaluation, and the current evaluation methods are not yet able to achieve a comprehensive, scientific and objective evaluation. Therefore, based on the summary of previous research results, this study takes SST, SSS, WV, SL, OC and Chl as the main determinants of the ecological vulnerability of SCS, and uses the developmental characteristics of coral reefs combined with remote sensing and evaluation models to make an objective evaluation of the ecological vulnerability of SCS and reveal the evolutionary dynamics of its ecological vulnerability. This study not only provides some reference value for SCS ecological vulnerability management, but also provides some ideas and reference for the ecological vulnerability evaluation of coral reefs.
The main objective of this paper is to try to explore a method to evaluate the ecological vulnerability of island areas in distant marine regions using reanalysis data and integrated evaluation models in the absence of field survey data. However, there are still some shortcomings in the determination of the index system in this paper: the change of ecological vulnerability of islands and reefs is a very complex issue, involving natural, ecological, socio-economic, human activities and other aspects, and it is difficult to use one or several indicators to completely characterize, and the accuracy of different impact factors is also controversial, and it is difficult to quantitatively analyze the degree of impact of different environmental factors on the ecological environment of islands and reefs. Besides, this study only considered the influence of natural factors on ecological vulnerability in the South China Sea, and basically ignored the negative factors caused by human. Further exploration and research are still needed for a more scientific and comprehensive spatial and temporal variation pattern of ecological vulnerability.
5 Conclusions
The approach described in this paper combines reanalysis data, satellites, and information known to have an impact on the island’s impact on the environment, using RS data and GIS technology. The expectation is to develop an integrated model that can be used to predict trends in coral vulnerability change. The target is to reduce the impact of similar indicators on vulnerability calculations. The adoption of the principal component contribution ratio method to determine the index weights avoids the influence of subjective factors and makes the evaluation results more objective and applicable. It also provides a comprehensive evaluation and analysis of the environmental vulnerability of the South China Sea region from a spatial and temporal perspective. The underlying data involved are easy to obtain and calculate for data updating and time series evaluation. The specific research objectives are summarized as follows:
1. There are differences in the susceptibility of coral reefs in different regions in SCS, with higher susceptibility in Spratly Islands and lower susceptibility in other regions.
2. Reanalysis data combined with ocean remote sensing data are suitable for estimating the susceptibility of coral reefs to environmental stresses at a regional scale.
3. In terms of the evolutionary dynamics of ecological vulnerability, two indicators, SST and WV, have a more significant impact on ecological vulnerability in the South China Sea.
Currently, anthropogenic activities are frequent in the SCS region, but there is no way to accurately calibrate the impact of anthropogenic external disturbances on the vulnerability of the islands and reefs. Future studies should quantify the magnitude of the impact of anthropogenic activities and provide insight into the rate of environmental impact of a single environmental parameter on coral reefs in the hope of predicting the intensity of damage to coral reefs from quantified external activities.
Data availability statement
The original contributions presented in the study are included in the article/supplementary material. Further inquiries can be directed to the corresponding author.
Author contributions
CJ edited the manuscript and contributed as supervisors; YM designed the framework of this study, writing—original draft preparation and analyzed; SL and YNL provided part of the data; YZL and XW wrote some codes for data processing; SY, YK, YW, and RW helped with the drawing. All authors discussed the results and implications on the manuscript at all stages. All authors contributed to the article and approved the submitted version.
Acknowledgments
This study was supported by National Natural Science Foundation of China (No. 51839002, No. 52109006, No. 52209048). Acknowledgement for The Data Support From National Marine Science Data Center, National Science & Technology Resource Sharing Service Platform of China.
Conflict of interest
The authors declare that the research was conducted in the absence of any commercial or financial relationships that could be construed as a potential conflict of interest.
Publisher’s note
All claims expressed in this article are solely those of the authors and do not necessarily represent those of their affiliated organizations, or those of the publisher, the editors and the reviewers. Any product that may be evaluated in this article, or claim that may be made by its manufacturer, is not guaranteed or endorsed by the publisher.
References
Baker A. C., Glynn P. W., Riegl B. (2008). Climate change and coral reef bleaching: An ecological assessment of long-term impacts, recovery trends and future outlook. Estuarine Coast. shelf Sci. 80 (4), 435–471. doi: 10.1016/j.ecss.2008.09.003
Barkley H. C., Cohen A. L., Golbuu Y., Starczak V. R., Shamberger K. (2015). Changes in coral reef communities across a natural gradient in seawater pH. Sci. Adv. 1 (5), e1500328–e1500328. doi: 10.1126/sciadv.1500328
Barnes B. B., Hu C. (2016). Island building in the South China Sea: detection of turbidity plumes and artificial islands using Landsat and MODIS data. Sci. Rep. 6, 33194. doi: 10.1038/srep33194
Bosserman R. W., Ragade R. K. (1982). Ecosystem analysis using fuzzy set theory. Ecol. Model. 16 (2-4), 191–208. doi: 10.1016/0304-3800(82)90008-4
Cerutti J. M. B., Burt A. J., Haupt P., Bunbury N., Mumby P. J., Schaepman-Strub G. (2020). Impacts of the 2014–2017 global bleaching event on a protected remote atoll in the Western Indian Ocean. Coral Reefs 39 (1), 15–26. doi: 10.1007/s00338-019-01853-1
Chao G., Wu X., Zhang L., Fu H., Liu K., Han G. (2020). China Ocean ReAnalysis (CORA) version 1.0 products and validation for 2009–18. Atmospheric Oceanic Sci. Lett. 145 (5), 100023. doi: 10.1016/j.aosl.2020.100023
Chen T., Yu K., Shi Q., Li S., Price G. J., Wang R., et al. (2009). Twenty-five years of change in scleractinian coral communities of Daya Bay (northern South China Sea) and its response to the 2008 AD extreme cold climate event. Chin. Sci. Bull. 54 (12), 2107–2117. doi: 10.1007/s11434-009-0007-8
Chen X., Yu Z., Di Q., Wu H. (2023). Assessing the marine ecological welfare performance of coastal regions in China and analysing its determining factors. Ecol. Indicators 147, 109942. doi: 10.1016/j.ecolind.2023.109942
Cotovicz L. C., Chielle R., Marins R. V. (2020). Air-sea CO2 flux in an equatorial continental shelf dominated by coral reefs (Southwestern Atlantic Ocean). Continental Shelf Res., 204, 104175. doi: 10.1016/j.csr.2020.104175
Diakoulaki D., Mavrotas G., Papayannakis L. (1995). Determining objective weights in multiple criteria problems: The CRITIC method. Computers Operations Res. 22 (7), 763–770. doi: 10.1016/0305-0548(94)00059-H
Donner S. D., Knutson T. R., Oppenheimer M. (2007). Model-based assessment of the role of human-induced climate change in the 2005 Caribbean coral bleaching event. Proc. Natl. Acad. Sci. 104 (13), 5483–5488. doi: 10.1073/pnas.0610122104
Donner S. D., Skirving W. J., Little C. M., Oppenheimer M., Hoegh-Guldberg O. (2010). Global assessment of coral bleaching and required rates of adaptation under climate change. Global Change Biol. 11 (12), 2251–2265. doi: 10.1111/j.1365-2486.2005.01073.x
Duan Y., Liu Y., Li M., Zhou M., Yang Y. (2016). Survey of reefs based on Landsat 8 operational land imager (OLI) images in the Nansha Islands, South China Sea. Acta Oceanologica Sin. 35 (10), 11–19. doi: 10.1007/s13131-016-0898-6
Guo Z. C., Wei W., Pang S. F., Li Z. Y., Zhou J. J., Xie B. (2019). Spatio-Temporal evolution and motivation analysis of ecological vulnerability in Arid Inland River Basin based on SPCA and remote sensing index: A case study on the Shiyang River Basin. Acta Ecologica Sin. 39 (7). doi: 10.5846/stxb201805211114
Heron S. F., Maynard J. A., Van Hooidonk R., Eakin C. M. (2016). Warming trends and bleaching stress of the world’s coral reefs 1985–2012. Sci. Rep. 6 (1), 38402. doi: 10.1038/srep38402
Hou K., Li X., Zhang J. (2015). GIS analysis of changes in ecological vulnerability using a SPCA model in the Loess plateau of Northern Shaanxi, China. Int. J. Environ. Res. Public Health 12 (4), 4292–4305. doi: 10.3390/ijerph120404292
Hu W., Zheng X., Li Y., Du J., Lv Y., Su S., et al. (2022). High vulnerability and a big conservation gap: Mapping the vulnerability of coastal scleractinian corals in South China. Sci. Total Environ. 847, 157363. doi: 10.1016/j.scitotenv.2022.157363
Jiang C., Ma Y., Long Y., Yuan S., Kang Y., Yin L., et al. (2021). Spatial distribution of Nansha Reef Group based on Landsat 8 satellite data. Mar. Sci. Bull. 40 (4), 8. doi: 10.11840/j.issn.1001-6392.2021.04.001
Kordi M. N., O’Leary M. (2016). Geomorphic classification of coral reefs in the north western Australian shelf. Regional Stud. Mar. Sci. 7, 100–110. doi: 10.1016/j.rsma.2016.05.012
Lee T.-W. (1998). “Independent component analysis,” in Independent component analysis: theory and applications (Boston, MA: Springer US), 27–66.
Li L., Fu Y., Xue C. (2021). Development of monthly-seasonal-annual dataset of sea surface chlorophyll-a concentration for 21 years, (1998-2018). Global Change Data Discov. 5 (2), 219–225. doi: 10.3974/geodp.2021.02.15
Li X. M., Min M., Tan C. F. (2005). The functional assessment of agricultural ecosystems in Hubei Province, China. Ecol. Model. 187 (2-3), 352–360. doi: 10.1016/j.ecolmodel.2004.09.006
Li A., Wang A., Liang S., Zhou W. (2006). Eco-environmental vulnerability evaluation in mountainous region using remote sensing and GIS—A case study in the upper reaches of Minjiang River, China. Ecol. Model. 192 (1-2), 175–187. doi: 10.1016/j.ecolmodel.2005.07.005
Liu G., Strong A. E., Skirving W. (2003). Remote sensing of sea surface temperatures during 2002 Barrier Reef coral bleaching. Eos Trans. Am. Geophysical Union 84 (15), 137–141. doi: 10.1029/2003EO150001
Maina J., Venus V., McClanahan T. R., Ateweberhan M. (2008). Modelling susceptibility of coral reefs to environmental stress using remote sensing data and GIS models. Ecol. Model. 212 (3-4), 180–199. doi: 10.1016/j.ecolmodel.2007.10.033
Morton B., Blackmore G. (2001). South China sea. Mar. pollut. Bull. 42 (12), 1236–1263. doi: 10.1016/S0025-326X(01)00240-5
Pan J.-H., Liu X. (2015). Assessment of landscape ecological security and optimization of landscape pattern based on spatial principal component analysis and resistance model in arid inland area: A case study of Ganzhou District, Zhangye City, Northwest China. J. Appl. Ecol. 26 (10), 3126–3136. doi: 10.13287/j.1001-9332.20150921.027
Qin Z., Yu K., Wang Y., Xu L., Huang X., Chen B., et al. (2019). Spatial and intergeneric variation in physiological indicators of corals in the south China sea: insights into their current state and their adaptability to environmental stress. J. Geophysical Research: Oceans 124 (5), 3317–3332. doi: 10.1029/2018JC014648
Rajput N. S., Das R. R., Mishra V. N., Singh K. P., Dwivedi R. (2010). A neural net implementation of SPCA pre-processor for gas/odor classification using the responses of thick film gas sensor array. Sensors Actuators B Chem. 148 (2), 550–558. doi: 10.1016/j.snb.2010.05.051
Shao H., Sun X., Tao S., Xiang Z., Xian W. (2015). Environmental vulnerability assessment in middle-upper reaches of Dadu River Watershed using Projection Pursuit Model and GIS. Carpathian J. Earth Environ. Sci. 10 (4), 133–146.
Shen H., Han J., Chao L., Fan H. (2014). Evaluation and analysis on the sea surface temperature from a three-dimensional ocean forecast system for the China seas and adjacent seas based on POMgcs. Mar. Sci. Bull. 33 (1), 45–55. doi: 1001-6392.2014.01.006
Shi Q., Yan H., Zhang H., Zhao M. (2011). Spatial variations of stony coral cover on the reef slope of Yongxing Island, Xisha Islands. J. Trop. Oceanography 30 (2), 8. doi: 1009-5470.2011.02.002
Tian X.-R., DaI X., Wang X.-Y., Zao F.-J., Shu L.-F. (2016). Spatial and temporal changes of the ecological vulnerability in a serious soil erosion area, Southern China. J. Applied Ecol. 27 (3). doi: 10.13287/j.1001-9332.201603.022
Wang J., Xu C. (2017). Geodetector: principle and prospective. Acta Geographica Sin. 72 (1), 116-134. doi: 10.11821/dlxb201701010
Xiao J. ,. W. W., Wang X., Tian P., Niu W. (2022). Recent deterioration of coral reefs in the South China Sea due to multiple disturbances. Peer. J. 10, e13634. doi: 10.7717/peerj.13634
Yang G., Chen Z. (2015). RS-based fuzzy multiattribute assessment of eco-environmental vulnerability in the source area of the Lishui River of northwest Hunan Province, China. Natural Hazards 78 (2), 1–17. doi: 10.1007/s11069-015-1762-2
Yin Y., Tang D., Liu Y. (2019). Remote sensing of spatial-temporal distribution of suspended sediment surrounding island and reefs in the South China Sea. Remote Sens. Technol. Appl. 34 (2), 435–444. doi: 10.11873/j.issn.1004-0323.2019.2.0435
Yu K. (2012). Coral reefs in the South China Sea: Their response to and records on past environmental changes. Sci. China Earth Sci. 55 (8), 1217–1229. doi: 10.1007/s11430-012-4449-5
Zhang J., Su F., Wang W. (2018). A review of geographical information research on resources and environment of the South China Sea region. Prog. Geogr. 37 (11), 1443–1453. doi: 10.18306/dlkxjz.2018.11.001
Zhao M., Yu K., Zhang Q., Shi Q., Price G. J. (2012). Long-term decline of a fringing coral reef in the northern South China Sea. J. Coast. Res. 28 (5), 1088–1099. doi: 10.2112/jcoastres-d-10-00172.1
Zhao M., Zhang H., Zhong Y., Jiang D., Liu G., Yan H., et al. (2019). The status of coral reefs and its importance for coastal protection: A case study of northeastern hainan island, South China Sea. Sustainability 11 (16), 4354. doi: 10.3390/su11164354
Keywords: climate change, coral reef vulnerability model, re-analysis of data, RS and GIS, coral reef
Citation: Ma Y, Jiang C, Li S, Liu Y, Wen X, Long Y, Yuan S, Kang Y, Wang Y and Wu R (2023) Ecological vulnerability assessment of coral islands and reefs in the South China Sea based on remote sensing and reanalysis data. Front. Ecol. Evol. 11:1066961. doi: 10.3389/fevo.2023.1066961
Received: 11 October 2022; Accepted: 04 September 2023;
Published: 21 September 2023.
Edited by:
Zachary Blount, Michigan State University, United StatesCopyright © 2023 Ma, Jiang, Li, Liu, Wen, Long, Yuan, Kang, Wang and Wu. This is an open-access article distributed under the terms of the Creative Commons Attribution License (CC BY). The use, distribution or reproduction in other forums is permitted, provided the original author(s) and the copyright owner(s) are credited and that the original publication in this journal is cited, in accordance with accepted academic practice. No use, distribution or reproduction is permitted which does not comply with these terms.
*Correspondence: Changbo Jiang, Jiangchb@csust.edu.cn