Temporal coherence patterns of prairie pothole wetlands indicate the importance of landscape linkages and wetland heterogeneity in maintaining biodiversity
 Kyle I. McLean
 David M. Mushet
 Jon N. Sweetman2,3
- 1U.S. Geological Survey, Northern Prairie Wildlife Research Center, Jamestown, ND, United States
- 2Environmental and Conservation Sciences Program, Department of Biological Sciences, North Dakota State University, Fargo, ND, United States
- 3Department of Ecosystem Science and Management, Pennsylvania State University, University Park, PA, United States
Wetland ecosystems are diverse, productive habitats that are essential reservoirs of biodiversity. Not only are they home to numerous wetland-specialist species, but they also provide food, water, and shelter that support terrestrial wildlife populations. However, like observed patterns of biodiversity loss, wetland habitats have experienced widespread loss and degradation. In order to conserve and restore wetlands, and thereby the biodiversity they support, it is important to understand how biodiversity in wetland habitats is maintained. Habitat heterogeneity and connectivity are thought to be predominate drivers of wetland biodiversity. We quantified temporal coherence (i.e., spatial synchrony) of wetland invertebrate communities using intra-class correlations among 16 wetlands sampled continuously over 24 years to better understand the relative influences wetland heterogeneity (i.e., internal processes specific to individual wetlands and spatial connectivity and external processes occurring on the landscape) on wetland biodiversity. We found that while wetlands with different ponded-water regimes (temporarily ponded or permanently ponded) often hosted different invertebrate communities, temporal shifts in invertebrate composition were synchronous. We also found the relative importance of internal versus external forces in determining community assembly vary depending on a wetland’s hydrologic function and climate influences. Our results confirm that heterogeneity and spatial connectivity of wetland landscapes are important drivers of wetland biodiversity.
Introduction
Biodiversity loss has been occurring at alarming rates worldwide and in many cases is expected to increase with climate warming and land-use intensification (Pimm et al., 1995; Sala et al., 2000). The loss of biodiversity has been shown to have global effects on human wellbeing in addition to ecological stability (Díaz et al., 2006; Cardinale et al., 2012; Hooper et al., 2012). Biodiversity loss in freshwater ecosystems is occurring at rates even greater than in their terrestrial counterparts (Ricciardi and Rasmussen, 1999; Reid et al., 2019). Most global estimates of biodiversity and biodiversity loss for freshwater ecosystems are predominately estimated from large lake and river ecosystem observations (Ricciardi and Rasmussen, 1999; Balian et al., 2007). However, wetland ecosystems have been identified as a major source of unique aquatic diversity and are also key to maintaining biodiversity in many surrounding terrestrial ecosystems (Boylan and MacLean, 1997; Bobbink et al., 2006; Reid et al., 2019). The severity of biodiversity losses and corresponding ecological ramifications magnifies the need to better understand processes that influence biodiversity.
Wetlands are located at the transitional interface between fully terrestrial and fully aquatic habitats (Junk et al., 2014). Their position at this interface contributes to wetlands being among the most productive ecosystems, supporting levels of biodiversity disproportionate to the area they occupy (Dudgeon et al., 2006; Kingsford et al., 2016). Additionally, the highly dynamic hydrology typical of many wetlands contribute to the high rates of endism and temporal diversity observed in their biotic communities (Gibbs, 1993). The high biotic productivity of wetlands in turn is critical for the persistence of many transitory species such as waterfowl and other migratory water birds (Gibbs, 1993; Haig et al., 2019). The enhanced importance of wetlands to biodiversity at local and landscape scales has been a primary driver of wetland conservation (Zedler and Kercher, 2005).
Numerous studies have revealed the need to conserve and restore the spatial connectivity of wetlands in addition to simply maintaining wetlands in the landscape (e.g., Gibbs, 2000; Calhoun et al., 2017; Verheijen et al., 2018, 2020). This reflects an understanding of the importance of processes external to wetland habitat characteristics (e.g., hydrology, vegetative structure) that link wetland communities on the landscape, in addition to the unique characteristics internal to individual wetlands. However, there have been few, if any comparisons detailing the contributions of both internal (within wetland) processes related to characteristics such as habitat heterogeneity and external (landscape) processes related to characteristics like spatial connectivity and climate in structuring wetland communities. One common way to investigate the relative role of internal and external processes in ecosystems is to assess the spatial synchrony of variables over time (hereafter, temporal coherence; Magnuson et al., 1990).
Temporal coherence (i.e., spatial synchrony of variables over time), often measured as intra-class correlation (ri), is an indirect measure of spatial and temporal processes. High among-site correlations (synchronous patterns) indicate that external time-specific controls on the landscape (e.g., climate) are predominately driving variability. By contrast, low among-site correlations (asynchronous patterns) indicate that internal (within site) processes have greater control over variability (Kratz et al., 1987; Rusak et al., 1999). This estimation of temporal coherence has been commonly used in the aquatic sciences in explorations of spatial and temporal processes, albeit mostly in large, lacustrine ecosystems (see Huttunen et al., 2014). Temporal coherence has been shown to differ within and among sites with different spatial settings, geologic settings, acidification histories, and climate periods (Magnuson et al., 1990; Webster et al., 2000; Angeler and Johnson, 2012; Huttunen et al., 2014). In lacustrine ecosystems, coherence has been found to be strongest for abiotic variables and generally weaker for biotic variables, with the exception of taxonomic compositional turnover, which is potentially more synchronous (see Angeler and Johnson, 2012). Huttunen et al. (2014) found that for small, temperate streams that exhibit strong seasonality, measures of macroinvertebrate abundance and diversity exhibit high temporal coherence. However, temporal coherence in wetland ecosystems has yet to be assessed and could provide valuable insights into the relative importance of processes that are external and internal to wetland systems in structuring biota.
In recent years, many scientists have postulated that wetlands are units embedded within a larger connected system, and that their biotic characteristics are dependent on among-wetland landscape linkages and wetland heterogeneity (Rains et al., 2016; Zamberletti et al., 2018; Mushet et al., 2019a; Smith et al., 2019). Therefore, temporal coherence of measures of wetland biological assemblages (e.g., invertebrates), such as abundance, alpha diversity, and beta diversity would be predicted to be high when aquatic community assembly is largely structured by biological processes external to each wetland that are dependent among-wetland connectivity, such as dispersal (Pope et al., 2000; Smith et al., 2019). Prairie pothole wetlands can have high within-wetland habitat heterogeneity (i.e., internal characteristics). When variability is high in habitat characteristics that act as important environmental filters (e.g., surface water duration), temporal coherence would be expected to be low (Euliss et al., 2004). McLean et al. (2019) used long-term prairie-pothole wetland monitoring data from the Cottonwood Lake study area in North Dakota to assess how aquatic invertebrates respond to hydrological change and found differentiation in aquatic invertebrate community assemblages among wetlands with differing hydroperiods and during distinct ecohydrological studies. A follow up study using the same wetland dataset used structural equation models to test how a wetlands spatial (i.e., a wetlands relationship to local water flows) and temporal (climatic conditions) setting influence wetland hydrology, vegetative structure, predator communities, and ultimately variation in invertebrate assemblages (McLean et al., 2021). The results indicated that hydrological controls are a key determinant of aquatic invertebrate community assemblages, but 30−40% of the variation observed for invertebrate assemblages was not explained by the model (McLean et al., 2021).
To further investigate the relative roles of processes internal to individual wetlands and external processes occurring on the landscape, 24 years of environmental monitoring data from a complex of 16 wetlands with variable hydrologic regimes were used to quantify the temporal coherence of biotic variables relevant to biodiversity conservation (i.e., spatial synchrony in wetland invertebrate communities over time). The first objective of this study was to quantify the overall temporal coherence of aquatic-invertebrate communities for all wetlands sampled during the study. The goal of this objective was to better understand the relative importance of habitat heterogeneity internal to wetlands and spatial connectivity that links wetland communities for maintaining diversity. Additional objectives were created to explore how the relative importance of habitat heterogeneity and spatial connectivity is influenced by the (1) life-history attributes of biological communities (e.g., dispersal rates), (2) wetland ecohydrological characteristics (e.g., hydroperiod), and (3) climate variability (e.g., drought versus deluge periods). The second objective was to explore connectivity through comparisons of coherence patterns between more mobile dispersing fauna (insects) and less mobile dispersers (non-insect aquatic invertebrates). The third objective was to quantify and compare temporal coherence patterns of biotic variables by subsets of wetlands with different hydrologic regimes (i.e., temporarily ponded and permanently ponded). This comparison would provide a better understanding of the efficacy of making generalizing important determinants of wetland biodiversity regardless of hydrologic regime. The fourth and final objective was to compare temporal coherence of biotic variables among two hydroclimatic periods, a “filling period” (1993–1999) and the “post-filling period” (2000–2015). These two periods represent a climate-induced hydrologic state shift that was triggered by substantial increases in precipitation (1993–1999). This precipitation increases led to changes in surface and groundwater dynamics. In the ensuing post-filling period, water levels stabilized in the larger wetlands but resumed cycling between ponded and dry for the smaller, higher-elevation wetlands (McKenna et al., 2017; McLean et al., 2019). Comparing coherence levels from these two hydroclimatic periods could provide insight on the role of climate-driven processes on the landscape, e.g., dispersal via increased surface water connectivity, in structuring invertebrate assemblages.
Materials and methods
Study area
This study utilized long-term, environmental data from the Cottonwood Lake study area (CLSA) centrally located within the Prairie Pothole Region of North America (Figure 1). The millions of wetlands spanning approximately 777,000 km2 across the center of the North American continent (Smith et al., 1964; Dahl, 2011) make the Prairie Pothole Region one of the largest, wetland-dominated regions on earth (van der Valk, 2005). Prairie-pothole wetlands are upland-embedded, depressional wetlands and make up a majority of the wetland habitats found in the Prairie Pothole Region. Prairie-pothole wetlands can exhibit high spatial and temporal variability in ponded-water duration, volume, and chemistry (Euliss et al., 2004; Mushet et al., 2015; LaBaugh et al., 2018). This hydrological variability is driven by spatial variability in hydrogeologic setting, e.g., catchment size, relationship to local groundwater flows, surrounding upland characteristics, and spatial and temporal variability in climate (Euliss et al., 2004; Hayashi et al., 2016).
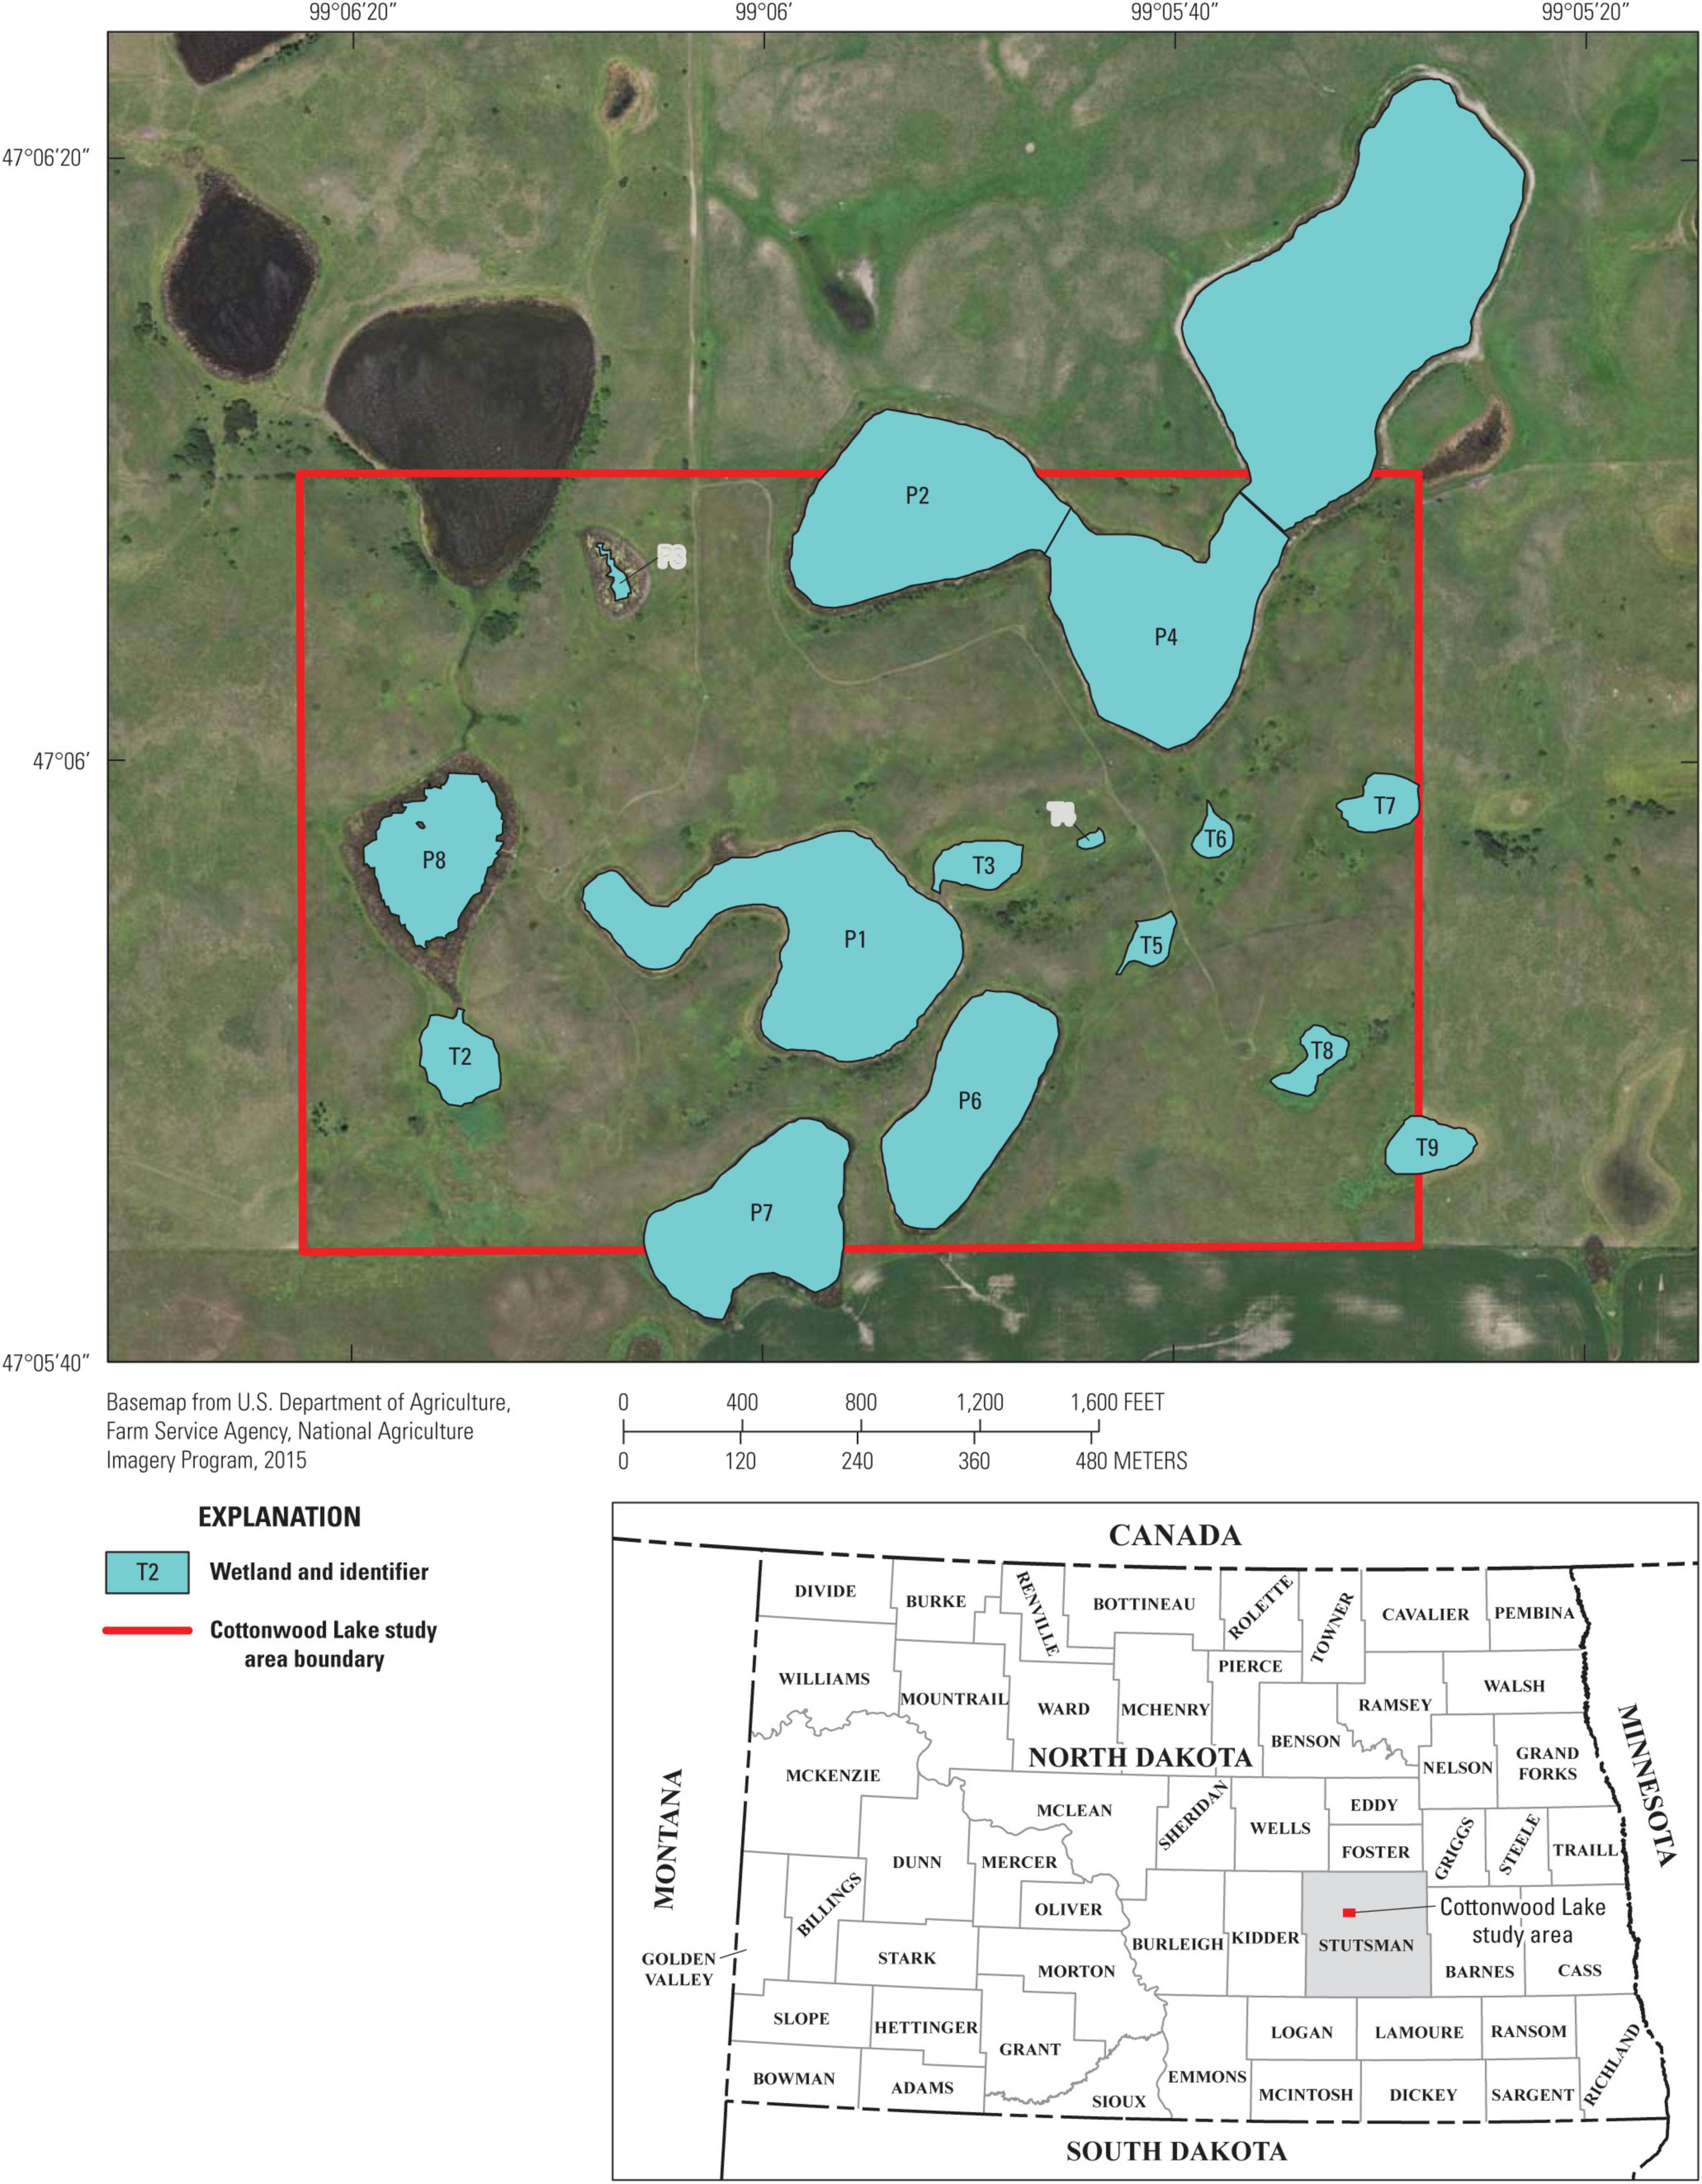
Figure 1. Map of prairie-pothole wetlands in the Cottonwood Lake study area, Stutsman County, North Dakota (from McKenna et al., 2017). Wetland P-11 (not shown) is located 3.2 km west of the core study area depicted here.
The flora and fauna found in prairie potholes are diverse and often uniquely adapted to the spatially and temporally variability found in these wetlands (van der Valk and Davis, 1978; Euliss et al., 1999, Euliss et al., 2004). Because prairie-pothole wetlands are the dominant water bodies found in the Prairie Pothole Region, they are critical habitats for aquatic fauna, primarily invertebrates and amphibians. The plants, invertebrates, and amphibians found within prairie-pothole wetlands provide critical forage for migrating and nesting waterbirds (Deutschman and Peterka, 1988; Krapu and Reinecke, 1992; Stafford et al., 2016; Ferguson et al., 2019). Protection and restoration of prairie-pothole wetlands has been largely driven by waterbird conservation efforts, specifically ducks (Doherty et al., 2013; Dixon et al., 2019).
The CLSA is a complex of 16 neighboring wetlands located on U.S. Fish and Wildlife Service managed Waterfowl Production Areas located on the eastern edge of the Missouri Coteau in Stutsman County, North Dakota (Figure 1). Most of the wetlands in the CLSA (n = 15) are embedded within a 92-ha prairie-grassland (i.e., non-cropland) landscape and are relatively untouched by anthropogenic landscape alterations. One wetland, P-11, is located 3.2 km west of the core study area. All of the CLSA wetlands exhibited a wide range of spatial (i.e., among wetlands) and temporal (within wetlands) variability in ponded-water extent and duration (Table 1). Thus, the CLSA wetland complex provides an ideal system to explore the relative influences of internal and external processes affecting biotic components of naturally functioning, depressional wetlands. Wetland communities, e.g., aquatic invertebrates, amphibians, and birds, have been continuously monitored since 1992. In addition to community data, a detailed account of each wetland’s hydrologic variability has been documented through long-term monitoring of surface water extent and vegetation zones (LaBaugh et al., 1987; Winter, 2003). Using their original 1967 classification, Stewart and Kantrud (1967) classified half (N = 8) of the CLSA wetlands as permanently ponded and half (N = 8) as temporarily ponded. This classification separates the CLSA wetlands that typically contain water throughout the year (hereafter referred to as P wetlands) from those that annually cycle between ponded and dry (hereafter referred to as T wetlands) (Winter, 2003; LaBaugh et al., 2018).
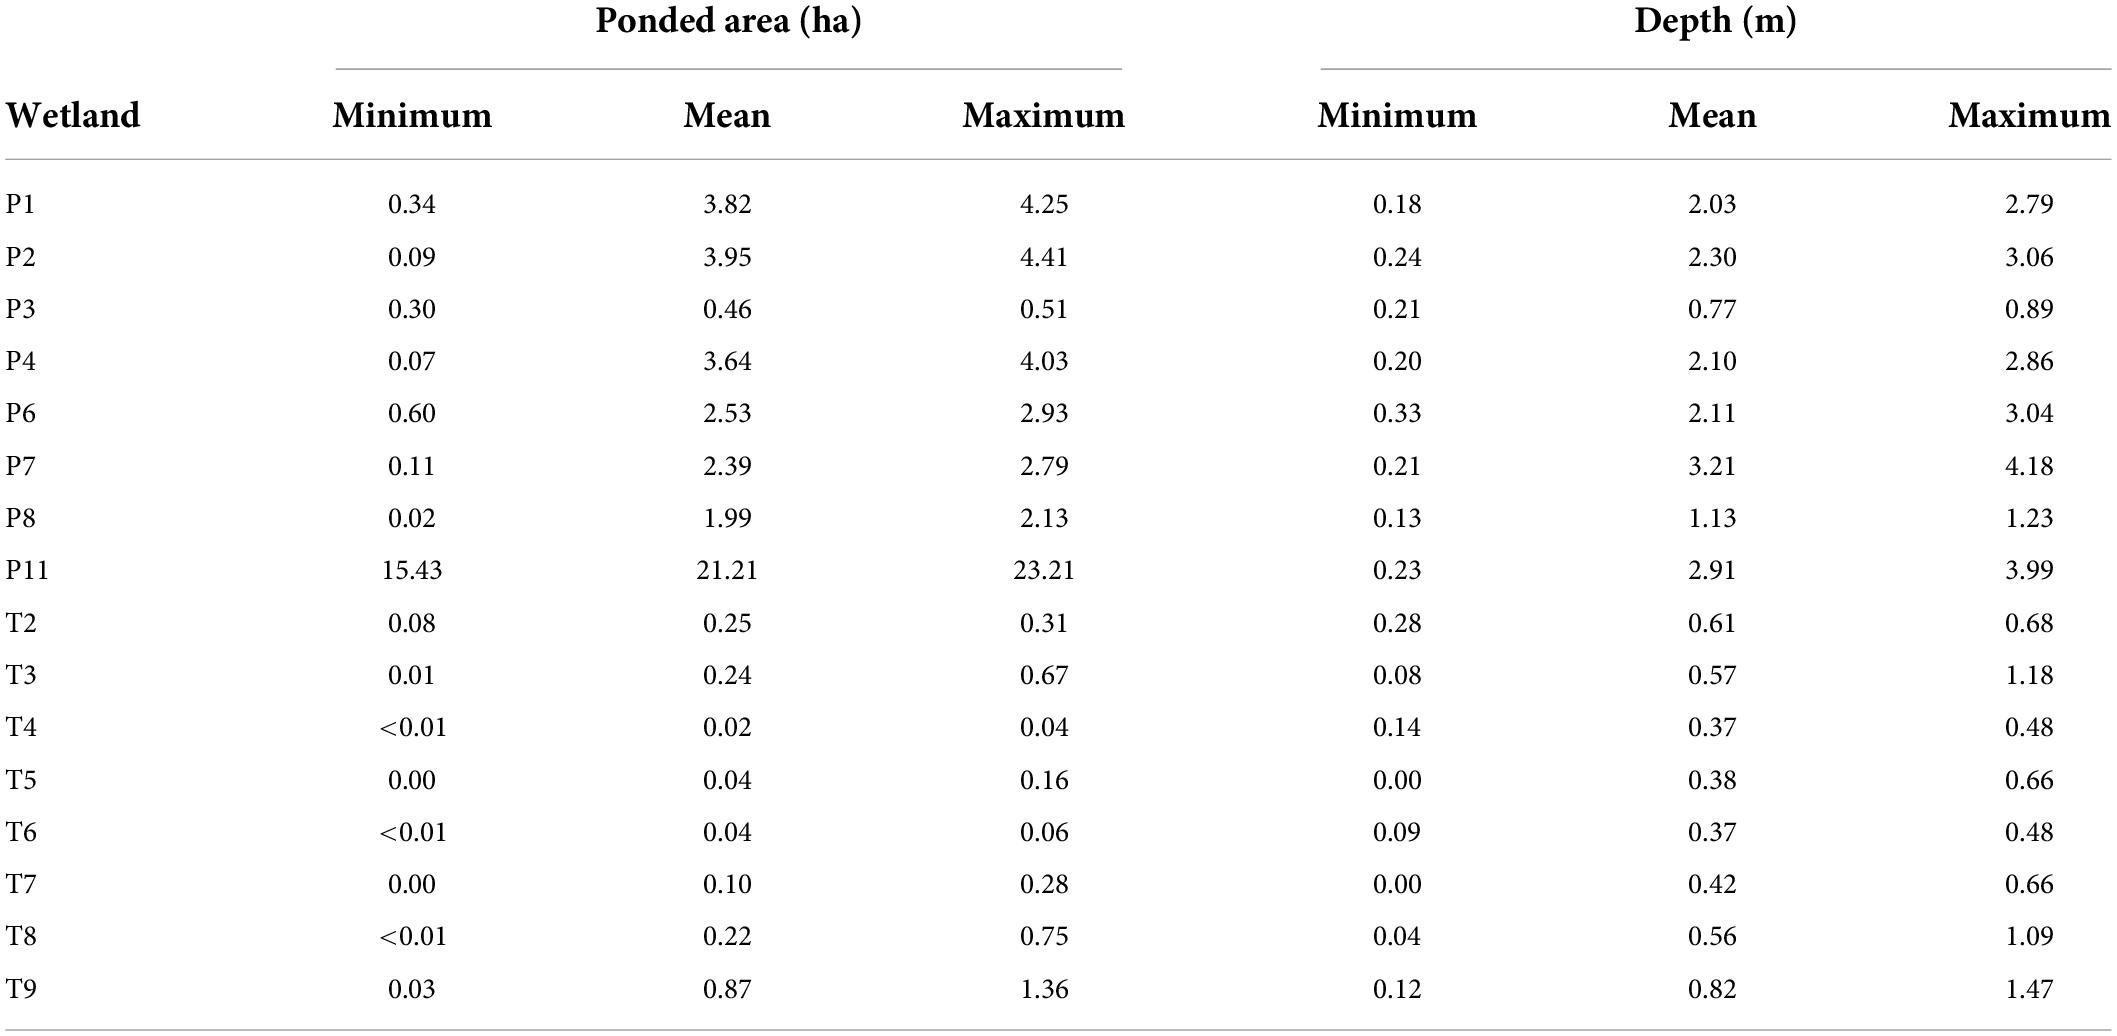
Table 1. Summary of observed maximum annual ponded-water area and depth for 16 prairie-pothole wetlands monitored at the Cottonwood Lake study area, North Dakota, from 1992 to 2015.
Data
Water-level and aquatic-invertebrate data from the CLSA were collected from 1992–2015, the period that coincides with the availability of aquatic-invertebrate monitoring data. All long-term, wetland-monitoring data from the CLSA are openly available from the U.S. Geological Survey through the Missouri Coteau Wetland Ecosystem Observatory at: https://www.sciencebase.gov/catalog/item/579bc7ace4b0589fa1c982be.
McLean et al. (2019) found that three hydrologic-related variables (temporal shifts in the variability of ponded-water depth, the proportion of wetland ponded, and the proportion of open-water area in a wetland) coincided with shifts in aquatic-invertebrate community composition. The shifts in temporal variability indicated two hydrologically distinct time periods, 1992–1999 and 2000–2015, that were referred to as the “filling” and “post-filling” period, respectively. The same three hydrologic variables were used in this study to relate the spatial and temporal shifts in hydrologic variability to potential shifts in temporal coherence of communities. Although amphibian and bird communities in prairie-pothole wetlands also show variation along wetland hydroperiod and vegetation gradients (Elliott et al., 2020; McLean et al., 2021), but we chose to restrict our analyses to invertebrate communities because they are less transient than bird communities and have a more ubiquitous distribution among our wetlands than the amphibian taxa.
Wetland ponded-water depths were manually recorded weekly from staff gauges installed within the ponded portion of each CLSA wetland. The data were summarized by the maximum water depth recorded each year. The proportion of a wetland ponded was calculated by using each wetland’s maximum water-surface elevation overlaid as a plane onto a digital elevation model (DEM) of the wetland (Mushet et al., 2016, 2017a) using ArcGIS (Esri, 2011). Ponded water area was calculated from each water-surface-elevation plane overlay. This value was then divided by the maximum surface-water area recorded (1979–2015) for each wetland. Proportion of open-water area was quantified from annual vegetation-zone delineations (Mushet et al., 2017b). Wetland vegetation zones (wet meadow, shallow marsh, deep marsh, and open water) were delineated annually for all CLSA wetlands using aerial photographs of each wetland acquired during mid-summer using a digital camera at altitudes of photography ranging from 300-m to 1,500-m above ground level (AGL). Aerial photographs were georeferenced using computer databases and vegetative zones delineated using ArcMap (Esri, 2011). From these data, the proportion of the wetland that was identified as open water, i.e., the total area of open water divided by the total area of all wetland zones combined, was calculated.
Aquatic invertebrates were sampled monthly at each CLSA wetland. Typically, sampling started in April and ended in September. Aquatic invertebrates were sampled using vertically oriented, funnel traps (Swanson, 1978) that were randomly distributed within each distinct vegetation zone (N = 4) along three transects (Mushet et al., 2017c). Monthly samples were collected and stored in 80% EtOH and subsequently transported to a U.S. Geological Survey laboratory in Jamestown, North Dakota, for storage and later processing. Sample processing consisted of sorting to separate invertebrates and debris, identification of invertebrates to the lowest feasible taxonomic resolution (typically genus), drying invertebrates to a constant weight at 60°C, and weighing to obtain a biomass measurement (Mushet et al., 2017c,2018). Aquatic-invertebrate data were summarized by mean annual abundance and mean annual biomass for each sampling season.
Data analyses
Prior to examining temporal coherence of wetland hydrologic conditions and aquatic-invertebrate communities, metrics were calculated for each wetland that characterized different aspects of the aquatic-invertebrate communities. Invertebrate alpha diversity, measured as taxon richness (number of unique taxa), and invertebrate biomass were calculated for each wetland annually. The same two metrics were also calculated separately for matrices containing only insect taxa and non-insect taxa. Non-metric multidimensional scaling (NMDS) was used to measure temporal turnover (i.e., beta diversity) of aquatic-invertebrate community compositions. NMDS-derived measurements of shifts in invertebrate community composition (axis coordinates) were quantified from aquatic-invertebrate presence-absence data. Sørensen based dissimilarities were used on the presence-absence data to create the NMDS models using the metamds function in the “vegan” R package (Oksanen et al., 2015). Derivation of final NMDS axes was determined by finding the lowest dimensional model solution with a stress value < 0.20 and a stress reduction < 0.50 when an additional dimension is added (Clarke, 1993; Peck, 2011).
Temporal coherence of hydrologic and invertebrate variables was examined for all 16 wetlands sampled annually over the 24-year duration of the study. The temporal coherence of two subsets of wetlands, the T wetlands (n = 8) and the P wetlands (n = 8), were also quantified separately for further comparison. McLean et al. (2019) found that two P wetlands (P-03 and P-08) had more stable water regimes and lower aquatic invertebrate beta diversity than other wetlands as a result of defined drainages that function as surface-water outlets that mediate water depth during high conditions, which made them less responsive to changes in climate. We classify the aforementioned wetlands with surface water outlets as permanently ponded, open-basin wetlands (hereafter OB wetlands). Coherence values were compared for P wetlands with and without the two permanently ponded “open-basin” wetlands. How levels of temporal coherence correspond to shifts in hydroclimatic variability was assessed by grouping wetlands into two hydrologically distinct periods, the filling period (1992–2000) and the post-filling period (2001–2015). Temporal coherence was measured using the intra-class correlation coefficient, ri, as described in Rusak et al. (1999). We used intraclass correlation to measure temporal coherence for this study because it is not restricted to pairwise comparisons, it can be used when independent and dependent series are used in pairwise comparisons, and missing data can be accommodated (Haggard, 1958; Zar, 1984; Rusak et al., 1999). This is especially important for wetland abiotic and biotic data because there might be “zero” values if wetlands were dry during a sampling season, which would eliminate the pairwise comparison. Using output from two-way, Type-II ANOVA models without replication, ri was calculated as follows:
For this equation, MST is the mean sums squared of time (sampling year), MSE is the mean square of the error, and n is the number of wetlands used in the corresponding ANOVA model (16 wetlands, 8 temporarily ponded, and 8 permanently ponded). By using a two-way ANOVA we were able to factor variation of invertebrate metrics due to differences among wetlands (Rusak et al., 1999). The resulting ri values range from −1/(n−1) to 1 (Zar, 1984). Values that are closer to 1 indicate measured variables are more synchronous, and as values decrease the variability between wetlands within years becomes greater than between years (Rusak et al., 1999). As intraclass correlation assumes variables are normally distributed (Zar, 1984), aquatic-macroinvertebrate biomass data were log(x + 1) transformed. All variables were standardized to z-scores (mean = 0, standard deviation = 1), except the NMDS axis scores (coordinates), which were already normally distributed. When derived from z-score transformed data, the ri value is analogous to the mean pairwise Pearson’s correlation coefficient for all wetland by year combinations (Haggard, 1958). Fisher’s Z-test (Fisher, 1915) was used to statistically assess whether the temporal coherence among wetlands, measured as ri, for each measured variable was significantly greater the null value of 0 (Angeler and Johnson, 2012). For the Fisher’s Z-test we used right-tailed correlation test of significance, whereas the rejection region is located on the extreme right of the distribution (i.e., positive values close to 1). Standardized values of the hydrologic and biotic variables assessed were plotted for each wetland over time to provide visual representations of temporal fluctuations among wetlands.
Results
A total of 355 uniquely identified, wetland-invertebrate taxa were observed during the period of study and used in these analyses. Annual invertebrate richness and mean annual invertebrate biomass measurements for each wetland ranged from 5 to 55 uniquely identified taxa (Table 2) and 0.01 to 10.5 grams, respectively. A two-dimensional solution was obtained for the invertebrate presence-absence (Sørensen dissimilarities) derived NMDS model (stress = 0.19, Supplementary Figure 1). We generated axis scores for the first two axes that were derived from each sample’s (wetland by year combination) coordinates along the first two NMDS axes. Temporal fluctuations in wetland depth (m), proportion ponded, and proportion of open-water area for all 16 CLSA wetlands exhibited spatially synchronous patterns between 1992 and 2015 (Figure 2 and Table 3). Fisher’s Z-test indicated the intraclass correlation values for depth, proportion of wetland ponded, and proportion of open-water area (0.51, 0.52, and 0.65, respectively) were significantly greater than zero (alpha = 0.05, Table 3). When broken down by hydrologic regime and hydrologic period, ponded water fluctuations in P wetlands were more coherent than in T wetlands. Additionally, among-wetland synchrony for all 16 wetlands was greater during the “filling” period than during the “post-filling” period (Figure 2 and Table 4).
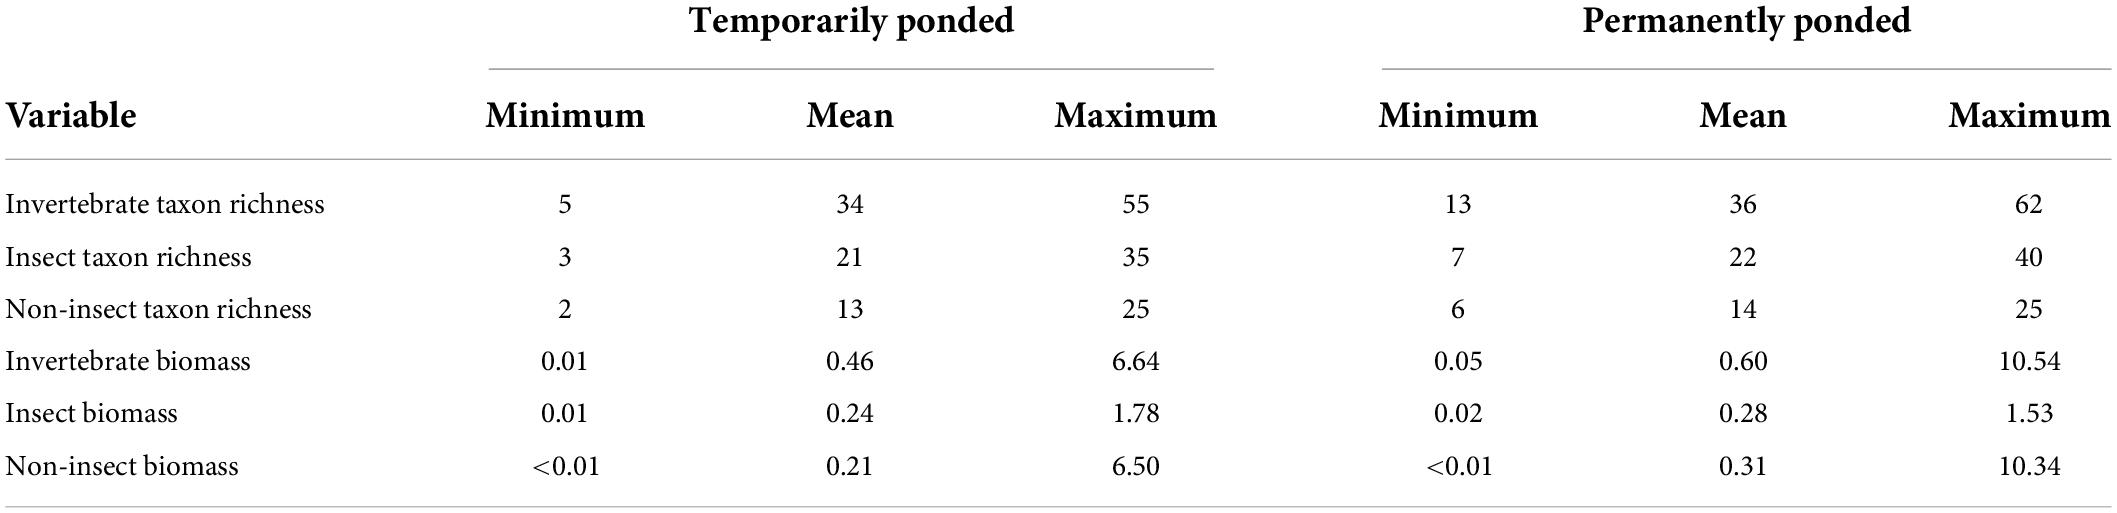
Table 2. Among wetland annual variability of total invertebrate, insect only, and non-insect only mean taxon richness and biomass for 16 wetlands monitored at the Cottonwood Lake study area between 1992 and 2015.
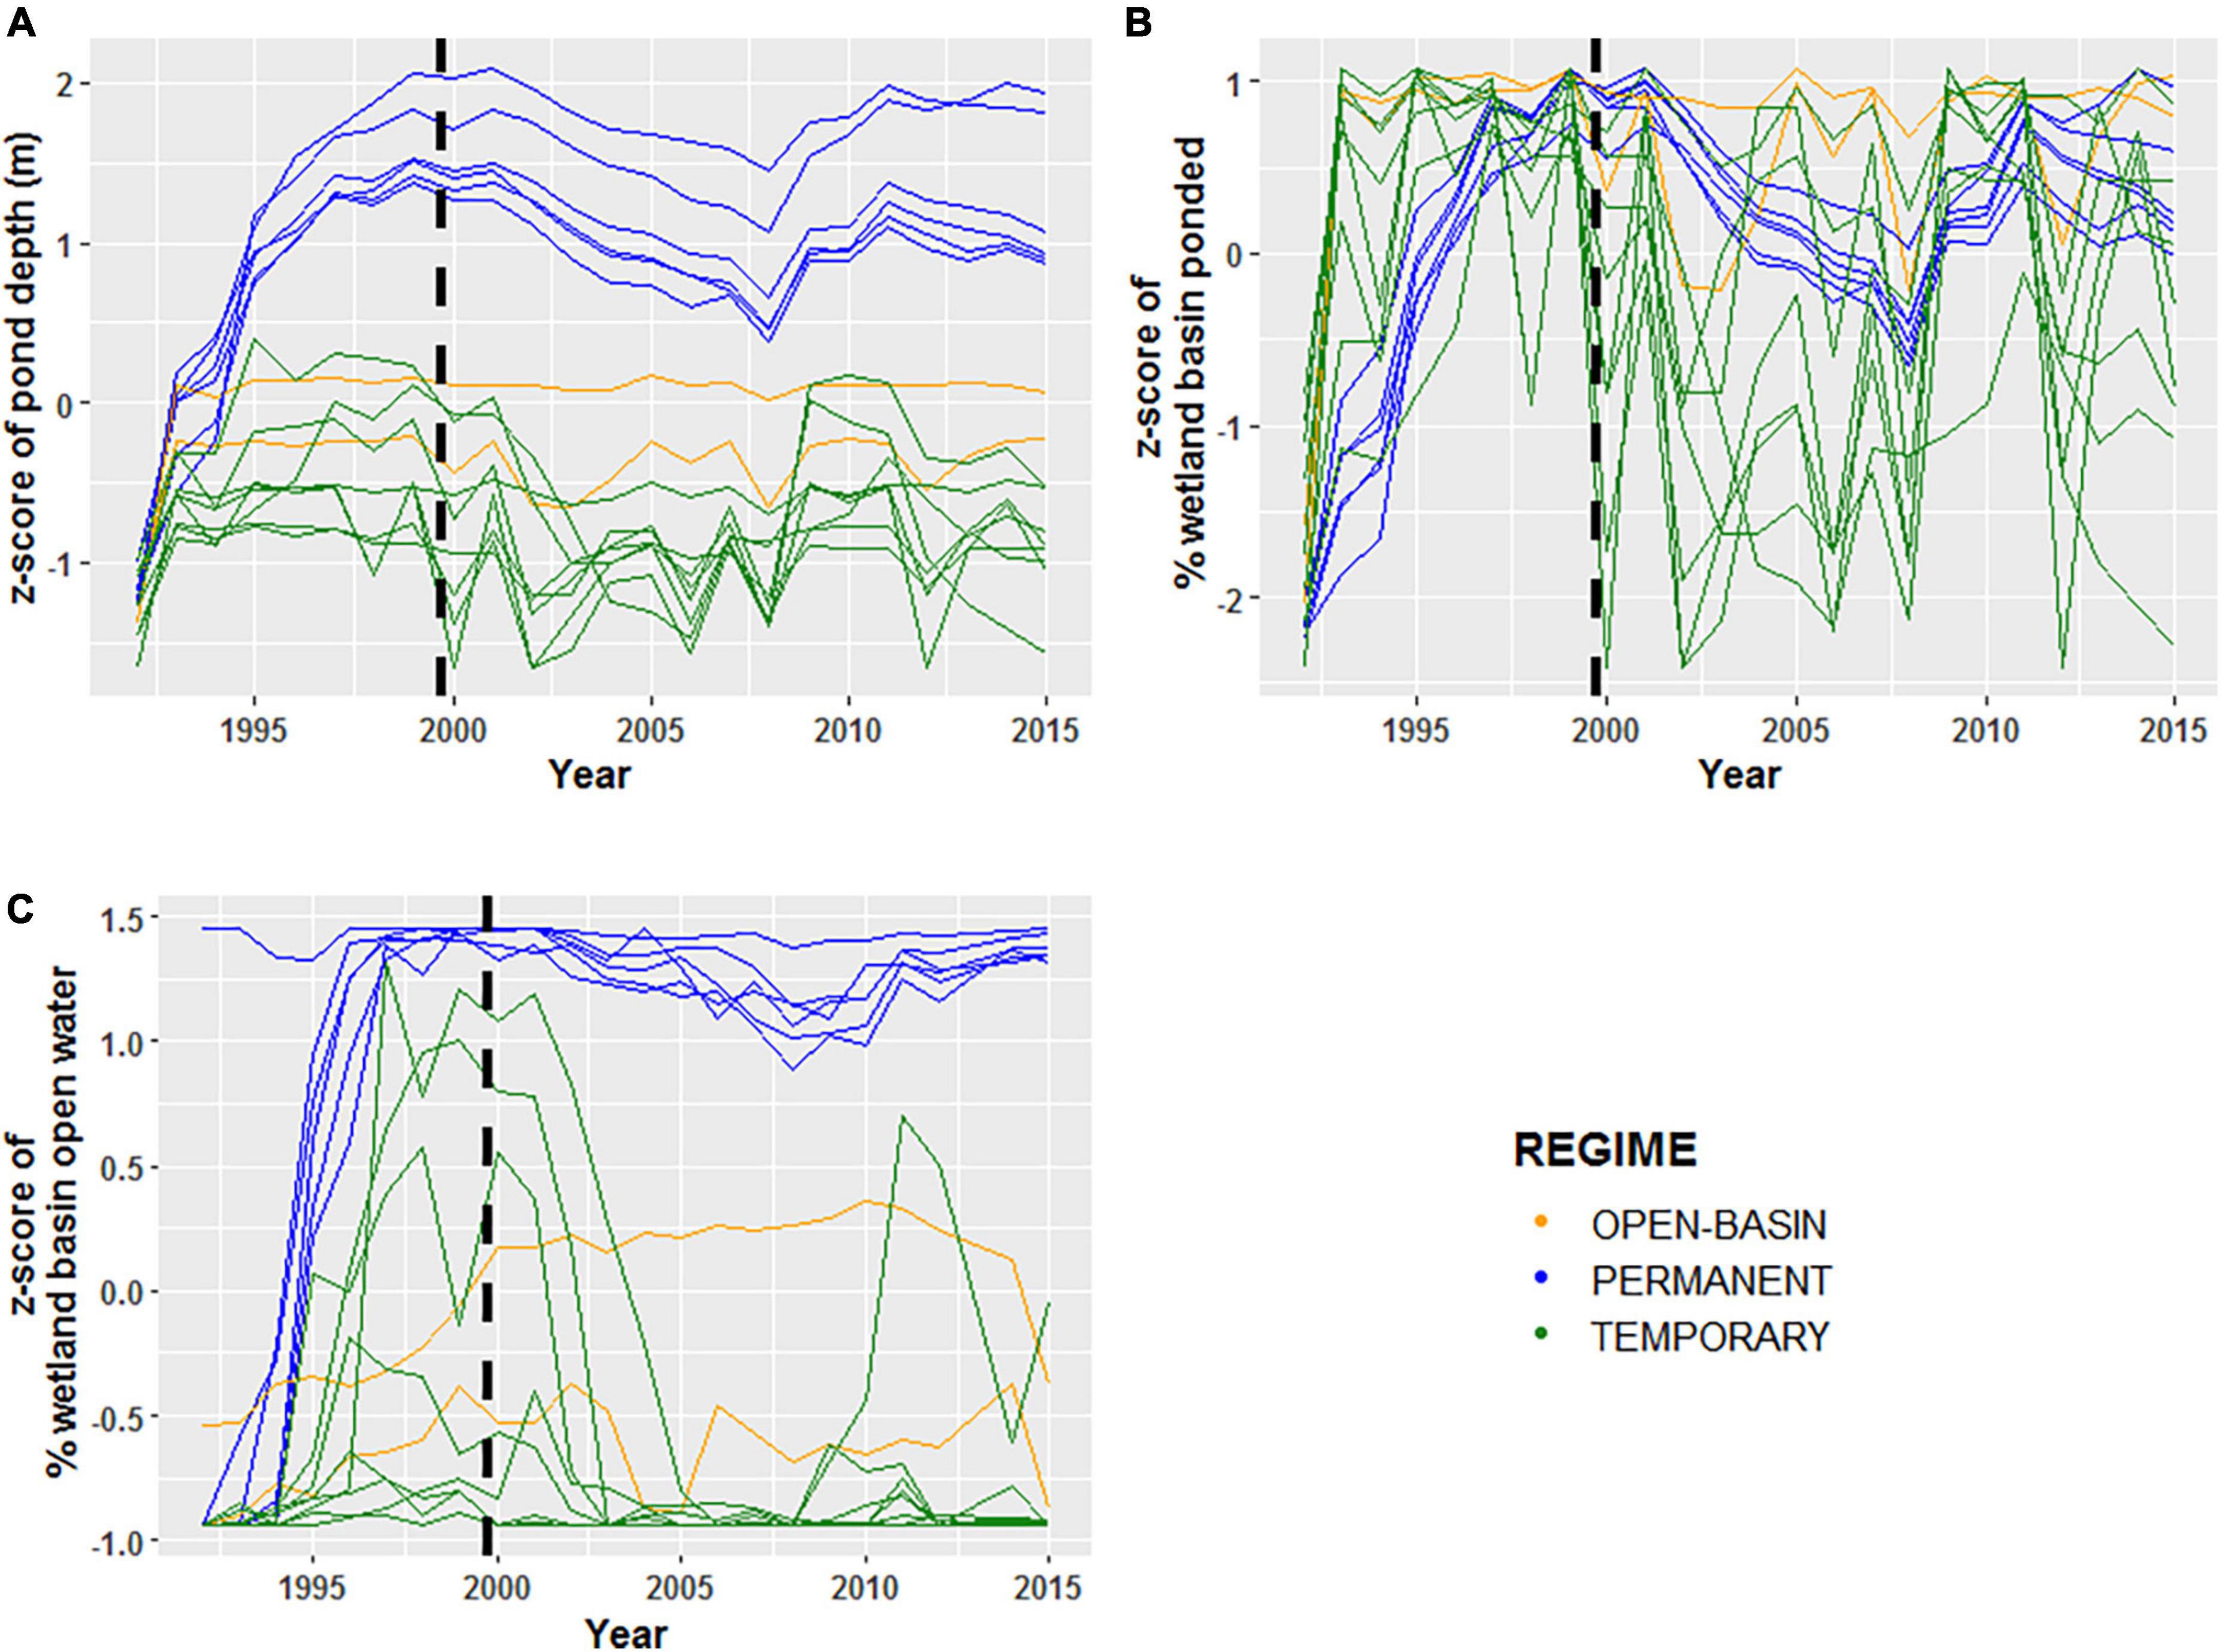
Figure 2. Normalized z-scores of panels (A) maximum observed annual ponded-water depths (m), (B) maximum ponded-water extent (%), and (C) open-water area (%) for 16 Cottonwood Lake study area wetlands sampled from 1992 to 2015. For each plot, green lines represent temporarily ponded wetlands (T wetlands), blue lines represent permanently ponded wetlands with closed basins (P wetlands), and orange lines represent permanently ponded wetlands with open basins (OB wetland). The black dashed lines indicate the transition for the “filling period” (1992–2000) and the “post-filling period” (2001–2015).
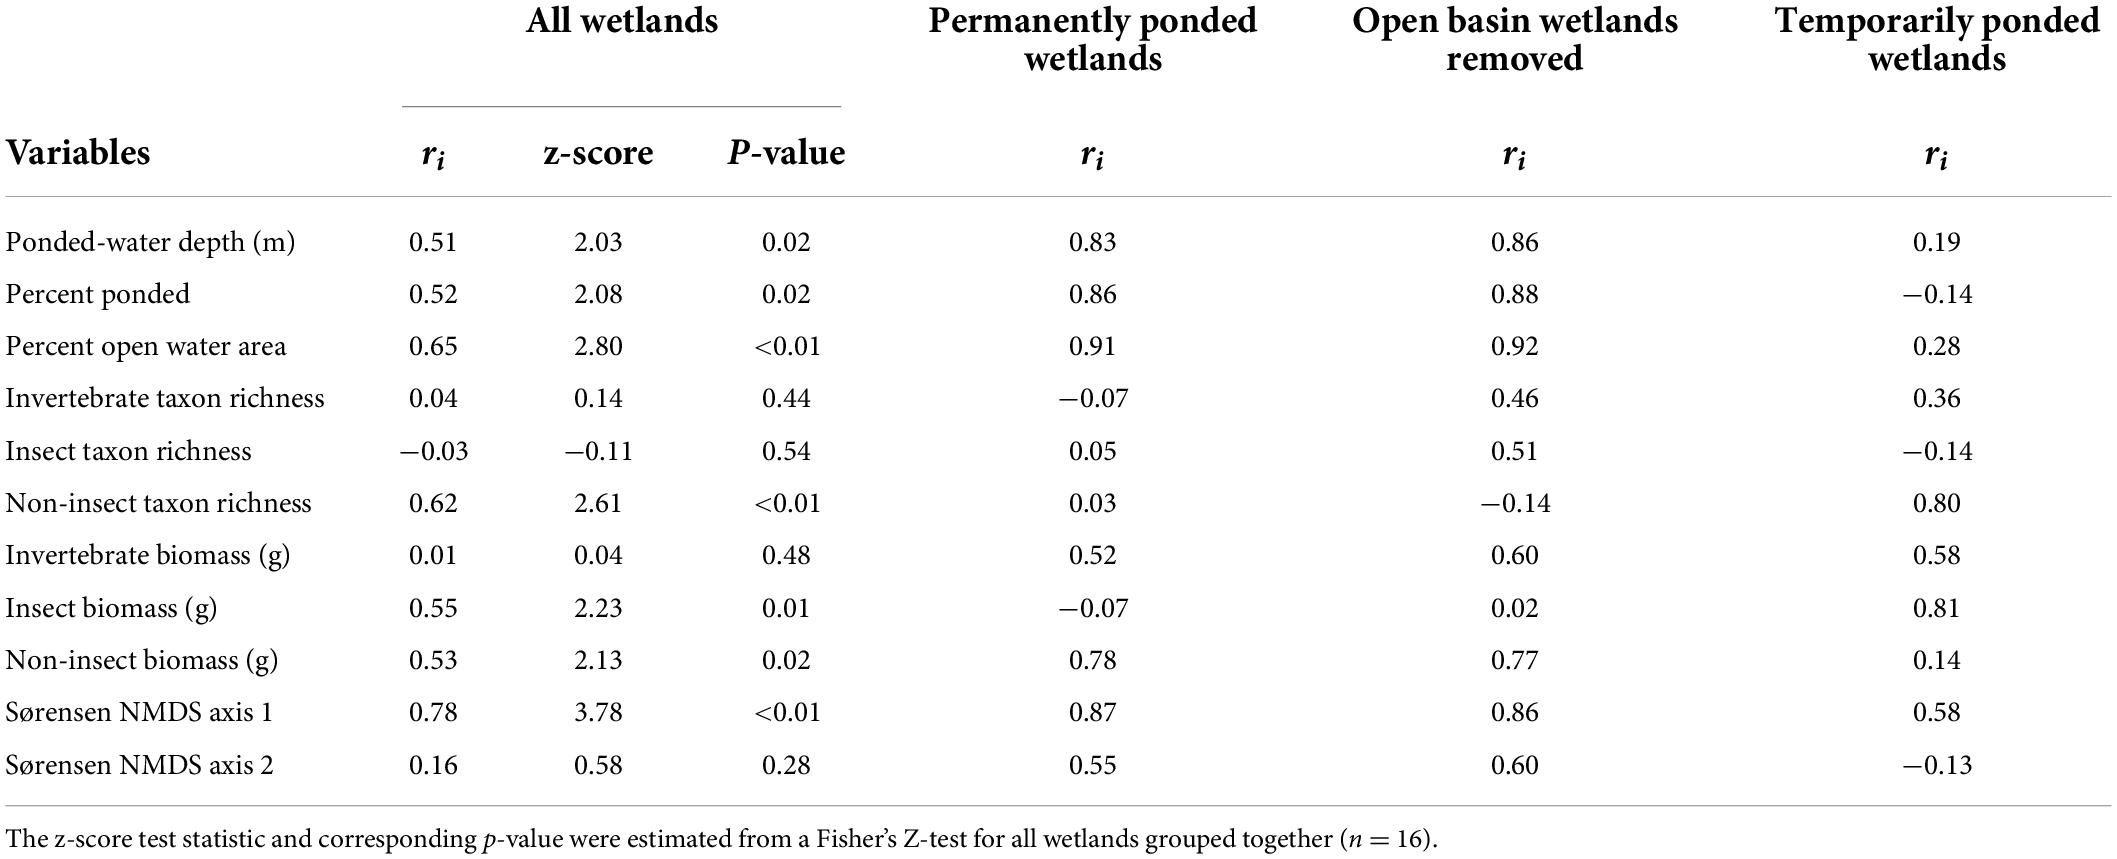
Table 3. Intraclass correlation coefficient (ri) among all wetlands (n = 16), just P wetlands (n = 8), P wetlands excluding OB wetlands (n-6), and just T wetlands (n = 8) sampled annually between 1992 and 2015 (n = 24).
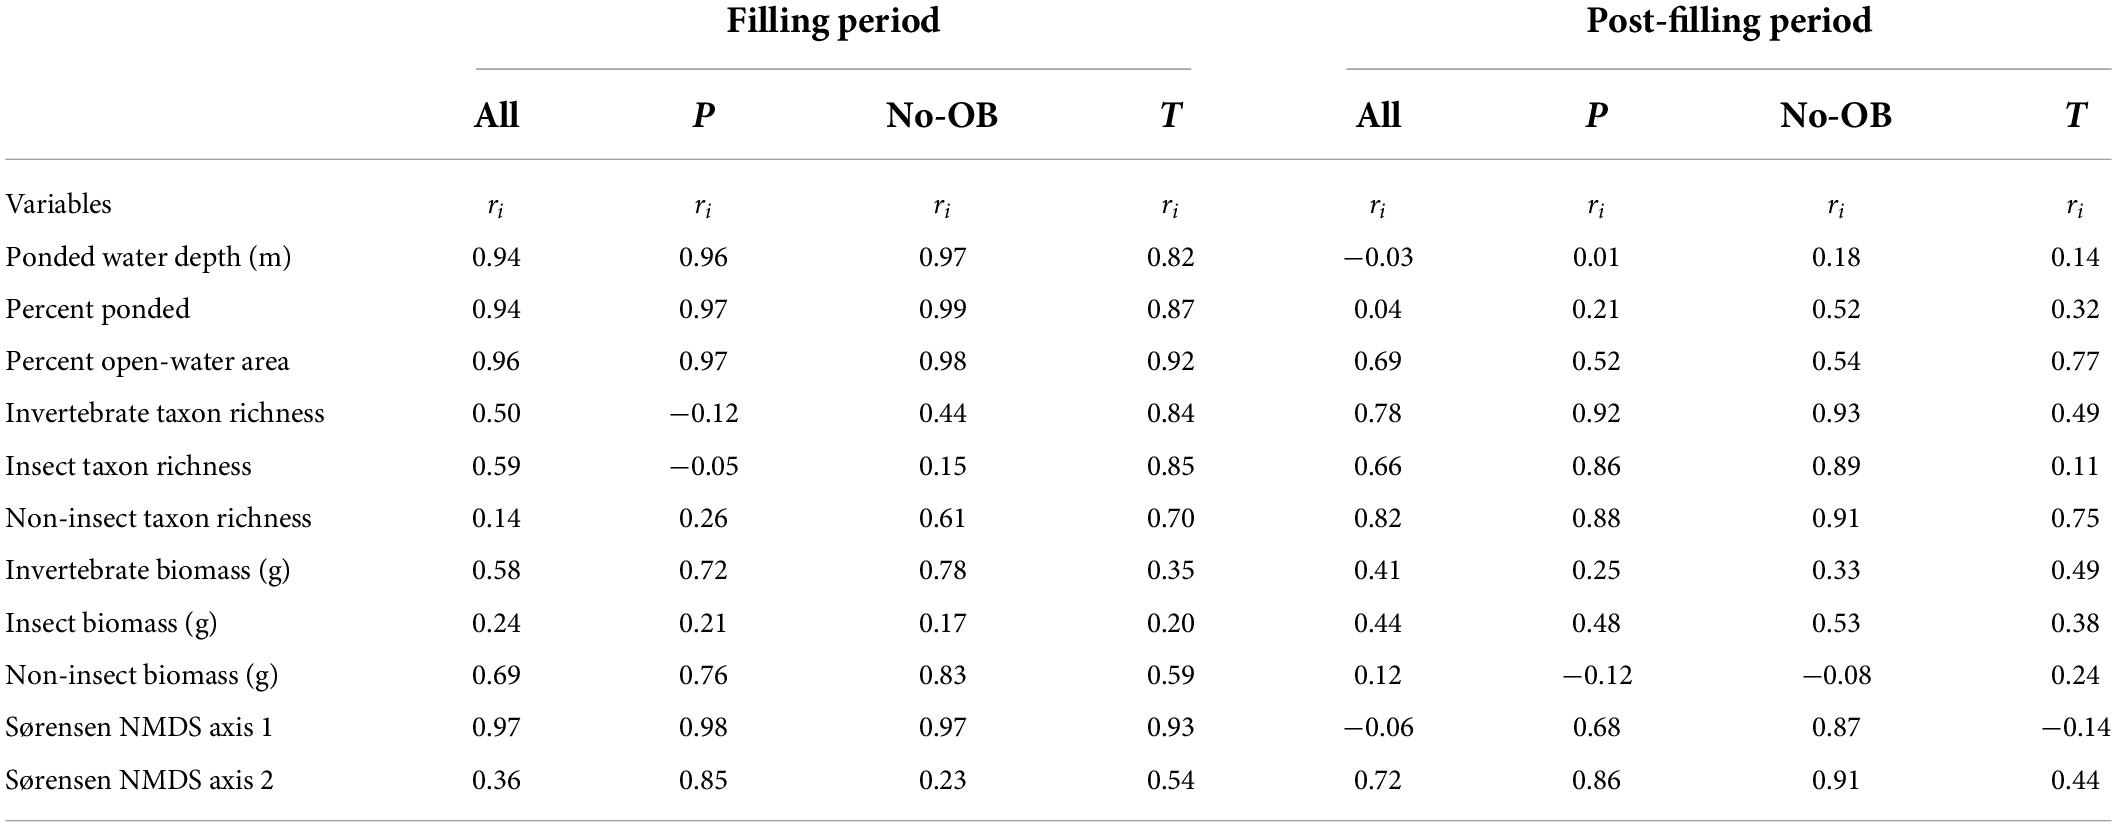
Table 4. Intraclass correlation coefficient (ri) among all wetlands (n = 16), just P wetlands (n = 8), P wetlands excluding OB wetlands (n = 6), and just T wetlands (n = 8) sampled during the filling hydroclimatic period (1992–2000) and the post-filling hydroclimatic period (2001–2015).
Temporal coherence of biotic variables among CLSA wetlands differed depending on the invertebrate community assessed (i.e., all invertebrates, insects, non-insects) and the metric used to characterize it. Using the complete invertebrate dataset for all 16 wetlands over the 24-year period, turnover of community composition, as measured by the NMDS Axes, was typically synchronous among wetlands (Figure 3 and Table 4). The one exception was NMDS axis two, which had a non-significant ri value of 0.16. However, temporal coherence of invertebrate taxon richness and mean annual biomass varied by invertebrate guild (Figures 4, 5 and Tables 3, 4). For example, while insect taxon richness had relatively low, non-significant ri values (ri value = −0.03, P-value < 0.05), non-insect taxon richness and biomass were temporally coherent (ri value = 0.62, 0.53, respectively; P-values < 0.05). Also, biomass for insects (ri value = 0.55) and non-insects (ri value = 0.53) were significantly greater (P-value < 0.05) than a null value of 0 based off of the Fisher’s Z-Test.
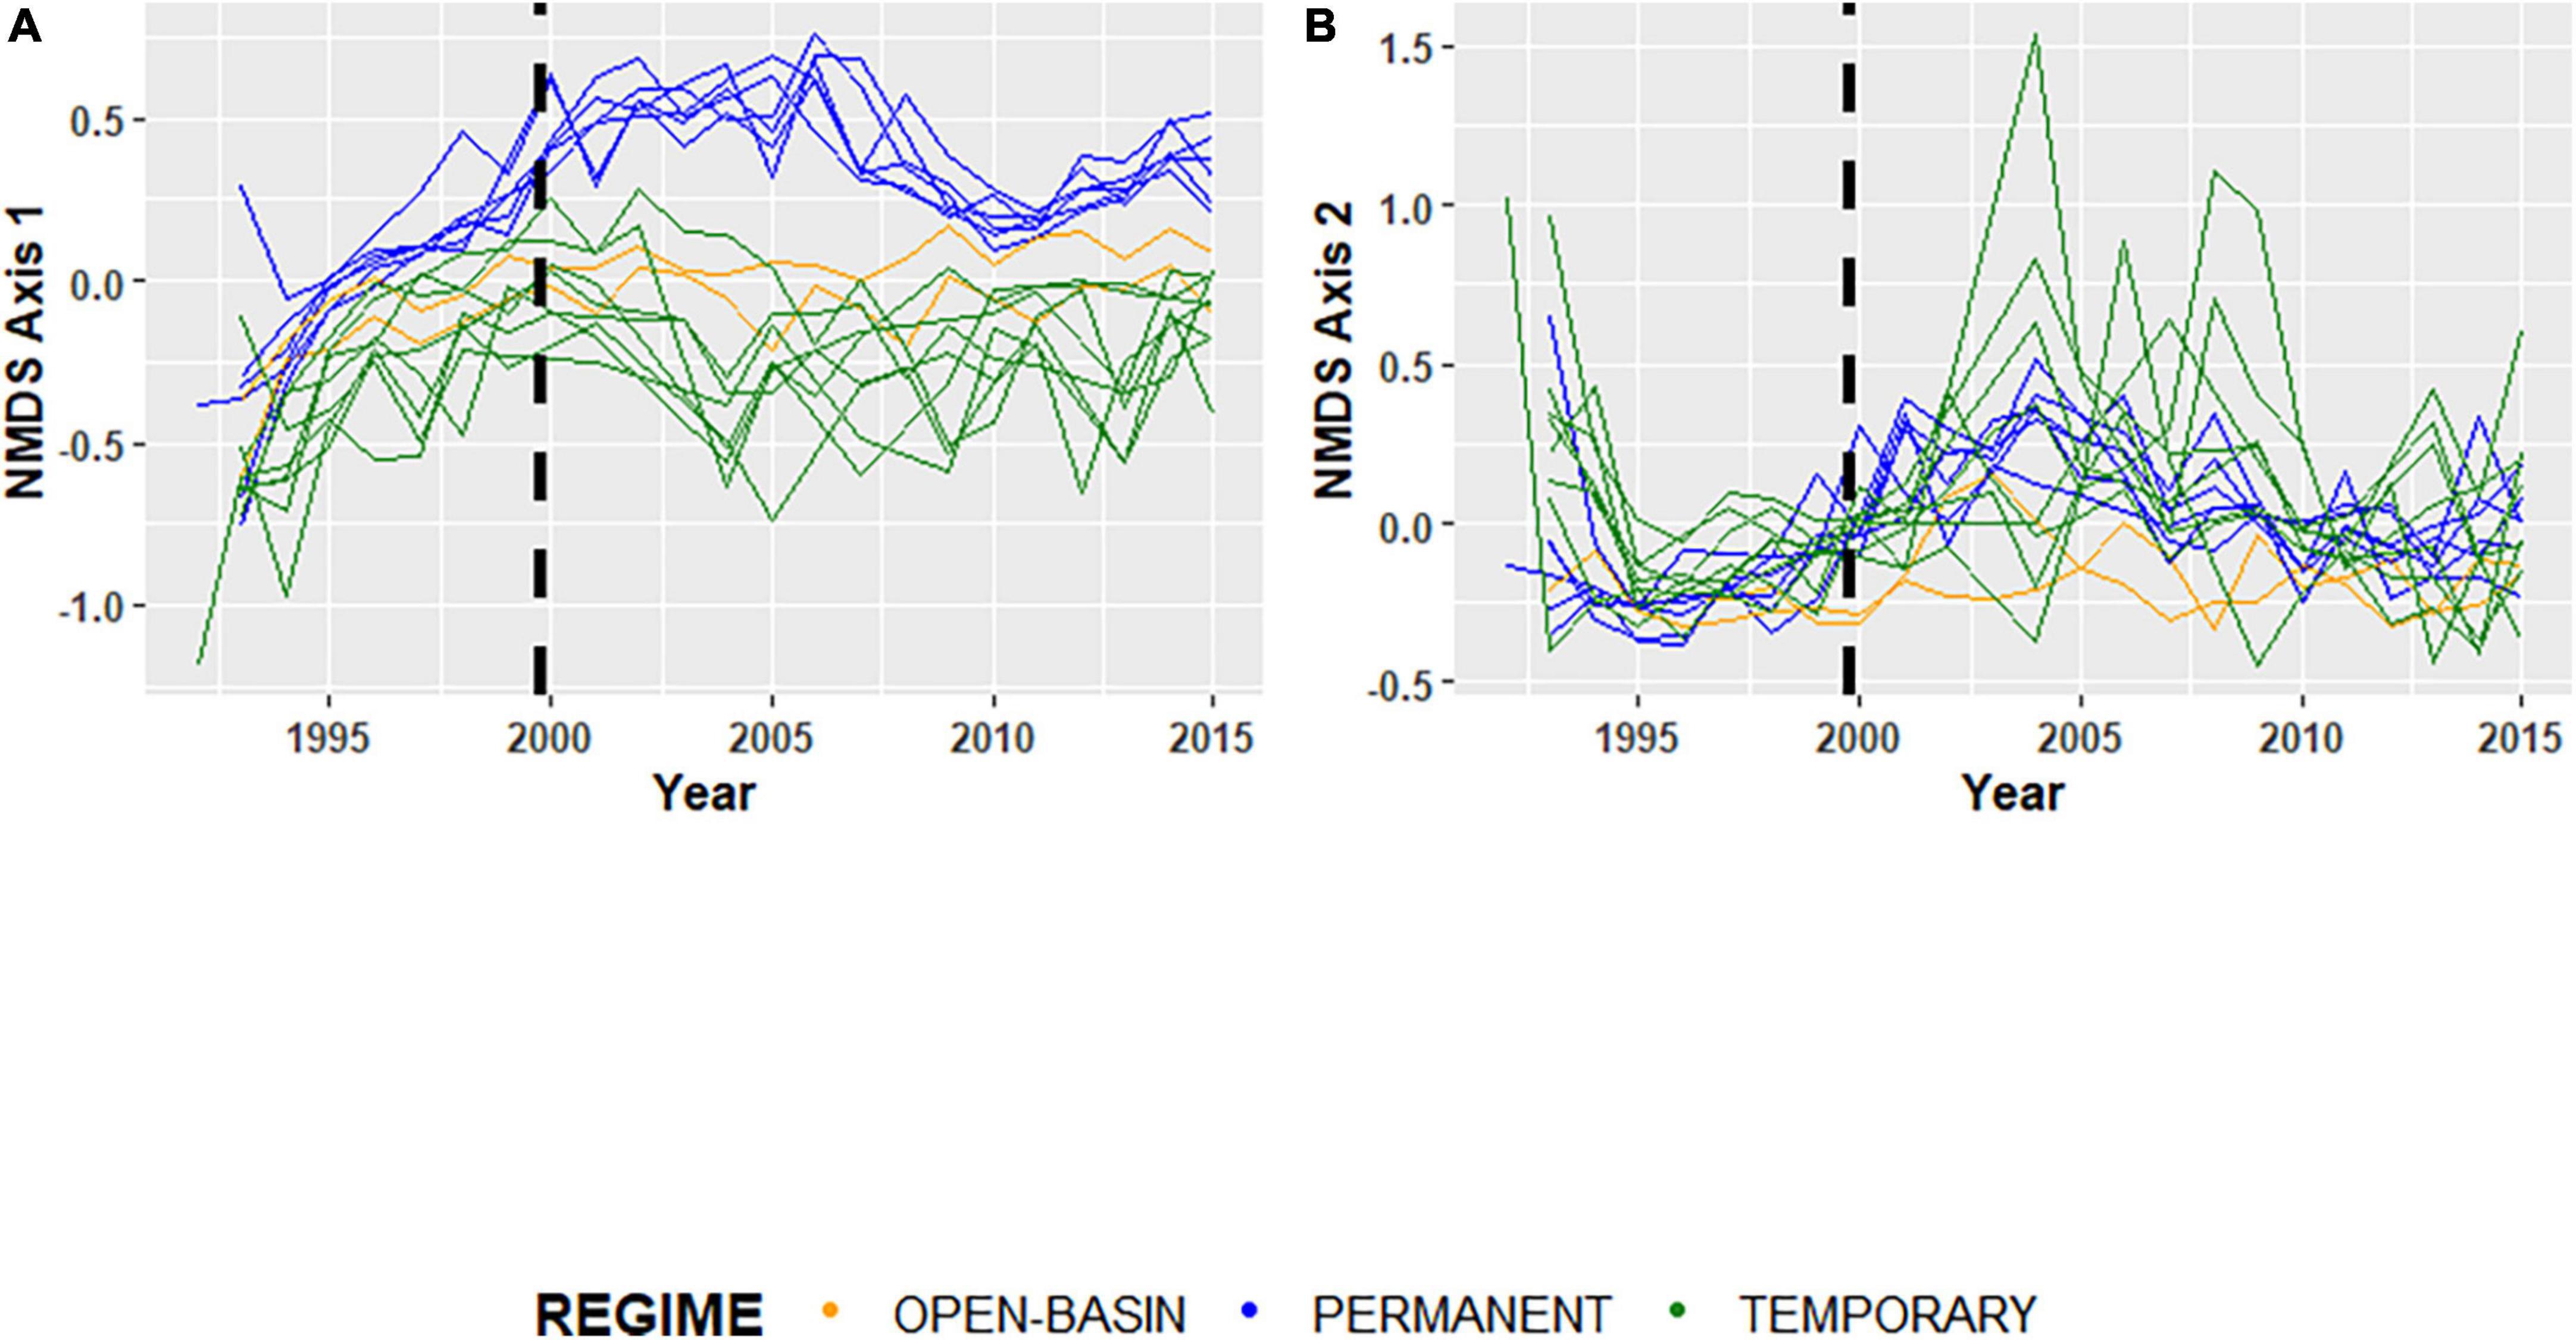
Figure 3. (A) Sørensen dissimilarity based NMDS axis 1 and (B) Sørensen dissimilarity based NMDS axis 2 scored based on invertebrate taxon presence-absences (Sørensen) for 16 Cottonwood Lake study area wetlands sampled from 1992 to 2015. For each plot, green lines represent temporarily ponded wetlands (T wetlands), blue lines represent permanently ponded wetlands with closed basins (P wetlands), and orange lines represent permanently ponded wetlands with open basins (OB wetland). The black dashed lines indicate the transition for the “filling period” (1992–2000), and the “post-filling period” (2001–2015).
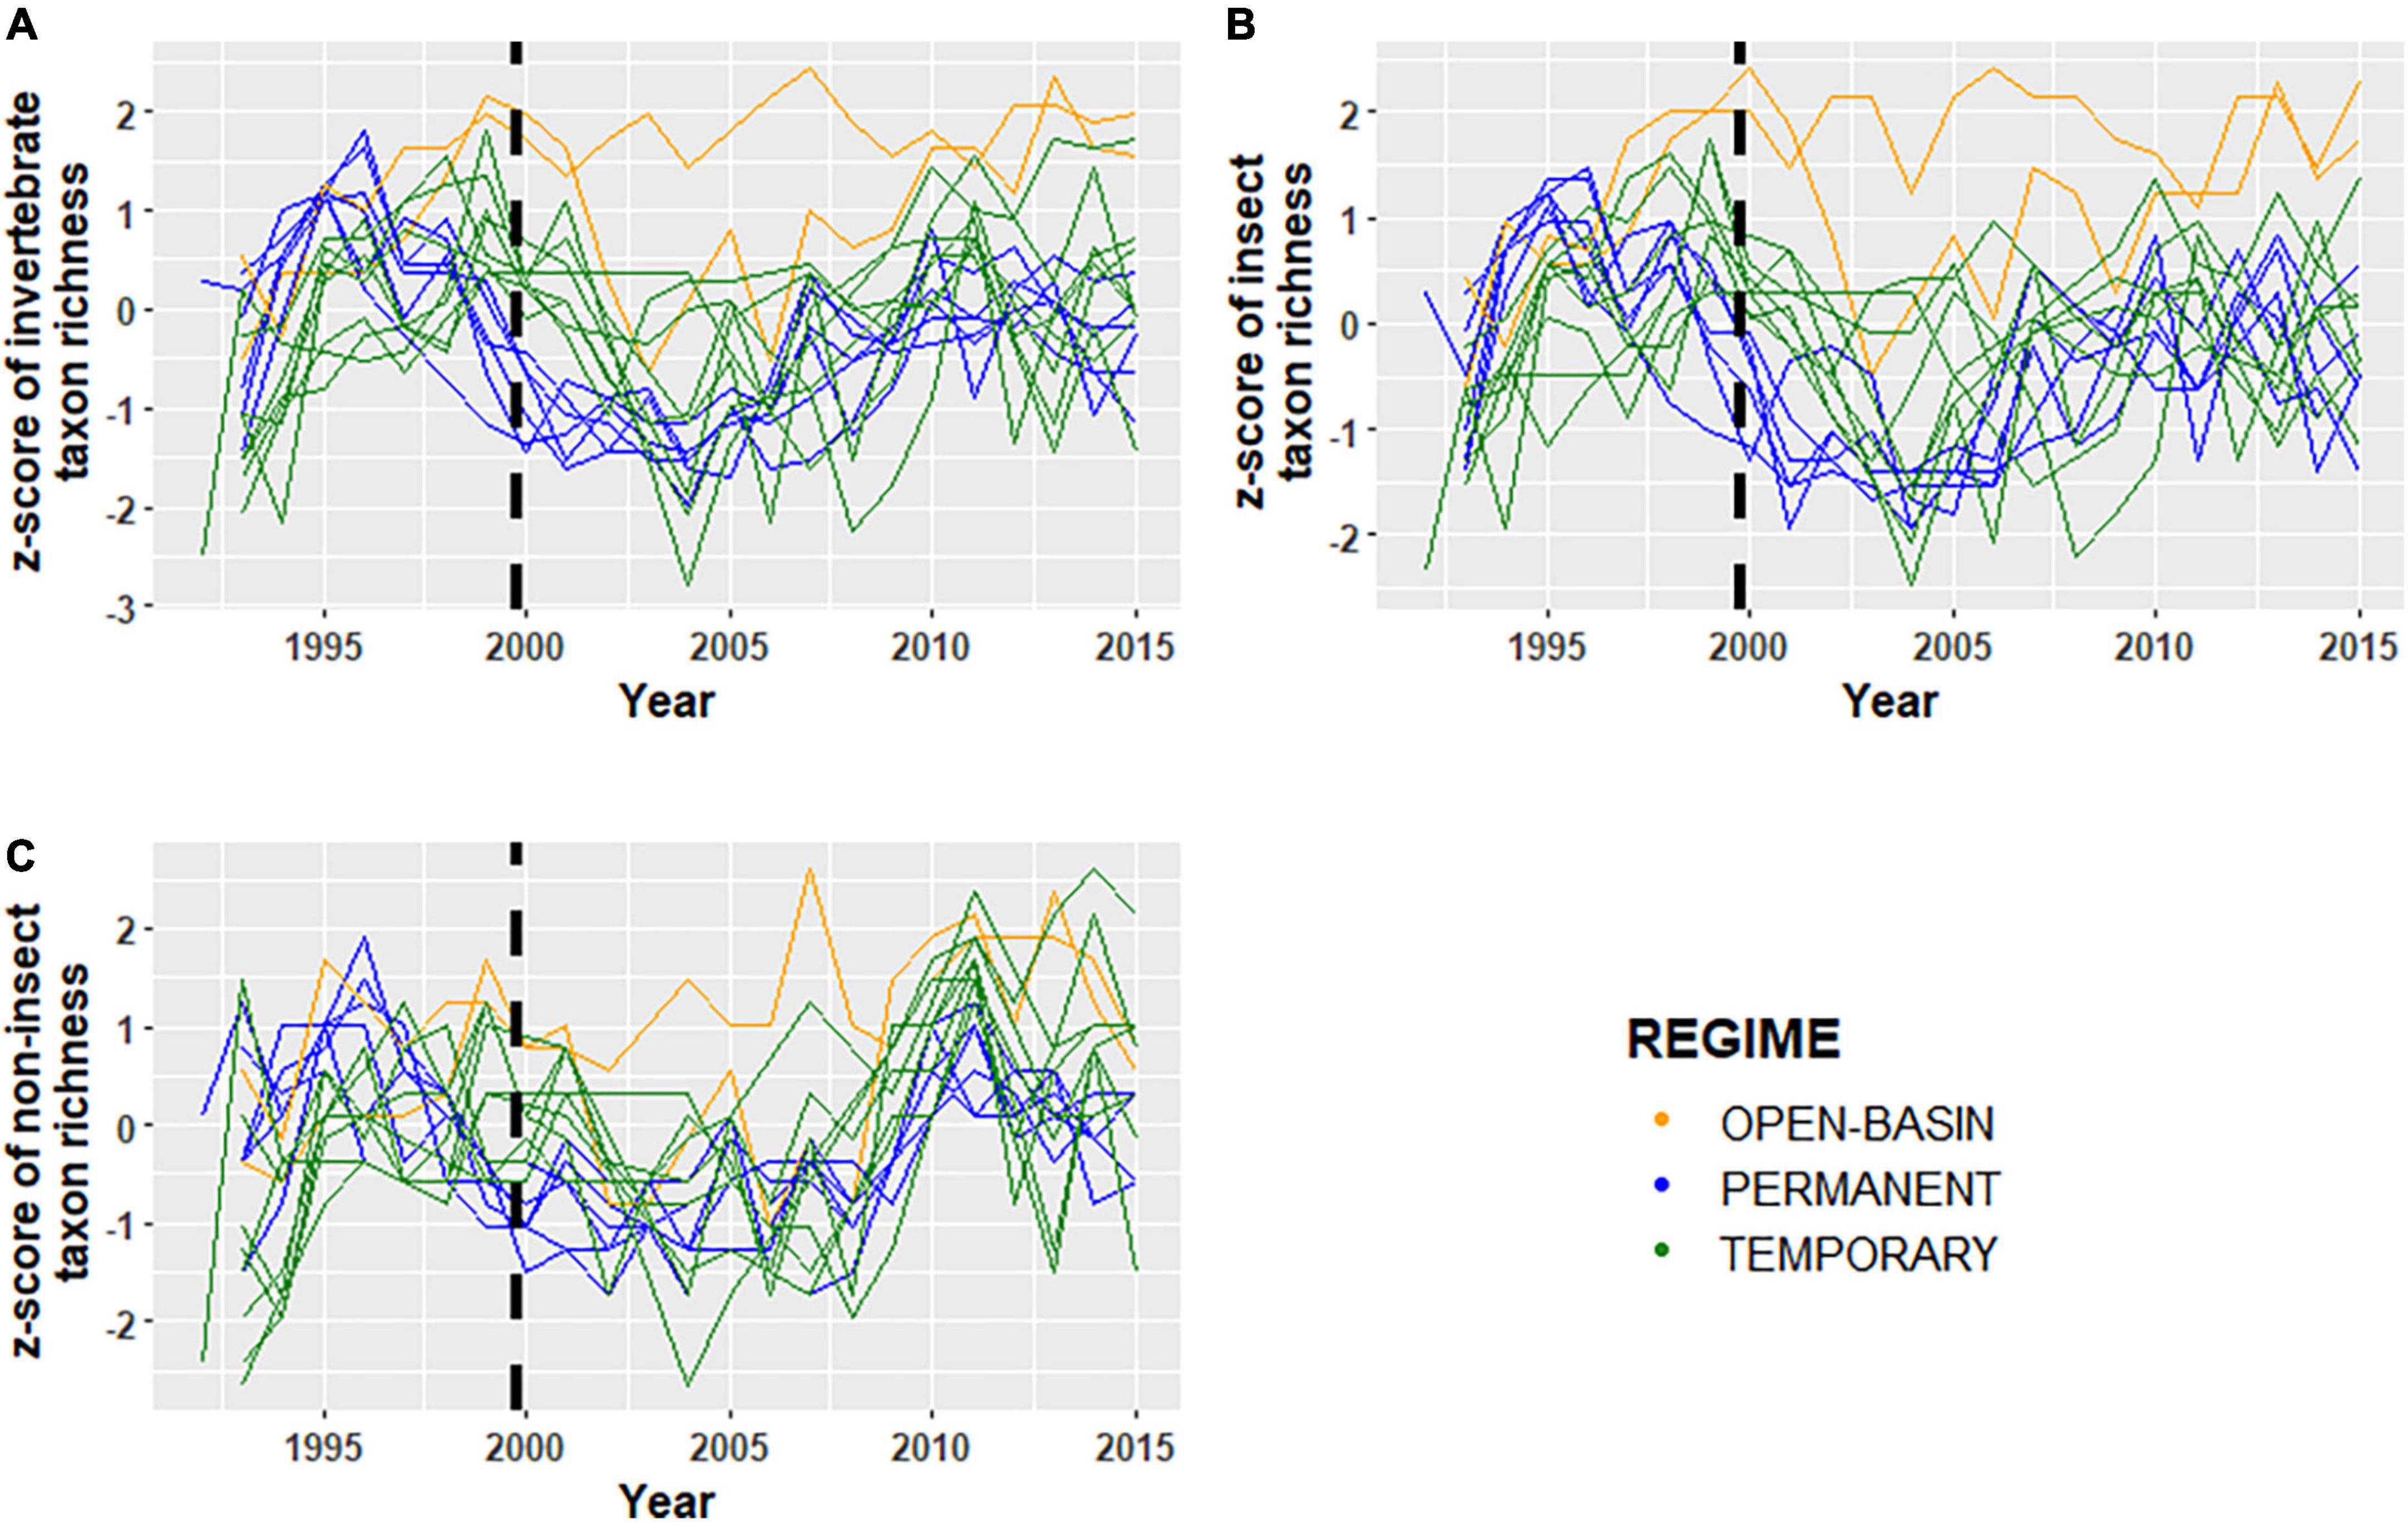
Figure 4. Normalized z-scores of panels (A) total invertebrate taxon richness, (B) insect taxon richness, and (C) non-insect taxon richness for sixteen Cottonwood Lake study area wetlands sampled from 1992 to 2015. For each plot, green lines represent temporarily ponded wetlands (T wetlands), blue lines represent permanently ponded wetlands with closed basins (P wetlands), and orange lines represent permanently ponded wetlands with open basins (OB wetland). The black dashed lines indicate the transition for the “filling period” (1992–2000) and the “post-filling period” (2001–2015).
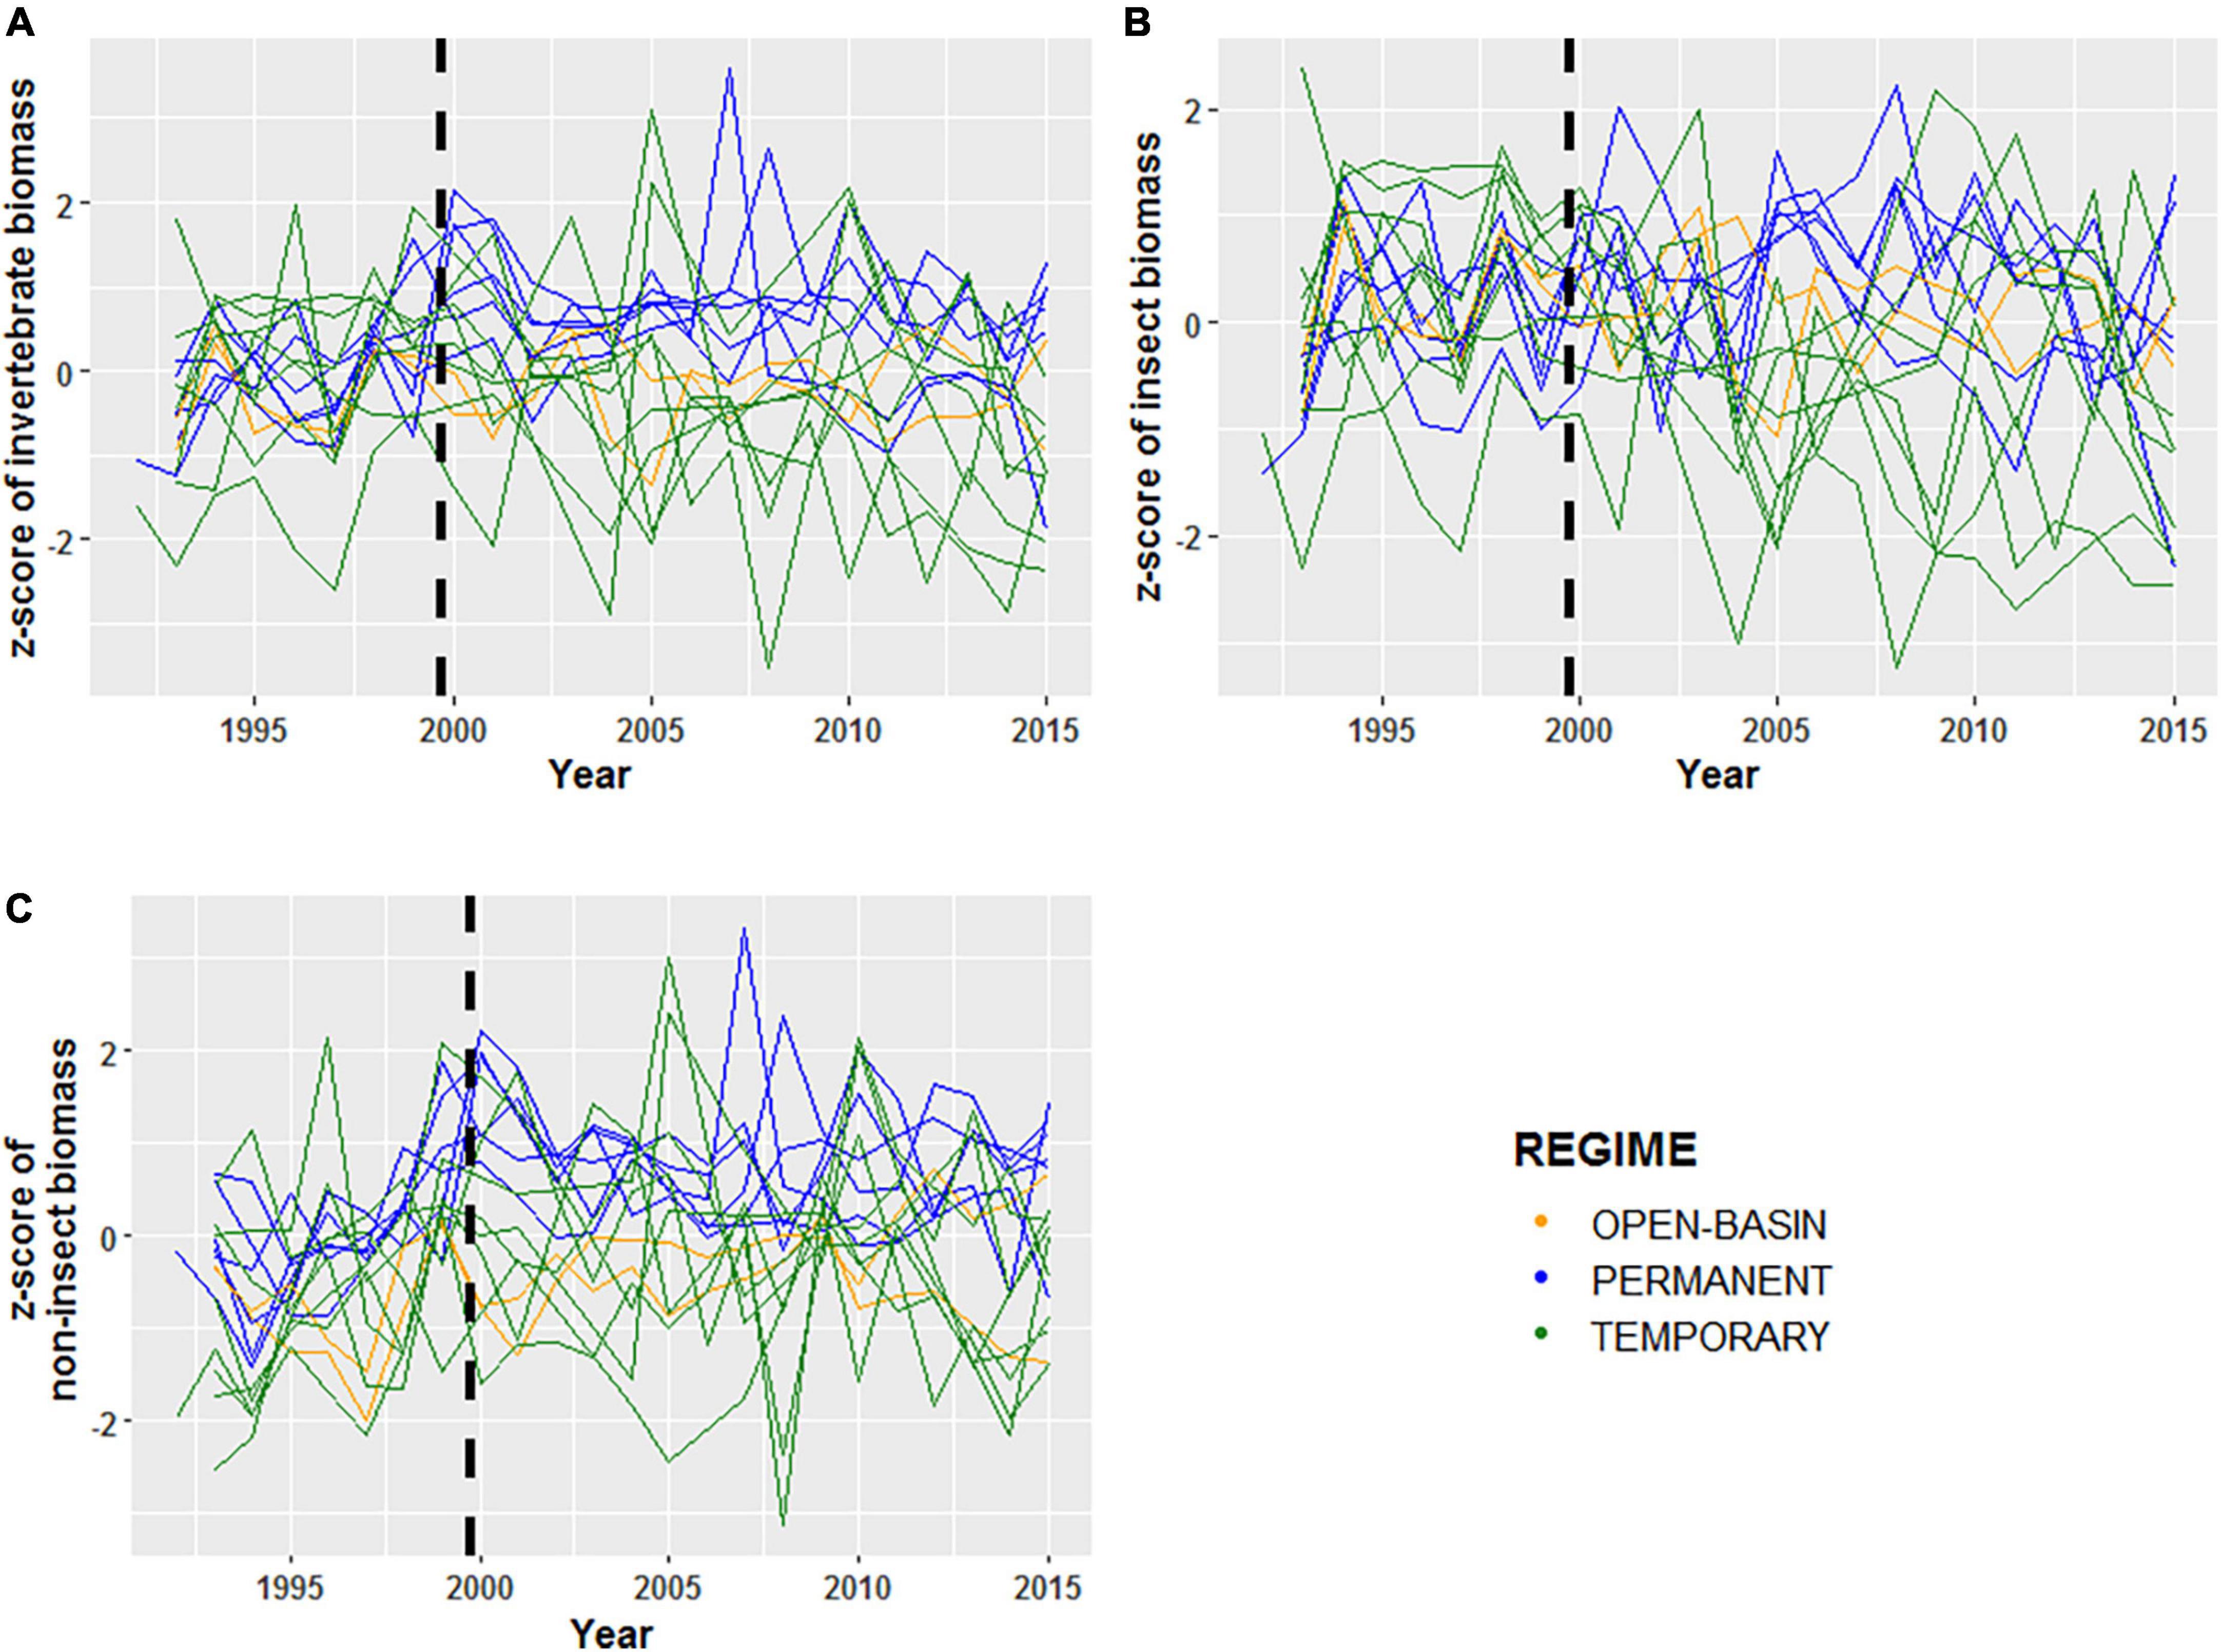
Figure 5. Normalized z-scores of log transformed mean annual (A) invertebrate biomass (g), (B) insect biomass (g), and (C) and non-insect biomass (g) for 16 Cottonwood Lake study area wetlands sampled from 1992 to 2015. For each plot, green lines represent temporarily ponded wetlands (T wetlands), blue lines represent permanently ponded wetlands with closed basins (P wetlands), and orange lines represent permanently ponded wetlands with open basins (OB wetland). The black dashed lines indicate the transition for the “filling period” (1992–2000) and the “post-filling period” (2001–2015).
In addition to community-specific and metric-specific variability in temporal coherence, similar and contrasting patterns of coherence were observed when wetlands were grouped by hydrologic regimes. When using the complete invertebrate datasets, T wetlands and P wetlands had similar, but relatively low, coherence values (ri range = −0.07–0.36; Table 3). When the invertebrate community was broken down into insect and non-insect taxa, ri values were higher for non-insect taxon richness (range = 0.03–0.80) than insect taxa (ri range = −0.14–0.54), with the highest values found among T wetlands (Table 4). For both T wetlands and P wetlands, mean annual biomass measurements among wetlands were similar and relatively synchronous (ri = 0.52 and 0.53, respectively). However, T wetlands had high coherence values for insect biomass (ri = 0.81) and low values for non-insect biomass (ri = 0.14), whereas P wetlands had an opposite pattern with higher ri values for non-insect biomass (ri = 0.78) than for insect biomass (ri = −0.07, Table 4).
The analysis investigating how temporal coherence values have responded to observed shifts in hydroclimatic variability also revealed context-specific patterns. As previously mentioned, the synchrony of among-wetland, ponded-water fluctuations were much higher during the “filling” period than during the “post-filling” period. However, shifts in the temporal coherence of wetland invertebrates did not typically correspond to shifts in ponded-water synchrony. For example, temporal coherence values for most invertebrate metrics indicated that synchrony typically increased during the “post-filling” period (Figure 5 and Table 4). Mean annual biomass for invertebrate communities had similar levels of coherence for both periods (Figure 5 and Table 4), insect biomass fluctuations were more synchronous during the “post-filling” period (ri = 0.44, 0.24), and non-insect biomass was less synchronous during the post-filling period (ri = 0.69, 0.12). The greatest observed shift in temporal coherence values between periods was invertebrate composition, measured by a wetland’s placement along the first two axes (i.e., dimensions) over time (Table 4).
Discussion
The initial assessment of the degree of temporal coherence exhibited by aquatic-invertebrate communities in a complex of 16 prairie-pothole wetlands spanning over a sampling period of 24 years provides a starting point for further investigations into how to maximize and conserve biodiversity in depressional wetland ecosystems. Interestingly, even at relatively small spatial scales, the relative importance of landscape controls in determining wetland characteristics were often high, depending on a wetland’s hydrologic regime and multi-year changes in hydroclimatic variability. Typically, characteristics that are controlled externally to individual wetlands like climate are more likely to be indicators of variation in wetland invertebrate assemblages at large spatial scales (Epele et al., 2022). The variable responses observed at different levels of community organization (i.e., community types and metrics) highlight the importance of landscape controls, meta-community processes, and wetland heterogeneity in shaping community assemblages. These results also provide examples of contrasts and similarities between hydrologically variable wetland ecosystems and larger, relatively stable, lake ecosystems.
The 16 wetlands used in the analysis were variable in size with maximum observed ponded areas ranging from 0 to 23 hectares. They also exhibited high variability in ponded-water duration, ranging from wetlands that did not pond water every year to ones that were continually ponded for the duration of the study period (Mushet et al., 2016). However, dynamics of ponded-water characteristics, non-insect taxon richness, non-insect and insect taxa biomass, and invertebrate compositional turnover were all synchronous. These observations indicated that landscape controls are an important part of community assembly and support the idea that conservation of wetland biodiversity benefits from the preservation and restoration of diverse complexes of grassland embedded wetlands (Gibbs, 2000; Whiles and Goldowitz, 2001; Cohen et al., 2016; Verheijen et al., 2018). However, further work would be beneficial to identify the specific landscape controls that determine variation.
Previous research has demonstrated how prairie-pothole wetland hydrology is sensitive to shifts in climate (Winter and Rosenberry, 1998; Cressey et al., 2016; McKenna et al., 2017, 2019), which in turn influence community assemblages (Mushet et al., 2015; Haig et al., 2019; McLean et al., 2019, 2021). Considering the relatively small spatial scale of the study, climate (temperature and precipitation) conditions are expected to be very similar among all of our wetlands (Koenig, 2002), and drive temporally coherent hydrologic dynamics. The temporally coherent, ponded-water dynamics at the CLSA were most pronounced in the P wetlands, which had more stable, ponded-water regimes, and for all wetlands during the “filling-period” when precipitation driven shifts in hydrology were strongest. These results are consistent with those of Magnuson et al. (2006) who found that physical parameters (i.e., hydrology) in lakes are typically spatially synchronous, and Huttunen et al. (2014) who found that extreme climate events increase temporal coherence in aquatic ecosystems. Although smaller, temporarily ponded wetlands are particularly sensitive to changes in climate (Zhang et al., 2009), the ponded-water dynamics in T wetlands at the CLSA over the 24-year period were typically not synchronous. The lack of spatial synchrony among T wetlands could be due to non-linear rates of precipitation runoff, evapotranspiration, and sensitivity to fill and spill dynamics (Zhang et al., 2009; Hayashi et al., 2016; Leibowitz et al., 2016). The amount of runoff entering a wetland is primarily dependent on the amount of precipitation, and the slope and area of the catchment (Hayashi et al., 2016). The threshold for the amount of precipitation needed to generate runoff decreases with increased slope and catchment size.
Interestingly, when wetlands with different hydrologic regimes (i.e., P wetlands and T wetlands) were pooled, many biotic measurements of temporal coherence were similar to, or even greater than, temporal coherence measurements of ponded-water fluctuations. This is a sharp contrast to previous studies that have found physical processes to be more synchronous than measurements of biotic change (Magnuson et al., 2006; Huttunen et al., 2014). These differences in results could be at least partially attributed to the difference in spatial scales examined. CLSA wetlands are in proximity to each other and often have surface or subsurface hydrological connections. Conversely, other studies of freshwater synchrony have typically been conducted at a regional level. However, when synchrony is only assessed using the more lake-like P wetlands, patterns were more similar to other lacustrine studies. For example, physical properties and invertebrate compositional turnover were highly synchronous compared to measurements of abundance and alpha diversity (Anneville et al., 2005; Angeler and Johnson, 2012). Climate driven, synchronous changes in ponded-water levels are likely to contribute to the levels of synchrony observed in the biological communities. However, synchronous changes in ponded-water levels do not indicate increased hydrological similarity among wetlands (Figure 2). Our results indicate that both internal factors unique to each wetland and external processes likely related to among-wetland spatial connectivity that are at least partially independent of climate are also driving certain aspects of community assembly on the landscape. For example, certain invertebrate-community metrics, i.e., overall taxon richness, invertebrate biomass, insect taxon richness, and invertebrate taxa associated with NMDS axis 2, did not exhibit synchronous patterns that would indicate the observed variability in these variables was due to internal processes (e.g., wetland habitat heterogeneity). Further, T wetlands were found to not have synchronous ponded-water dynamics, but still had synchronous changes in non-insect taxon richness, invertebrate biomass, insect biomass, and invertebrate compositional turnover found in NMDS axis 1. Although these results do not rule out climate as a driving force of the observed synchrony, they do indicate that mechanisms extend beyond coherent changes in ponded-water regimes. However, when climate driven changes to wetland hydrological scale up to larger areas within the Prairie Pothole Region, dispersal effects related to the increased or decreased hydrologic connectivity among wetlands is likely a more synchronous process.
Some other factors that occur externally to individual wetlands that have been shown to contribute to temporal coherence are synchronous dispersal among populations and the populations responding to trophic interactions with synchronous taxa (Ranta et al., 1997a,b; Liebhold et al., 2004; Heino et al., 2015). It was predicted that mobile dispersers would exhibit more synchronous patterns because dispersal is partially limited by landscape controls (Cosentino and Schooley, 2018). However, in this study, taxon richness of the less mobile taxa (non-insects) was more synchronous than their more mobile insect counterparts (Table 3). This pattern is similar to that observed in Soininen et al. (2007) where beta-diversity was greater among more mobile dispersing taxa than passive dispersers. The observation that more mobile dispersing invertebrate communities exhibit less temporal coherence and greater beta diversity warrants further examination, potentially using a metacommunity approach that incorporates source/sink dynamics, mass effects, and rescue effects. Another possibility for decreased synchronicity of taxon richness among wetlands could be attributed to different generational times among taxa grouped into one category (Kratz et al., 1987; Rusak et al., 1999). Although many taxa might be highly synchronous among wetlands, when grouped together this pattern disappears. The observed variability in temporal coherence for different invertebrate groups among different wetland types indicate that these dynamics are not static and that further investigations on the controls of wetland invertebrate communities should consider classifying their invertebrate communities into distinct groups (e.g., insects and non-insects).
Batzer (2013) reviewed predictors of wetland invertebrate composition and found very little consistency among studies. The temporal perspective provided by the long-term sampling at CLSA has provided a unique perspective on drivers of wetland-invertebrate alpha and beta diversity (Leibowitz et al., 2016; McLean et al., 2019; Mushet et al., 2019b). It has become evident that predictors of wetland-invertebrate community composition are dynamic, much like the wetland ecosystems themselves. Communities in these systems are assembled through environmental sorting, patch dynamics, and mass effects. The relative importance of these processes is temporally and spatially variable. The differences in community composition that are unique to wetlands with different ponded-water regimes, salinities, and vegetation structure are likely the product of sorting effects due to habitat heterogeneity, and the strength of these sorting effects can change shift with changes in climate (McLean et al., 2016a,2021; Gleason and Rooney, 2018; Gleason et al., 2018). However, community composition can overlap among wetlands with heterogenous, ponded-water regimes. The increases in average ponded-water levels and number of ponded wetlands observed in North Dakota post 1993 have likely facilitated an increase of dispersal (McLean et al., 2016a,b). Mass effects are likely important under these conditions, whereas increased dispersal would allow taxa to colonize habitats that are not suitable for long-term persistence. Patch dynamics are also likely important in prairie-pothole wetlands as many of these systems exhibit periodic drying and subsequent ponding. This creates opportunities for taxa such as mosquitoes that are rapid colonizers (Batzer and Wissinger, 1996) but poor competitors (Knight et al., 2004; Elono et al., 2010) to persist in newly ponded wetlands under reduced threat of competition and predation (Chase and Knight, 2003). Although the environmental filters determining wetland community composition are fairly well established, future research would be useful to help understand the relative roles of mass effects, patch dynamics, and other metacommunity processes in maintain biodiversity.
Conservation implications
Depressional wetland ecosystems, such as prairie-pothole wetlands have been extensively drained and modified at a landscape level (Dahl, 1990, 2011), which in combination with directional shifts in climate has led to a loss of spatial and hydrologic heterogeneity (Bedford, 1999; van Meter and Basu, 2015). The strategic preservation and restoration of wetland ecosystems to conserve biodiversity is dependent on our understanding of the importance of internal and external processes in shaping wetland communities and how these processes might be influenced by climate change. McLean et al. (2019) found that invertebrate taxonomic composition and variability in CLSA wetland differed between permanently and temporarily ponded wetlands. Building upon that finding, although wetlands with differing hydrological regimes host distinct communities, compositional turnover was synchronous (Figure 3 and Table 3). The finding that invertebrate composition and biomass within invertebrate guilds exhibited temporally coherent dynamics indicates that metacommunities are indeed an important determinant of wetland assembly. Therefore, the presence of neighboring wetlands with variable hydrologic regimes increases landscape biodiversity through increased habitat heterogeneity and connectivity. Heterogenous complexes of wetlands with high metacommunity connectivity are also likely going to be more resilient to shifts in climate (de Boer et al., 2014; Lowe et al., 2015; Verheijen et al., 2018, 2020). Overall, these findings provide long-term evidence that wetland ecosystem functions are dependent on their relationship to local climate conditions and wetland to wetland landscape linkages. Thus, the unique contributions of biodiversity and ecosystem functions provided by wetlands can be maximized through the conservation and restoration of complexes of heterogenous wetlands.
Data availability statement
The datasets analyzed for this study are openly available from the U.S. Geological Survey at: https://www.sciencebase.gov/catalog/item/579bc7ace4b0589fa1c982be. CLSA Surface Water Elevation Dataset is available at: https://doi.org/10.5066/F7707ZJ6, CLSA Digital Elevation Model with Topobathy is available at: https://doi.org/10.5066/F7V69GTD, CLSA Wetland Vegetation Zones is available at: https://doi.org/10.5066/F7J101DQ, CLSA Wetland Invertebrate Counts is available at: https://doi.org/10.5066/P99GXVSV, and CLSA Wetland Invertebrate Weights is available at: https://doi.org/10.5066/P92IJREV.
Author contributions
KM wrote the original draft, performed the methodology, carried out the formal analysis and resources, wrote, reviewed, and edited the manuscript, visualized the data, and investigated the data. DM supervised the data, did the conceptualization, carried out the funding acquisition, and wrote, reviewed, and edited the manuscript. JS did the conceptualization, and wrote, reviewed, and edited the manuscript. All authors contributed to the article and approved the submitted version.
Funding
Funding for our research was provided through the U.S. Geological Survey’s Climate Research and Development Program. Any use of trade, firm, or product names is for descriptive purposes only and does not imply endorsement by the U.S. Government.
Acknowledgments
Our manuscript would have not been possible if not for all of the research staff that contributed to the long-term data collection efforts at the Cottonwood Lake study area. We also thank Mark Kaemingk and two reviewers for their reviews of earlier drafts of this manuscript.
Conflict of interest
The authors declare that the research was conducted in the absence of any commercial or financial relationships that could be construed as a potential conflict of interest.
Publisher’s note
All claims expressed in this article are solely those of the authors and do not necessarily represent those of their affiliated organizations, or those of the publisher, the editors and the reviewers. Any product that may be evaluated in this article, or claim that may be made by its manufacturer, is not guaranteed or endorsed by the publisher.
Supplementary material
The Supplementary Material for this article can be found online at: https://www.frontiersin.org/articles/10.3389/fevo.2022.897872/full#supplementary-material
References
Angeler, D. G., and Johnson, R. K. (2012). Patterns of temporal community turnover are spatially synchronous across boreal lakes. Freshw. Biol. 57, 1782–1793. doi: 10.1111/j.1365-2427.2012.02838.x
Anneville, O., Gammeter, S., and Straile, D. (2005). Phosphorus decrease and climate variability: mediators of synchrony in phytoplankton changes among European peri-alpine lakes. Freshw. Biol. 50, 1731–1746. doi: 10.1111/j.1365-2427.2005.01429.x
Balian, E. V., Segers, H., Martens, K., and Lévéque, C. (2007). The freshwater animal diversity assessment: an overview of the results. Hydrobiologia 595, 627–637. doi: 10.1007/s10750-007-9246-3
Batzer, D. P. (2013). The seemingly intractable ecological responses of invertebrates in North American wetlands: a review. Wetlands 33, 1–15. doi: 10.1007/s13157-012-0360-2
Batzer, D. P., and Wissinger, S. A. (1996). Ecology of insect communities in nontidal wetlands. Annu. Rev. Entomol. 41:75. doi: 10.1146/annurev.en.41.010196.000451
Bedford, B. L. (1999). Cumulative effects on wetland landscapes: links to wetland restoration in the United States and southern Canada. Wetlands 19, 775–788. doi: 10.1007/BF03161784
Bobbink, R., Whigham, D. F., Beltman, B., and Verhoeven, J. T. (2006). “Wetland functioning in relation to biodiversity conservation and restoration,” in Wetlands: Functioning, Biodiversity Conservation, and Restoration, eds R. Bobbink, B. Beltman, J. T. A. Verhoeven, and D. F. Whigham (Berlin: Springer), 1–12. doi: 10.1007/978-3-540-33189-6_1
Boylan, K. D., and MacLean, D. R. (1997). Linking species loss with wetlands loss. Natl. Wetlands Newslett. 19, 13–17.
Calhoun, A. J., Mushet, D. M., Bell, K. P., Boix, D., Fitzsimons, J. A., and Isselin-Nondedeu, F. (2017). Temporary wetlands: challenges and solutions to conserving a ‘disappearing’ ecosystem. Biol. Conserv. 211, 3–11. doi: 10.1016/j.biocon.2016.11.024
Cardinale, B. J., Duffy, J. E., Gonzalez, A., Hooper, D. U., Perrings, C., Venail, P., et al. (2012). Biodiversity loss and its impact on humanity. Nature 486, 59–67. doi: 10.1038/nature11148
Chase, J. M., and Knight, T. M. (2003). Drought-induced mosquito outbreaks in wetlands. Ecol. Lett. 6, 1017–1024. doi: 10.1046/j.1461-0248.2003.00533.x
Clarke, K. R. (1993). Non-parametric multivariate analyses of changes in community structure. Austral. J. Ecol. 18, 117–143. doi: 10.1111/j.1442-9993.1993.tb00438.x
Cohen, M. J., Creed, I. F., Alexander, L., Basu, N. B., Calhoun, A. J. K., Craft, C., et al. (2016). Do geographically isolated wetlands influence landscape functions? Proc. Natl. Acad. Sci. U.S.A. 113, 1978–1986. doi: 10.1073/pnas.1512650113
Cosentino, B. J., and Schooley, R. L. (2018). “Dispersal and wetland fragmentation,” in .), The Wetland Book: Structure and Function, Management and Methods. I.569, eds C. M. Finlayson, M. Everard, K. Irvine, R. J. McInnes, B. Middleton, A. A. Van Dam, et al. (Berlin: Springer Netherlands), 105–111. doi: 10.1007/978-90-481-9659-3_56
Cressey, R. L., Austin, J. E., and Stafford, J. D. (2016). Three responses of wetland conditions to climatic extremes in the Prairie Pothole Region. Wetlands 36, 357–370. doi: 10.1007/s13157-016-0818-8
Dahl, T. E. (1990). Wetlands losses in the United States, 1780’s to 1980’s. Report to the Congress. St. Petersburg, FL: National Wetlands Inventory.
Dahl, T. E. (2011). Status and trends of wetlands in the conterminous United States 2004 to 2009. Washington, DC: U.S. Department of the Interior.
de Boer, M. K., Moor, H., Matthiessen, B., Hillebrand, H., and Eriksson, B. K. (2014). Dispersal restricts local biomass but promotes the recovery of metacommunities after temperature stress. Oikos 123, 762–768. doi: 10.1111/j.1600-0706.2013.00927.x
Deutschman, M. R., and Peterka, J. J. (1988). Secondary production of tiger salamanders (Ambystoma tigrinum) in three North Dakota prairie lakes. Can. J. Fish. Aquat. Sci. 45, 691–697. doi: 10.1139/f88-083
Díaz, S., Fargione, J., Chapin, F. S., and Tilman, D. (2006). Biodiversity loss threatens human well-being. PLoS Biol. 4:e277. doi: 10.1371/journal.pbio.0040277
Dixon, C., Vacek, S., and Grant, T. (2019). Evolving management paradigms on U.S. Fish and Wildlife Service Lands in the Prairie Pothole Region. Rangelands 41, 36–43. doi: 10.1016/j.rala.2018.12.004
Doherty, K. E., Ryba, A. J., Stemler, C. L., Niemuth, N. D., and Meeks, W. A. (2013). Conservation planning in an era of change: state of the U.S. Prairie Pothole Region: state of the Prairies. Wildl. Soc. Bull. 37, 546–563. doi: 10.1002/wsb.284
Dudgeon, D., Arthington, A. H., Gessner, M. O., Kawabata, Z.-I., Knowler, D. J., Lévêque, C., et al. (2006). Freshwater biodiversity: importance, threats, status and conservation challenges. Biol. Rev. 81, 163–182. doi: 10.1017/S1464793105006950
Elliott, L. H., Igl, L. D., and Johnson, D. H. (2020). The relative importance of wetland area versus habitat heterogeneity for promoting species richness and abundance of wetland birds in the Prairie Pothole Region, USA. Condor 122:duz060. doi: 10.1093/condor/duz060
Elono, A. L. M., Liess, M., and Duquesne, S. (2010). Influence of competing and predatory invertebrate taxa on larval populations of mosquitoes in temporary ponds of wetland areas in Germany. J. Vector Ecol. 35, 419–427. doi: 10.1111/j.1948-7134.2010.00101.x
Epele, L. B., Grech, M. G., Williams-Subiza, E. A., Stenert, C., McLean, K., Greig, H. S., et al. (2022). Perils of life on the edge: climatic threats to global diversity patterns of wetland macroinvertebrates. Sci. Total Environ. 820:153052. doi: 10.1016/j.scitotenv.2022.153052
Esri, A. D. (2011). Release 10. Documentation Manual. Redlands, CA: Environmental Systems Research Institute.
Euliss, N. H. Jr., Wrubleski, D. A., and Mushet, D. M. (1999). “Wetlands of the Prairie Pothole Region: invertebrate species composition, ecology, and management,” in Invertebrates in freshwater wetlands of North America: Ecology and management, eds D. P. Batzer, R. B. Rader, and S. A. Wissinger (New York, NY: John Wiley & Sons), 471–514.
Euliss, N. H., LaBaugh, J. W., Fredrickson, L. H., Mushet, D. M., Laubhan, M. K., Swanson, G. A., et al. (2004). The wetland continuum: A conceptual framework for interpreting biological studies. Wetlands 24, 448–458. doi: 10.1672/0277-5212(2004)024[0448:TWCACF]2.0.CO;2
Ferguson, T. L., Rude, B. J., and King, D. T. (2019). American White Pelican (Pelecanus erythrorhynchos) growth, nutrition and immunology. Waterbirds 42, 61–69. doi: 10.1675/063.042.0107
Fisher, R. A. (1915). Frequency distribution of the values of the correlation coefficient in samples from an indefinitely large population. Biometrika 10, 507–521. doi: 10.2307/2331838
Gibbs, J. P. (1993). Importance of small wetlands for the persistence of local populations of wetland-associated animals. Wetlands 13, 25–31. doi: 10.1007/BF03160862
Gibbs, J. P. (2000). Wetland loss and biodiversity conservation. Conserv. Biol. 14, 314–317. doi: 10.1046/j.1523-1739.2000.98608.x
Gleason, J. E., Bortolotti, J. Y., and Rooney, R. C. (2018). Wetland microhabitats support distinct communities of aquatic macroinvertebrates. J. Freshw. Ecol. 33, 73–82. doi: 10.1080/02705060.2017.1422560
Gleason, J. E., and Rooney, R. C. (2018). Pond permanence is a key determinant of aquatic macroinvertebrate community structure in wetlands. Freshw. Biol. 63, 264–277. doi: 10.1111/fwb.13057
Haig, S. M., Murphy, S. P., Matthews, J. H., Arismendi, I., and Safeeq, M. (2019). Climate-altered wetlands challenge waterbird use and migratory connectivity in arid landscapes. Sci. Rep. 9:4666. doi: 10.1038/s41598-019-41135-y
Hayashi, M., Kamp, G., and van der Rosenberry, D. O. (2016). Hydrology of prairie wetlands: understanding the integrated surface-water and groundwater processes. Wetlands 36, 237–254. doi: 10.1007/s13157-016-0797-9
Heino, J., Melo, A. S., Siqueira, T., Soininen, J., Valanko, S., and Bini, L. M. (2015). Metacommunity organisation, spatial extent and dispersal in aquatic systems: patterns, processes and prospects. Freshw. Biol. 60, 845–869. doi: 10.1111/fwb.12533
Hooper, D. U., Adair, E. C., Cardinale, B. J., Byrnes, J. E., Hungate, B. A., Matulich, K. L., et al. (2012). A global synthesis reveals biodiversity loss as a major driver of ecosystem change. Nature 486, 105–108. doi: 10.1038/nature11118
Huttunen, K.-L., Mykrä, H., Huusko, A., Mäki-Petäys, A., Vehanen, T., and Muotka, T. (2014). Testing for temporal coherence across spatial extents: the roles of climate and local factors in regulating stream macroinvertebrate community dynamics. Ecography 37, 599–608. doi: 10.1111/j.1600-0587.2013.00325.x
Junk, W. J., Piedade, M. T. F., Lourival, R., Wittmann, F., Kandus, P., Lacerda, L. D., et al. (2014). Brazilian wetlands: their definition, delineation, and classification for research, sustainable management, and protection. Aquat. Conserv. 24, 5–22. doi: 10.1002/aqc.2386
Kingsford, R. T., Basset, A., and Jackson, L. (2016). Wetlands: conservation’s poor cousins. Aquat. Conserv. 26, 892–916. doi: 10.1002/aqc.2709
Knight, T. M., Chase, J. M., Goss, C. W., and Knight, J. J. (2004). Effects of interspecific competition, predation, and their interaction on survival and development time of immature Anopheles quadrimaculatus. J. Vector Ecol. 29, 277–284.
Koenig, W. D. (2002). Global patterns of environmental synchrony and the Moran effect. Ecography 25, 283–288. doi: 10.1034/j.1600-0587.2002.250304.x
Krapu, G. L., and Reinecke, K. J. (1992). Foraging ecology and nutrition. Ecology and management of breeding waterfowl. Minneapolis: University of Minnesota Press, 1–29.
Kratz, T. K., Frost, T. M., and Magnuson, J. J. (1987). Inferences from spatial and temporal variability in ecosystems: long-term zooplankton data from lakes. Am. Nat. 129, 830–846. doi: 10.1086/284678
LaBaugh, J., Winter, T. C., Adomaitis, V., and Swanson, G. A. (1987). Hydrology and chemistry of selected prairie wetlands in the Cottonwood Lake area, Stutsman County, North Dakota, 1979-82 (No. 2330–7102). Washington, DC: US Geological Survey. doi: 10.3133/pp1431
LaBaugh, J. W., Rosenberry, D. O., Mushet, D. M., Neff, B. P., Nelson, R. D., and Euliss, N. H. Jr. (2018). Long-term changes in pond permanence, size, and salinity in Prairie Pothole Region wetlands: The role of groundwater-pond interaction. J. Hydrol. 17, 1–23. doi: 10.1016/j.ejrh.2018.03.003
Leibowitz, S. G., Mushet, D. M., and Newton, W. E. (2016). Intermittent surface water connectivity: fill and spill vs. fill and merge dynamics. Wetlands 2, 323–342. doi: 10.1007/s13157-016-0830-z
Liebhold, A., Koenig, W. D., and Bjørnstad, O. N. (2004). Spatial synchrony in population dynamics. Annu. Rev. Ecol. Evol. Syst. 35, 467–490. doi: 10.1146/annurev.ecolsys.34.011802.132516
Lowe, K., Castley, J. G., and Hero, J.-M. (2015). Resilience to climate change: complex relationships among wetland hydroperiod, larval amphibians and aquatic predators in temporary wetlands. Mar. Freshwater Res. 66, 886–899. doi: 10.1071/MF14128
Magnuson, J. J., Benson, B. J., and Kratz, T. K. (1990). Temporal coherence in the limnology of a suite of lakes in Wisconsin, U.S.A. Freshw. Biol. 23, 145–159. doi: 10.1111/j.1365-2427.1990.tb00259.x
Magnuson, J. J., Kratz, T. K., Benson, B. J., and Webster, K. E. (2006). Coherent dynamics among lakes. Longterm dynamics of lakes in the landscape. Oxford: Oxford University Press, 89–106.
McKenna, O. P., Kucia, S. R., Mushet, D. M., Anteau, M. J., and Wiltermuth, M. T. (2019). Synergistic interaction of climate and land-use drivers alter the function of North American, prairie-pothole wetlands. Sustainability 11:6581. doi: 10.3390/su11236581
McKenna, O. P., Mushet, D. M., Rosenberry, D. O., and LaBaugh, J. W. (2017). Evidence for a climate-induced ecohydrological state shift in wetland ecosystems of the southern Prairie Pothole Region. Clim. Change 145, 273–287. doi: 10.1007/s10584-017-2097-7
McLean, K. I., Mushet, D. M., Newton, W. E., and Sweetman, J. N. (2021). Long-term multidecadal data from a prairie-pothole wetland complex reveal controls on aquatic-macroinvertebrate communities. Ecol. Indic. 126:107678. doi: 10.1016/j.ecolind.2021.107678
McLean, K. I., Mushet, D. M., Renton, D. A., and Stockwell, C. A. (2016a). Aquatic-macroinvertebrate communities of prairie-pothole wetlands and lakes under a changed climate. Wetlands 36, 423–435. doi: 10.1007/s13157-016-0848-2
McLean, K. I., Mushet, D. M., and Stockwell, C. A. (2016b). From “duck factory” to “fish factory”: climate induced changes in vertebrate communities of prairie pothole wetlands and small lakes. Wetlands 36, 407–421. doi: 10.1007/s13157-016-0766-3
McLean, K. I., Mushet, D. M., Sweetman, J. N., Anteau, M. J., and Wiltermuth, M. T. (2019). Invertebrate communities of prairie-pothole wetlands in the age of the aquatic Homogenocene. Hydrobiologia 847, 3773–3793.
Mushet, D. M., Alexander, L. C., Bennett, M., Schofield, K., Christensen, J. R., Ali, G., et al. (2019a). Differing modes of biotic connectivity within freshwater ecosystem mosaics. J. Am. Water Resour. Assoc. 55, 307–317. doi: 10.1111/1752-1688.12683
Mushet, D. M., Solensky, M. J., and Erickson, S. F. (2019b). Temporal gamma-diversity meets spatial alpha-diversity in dynamically varying ecosystems. Biodivers. Conserv. 28, 1783–1797.
Mushet, D. M., Goldhaber, M. B., Mills, C. T., McLean, K. I., Aparicio, V. M., McCleskey, R. B., et al. (2015). Chemical and biotic characteristics of prairie lakes and large wetlands in south-central North Dakota—effects of a changing climate. Washington, DC: U.S. Geological Survey. doi: 10.3133/sir20155126
Mushet, D. M., Rosenberry, D. O., Euliss, N. H. Jr., and Solensky, M. J. (2016). Cottonwood Lake study area—water surface elevations. Washington, DC: U.S. Geological Survey. doi: 10.5066/F7707ZJ6
Mushet, D. M., Roth, C. L., and Scherff, E. J. (2017a). Cottonwood Lake study area—digital elevation model with topobathy. Washington, DC: U.S. Geological Survey. doi: 10.5066/F7V69GTD
Mushet, D. M., Euliss, N. H., Hanson, B. A., Neau, J. L., Bryant, R. B., and Erickson, S. F. (2017b). Cottonwood Lake study area—wetland vegetation zone spatial data, U.S. Geological Survey data release. Washington, DC: U.S. Geological Survey. doi: 10.5066/F7J101DQ
Mushet, D. M., Euliss, N. H. Jr., and Solensky, M. J. (2017c). Cottonwood Lake study area—invertebrate counts. Washington, DC: U.S. Geological Survey. doi: 10.5066/F7BK1B77
Mushet, D. M., Solensky, M. J., and Euliss, N. H. Jr. (2018). Cottonwood Lake Study Area - Invertebrate Weights. Washington, DC: U.S. Geological Survey. doi: 10.5066/F7891530
Oksanen, J., Blanchet, F. G., Kindt, R., Legendre, P., Minchin, P. R., O’hara, R. B., et al. (2015). vegan: Community ecology package. R package version 2.0-10. 2013. Philadelphia, PA: Rstudio.
Peck, J. E. (2011). Fast, easy, and publication-quality ecological analyses with PC-ORD. The Bull. Ecol. Soc. Am. 92, 298–301. doi: 10.1890/0012-9623-92.3.298
Pimm, S. L., Russell, G. J., Gittleman, J. L., and Brooks, T. M. (1995). The future of biodiversity. Science 269, 347–350. doi: 10.1126/science.269.5222.347
Pope, S. E., Fahrig, L., and Merriam, H. G. (2000). Landscape complementation and metapopulation effects on leopard frog populations. Ecology 81, 2498–2508. doi: 10.1890/0012-9658(2000)081[2498:LCAMEO]2.0.CO;2
Rains, M. C., Leibowitz, S. G., Cohen, M. J., Creed, I. F., Golden, H. E., Jawitz, J. W., et al. (2016). Geographically isolated wetlands are part of the hydrological landscape. Hydrol. Process. 30, 153–160. doi: 10.1002/hyp.10610
Ranta, E., Kaitala, V., and Lindström, J. (1997a). Dynamics of Canadian lynx populations in space and time. Ecography 20, 454–460. doi: 10.1111/j.1600-0587.1997.tb00412.x
Ranta, E., Kaitala, V., and Lundberg, P. (1997b). The spatial dimension in population fluctuations. Science 278, 1621–1623. doi: 10.1126/science.278.5343.1621
Reid, A. J., Carlson, A. K., Creed, I. F., Eliason, E. J., Gell, P. A., Johnson, P. T., et al. (2019). Emerging threats and persistent conservation challenges for freshwater biodiversity. Biol. Rev. 94, 849–873. doi: 10.1111/brv.12480
Ricciardi, A., and Rasmussen, J. B. (1999). Extinction rates of North American freshwater fauna. Conserv. Biol. 13, 1220–1222.
Rusak, J. A., Yan, N. D., Somers, K. M., and McQueen, D. J. (1999). The temporal coherence of zooplankton population abundances in neighboring north-temperate lakes. Am. Nat. 153, 46–58. doi: 10.1086/303147
Sala, O. E., Stuart Chapin, F. I. I. I., Armesto, J. J., Berlow, E., Bloomfield, J., Dirzo, R., et al. (2000). Global biodiversity scenarios for the year 2100. Science 287, 1770–1774. doi: 10.1126/science.287.5459.1770
Smith, A. G., Stoudt, J. H., and Gollop, J. B. (1964). Prairie potholes and marshes, Waterfowl tomorrow. Washington, DC: U.S. Fish and Wildlife Service. 770, 39–50.
Smith, L. L., Subalusky, A. L., Atkinson, C. L., Earl, J. E., Mushet, D. M., Scott, D. E., et al. (2019). Biological connectivity of seasonally ponded wetlands across spatial and temporal scales. J. Am. Water Resour. Assoc. 55, 334–353. doi: 10.1111/1752-1688.12682
Soininen, J., McDonald, R., and Hillebrand, H. (2007). The distance decay of similarity in ecological communities. Ecography 30, 3–12. doi: 10.1111/j.0906-7590.2007.04817.x
Stafford, J. D., Janke, A. K., Webb, E. B., and Chipps, S. R. (2016). “Invertebrates in managed waterfowl marshes,” in Invertebrates in Freshwater Wetlands, eds D. Batzer and D. Boix (Berlin: Springer), 565–600. doi: 10.1007/978-3-319-24978-0_16
Stewart, R. E., and Kantrud, H. A. (1967). Proposed classification of potholes in the glaciated prairie region. Jamestown: Northern Prairie Wildlife Research Center.
Swanson, G. A. (1978). Funnel trap for collecting littoral aquatic invertebrates. Progress. Fish Cult. 40, 73–73. doi: 10.1577/1548-8659(1978)40[73:FTFCLA]2.0.CO;2
van der Valk, A. G. (2005). The prairie potholes of North America. Cambridge: Cambridge University Press.
van der Valk, A. G., and Davis, C. B. (1978). The role of seed banks in the vegetation dynamics of prairie glacial marshes. Ecology 59, 322–335.
van Meter, K. J., and Basu, N. B. (2015). Signatures of human impact: size distributions and spatial organization of wetlands in the Prairie Pothole landscape. Ecol. Applic. 25, 451–465. doi: 10.1890/14-0662.1
Verheijen, B. H. F., Varner, D. M., and Haukos, D. A. (2018). Effects of large-scale wetland loss on network connectivity of the Rainwater Basin, Nebraska. Landsc. Ecol. 33, 1939–1951. doi: 10.1007/s10980-018-0721-1
Verheijen, B. H. F., Varner, D. M., and Haukos, D. A. (2020). Future losses of playa wetlands decrease network structure and connectivity of the Rainwater Basin, Nebraska. Landsc. Ecol. 35, 453–467. doi: 10.1007/s10980-019-00958-w
Webster, K. E., Soranno, P. A., Baines, S. B., Kratz, T. K., Bowser, C. J., Dillon, P. J., et al. (2000). Structuring features of lake districts: landscape controls on lake chemical responses to drought. Freshw. Biol. 43, 499–515. doi: 10.1046/j.1365-2427.2000.00571.x
Whiles, M. R., and Goldowitz, B. S. (2001). Hydrologic influences on insect emergence production from central Platte River wetlands. Ecol. Applic. 11, 1829–1842.
Winter, T. C. (2003). Hydrological, chemical, and biological characteristics of a prairie pothole wetland complex under highly variable climate conditions: the Cottonwood Lake area, east-central North Dakota. Washington, DC: U.S. Geological Survey Professional Paper 1675. doi: 10.3133/pp1675
Winter, T. C., and Rosenberry, D. O. (1998). Hydrology of Prairie Pothole wetlands during drought and deluge: a 17-year study of the Cottonwood Lake wetland complex in North Dakota in the perspective of longer term measured and proxy hydrological records. Clim. Change 40, 189–209. doi: 10.1023/A:1005448416571
Zamberletti, P., Zaffaroni, M., Accatino, F., Creed, I. F., and De Michele, C. (2018). Connectivity among wetlands matters for vulnerable amphibian populations in wetlandscapes. Ecol. Modell. 384, 119–127. doi: 10.1016/j.ecolmodel.2018.05.008
Zedler, J. B., and Kercher, S. (2005). Wetland resources: status, trends, ecosystem services, and restorability. Annu. Rev. Environ. Resour. 30, 39–74. doi: 10.1579/0044-7447(2007)36[335:cnwppc]2.0.co;2
Keywords: aquatic invertebrates, temporal coherence, prairie potholes, wetland dynamics, wetland ecosystems
Citation: McLean KI, Mushet DM and Sweetman JN (2022) Temporal coherence patterns of prairie pothole wetlands indicate the importance of landscape linkages and wetland heterogeneity in maintaining biodiversity. Front. Ecol. Evol. 10:897872. doi: 10.3389/fevo.2022.897872
Received: 16 March 2022; Accepted: 25 July 2022;
Published: 16 August 2022.
Edited by:
Laurie Alexander, United States Environmental Protection Agency, United StatesReviewed by:
Jody Daniel, University of Waterloo, CanadaChristy Morrissey, University of Saskatchewan, Canada
Copyright © 2022 McLean, Mushet and Sweetman. This is an open-access article distributed under the terms of the Creative Commons Attribution License (CC BY). The use, distribution or reproduction in other forums is permitted, provided the original author(s) and the copyright owner(s) are credited and that the original publication in this journal is cited, in accordance with accepted academic practice. No use, distribution or reproduction is permitted which does not comply with these terms.
*Correspondence: Kyle I. McLean, kmclean@usgs.gov