A Systematic Review of Sources of Variability and Uncertainty in eDNA Data for Environmental Monitoring
 Chloé Mathieu1†
  Syrie M. Hermans2
  Gavin Lear2
  Thomas R. Buckley2,3
  Kevin C. Lee1
  Hannah L. Buckley1*
- 1School of Science, Auckland University of Technology, Auckland, New Zealand
- 2School of Biological Sciences, University of Auckland, Auckland, New Zealand
- 3Manaaki Whenua—Landcare Research, Auckland, New Zealand
Environmental DNA (eDNA) is becoming a standard tool in environmental monitoring that aims to quantify spatiotemporal variation for the measurement and prediction of ecosystem change. eDNA surveys have complex workflows encompassing multiple decision-making steps in which uncertainties can accumulate due to field sampling design, molecular biology lab work, and bioinformatics analyses. We conducted a quantitative review of studies published prior to December 2017 (n = 431) that had sampled eDNA from a variety of ecosystems and that had explicitly accounted for variability and uncertainty associated with eDNA workflows, either in their study design (e.g., replication) or data analysis (e.g., statistically modeling the spatiotemporal variation). We recorded differences among research studies in their spatial and temporal study design, the detected scales of natural variation in the study taxa, and how researchers measured and addressed the multiple sources of variability and uncertainty associated with the eDNA workflow. We show that relatively few studies used eDNA to understand temporal variation in biodiversity compared to spatial variation, and fewer described how uncertainties were addressed. We recommend increasing the number of temporal studies and to account for both natural variation and sources of uncertainty, such as imperfect detection, when undertaking eDNA surveys. Of studies that quantified spatiotemporal variation, this review identified gaps in the scales over which researchers have observed these patterns. Increasing the number of long-term and broad-scale eDNA studies will improve understanding of how useful eDNA is at scales relevant for monitoring the effects of environmental changes such as climatic shifts or land use change. Even where sources of spatiotemporal variation and uncertainty were accounted for, the effort in quantifying this variation differed among the different steps in the eDNA process, from field, to laboratory and bioinformatics procedures, depending on the type of community studied (micro- vs. macro-organism communities). We recommend more consistent experimental and modeling methods, accounting for spatiotemporal variation, and uncertainty in eDNA collection, and analysis, and incorporation of prior knowledge of sources of variability via Bayesian modeling approaches to account for uncertainties such as imperfect detection, to generate robust diversity estimates and increase the comparability of eDNA datasets for environmental monitoring across space and time.
Introduction
Understanding spatial and temporal community patterns and processes is fundamental for disentangling the processes underpinning current and past biodiversity (Levin, 1992; Eme et al., 2015), and for predicting future biodiversity patterns (Sandel and Smith, 2009); it is thus fundamental for conservation and environmental management (Levin, 1992). However, because organisms respond differently to processes operating at a variety of spatial and temporal scales, quantifying spatiotemporal patterns and making generalizations about the causal processes remains challenging (Levin, 1992). Our ability to fully and accurately estimate sources of uncertainty in biodiversity measurements is key to advancing our understanding of these spatiotemporal scales of variation. Sources of variation in spatiotemporal data may be due to natural variation in biodiversity through space and time, but may also be due to errors introduced during field sampling and other steps in the biodiversity estimation process (Chen et al., 2013). The advent of new molecular tools, accessible at an increasingly reasonable price, has facilitated the use of environmental DNA (eDNA) to quantify biodiversity patterns (Chave, 2013). This has been especially useful for improving our understanding of spatiotemporal variation in environmental microbial communities (Shade et al., 2018) since prior methods to classify taxa based on traits such as morphology, frequently group taxa that are unrelated by descent (Kysela et al., 2016). For molecular biodiversity assessments, taxa are instead normally identified by the analysis of short, but taxonomically informative, DNA regions (Taberlet et al., 2018). In comparison to traditional approaches in community ecology, DNA surveys can allow detection of multiple taxa, including cryptic species, simultaneously. Environmental DNA (or eDNA) that is excreted or shed from live and dead organisms can be extracted from environmental samples (such as soil, water, air, and feces) without the need to isolate or even sight a specific taxon (Taberlet et al., 2012) with the potential to improve detection of nocturnal, rare and transient species, as well as species dwelling in less visible habitats, such as underground. Consequently, eDNA methods can be less environmentally damaging (Rees et al., 2014) and more accurate than field sampling (Janosik and Johnston, 2015). Particularly following the development of next-generation sequencing, eDNA methods can also be cheaper than some traditional methods and are thus they are increasingly considered as viable for the monitoring of both micro- and macro-organisms (Holdaway et al., 2017; Taberlet et al., 2018). While eDNA methods have been applied to study microbial communities for over two decades (Ranjard et al., 2000) leading to well established methods and a wide range of studies, molecular research to investigate macro-organisms is still in its infancy, with ongoing method development and optimisation.
Despite growing enthusiasm among the scientific community for biodiversity analysis using eDNA methods, species detection from eDNA studies is imperfect (Schmidt et al., 2013). Environmental DNA surveys have complex workflows encompassing multiple decision-making steps over which errors can accumulate (Table 1). Detection errors can occur due to: (1) the incorrect detection of target taxa when they are absent (false positives) and (2) failing to detect the target taxa when they are present (false negatives; Darling and Mahon, 2011). These detection problems can be attributed to either method or process errors. DNA-based method errors include all the errors resulting from the multiple steps used in performing the eDNA survey protocol (Zinger et al., 2019). This encompasses field sampling, laboratory sample processing and bioinformatics steps. DNA-based process errors comprise all the errors due to natural variability in species' DNA concentration in space and time (Darling and Mahon, 2011). For instance, a site with a higher concentration of DNA for the species α at time t should have a higher probability of detection than another site, or than the same site at time t + 1 if the DNA concentration decreases over time. Consequently, the design and use of appropriate eDNA surveys are highly context-dependent and so the development of a standard protocol that can account for these uncertainties (i.e., that measures the error due to the study design) for all taxa and all conditions is challenging (Taberlet et al., 2018). Nevertheless, some recommendations for reducing errors and increasing research reproducibility have been made (Dickie et al., 2018; Zinger et al., 2019). Improvement in our understanding of how these sources of error vary over time and space is necessary to avoid poor estimates of diversity (Carini et al., 2017) and to correctly interpret ecosystem functioning. If not properly accounted for, these sources of uncertainty can bias our understanding of biodiversity patterns and potentially misinform critical management and conservation decisions (Darling and Mahon, 2011; Chen et al., 2013; Furlan et al., 2016). For example, in invasive species surveillance and monitoring, the risk of false positives is a significant concern for managers and stakeholders who are concerned with minimizing both expenditure and any inconvenience caused by having to implement unnecessary pest control actions (Darling and Mahon, 2011).
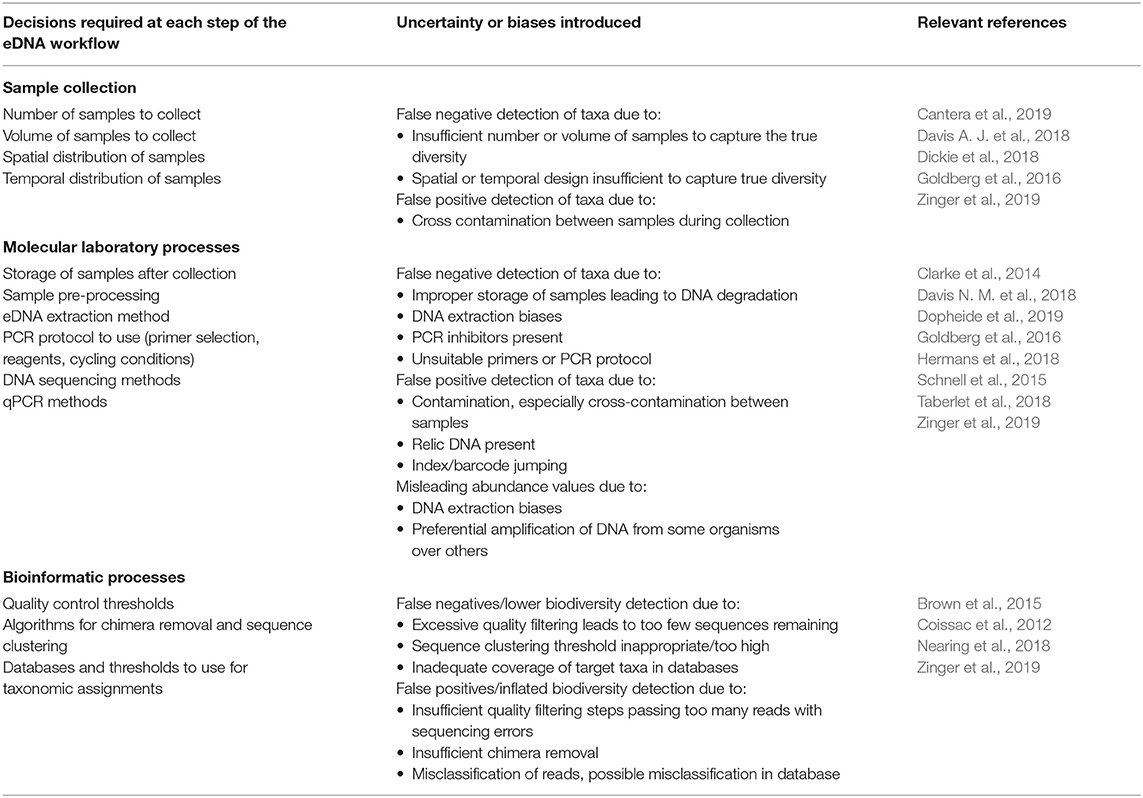
Table 1. Steps and decisions required as part of a typical eDNA workflow, and the potential biases or uncertainties introduced at each of these steps.
In this systematic review, we conduct a gap analysis of the literature to quantify scales of natural spatiotemporal variation detected by eDNA studies and identify the uncertainties introduced by field sampling design, laboratory choices and bioinformatics procedures that may impact the accuracy and reproducibility of present-day diversity assessments conducted using eDNA. We reviewed empirical research that used eDNA sampled from natural environments to assess (1) the disparity among these studies due to differences in their spatial and temporal scales of observation and (2) if, and how, researchers have measured and addressed the multiple sources of uncertainty associated with eDNA sampling, laboratory processing and bioinformatics. Our approach was to follow a quantitative review methodology (Pickering and Byrne, 2014) to detect trends and gaps in how uncertainty and variability are detected and dealt with in eDNA studies. Our review methods were designed to capture the variety of research methods that have been employed in eDNA studies (i) on macro-organisms (length body ≥ 500 μm) and micro-organisms (length body < 500 μm) (Martiny et al., 2006), (ii) across levels of organization, from a single taxon to multi-taxon communities, and (iii) across ecosystems, from above- and below-ground terrestrial systems, to both freshwater and marine aquatic ecosystems. Our aim for identifying trends and existing knowledge gaps in the understanding of spatiotemporal variability and uncertainty in eDNA research was to provide clear recommendations as to how researchers may adapt future study designs to best account for spatiotemporal variation and uncertainty arising from the collection and analysis of eDNA data.
Materials and Methods
Systematic, quantitative reviews (i) identify the research question, (ii) identify and test appropriate keywords by searching databases, (iii) review and consistently record data from papers identified in the searches, and (iv) summarize and record patterns emerging from the resultant data (Pickering and Byrne, 2014). Following this approach, our research question, “How are variability and uncertainty measured and accounted for in eDNA studies?”, was answered by conducting four different topic searches with ISI Web of Science Core Collection in November 2017 to extract four types of studies from the literature (Table 2): (topic 1) ecological studies using eDNA, (topic 2) metagenomics studies applied in ecology, (topic 3) studies of spatiotemporal variation and (topic 4) studies on the quantification of uncertainty in the eDNA process. We also included articles cited by six papers that have reviewed eDNA methodologies (Jansson and Tas, 2014; Boetius et al., 2015; Cavicchioli, 2015; Zeglin, 2015; Battin et al., 2016; Fierer, 2017). We obtained in total an initial list of 2,589 articles, from which we excluded all studies without either any spatial replication or temporal replication, and those without measurements of variability detailed either in the main text or any supplementary material, i.e., those studies that did not take replicate measurements and therefore, spatiotemporal variation and uncertainties cannot be calculated (point samples). As this review focused on the use of eDNA in environmental monitoring, we also excluded studies that were reviews, meta-analyses, laboratory-based experiments, within-organism (microbiome) studies, relic DNA studies focusing on the composition of historic communities, not on eDNA, and all studies where samples were collected from living or artificial substrates from the initial list. A number of papers (n = 31) conducted independent analyses to address questions at multiple spatiotemporal scales [e.g., (Chen et al., 2014) used differing approaches to assess spatial variation occurring across small (i.e., cm) vs. large (i.e., km) spatial scales] and were therefore entered as multiple studies in the final results database. This resulted a final list of 399 papers, which provided data for 431 studies. While this list contains the studies that met our search criteria (Table 2) and conditions outlined above, it is inevitable that some eDNA research was not captured, for example due to them not including any of the keywords we used in our search. Every article was read to a level sufficient to extract all required data by the primary author (CM) with consultation with other co-authors on specific methods or terminology, where required. Data gathered from each article related to (1) the spatial and temporal design of the study and (2) how sources of uncertainty were accounted for. All articles included in the quantitative review are contained in Table S1 and the raw data extracted are included in Table S2.
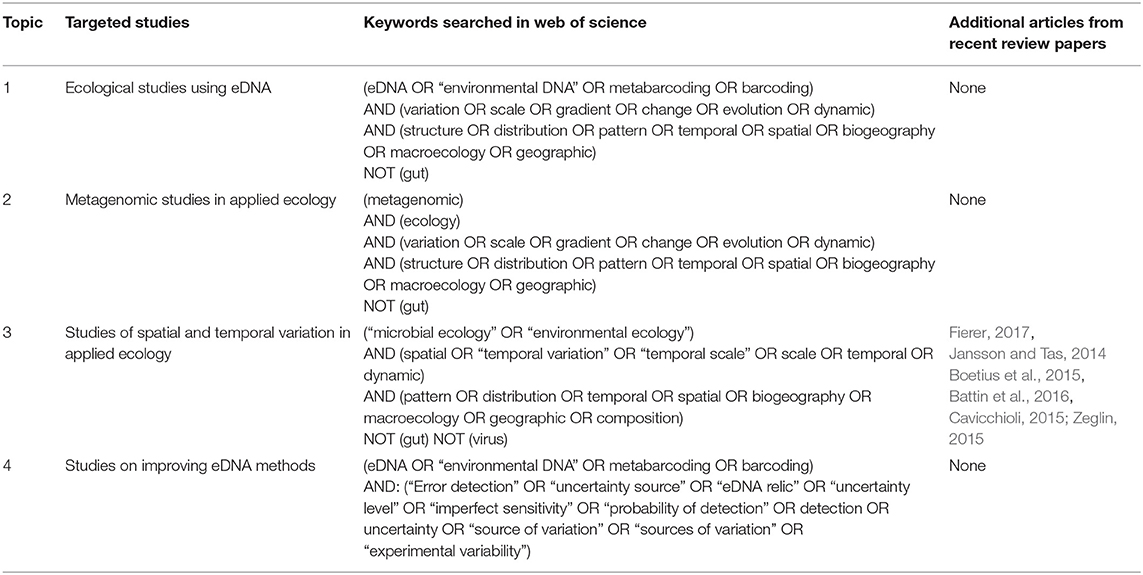
Table 2. Search strategies used for the selection of the reviewed studies.
We recorded the “type of variation” (spatial, temporal, both, or none) and size of the organisms studied (micro-, macroscopic, or both). Definition of the “type of variation” was based on the results presented. For example, if a site was sampled more than once over time, but the results presented only spatial variation in the data, i.e., temporal variation was averaged for each spatial replicate, or was otherwise ignored in the analysis, it was scored as a spatial study. All “space-for-time” a.k.a. chronosequence studies, i.e., studies using spatial samples to infer temporal variation, were considered to be spatial. For instance, three successional vegetation stages (grassland, mosaic, and forest) of green alder (Alnus viridis) encroachment were sampled by Schwob et al. (2017) at a single time to study the temporal dynamics of microbial communities in subalpine soils. Other attributes extracted were the type of ecosystem (terrestrial or aquatic) and the taxonomic level studied, namely “community” (studying more than 10 taxa), “group of taxa” (studying fewer or 10 taxa) or a single taxon (studying one unique taxon or unique species). The category “group of taxa” represents a selection of taxa based on author defined similarities in their morphology, life history traits, or conservation status.
To study spatiotemporal design more specifically, studies without either temporal or spatial replication, i.e., studies simulating method uncertainties (n = 17), were excluded, resulting in a subset of 414 studies out of the original 431. From those articles remaining, the type of eDNA outputs used were extracted, i.e., if researchers conducted taxon based analysis [e.g., using a single qPCR assay as in (Erickson et al., 2016)], community-based analysis [e.g., using “metabarcoding” as in Dulias et al. (2017)] or assessed the diversity of a broader array of genes [e.g., the analysis of functional gene or shotgun metagenomics data as in Dopheide et al. (2015) and Jeffries et al. (2016), respectively]. We also extracted both the spatial and temporal extents of studies. The spatial extent was defined as an area polygon (in km2) encompassing all samples collected in the horizontal plane. For example, for a publication studying fish along a depth gradient, the study extent was defined as the maximal surface delimited by all the sampling sites (horizontal surface); we did not take the depth (vertical plane) gradient into account. If the sampling sites were not clearly identified, we used the area or region given in the paper. If the area was not named, but a map or satellite image provided, we used appropriate tools (e.g., Google Earth Pro (https://www.google.com/earth) and QGIS QGIS Development Team (2018) to identify and measure the spatial extent. The temporal extent corresponded to the duration of the study, i.e., the amount of time that elapsed between the first and last temporal replicates.
The type of diversity used to describe a community was also extracted. Three categories were defined based on the number of taxa (taxonomic diversity), the evolutionary history (phylogenetic diversity), or the functional traits in a community (functional diversity). We measured the scales of spatial and temporal variation in the community, i.e., the distance in space and/or time of a community when a shift was observed. The temporal scale of community variations is the time elapsed (in days) between t0 (initial time) and t1 (time when a community shift was observed). The spatial variation scale corresponds to the average distance between places (in km), where a community shift was observed. For instance, if the authors reported a spatial change at the site scale, the spatial scale variation here is the average distance between sites. We used different tools including the R software environment (R Core Team, 2019), Google Earth Pro and QGIS to measure this spatial variation when it was not clearly specified in the text. We also noted when the authors did not observe any significant spatial or temporal variation in the community metric (“no change”), or where the nature of the spatial or temporal variation was not clearly significant (“not clear”) or where there were “mixed effects”, e.g., dependent on the taxon considered. In some other cases, authors noted the presence of significant spatial and/ or temporal variation in communities without providing the required information to quantify it (“unquantifiable changes”).
To study if and how researchers measured and explicitly addressed the multiple sources of uncertainty associated with eDNA sampling in their data analysis and interpretation, we considered only those studies accounting for sources of uncertainty (164 studies out of the original 431), i.e., (a) the studies measuring uncertainty by experimentation, modeling or statistical analysis (quantification) and (b) the studies comparing eDNA survey results with previous knowledge or traditional surveys (comparison). We extracted (1) the type of errors studied (false negative, false positive, or both), (2) their sources (error process or method), and (3) the workflow step at which the errors were studied (sample collection, molecular laboratory work, or bioinformatics processing). For the studies quantifying sources of uncertainty, we categorized the type of uncertainty measured following the workflow steps outlined in Table 1. More details about each category are given in Table S3. If several sources of uncertainties were quantified in the same study, the study was counted more than once. For instance, if a study measured sources of uncertainty due to DNA temporal variability and storage conditions, then this study was counted twice. We also extracted the suggestions given by authors where possible (if there were none, we recorded “no clear suggestion”) and categorized them by their degree of generalization, i.e., “weakly” (case-specific suggestions), “moderately” (suggestions only applicable to a large group of taxa) and “strongly” generalizable (suggestions that are potentially applicable to all studies). In the count of the studies providing suggestions, we counted any study providing at least one suggestion in any of these categories. In addition, based on the highly generalizable suggestions made by articles quantifying eDNA uncertainty, for all the studies (431 articles), we extracted four parameters for communities to see how these main suggestions were applied to decrease uncertainty; namely (1) the number of studies using an occupancy model (yes, no, or other), (2) the number of genes and primer sets used, (3) the sampling intensity in relation to the study extent (temporal and spatial), and (4) the number of replicates used during the lab work process (PCR and DNA extraction replicates). Non-parametric tests were used to test for significant differences among taxonomic levels and communities studied (macro- and micro-organisms) in terms of the number of genes, primer sets, and number of replicates used (Wilcoxon test and Kruskal-Wallis test with a Bonferroni correction). All analyses were conducted and figures generated within the R environment for statistical computing (R Core Team, 2019) implementing the tidyverse, dplyr, ggplot, ggalt, and gridExtra packages. Since molecular methods have changed radically over the years, substantially increasing the number of temporal and spatial samples that can be feasibly collected and analyzed, we not only undertook our analyses on the full dataset, but also on a datasets restricted only to next-generation sequencing and qPCR studies to ensure that that any observations and recommendations made for historical data are still accurate for interpretations of modern day methods; these additional analyses made little difference to the pattern of results and so are presented in Figures S1–S3.
Results
The 431 research studies that accounted for spatiotemporal variation and/ or uncertainty in their eDNA workflow in some way spanned 21 years. The number of publications using eDNA increased over time (Figure 1), but remain dominated by microbial research (66%), compared to studies focusing on larger organisms (34%). Aquatic ecosystems (marine and freshwater) were the most frequently studied (76%), compared to terrestrial ecosystems (23%). Only 1% of studies sampled both ecosystem types. After 2010, the selected literature consisted mostly of studies at the community level (Figure 1B); most community analysis used high throughput DNA sequencing, whereas most single taxon studies used qPCR or targeted multiple genes to provide information the abundance of multiple taxa. Taxonomic-based investigations were used most frequently (92%); only a few studies used a metagenomic approach (3%). Where diversity patterns were assessed, these community level studies most often explored taxonomic diversity (92%), with functional and/or phylogenetic diversity less often reported (Figure 2). Additionally, most studies reported only one (69%) or two (27%) types of diversity measures.
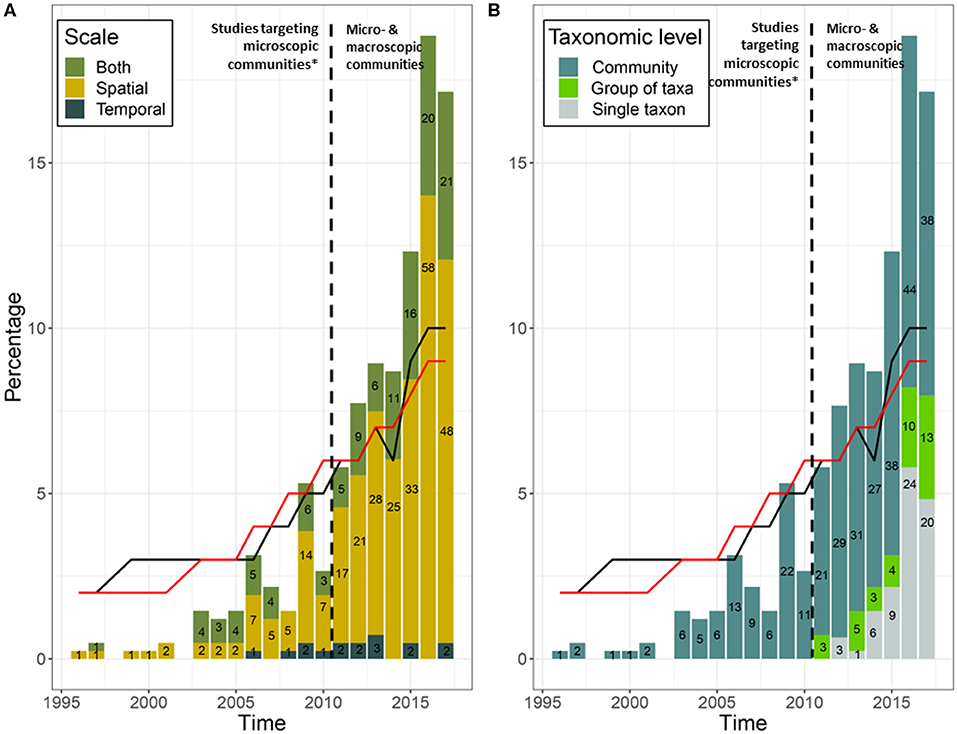
Figure 1. (A) Spatiotemporal scales and (B) taxonomic levels studied (community, group of taxa, and single taxon) over time using eDNA. “Group of taxa” is defined as a group of fewer than 10 taxa clustered based on similarities in their morphology, life history traits, or conservation status. Numbers on the histogram bars represent the number of studies during that year. Black dashed lines show the beginning of eDNA studies on macro-organisms, with the exception of one study targeting macro-organisms by Bhadury et al. (2006). Black and red lines show the percentage of published papers in all scientific journals from 1996 to 2017 about micro- (n = 26,535) and macro-organisms (n = 152,288), respectively; data extracted from Web of Sciences using the key words “Microbiology” and “Ecology NOT Microbiology” respectively.
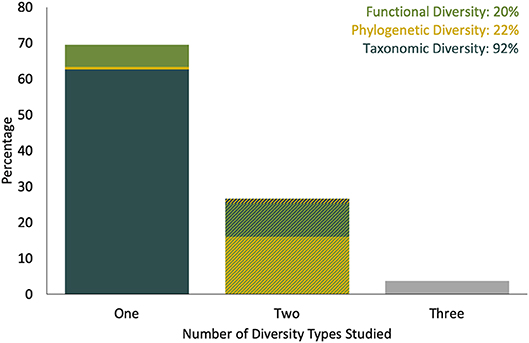
Figure 2. Percent of reviewed community eDNA spatiotemporal studies that used different numbers and types of diversity measure (total number of studies = 293). Single diversity measures recorded were (bottom layer of stacked bar) taxonomic diversity, (center) phylogenetic and (top) functional diversity; combinations of two diversity measures studies included (bottom) taxonomic and phylogenetic diversity, (center) taxonomic and functional diversity and (top) functional and phylogenetic diversity. A similar plot, excluding studies that included no high-throughput DNA sequencing or qPCR data is available in Figure S1.
Scales of Spatial and Temporal Variation
Most studies investigated spatial variation (67.8%); papers focusing only on temporal changes represented 4.2% of the studies, whereas 27.7% considered both spatial and temporal variation (Figure 3). Of those studying temporal variation, 68.7% were short-term studies (a year or less), while medium- (2–5 years) and long-term (>5 years) studies represented 25.4 and 6.0%, respectively. In contrast, spatial variation was studied more consistently across a range of scales.
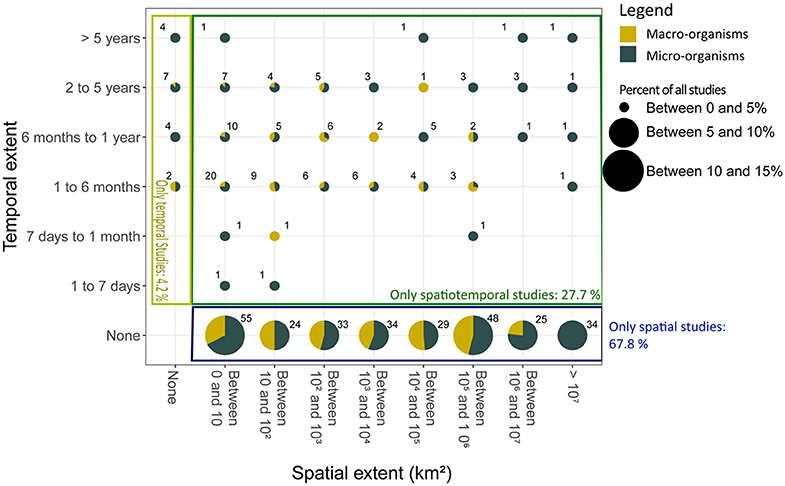
Figure 3. The percent of studies using the eDNA of microscopic (dark green) and macroscopic (yellow) organisms that fell into different categories of spatial and temporal extent. The numbers within the plot correspond to the number studies reviewed in each category. Studies investigated spatial variation only (blue rectangle), temporal variation only (light green rectangle), or both spatial, and temporal variation (dark green rectangle). A breakdown of the spatial and temporal extent reported by the subset of studies which used “modern” molecular methods (next-generation sequencing or qPCR) is shown in Figure S2.
A total of 272 articles working at the community level quantified the scale of variation across space and/or time. Among these, the majority assessed communities of microscopic organisms (~90%). Significant spatial variation was observed in both micro- and macroscopic communities (Figure 4, inner rings). In microscopic communities, significant spatial variation was observed at small (within 10 km), medium (between 10 and 1,000 km) and large (from 1,000 to 100,000 km) spatial scales (Figure 4A, outer ring). Macroscopic communities mostly showed spatial variation at small and medium scales (Figure 4B, outer ring). Few studies reported no change, unclear, or unquantifiable changes, or mixed effects depending on the specific taxa, land-uses, treatments, regions, sites or genes studied, or mixed effects depending on the laboratory, or bioinformatic methods, or the type of diversity measured (Figure 4, intermediate rings).
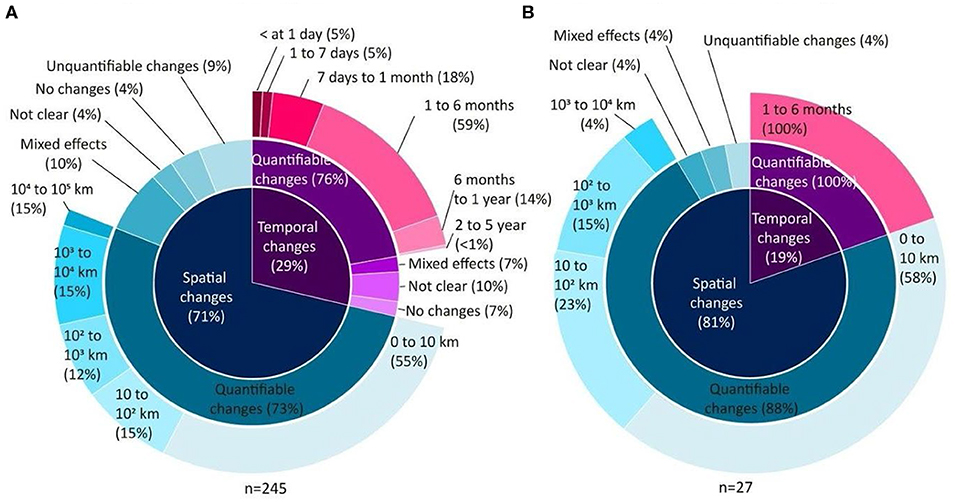
Figure 4. Spatial and temporal scales of variation recorded from 272 articles working at the community level researching (A) microscopic and (B) macroscopic organisms. The inner circle indicates whether the variation was spatial (blue) or temporal (pink), the intermediate ring indicates whether or not the variation was quantified, and if quantified, the significant scales of the variation is indicated in the outer ring. The scale at which spatial and temporal variation was reported by the subset of studies which used “modern” molecular methods (next-generation sequencing or qPCR) is shown in Figure S3.
From the 29% of articles studying temporal changes within microbial communities, most quantified community changes occurring over short time scales (within 1 year). A few studies observed mixed effects depending on taxa, biome, site, or the gene studied (Figure 4A, intermediate ring). Temporal shifts in the composition of communities of macro-organisms were reported only across short timescales (1–6 months) in seven articles (Figure 4B, intermediate and outer rings).
Identifying Uncertainties Introduced During the eDNA Workflow
Our research identified 164 studies that explicitly measured and/ or modeled sources of uncertainty in their eDNA data. Of these, 50% measured uncertainty by quantification (using experimentation, modeling or statistical analysis), 42% by comparison (eDNA survey results vs. previous knowledge or traditional survey results; such data are easier to obtain for some groups of macro-organisms) and 8% using both approaches. The proportions of articles accounting for uncertainty in each ecosystem type were 44 and 17% for aquatic and terrestrial ecosystems, and 80% for both. Most studies measured uncertainty either at the community (41%) or single taxon (38%) level compared to 21% of studies that focused on a group of taxa (e.g., bony fish; Clusa et al., 2017). In 45% of the articles, the type of error measured was not clearly specified. However, 39% of articles reported examining both false positive and false negative detections compared to fewer articles which reported examining false positive (5%) and negative (10%) detections separately.
Within the sampling phase, both the spatiotemporal variability of the eDNA and uncertainty introduced by the experimental design were considered (Figure 5). Publications studying microbial communities paid more attention to experimental sampling design, sources of uncertainty due to size of the samples (volume/area sampled) and the number of field replicates. In contrast, papers studying communities of macro-organisms were focused on the detection of spatiotemporal variability related to sample collection. Sources of uncertainty due to the effect of pooling samples and the presence of positive controls were tested only for communities of macro-organisms (Figure 5). Within the laboratory work phase, the sources of uncertainty due to the storage conditions, selection of molecular parameters, extraction, and amplification protocols, as well as the sequencing were quantified; errors produced by sample pre-processing were only studied for macro-organisms [e.g., differences in eDNA detection comparing the collection of sample DNA that had been either filtered or centrifuged, as in Vörös et al. (2017)]. Within the bioinformatics phase, the quality control, clustering of operational taxonomic units (OTUs) and taxonomy assignment were investigated for both microbial and macro-organism communities; uncertainties due to the chimera detection were only investigated for microbial community data. Only 15 articles out of the 431 studies statistically modeled uncertainty; all of these were macroorganism studies. Of these, 14 used occupancy models, and one article used a “simulation and resampling” model (Deiner et al., 2016).
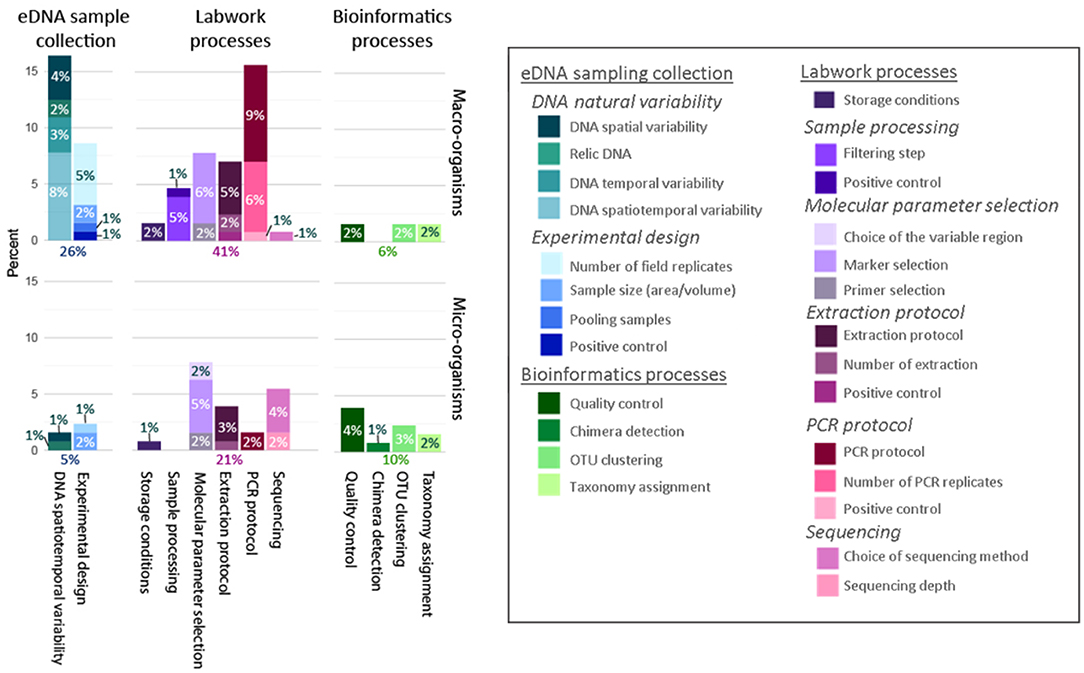
Figure 5. How uncertainty was quantified differently across all reviewed studies on microscopic (n = 41 studies) and macroscopic (n = 123 studies) communities. The percent of studies that quantified uncertainty at each of the different steps in the eDNA workflow: eDNA field sample collection (blue colors), laboratory processing (pink colors), and bioinformatics (green colors).
Suggestions of Ways to Account for Uncertainty in the eDNA Workflow
From the 164 articles quantifying sources of uncertainty, 60% did not provide any clear suggestions, 10, 17, and 14% gave weakly-, moderately- and strongly-generalisable suggestions, respectively (Table 3 presents the strongly-generalisable suggestions; moderately- and weakly- generalisable suggestions are summarized in Table S4). The weakly-generalisable suggestions were often specific to a single taxon while moderately-generalisable suggestions were often applicable to either micro- or macroscopic communities (Table S4).
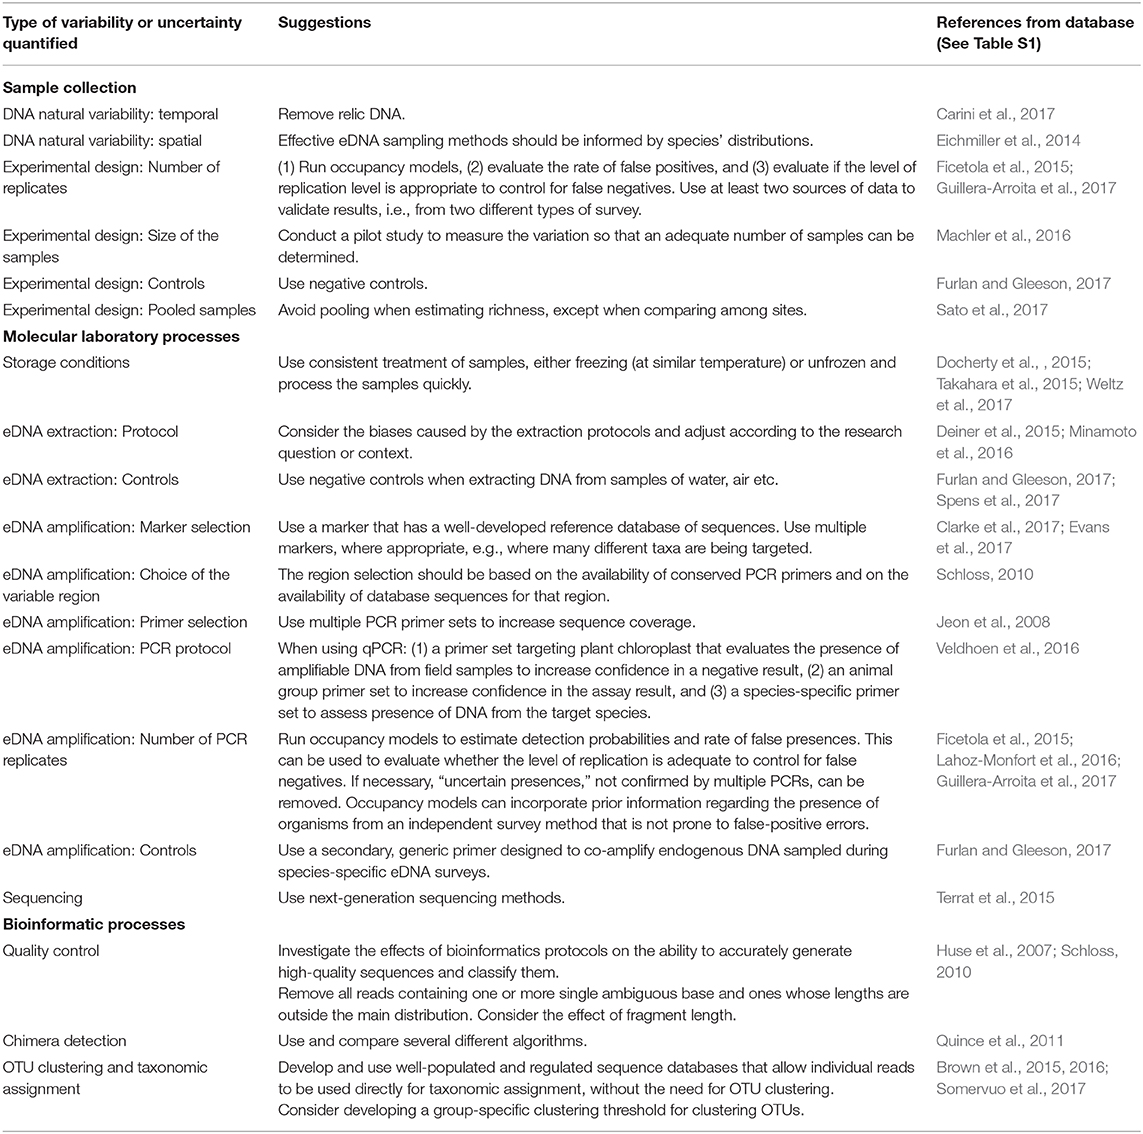
Table 3. Table of highly generalizable suggestions from the reviewed literature for measuring variability and reducing uncertainties in eDNA data at each point in the eDNA workflow.
Highly-generalisable suggestions encouraged the use of pilot studies to obtain initial estimates of variability (Machler et al., 2016) and to facilitate adaptation of the study design for each specific study context (Deiner et al., 2015; Minamoto et al., 2016). Moreover, several studies suggested using hierarchical occupancy models, to evaluate if the level of replication is adequate to minimize detection errors (Ficetola et al., 2015; Lahoz-Monfort et al., 2016; Guillera-Arroita, 2017) and to use at least two independent sources of data (such as field observations in addition to eDNA) to account for false positive detections (Guillera-Arroita, 2017). Multiple marker genes were recommended regarding sequencing library preparation for community studies (Guardiola et al., 2016; Evans et al., 2017) or multiple primer sets targeting the same gene (Jeon et al., 2008). Schloss (2010) advised variable region selection should be based on the availability of conserved PCR primers and the presence of databases with adequate data for taxonomic identification from those regions (Schloss, 2010). Ideas and recommendations regarding accounting for, or reducing uncertainty in the bioinformatics phase were primarily focused on the quality control steps, where authors remove low-quality reads by investigating technical and analytical aspects (Huse et al., 2007; Schloss, 2010). Recommendations regarding OTU clustering were to develop a group-specific clustering threshold (Brown et al., 2015) and the use of more-complete taxonomic and sequence reference databases (Brown et al., 2015; Somervuo et al., 2017).
Discussion
By analyzing the patterns in spatiotemporal variation observed in eDNA research to date, we have revealed important research gaps, and therefore highlighted where our future research efforts might best be dedicated. Overall, our results corroborate the findings of previous work (Strayer et al., 2006; Fierer, 2017), that the study of temporal variation has been neglected and the proportion of temporal studies did not increase over the reviewed period. In addition, relatively few studies have measured temporal variation over scales longer than 1 year. Second, there were relatively few studies that explicitly quantified and accounted for spatiotemporal variation and/ or uncertainties introduced by the eDNA sampling and analysis workflow, e.g., by statistical modeling or comparison of different protocols. Even where such sources of spatiotemporal variation were accounted for, the effort in quantifying this variation varied widely between the different steps in the eDNA process, from sampling, to laboratory, to bioinformatics procedures, depending on the type of organisms studied (micro- vs. macro-organisms). Finally, in contrast to taxonomic diversity, there were no studies showing how sources of spatial or temporal variation from eDNA studies affect functional and phylogenetic diversity estimates; such studies can be conducted using readily-available functional trait (e.g., the plant trait database TRY, https://www.try-db.org/TryWeb/Home.php; PICRUSt, Langille et al., 2013) and phylogenetic (e.g., the fish tree of life, https://fishtreeoflife.org/) data and would greatly inform the design and usefulness of eDNA studies for environmental monitoring. The above findings hold true when considering only newer methods, i.e., high-throughput DNA sequencing. Below, we discuss the gaps we identified in our systematic reviews, and importantly, make recommendations on ways to mitigate, and account for, spatiotemporal variation and uncertainties for future eDNA research that aims to inform environmental monitoring.
When designing appropriate eDNA studies for environmental monitoring, understanding the natural spatiotemporal scales of variation among organisms (i.e., where are targeted organisms distributed and how do these patterns vary over time?) and their DNA (i.e., where is eDNA distributed and what is its longevity in different environments?) sampled by eDNA surveys will greatly assist in ensuring sampling and replication are targeting the most informative sources of spatiotemporal variation (e.g., Lear et al., 2014; Ellis et al., 2015; Barata et al., 2017). While our review shows that spatiotemporal research in both micro- and macro-organisms has been conducted at various scales, improving our understanding requires an increase in the number of spatiotemporal studies, particularly over longer temporal scales. To be able to detect and quantify environmental changes for a given system, it is vital that we understand the ratios of spatial to temporal variation. For example, when using eDNA to monitor environmental change due to land use change or climatic change, it is crucial to understand how much spatial variation is expected between replicates compared to that expected over time. If spatial variation is relatively high, it may be difficult to detect temporal change, even over longer time periods.
Additional eDNA-specific effects need to be considered when monitoring environmental change. For example, part of the natural scale of temporal variation in eDNA data is the ability of DNA to persist in the soil or other substrates after an organism has left or died (sometimes referred to as relic DNA). Measures of natural spatiotemporal variation can be included in statistical models estimating taxon occupancy and diversity. However, temporal variation was accounted for, or measured in, only three studies in this review (Pilliod et al., 2014; Balasingham et al., 2017; Carini et al., 2017). For example, in their study, Carini et al. (2017) showed that relic DNA can increase the richness estimation of prokaryotic and fungal soil communities up to 55% and can also bias relative abundance estimates of taxa. This can affect our understanding of present-day biodiversity patterns. The analysis of environmental RNA rather than DNA provides additional opportunities for the analysis of present day diversity owing to the more transient nature of single-stranded RNA molecules, as suggested by Pochon et al. (2017) and Zaiko et al. (2018); to date however, the analysis of environmental RNA has been poorly investigated as a tool for biodiversity monitoring.
For eDNA surveys, uncertainty in the detection of taxa depends not only on natural DNA variability within the spatiotemporal scales studied, but also the eDNA survey method itself (Furlan et al., 2016). An understanding of the levels of variability in the field and lab is critical for determining the appropriate number of replicates required to reduce the variability in diversity estimates or probability of occupancy. Despite this, less than 40% of the studies in our review accounted for the uncertainty related to technical aspects of eDNA research. The most reliable and reproducible way to do this is to conduct pilot studies to quantify the spatiotemporal variation and its effects on diversity or occupancy measurements in advance of designing an eDNA survey. Our review shows that, although there are knowledge gaps particularly at the larger scales, significant information exists in the literature regarding spatiotemporal variation in eDNA that could be used to justify spatiotemporal study design choices and/ or incorporated into the subsequent analysis of eDNA data, thus avoiding additional costs by drawing on this existing knowledge. Similarly, methodological studies of technical variation introduced during the lab work or bioinformatics phases of the workflow can generate similarly useful data (e.g., Edgar, 2017, 2018; Davis A. J. et al., 2018; Hermans et al., 2018; Nearing et al., 2018; Dopheide et al., 2019). These data can be used to design a pilot study for a system that has not been previously worked on or used as prior information in statistical modeling of variation and uncertainty, e.g., to inform Bayesian priors and other forms of statistical probability inference.
Hierarchical Bayesian occupancy models can use occurrence or abundance data obtained from eDNA surveys to quantify natural spatiotemporal variation while statistically accounting for uncertainty at multiple spatial and temporal scales and can be applied in studies at the single-taxon, groups or community levels (e.g., Tyre et al., 2003; Kéry and Royle, 2009; Kery et al., 2009; Yamaura et al., 2012; Guillera-Arroita, 2017; Doi et al., 2019; Wineland et al., 2019). The development of these methods is an active area of research (e.g., Hui, 2016; Ovaskainen et al., 2017; Tobler et al., 2019), and as computing power continues to increase, such modeling has increasing potential to make powerful contributions to our understanding because they allow the incorporation of differences in organism detection, which, when ignored, can bias estimates of diversity (Iknayan et al., 2014). Few studies in our review had used this type of model (14 out of 331 articles). Similarly, Kellner and Swihart (2014) have shown that the majority (77%) of ecological studies using traditional survey methods do not account for imperfect detection. Within the relatively small number of studies in this review that accounted for uncertainty, only a few (24%) were on communities of micro-organisms. About half of the articles accounting for uncertainty compared eDNA survey results with previous knowledge or traditional survey results. This way of accounting for uncertainty is primarily used by researchers working with macroorganisms, since taxonomic analyses of microbial community composition are almost exclusively undertaken using molecular methods. One requirement of hierarchical occupancy models is that they have the appropriate data for spatiotemporal variation and uncertainties to quantify detection probabilities for taxa under the study conditions (Guillera-Arroita, 2017). However, obtaining detection probability data is not as difficult as may be expected. Indeed, as we have shown, some knowledge of the spatiotemporal scales of variation from eDNA studies exists and such data can readily be incorporated into explanatory and predictive modeling of eDNA data as Bayesian priors.
Further work needs to be undertaken on how to incorporate uncertainty from occupancy modeling into modeling diversity measurements in a way that is useful for environmental monitoring of communities and ecosystems (Denes et al., 2015; Dorazio et al., 2015). More than half of the studies on communities in this review (52%) analyzed only one type of diversity measure and, in most cases, it was taxonomic diversity. However, a focus on other measurements of diversity (functional and phylogenetic diversity) is required to better understand, not only spatiotemporal variation in community composition, but also the functional role and evolutionary history of these communities and ultimately the complex interactions among composition, function, and the evolutionary processes that shape their assembly over time and space (Pavoine and Bonsall, 2011; Fierer, 2017). No studies in this review investigated the relationship between uncertainty in eDNA methods and temporal variation in functional and phylogenetic diversity measures; indeed our search terms identified only nine studies using metagenomics methods to explore the functional diversity of communities via eDNA analysis. This is a key knowledge gap in eDNA study design. For example, if functional redundancy among taxa is present, fewer field, and laboratory replicates might be required to detect functional shifts in the studied ecosystem. Quantifying the sources of uncertainty across spatiotemporal scales in taxonomic, functional, and phylogenetic measurements of diversity will help to improve study designs and, therefore, make better recommendations for environmental management.
Research using eDNA spans a wide range of questions and requires an interdisciplinary methodological approach encompassing many methods, meaning it can be difficult to make widely applicable recommendations (Zinger et al., 2019). Nonetheless, we have collated suggestions that can be applied to improve accuracy and reproducibility at all steps of the eDNA workflow (Table 3); the largest portion of recommendations focusses on the molecular process, which is often inconsistent between research labs. Some researchers, such as Lear et al. (2018), have proposed standardized sets of methods to overcome bias impeding data comparison. However, it is clear that we need to continue putting more effort into improving eDNA methods, including the expansion of reference databases, improving targeted gene regions, and accounting for the errors and biases associated with sequencing technologies, many of which are quickly developing. In particular, researchers working on communities of macro-organisms need to do more to quantify sources of uncertainty due to bioinformatics. Crucially, the natural scales of variability and sources of uncertainty need to continue to be monitored throughout the eDNA process so we can better understand their implications.
Conclusions
Improving our understanding of both temporal and spatial variability of communities and their DNA will help us to answer both crucial methodological (e.g., what are the best sampling scales to detect environmental shifts? Where and when to sample?), and theoretical questions related to environmental monitoring (e.g., what are the factors driving temporal and spatial patterns? How can these patterns help us to measure ecosystem “health” or restoration success?). Moreover, regardless of the question that the researcher wishes to address, imperfect detection should be considered when working with ecological data using eDNA surveys, all the way from study design, through data collection, lab-work and bioinformatic processes. Multiple sources of uncertainty are present in all eDNA surveys, but robust replication in the field and laboratory can help quantify and minimize the detection errors. The combined use of prior knowledge of sources of variability from the literature or pilot studies within flexible statistical models that can incorporate these sources of information, will lead to more robust predictions of diversity and occupancy. Such experimental and modeling frameworks will also allow us to further explore the sensitivity of other biodiversity measures, such as functional and phylogenetic diversity, to detect errors and spatiotemporal variability at multiple scales. Environmental DNA is a promising method for environmental monitoring, but more research needs to be done to understand and quantity both natural spatiotemporal variation and technical variation introduced by study design and methods.
Data Availability Statement
The raw data extracted from the 431 studies are available in Table S2.
Author Contributions
HB and CM: conception and design of the study and interpretation. CM: data acquisition and analysis. CM, HB, GL, TB, SH, and KL: contributed to the writing of the manuscript.
Funding
This work was supported by funding from the New Zealand Ministry of Business, Innovation and Employment (New Zealand's Biological Heritage NSC, C09X1501).
Conflict of Interest
The authors declare that the research was conducted in the absence of any commercial or financial relationships that could be construed as a potential conflict of interest.
Acknowledgments
We thank Dave Bohan, Corinne Vacher, and five reviewers for many constructive comments that improved the paper.
Supplementary Material
The Supplementary Material for this article can be found online at: https://www.frontiersin.org/articles/10.3389/fevo.2020.00135/full#supplementary-material
References
Balasingham, K. D., Walter, R. P., and Heath, D. D. (2017). Residual eDNA detection sensitivity assessed by quantitative real-time PCR in a river ecosystem. Mol. Ecol. Resour. 17, 523–532. doi: 10.1111/1755-0998.12598
Barata, I. M., Griffiths, R. A., and Ridout, M. S. (2017). The power of monitoring: optimizing survey designs to detect occupancy changes in a rare amphibian population. Sci. Rep. 7:16491. doi: 10.1038/s41598-017-16534-8
Battin, T. J., Besemer, K., Bengtsson, M. M., Romani, A. M., and Packmann, A. I. (2016). The ecology and biogeochemistry of stream biofilms. Nat. Rev. Microbiol. 14, 251–263. doi: 10.1038/nrmicro.2016.15
Bhadury, P., Austen, M. C., Bilton, D. T., Lambshead, P. J. D., Rogers, A. D., and Smerdon, G. R. (2006). Molecular detection of marine nematodes from environmental samples: overcoming eukaryotic interference. Aquat. Microbial. Ecol. 44, 97–103. doi: 10.3354/ame044097
Boetius, A., Anesio, A. M., Deming, J. W., Mikucki, J. A., and Rapp, J. Z. (2015). Microbial ecology of the cryosphere: sea ice and glacial habitats. Nat. Rev. Microbiol. 13, 677–690. doi: 10.1038/nrmicro3522
Brown, E. A., Chain, F. J., Zhan, A., MacIsaac, H. J., and Cristescu, M. E. (2016). Early detection of aquatic invaders using metabarcoding reveals a high number of non-indigenous species in Canadian ports. Div. Distribut. 22, 1045–1059. doi: 10.1111/ddi.12465
Brown, E. A., Chain, F. J. J., Crease, T. J., MacIsaac, H. J., and Cristescu, M. E. (2015). Divergence thresholds and divergent biodiversity estimates: can metabarcoding reliably describe zooplankton communities? Ecol. Evol. 5, 2234–2251. doi: 10.1002/ece3.1485
Cantera, I., Cilleros, K., Valentini, A., Cerdan, A., Dejean, T., Iribar, A., et al. (2019). Optimizing environmental DNA sampling effort for fish inventories in tropical streams and rivers. Sci. Rep. 9:3085. doi: 10.1038/s41598-019-39399-5
Carini, P., Marsden, P. J., Leff, J., Morgan, E. E., Strickland, M. S., and Fierer, N. (2017). Relic DNA is abundant in soil and obscures estimates of soil microbial diversity. Nat. Microbiol. 2:16242. doi: 10.1038/nmicrobiol.2016.242
Cavicchioli, R. (2015). Microbial ecology of Antarctic aquatic systems. Nat. Rev. Microbiol. 13, 691–706. doi: 10.1038/nrmicro3549
Chave, J. (2013). The problem of pattern and scale in ecology: what have we learned in 20 years? Ecol. Lett. 16, 4–16. doi: 10.1111/ele.12048
Chen, G., Kéry, M., Plattner, M., Ma, K., and Gardner, B. (2013). Imperfect detection is the rule rather than the exception in plant distribution studies. J. Ecol. 101, 183–191. doi: 10.1111/1365-2745.12021
Chen, Y., Zhen, Y., He, H., Lu, X., Mi, T., and Yu, Z. (2014). Diversity, abundance, and spatial distribution of ammonia-oxidizing β-proteobacteria in sediments from Changjiang estuary and its adjacent area in East China Sea. Microb. Ecol. 67, 788–803. doi: 10.1007/s00248-013-0341-x
Clarke, L. J., Beard, J. M., Swadling, K. M., and Deagle, B. E. (2017). Effect of marker choice and thermal cycling protocol on zooplankton DNA metabarcoding studies. Ecol. Evol. 7, 873–883. doi: 10.1002/ece3.2667
Clarke, L. J., Soubrier, J., Weyrich, L. S., and Cooper, A. (2014). Environmental metabarcodes for insects: in silico PCR reveals potential for taxonomic bias. Mol. Ecol. Resour. 14, 1160–1170. doi: 10.1111/1755-0998.12265
Clusa, L., Ardura, A., Fernandez, S., Roca, A. A., and Garcia-Vazquez, E. (2017). An extremely sensitive nested PCR-RFLP mitochondrial marker for detection and identification of salmonids in eDNA from water samples. PeerJ 5:e3045. doi: 10.7717/peerj.3045
Coissac, E., Riaz, T., and Puillandre, N. (2012). Bioinformatic challenges for DNA metabarcoding of plants and animals. Mol. Ecol. 21, 1834–1847. doi: 10.1111/j.1365-294X.2012.05550.x
Darling, J. A., and Mahon, A. R. (2011). From molecules to management: adopting DNA-based methods for monitoring biological invasions in aquatic environments. Environ. Res. 111, 978–988. doi: 10.1016/j.envres.2011.02.001
Davis, A. J., Williams, K. E., Snow, N. P., Pepin, K. M., and Piaggio, A. J. (2018). Accounting for observation processes across multiple levels of uncertainty improves inference of species distributions and guides adaptive sampling of environmental DNA. Ecol. Evol. 8, 10879–10892. doi: 10.1002/ece3.4552
Davis, N. M., Proctor, D. M., Holmes, S. P., Relman, D. A., and Callahan, B. J. (2018). Simple statistical identification and removal of contaminant sequences in marker-gene and metagenomics data. Microbiome 6:226. doi: 10.1186/s40168-018-0605-2
Deiner, K., Fronhofer, E. A., Machler, E., Walser, J. C., and Altermatt, F. (2016). Environmental DNA reveals that rivers are conveyer belts of biodiversity information. Nat. Commun. 7:12544. doi: 10.1038/ncomms12544
Deiner, K., Walser, J-C., Maechler, E., and Altermatt, F. (2015). Choice of capture and extraction methods affect detection of freshwater biodiversity from environmental DNA. Biol. Conserv. 183, 53–63. doi: 10.1016/j.biocon.2014.11.018
Denes, F. V., Silveira, L. F., and Beissinger, S. R. (2015). Estimating abundance of unmarked animal populations: accounting for imperfect detection and other sources of zero inflation. Methods Ecol. Evol. 6, 543–556. doi: 10.1111/2041-210X.12333
Dickie, I. A., Boyer, S., Buckley, H., Duncan, R. P., Gardner, P., and Hogg, I. D. (2018). Towards robust and repeatable sampling methods in eDNA based studies. Mol. Ecol. Resour. 18, 940–952. doi: 10.1111/1755-0998.12907
Docherty, K. M., Borton, H. M., Espinosa, N., Gebhardt, M., Gil-Loaiza, J., Gutknecht, J. L., et al. (2015). Key edaphic properties largely explain temporal and geographic variation in soil microbial communities across four biomes. PLoS ONE 10:e0135352. doi: 10.1371/journal.pone.0135352
Doi, H., Fukaya, K., Oka, S-I., Sato, K., Kondoh, M., and Miya, M. (2019). Evaluation of detection probabilities at the water-filtering and initial PCR steps in environmental DNA metabarcoding using a multispecies site occupancy model. Sci. Rep. 9:3581. doi: 10.1038/s41598-019-40233-1
Dopheide, A., Lear, G., He, Z., Zhou, J., and Lewis, G. D. (2015). Functional gene composition, diversity and redundancy in microbial stream biofilm communities. PLoS ONE 10:e123179. doi: 10.1371/journal.pone.0123179
Dopheide, A., Xie, D., Buckley, T. R., Drummond, A. J., and Newcomb, R. D. (2019). Impacts of DNA extraction and PCR on DNA metabarcoding estimates of soil biodiversity. Methods Ecol Evol. 10,120–133. doi: 10.1111/2041-210X.13086
Dorazio, R. M., Connor, E. F., and Askins, R. A. (2015). Estimating the effects of habitat and biological interactions in an avian community. PLoS ONE 10:e0135987. doi: 10.1371/journal.pone.0135987
Dulias, K., Stoof-Leichsenring, K. R., Pestryakova, L. A., and Herzschuh, U. (2017). Sedimentary DNA versus morphology in the analysis of diatom-environment relationships. J. Paleolimnol. 57, 51–66. doi: 10.1007/s10933-016-9926-y
Edgar, R. C. (2017). UNBIAS: an attempt to correct abundance bias in 16S sequencing, with limited success. BioRxiv 124149. doi: 10.1101/124149
Edgar, R. C. (2018). Updating the 97% identity threshold for 16S ribosomal RNA OTUs. Bioinformatics 34, 2371–2375. doi: 10.1093/bioinformatics/bty113
Eichmiller, J. J., Bajer, P. G., and Sorensen, P. W. (2014). The relationship between the distribution of common carp and their environmental DNA in a small lake. PLoS ONE 9:e112611. doi: 10.1371/journal.pone.0112611
Ellis, M. M., Ivan, J. S., Tucker, J. M., and Schwartz, M. K. (2015). rSPACE: spatially based power analysis for conservation and ecology. Methods Ecol. Evol. 6, 621–625. doi: 10.1111/2041-210X.12369
Eme, D., Zagmajster, M., Fišer, C., Galassi, D., Marmonier, P., Stoch, F., et al. (2015). Multi-causality and spatial non-stationarity in the determinants of groundwater crustacean diversity in Europe. Ecography 38, 531–540. doi: 10.1111/ecog.01092
Erickson, R. A., Rees, C. B., Coulter, A. A., Merkes, C. M., McCalla, S. G., Touzinsky, K. F., et al. (2016). Detecting the movement and spawning activity of bigheaded carps with environmental DNA. Mol. Ecol. Res. 16, 957–965. doi: 10.1111/1755-0998.12533
Evans, N. T., Li, Y., Renshaw, M. A., Olds, B. P., Deiner, K., Turner, C. R., et al. (2017). Fish community assessment with eDNA metabarcoding: effects of sampling design and bioinformatic filtering. Can. J. Fish. Aquat. Sci. 74, 1362–1374. doi: 10.1139/cjfas-2016-0306
Ficetola, G. F., Pansu, J., Bonin, A., Coissac, E., Giguet-Covex, C., De Barba, M., et al. (2015). Replication levels, false presences and the estimation of the presence/absence from eDNA metabarcoding data. Mol. Ecol. Resour. 15, 543–556. doi: 10.1111/1755-0998.12338
Fierer, N. (2017). Embracing the unknown: disentangling the complexities of the soil microbiome. Nat. Rev. Microbiol. 15:579. doi: 10.1038/nrmicro.2017.87
Furlan, E. M., and Gleeson, D. (2017). Improving reliability in environmental DNA detection surveys through enhanced quality control. Marine Freshw. Res. 68, 388–395. doi: 10.1071/MF15349
Furlan, E. M., Gleeson, D., Hardy, C. M., and Duncan, R. P. (2016). A framework for estimating the sensitivity of eDNA surveys. Mol. Ecol. Resour. 16, 641–654. doi: 10.1111/1755-0998.12483
Goldberg, C. S., Turner, C. R., Deiner, K., Klymus, K. E., Thomsen, P. F., Murphy, M. A., et al. (2016). Critical considerations for the application of environmental DNA methods to detect aquatic species. Methods Ecol. Evol. 7, 1299–1307. doi: 10.1111/2041-210X.12595
Guardiola, M., Wangensteen, O. S., Taberlet, P., Coissac, E., Jesus Uriz, M., and Turon, X. (2016). Spatio-temporal monitoring of deep-sea communities using metabarcoding of sediment DNA and RNA. PeerJ 4:e2807. doi: 10.7717/peerj.2807
Guillera-Arroita, G. (2017). Modelling of species distributions, range dynamics and communities under imperfect detection: advances, challenges and opportunities. Ecography 40, 281–295. doi: 10.1111/ecog.02445
Guillera-Arroita, G., Lahoz-Monfort, J. J., van Rooyen, A. R., Weeks, A. R., and Tingley, R. (2017). Dealing with false-positive and false?negative errors about species occurrence at multiple levels. Methods Ecol. Evol. 8, 1081–1091. doi: 10.1111/2041-210X.12743
Hermans, S. M., Buckley, H. L., and Lear, G. (2018). Optimal extraction methods for the simultaneous analysis of DNA from diverse organisms and sample types. Mol. Ecol. Resour. 18, 557–569. doi: 10.1111/1755-0998.12762
Holdaway, R. J., Wood, J. R., Dickie, I. A., Orwin, K. H., Bellingham, P. J., Richardson, S. J., et al. (2017). Using DNA metabarcoding to assess New Zealand's terrestrial biodiversity. New Zeal. J. Ecol. 41, 251–262. doi: 10.20417/nzjecol.41.28
Hui, F. K. (2016). boral–Bayesian ordination and regression analysis of multivariate abundance data in R. Methods Ecol. Evol. 7, 744–750. doi: 10.1111/2041-210X.12514
Huse, S. M., Huber, J. A., Morrison, H. G., Sogin, M. L., and Mark Welch, D. (2007). Accuracy and quality of massively parallel DNA pyrosequencing. Genome Biol. 8:R143. doi: 10.1186/gb-2007-8-7-r143
Iknayan, K. J., Tingley, M. W., Furnas, B. J., and Beissinger, S. R. (2014). Detecting diversity: emerging methods to estimate species diversity. Trends Ecol. Evol. 29, 97–106. doi: 10.1016/j.tree.2013.10.012
Janosik, A. M., and Johnston, C. E. (2015). Environmental DNA as an effective tool for detection of imperiled fishes. Environ. Biol. Fish. 98, 1889–1893. doi: 10.1007/s10641-015-0405-5
Jansson, J. K., and Tas, N. (2014). The microbial ecology of permafrost. Nat. Rev. Microbiol. 12, 414–425. doi: 10.1038/nrmicro3262
Jeffries, T. C., Schmitz Fontes, M. L., Harrison, D. P., Van-Dongen-Vogels, V., Eyre, B. D., Ralph, P. J., et al. (2016). Bacterioplankton dynamics within a large anthropogenically impacted urban estuary. Front. Microbiol. 6:1438. doi: 10.3389/fmicb.2015.01438
Jeon, S., Bunge, J., Leslin, C., Stoeck, T., Hong, S., and Epstein, S. S. (2008). Environmental rRNA inventories miss over half of protistan diversity. BMC Microbiol. 8:222. doi: 10.1186/1471-2180-8-222
Kellner, K. F., and Swihart, R. K. (2014). Accounting for imperfect detection in ecology: a quantitative review. PLoS ONE 9:e111436. doi: 10.1371/journal.pone.0111436
Kery, M., Dorazio, R. M., Soldaat, L., Van Strien, A., Zuiderwijk, A., and Royle, J. A. (2009). Trend estimation in populations with imperfect detection. J. Appl. Ecol. 46, 1163–1172. doi: 10.1111/j.1365-2664.2009.01724.x
Kéry, M., and Royle, J. A. (2009). “Inference about species richness and community structure using species-specific occupancy models in the national Swiss breeding bird survey MHB,” in Modeling Demographic Processes in Marked Populations, eds D. L. Thomson, E. G. Cooch, M. J. Conroy (Boston, MA: Springer), 639–656. doi: 10.1007/978-0-387-78151-8_28
Kysela, D. T., Randich, A. M., Caccamo, P. D., and Brun, Y. V. (2016). Diversity takes shape: understanding the mechanistic and adaptive basis of bacterial morphology. PLoS Biol. 14:e1002565. doi: 10.1371/journal.pbio.1002565
Lahoz-Monfort, J. J., Guillera-Arroita, G., and Tingley, R. (2016). Statistical approaches to account for false-positive errors in environmental DNA samples. Mol. Ecol. Resour. 16, 673–685. doi: 10.1111/1755-0998.12486
Langille, M. G., Zaneveld, J., Caporaso, J. G., McDonald, D., Knights, D., Reyes, J. A., et al. (2013). Predictive functional profiling of microbial communities using 16S rRNA marker gene sequences. Nat. Biotechnol. 31, 814–821. doi: 10.1038/nbt.2676
Lear, G., Bellamy, J., Case, B. S., Lee, J. E., and Buckley, H. L. (2014). Fine-scale spatial patterns in bacterial community composition and function within freshwater ponds. ISME J. 8, 1715–1726. doi: 10.1038/ismej.2014.21
Lear, G., Dickie, I., Banks, J., Boyer, S., Buckley, H. L., Buckley, T. R., et al. (2018). Methods for the extraction, storage, amplification and sequencing of DNA from environmental samples. New Zeal. Ecol. Soc. 42, 10–50A. doi: 10.20417/nzjecol.42.9
Levin, S. A. (1992). The problem of pattern and scale in ecology: the Robert H. MacArthur award lecture. Ecology 73, 1943–1967. doi: 10.2307/1941447
Machler, E., Deiner, K., Spahn, F., and Altermatt, F. (2016). Fishing in the water: effect of sampled water volume on environmental DNA-based detection of macroinvertebrates. Environ. Sci. Technol. 50, 305–312. doi: 10.1021/acs.est.5b04188
Martiny, J. B. H., Bohannan, B. J. M., Brown, J. H., Colwell, R. K., Fuhrman, J. A., Green, J. L., et al. (2006). Microbial biogeography: putting microorganisms on the map. Nat. Rev. Microbiol. 4, 102–112. doi: 10.1038/nrmicro1341
Minamoto, T., Naka, T., Moji, K., and Maruyama, A. (2016). Techniques for the practical collection of environmental DNA: filter selection, preservation, and extraction. Limnology 17, 23–32. doi: 10.1007/s10201-015-0457-4
Nearing, J. T., Douglas, G. M., Comeau, A. M., and Langille, M. G. I. (2018). Denoising the denoisers: an independent evaluation of microbiome sequence error-correction approaches. PeerJ 6:e5364. doi: 10.7717/peerj.5364
Ovaskainen, O., Tikhonov, G., Norberg, A., Guillaume Blanchet, F., Duan, L., Dunson, D., et al. (2017). How to make more out of community data? A conceptual framework and its implementation as models and software. Ecol. Lett. 20, 561–576. doi: 10.1111/ele.12757
Pavoine, S., and Bonsall, M. B. (2011). Measuring biodiversity to explain community assembly: a unified approach. Biol. Rev. 86, 792–812. doi: 10.1111/j.1469-185X.2010.00171.x
Pickering, C., and Byrne, J. (2014). The benefits of publishing systematic quantitative literature reviews for PhD candidates and other early-career researchers. High. Educ. Res. Dev. 33, 534–548. doi: 10.1080/07294360.2013.841651
Pilliod, D. S., Goldberg, C. S., Arkle, R. S., and Waits, L. P. (2014). Factors influencing detection of eDNA from a stream-dwelling amphibian. Mol. Ecol. Resour. 14, 109–116. doi: 10.1111/1755-0998.12159
Pochon, X., Zaiko, A., Fletcher, L. M., Laroche, O., and Wood, S. (2017). Wanted dead or alive? Using metabarcoding of environmental DNA and RNA to distinguish living assemblages for biosecurity applications. PLoS ONE 12:e0187636. doi: 10.1371/journal.pone.0187636
QGIS Development Team (2018). QGIS Geographic Information System. Open Source Geospatial Foundation Project. Available online at: http://qgis.osgeo.org.
Quince, C., Lanzen, A., Davenport, R. J., and Turnbaugh, P. J. (2011). Removing noise from pyrosequenced amplicons. BMC Bioinformatics. 12:38. doi: 10.1186/1471-2105-12-38
R Core Team. (2019). R: A Language and Environment for Statistical Computing. Vienna: R Foundation for Statistical Computing. Available online at: https://www.R-project.org/ (accessed May, 2020).
Ranjard, L., Poly, F., and Nazaret, S. (2000). Monitoring complex bacterial communities using culture-independent molecular techniques: application to soil environment. Res. Microbiol. 151, 167–177. doi: 10.1016/S0923-2508(00)00136-4
Rees, H. C., Bishop, K., Middleditch, D. J., Patmore, J. R. M., Maddison, B. C., and Gough, K. C. (2014). The application of eDNA for monitoring of the great crested newt in the UK. Ecol. Evol. 4, 4023–4032. doi: 10.1002/ece3.1272
Sandel, B., and Smith, A. B. (2009). Scale as a lurking factor: incorporating scale-dependence in experimental ecology. Oikos 118, 1284–1291. doi: 10.1111/j.1600-0706.2009.17421.x
Sato, H., Sogo, Y., Doi, H., and Yamanaka, H. (2017). Usefulness and limitations of sample pooling for environmental DNA metabarcoding of freshwater fish communities. Sci. Rep. 7, 1–12. doi: 10.1038/s41598-017-14978-6
Schloss, P. D. (2010). The effects of alignment quality, distance calculation method, sequence filtering, and region on the analysis of 16S rRNA gene-based studies. PLOS Comput. Biol. 6:e1000844. doi: 10.1371/journal.pcbi.1000844
Schmidt, B. R., Kery, M., Ursenbacher, S., Hyman, O. J., and Collins, J. P. (2013). Site occupancy models in the analysis of environmental DNA presence/absence surveys: a case study of an emerging amphibian pathogen. Methods Ecol. Evol. 4, 646–653. doi: 10.1111/2041-210X.12052
Schnell, I. B., Bohmann, K., and Gilbert, M. T. P. (2015). Tag jumps illuminated – reducing sequence-to-sample misidentifications in metabarcoding studies. Mol. Ecol. Resour. 15, 1289–1303. doi: 10.1111/1755-0998.12402
Schwob, G., Roy, M., Manzi, S., Pommier, T., and Fernandez, M. P. (2017). Green alder (Alnus viridis) encroachment shapes microbial communities in subalpine soils and impacts its bacterial or fungal symbionts differently. Environ. Microbiol. 19, 3235–3250. doi: 10.1111/1462-2920.13818
Shade, A., Dunn, R. R., Blowes, S. A., Keil, P., Bohannan, B. J. M., and Herrmann, M. (2018). Macroecology to unite all life, large and small. Trends Ecol. Evol. 33, 731–744. doi: 10.1016/j.tree.2018.08.005
Somervuo, P., Yu, D. W., Xu, C. C. Y., Ji, Y., Hultman, J., Wirta, H., et al. (2017). Quantifying uncertainty of taxonomic placement in DNA barcoding and metabarcoding. Methods Ecol. Evol. 8, 398–407. doi: 10.1111/2041-210X.12721
Spens, J., Evans, A. R., Halfmaerten, D., Knudsen, S. W., Sengupta, M. E., Mak, S. S., et al. (2017). Comparison of capture and storage methods for aqueous macrobial eDNA using an optimized extraction protocol: advantage of enclosed filter. Methods Ecol. Evol. 8, 635–645. doi: 10.1111/2041-210X.12683
Strayer, D. L., Eviner, V. T., Jeschke, J. M., and Pace, M. L. (2006). Understanding the long-term effects of species invasions. Trends Ecol. Evol. 21, 645–651. doi: 10.1016/j.tree.2006.07.007
Taberlet, P., Coissac, E., Hajibabaei, M., and Rieseberg, L. H. (2012). Environmental DNA. Mol. Ecol. 21, 1789–1793. doi: 10.1111/j.1365-294X.2012.05542.x
Taberlet, P., Bonin, A., Zinger, L., and Coissac, E. (2018). Environmental DNA: For Biodiversity Research and Monitoring. Oxford: Oxford University Press. doi: 10.1093/oso/9780198767220.001.0001
Takahara, T., Minamoto, T., and Doi, H. (2015). Effects of sample processing on the detection rate of environmental DNA from the Common Carp (Cyprinus carpio). Biol. Conserv. 183, 64–69. doi: 10.1016/j.biocon.2014.11.014
Terrat, S., Plassart, P., Bourgeois, E., Ferreira, S., Dequiedt, S., Adele-Dit-De-Renseville, N., et al. (2015), Meta-barcoded evaluation of the ISO-11063 standard. Microb. Biotechnol. 8:131–142. doi: 10.1111/1751-7915.12162
Tobler, M. W., Kéry, M., Hui, F. K., Guillera-Arroita, G., Knaus, P., and Sattler, T. (2019). Joint species distribution models with species correlations and imperfect detection. Ecology 100:e02754. doi: 10.1002/ecy.2754
Tyre, A. J., Tenhumberg, B., Field, S. A., Niejalke, D., Parris, K., and Possingham, H. P. (2003). Improving precision and reducing bias in biological surveys: estimating false-negative error rates. Ecol. Appl. 13, 1790–1801. doi: 10.1890/02-5078
Veldhoen, N., Hobbs, J., Ikonomou, G., Hii, M., Lesperance, M., and Helbing, C. C. (2016). Implementation of novel design features for qPCR-based eDNA assessment. PLoS ONE 11:e0164907. doi: 10.1371/journal.pone.0164907
Vörös, J., Márton, O., Schmidt, B. R., Gál, J. T., and Jelić, D. (2017). Surveying Europe's only cave-dwelling chordate species (proteus anguinus) using environmental DNA. PLoS ONE 12:e0170945. doi: 10.1371/journal.pone.0170945
Weltz, K., Lyle, J. M., Ovenden, J., Morgan, J. A., Moreno, D. A., and Semmens, J. M. (2017). Application of environmental DNA to detect an endangered marine skate species in the wild. PLoS ONE 12:e178124. doi: 10.1371/journal.pone.0178124
Wineland, S. M., Welch, S. M., Pauley, T. K., Apodaca, J. J., Olszack, M., Mosher, J. J., et al. (2019). Using environmental DNA and occupancy modelling to identify drivers of easrtern hellbender (Cryptobranchus alleganiensis alleganiensis) extirpation. Freshwater Biol. 64, 208–221. doi: 10.1111/fwb.13210
Yamaura, Y., Royle, J. A., Shimada, N., Asanuma, S., Sato, T., Taki, H., et al. (2012). Biodiversity of man-made open habitats in an underused country: a class of multispecies abundance models for count data. Biodiv. Conserv. 21, 1365–1380. doi: 10.1007/s10531-012-0244-z
Zaiko, A., Pochon, X., Garcia-Vazquex, E., Olenin, S., and Wood, S. A. (2018). Advantages and limitations of environmental DNA/RNA tools for marine biosecurity: management and surveillance of non-indigenous species. Front. Mar. Sci. 5:322. doi: 10.3389/fmars.2018.00322
Zeglin, L. H. (2015). Stream microbial diversity in response to environmental changes: review and synthesis of existing research. Front. Microbiol. 6:454. doi: 10.3389/fmicb.2015.00454
Keywords: bioinformatics, community, eDNA, experimental design, single taxon, spatiotemporal scale, uncertainty, variability
Citation: Mathieu C, Hermans SM, Lear G, Buckley TR, Lee KC and Buckley HL (2020) A Systematic Review of Sources of Variability and Uncertainty in eDNA Data for Environmental Monitoring. Front. Ecol. Evol. 8:135. doi: 10.3389/fevo.2020.00135
Received: 12 June 2019; Accepted: 23 April 2020;
Published: 19 May 2020.
Edited by:
David Andrew Bohan, INRA Centre Dijon Bourgogne Franche-Comté, FranceReviewed by:
Zacchaeus Greg Compson, University of New Brunswick Fredericton, CanadaAgnès Bouchez, INRA Centre Alpin de Recherche sur les Réseaux Trophiques des Ecosystèmes Limniques, France
Copyright © 2020 Mathieu, Hermans, Lear, Buckley, Lee and Buckley. This is an open-access article distributed under the terms of the Creative Commons Attribution License (CC BY). The use, distribution or reproduction in other forums is permitted, provided the original author(s) and the copyright owner(s) are credited and that the original publication in this journal is cited, in accordance with accepted academic practice. No use, distribution or reproduction is permitted which does not comply with these terms.
*Correspondence: Hannah L. Buckley, hannah.buckley@aut.ac.nz
†Present address: Chloé Mathieu, Observatoire des Galliformes de Montagne, Sévrier, France