Strong Interspecific Differences in Foraging Activity Observed Between Honey Bees and Bumble Bees Using Miniaturized Radio Frequency Identification (RFID)
 Danny F. Minahan
 Johanne Brunet
- 1Department of Integrative Biology, University of Wisconsin, Madison, WI, United States
- 2USDA–Agricultural Research Service, Vegetable Crop Research Unit, Department of Entomology, University of Wisconsin, Madison, WI, United States
- 3Department of Entomology, University of Wisconsin, Madison, WI, United States
Central place foragers depart from and return to a central location with enough resources for themselves, and in many cases, for the group. Honey bees and bumble bees are eusocial central place foragers. Honey bees have large perennial colonies while bumble bee colonies are annual and considerably smaller. Foraging range, body size, and division of labor also vary between these two bee species. Honey bees use their unique dance language to recruit foragers to the most profitable patches. Bumble bees exploit patches individually and develop trapline foraging patterns. We expect such differences among bee species to engender differences in foraging activity. Moreover, variation in resource availability and in colony needs over the flowering season, can affect bee foraging activity. Finally, spatial variation in resource availability may impact bumble bees to a greater extent than honey bees due to their smaller foraging range. Using miniaturized radio frequency identification (RFID), we tracked the foraging activity of individual bees to and from hives at three sites and over five time periods. Pollen pellets were also collected from bees returning to the hive. We compared the European honey bee, Apis mellifera, and the common eastern bumble bee, Bombus impatiens. Linear mixed effect models determined the impact of bee species, time of season (period) and site, and their interactions, on multiple foraging metrics calculated from the RFID data and on pollen dry weight. Relative to honey bees, individual bumble bees made more foraging trips each day, resulting in a greater time spent foraging. A greater proportion of RFID tagged bumble bees foraged each day and bumble bees brought heavier pollen sacs to the hive compared to honey bees. Foraging bout duration did not vary between bee species and none of the foraging metrics varied among time periods or among sites. Both bee species brought heavier pollen sacs back to the hive at the beginning and the end of the flowering season. These results are discussed in terms of species differences in foraging strategies, size of individuals and colonies, and temporal variation in colony needs and resource availability.
Introduction
Approximately 87% of flowering plants around the globe (Ollerton et al., 2011) and 35% of all crops grown for human consumption (Klein et al., 2007) benefit from animal pollination. Bees are important visitors to both crops and wildflowers, yet many bee species are in decline because of the combined effects of habitat loss, pesticide exposure, and pathogens (Naug, 2009; Cameron et al., 2011; Goulson et al., 2015). Bees are limited by the area of habitat available which is essential for nesting and gathering of floral resources, and the negative impact of habitat loss on bees may be most pronounced in areas where natural habitat is already limited (Winfree et al., 2009). In addition, exposure to neonicotinoid pesticides negatively affects the ability of honey bees to navigate back to their hive following artificial displacement (Fischer et al., 2014) and increases the foraging effort of bumble bees (Stanley et al., 2016). Importantly, these sublethal effects of neonicotinoid pesticide exposure can further exacerbate the negative impacts of pathogens such as Nosema and black queen cell virus on bees (Doublet et al., 2015). Given the numerous challenges facing bees, a better understanding of bee foraging over time and space, and for distinct species would facilitate the development of sound conservation strategies.
Bees are central place foragers, implying that they must depart a nesting site, locate and gather resources, and return with these resources to the hive or nesting area (Charnov, 1976). Honey bees and bumble bees are both generalist eusocial foragers that collect resources from a broad spectrum of plant taxa (Waser et al., 1996). The identity and quality of flowering plant resources can vary through time and space, and, therefore, under optimal foraging theory (Pyke, 1984), the strategies used by central place foragers to gather resources must be amenable to these fluctuations in resource availability (Goulson, 1999). Honey bees will forage at distances generally less than 6 km (Visscher and Seeley, 1982), but only a small fraction may forage within a 0.5 km radius around the hive (Beekman and Ratnieks, 2000), as indicated by waggle dance decoding. In contrast, a foraging range of less than 800 m was identified for several bumble bee species (Bombus terrestris, B. pratorum, B. pascuorum, and B. lapidarius) using sister-sister pairing with microsatellites (Knight et al., 2005). Wolf and Moritz (2008) obtained comparable results using distance from nest sampling in B. terrestris. In addition, the foraging range of bumble bees tends to decrease with increasing resource availability and decreased land fragmentation (Redhead et al., 2016), and high local resource availability can increase queen production (Herrmann et al., 2017). These results suggest possible differences in foraging strategies of honey bees and bumble bees in response to available resources.
Honey bees are perennial with a queen actively laying eggs and the colony capable of surviving multiple years (Seeley, 1978). In contrast, a bumble bee colony is annual, and the founding queen only lives for a single foraging season. New bumble bee queens are produced in the fall, disperse and hibernate through the winter, ultimately building a new hive the following foraging season (Michener, 2000). In addition, while individual bumble bees are larger than honey bees, honey bee colonies are much larger than bumble bee colonies. While a honey bee colony can contain 60,000 workers, a bumble bee colony can have between 50 and 250 workers, depending on the bee species. Moreover, honey bees have a higher level of communication and eusociality with a more structured division of labor relative to bumble bees. A known mode of information transmission for honey bees is the dance language, which communicates the distance, direction, and quality of resources to prospective foragers (Von Frisch, 1967; Seeley et al., 1991). The dance language is thought to allocate foraging workers to the best available patches in the landscape to gather resources (Couvillon and Ratnieks, 2015). While individual honey bees do not all follow dances before foraging, they are more likely to do so if they are novice foragers, have not foraged for a while, or their latest foraging trips were not rewarding (Biesmeijer and Seeley, 2005). Bumble bees, in contrast, do not have a dance language to communicate resource location, but they do actively “run” around the inside of their hive following a return to the hive with resources, possibly to stimulate foraging activity (Dornhaus and Chittka, 2001). In addition, activation of bumble bee foragers occurs following the addition of floral scent into a hive, and this behavior is especially pronounced when the scent is added to honey pots (Molet et al., 2009). Honey bees may therefore locate rewarding resources more efficiently relative than bumble bees.
While bumble bees are known to rely on trapline foraging strategies when visiting flowers, this strategy is not typically used by honey bees (Pasquaretta et al., 2017). Trapline foraging allows individuals to follow learned routes known to be profitable (Thomson et al., 1997; Ohashi et al., 2008). Trapline foraging is considered an optimal strategy, whereby individual bees learn the location of rewarding patches, and repeatedly visit these patches in a predictable route that develops over multiple independent foraging bouts (Lihoreau et al., 2012; Keasar et al., 2013; Woodgate et al., 2017). Trapline foraging increases the overall rewards obtained per plant visit (Williams and Thomson, 1998) and decreases overall search times (Saleh and Chittka, 2007). Pasquaretta et al. (2017) used network analysis to investigate the development of trapline foraging patterns in bumble bees and honey bees and found that bumble bees tend to quickly develop optimal routes at smaller spatial scales, while optimal trapline routes do not develop in honey bees except, possibly, at larger spatial scales.
We expect these differences in life history, body and colony size, division of labor, communication, and foraging strategies to engender differences in foraging activity between these two groups of bees. Foraging activity metrics include foraging bout duration, number of foraging bouts per bee and proportion of foragers gathering resources on a given day. The quicker location of rewards generated with the waggle dance and the trapline foraging of bumble bees may both affect foraging bout duration. The smaller colony size of bumble bees could necessitate a greater proportion of the bumble bee workforce being allocated to foraging relative to honey bees, and at the individual bee level, greater foraging activity per bee. Temporal variation in resource availability over the flowering season could also affect bee foraging. If fewer resources are available early and late in the flowering season, bees may spend more time foraging during these periods relative to the middle of the flowering season to bring sufficient resources to the hive. But colony needs will also affect foraging and are likely to change over the flowering season. Pollen needs are expected to be greater during brood production while, at least for honey bees, nectar needs may increase later in the season in order to make sufficient honey to survive the winter months. Lastly, variation in resource availability among sites may impact bumble bees to a greater extent than honey bees due to their smaller foraging range (Visscher and Seeley, 1982; Pasquaretta et al., 2017). There are many reasons to expect foraging activity to vary over time, over space and among bee species.
The application of radio frequency identification (RFID) technology has increased enormously over the last 10 years and miniaturization of the tags have permitted its use to determine movement of honey bees and bumble bees to and from their hives (Pahl et al., 2011; Schneider et al., 2012). The use of radio frequency identification (RFID) provides a relatively novel and reliable tool to gather data on individual bees, as each microchip contains a unique identification number. Previous research using RFID demonstrated that honey bees can home in on their hive from 13 km away (Pahl et al., 2011). However, neonicotinoid pesticides can decrease the overall homing success (return rate) of foraging honey bees (Henry et al., 2012) and lower the foraging activity and increase foraging time of honey bee individuals (Schneider et al., 2012). Likewise, bees exposed to Fipronil pesticide via treated feeding sites decreased the number of foraging bouts and increased foraging bout duration (Decourtye et al., 2011). Moreover, RFID data indicated strong diurnal foraging patterns of two bumble bee species at northern latitudes with 24-h daylight sun (Stelzer and Chittka, 2010). RFID technology therefore represents a powerful tool for gathering data on foraging patterns of bees.
In the current study, we used miniaturized radio frequency identification (RFID) techniques to measure and compare the foraging activity of two bee species, the European honey bee, Apis mellifera, and the common eastern bumble bee, Bombus impatiens. RFID data were collected in 2016 at three separate sites and throughout the flowering season. These data were used to quantify different foraging metrics at the colony, individual bee, and foraging bout levels. In addition, we assessed the weight of pollen pellets bees brought back to the hive following a foraging trip in an attempt to link foraging time to resource acquisition. The impact of bee species, site, time of flowering season, and their interactions on the different foraging metrics and on pollen dry weight were examined using linear mixed effect models. Results are discussed in the context of differences in life history, colony size, and foraging strategies between these two bee species, and with respect to variation in colony needs over time and resource availability over time and space. Identifying spatial, temporal, and species differences in foraging metrics would help land managers improve conservation strategies for pollinator communities.
Materials and Methods
Study Area and Bee Species
This study was conducted at the West Madison Agricultural Research Station (WMARS) in Madison, WI. This area is in a suburban-agricultural landscape, with a high proportion of arable experimental crop lands, roadside habitats, and suburban gardens (Figure 1). Radio Frequency identification (RFID) data and pollen pellets were collected from three sites in the summer of 2016 (Figure 1). Each site was selected based on a qualitative estimate of plant species richness within a 0.5 km radius around the hives and suggested increasing species richness from sites 1, 3, and 2, respectively. One hive of the European honey bee, A. mellifera, and one hive of the common eastern bumble bee, B. impatiens were placed at each site and separated by 60 m at site 2, and 100 m at sites 1 and 3. Each honey bee hive consisted of 2- deep frames vertically stacked in a wooden observation hive, with ~2,000 bees, each of which was housed in a 1.2 m3 wooden box with an exit tunnel allowing access outside. At the beginning of the experiment the bottom frame of each honey bee hive consisted of approximately half the frame covered in a combination of capped and open brood, while the top frame consisted of at least half a frame of honey. Each hive was queen right. These initial conditions allowed the colony some room to grow, albeit highly limited by the small hive size. Each bumble bee hive (Koppert Biological Systems, Howell, MI, USA) was placed in a small wooden shelter located 0.5 m off the ground and contained ~75 worker bees at the start of the experiment. Among sites, the hive locations ranged from 700 to 1,500 m apart (sites 1–2: 700 m; sites 1–3 1,500 m; sites 2–3 1,400 m).
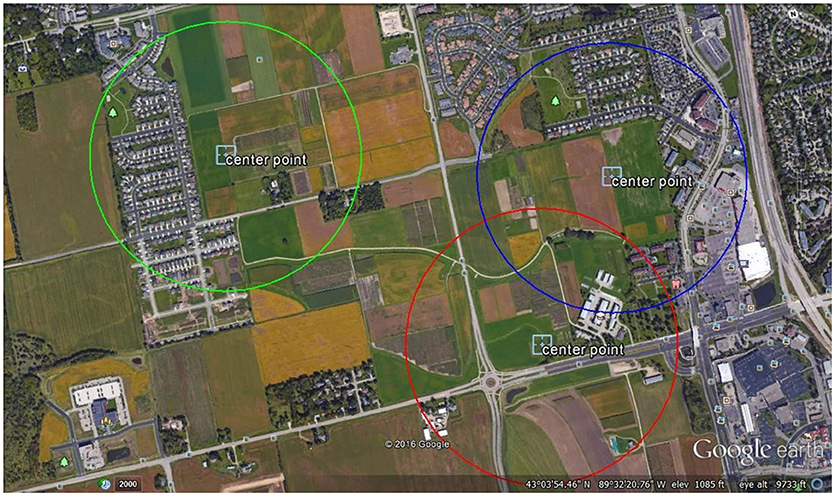
Figure 1. Aerial screenshot of the site locations. One honey bee and one bumble bee hives were located in the middle of each circle depicted as a 0.5 km radius at each location.
Data Collection
Radio Frequency Identification (RFID) data and pollen pellets were collected from the three sites and over five time periods between mid-June and mid-September. Within each period, we collected data for a total of 3 days from each site, moving among sites each day to randomize data collection among sites. Data were collected simultaneously from the honey bee and bumble bee hives at an individual site, using RFID reader pairs specific for honey bees and bumble bees, respectively. This pattern of data collection resulted in 9 data collection days within each period, with each site being visited every 4 to 5 days. Furthermore, the total duration of each period ranged from 10 to 17 days depending on weather (Table 1). The RFID data and pollen pellets were typically gathered on non-rainy days when the temperatures ranged between 21 and 35°C.
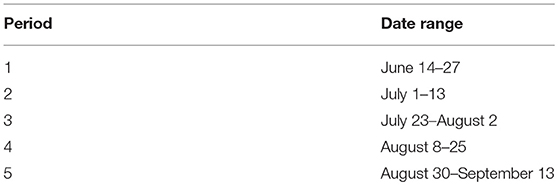
Table 1. Range of dates for collection of the Radio Frequency Identification (RFID) data and pollen pellets for each of the five periods over the three sites.
Radio Frequency Identification
Prior to each of the five data collection periods, a uniquely coded passive RFID tag (mic3–TAG 64-bit RO, iID2000, 13.56 MHz system, 1.0 x 1.6 x 0.5 mm; Microsensys GmbH, Erfurt, Germany) was glued onto the thorax of 70 honey bees and 20 bumble bees at each site as they were observed returning to their hive. We aimed at tagging bees returning with pollen sacs to ensure they were foragers. However, some tagged bees did not have pollen sacs and we assumed they were collecting another resource such as nectar or water. Honey bee foragers rarely return to working inside the hive (reviewed in Johnson, 2010) but tend to remain foragers until their death, or until winter arrives. At each hive, bees traveled through a 1″ diameter tube and through 2 RFID readers spaced 7.5 cm apart. We used one reader pair that was explicitly designed to gather data from honey bees, and another reader pair that was designed for bumble bees (iID2000, 2k6 HEAD; Microsensys GmbH, Erfurt, Germany). Each reader of a pair had a unique identity, and the pair was used to ascertain the direction of travel by bees, i.e., whether a bee was moving in or out of the hive. A foraging bout was indicated when a bee passed through the inner reader, followed by the outer reader, and at least 5 min elapsed until the next encounter with the outer reader, following the method of Gill et al. (2012). The RFID data were collected for 24 h each day and the readers were moved among sites each morning between 8:30 and 10:30 a.m. depending on weather. In general, the readers were moved at 9 a.m. June-August, and then closer to 10 a.m. as the nights became cooler later in August and into September.
Pollen Collection
To gather pollen, up to twenty individual bumble bees and 40 individual honey bees were caught as they returned to the hive with pollen pellets. These bees did not have RFID tags. Individual bees were collected into 2 dram plastic vials which were placed in a cooler filled with ice packs until a bee was no longer able to move (~5–10 min for honey bees, 10–20 min for bumble bees). Both pollen pellets were removed from the bee, and each pellet was stored separately in a 1.5 mL microcentrifuge tube. Bees were subsequently released near the hive entrance. Following collection, pollen pellets were kept on ice and, upon return to the laboratory, were placed in a 20°C freezer until ready for drying and weighing. One pollen pellet per bee was dried at 45°C for 24 h and subsequently weighed to the nearest tenth of a milligram.
Statistical Analyses
Radio Frequency Identification
We examined foraging activity metrics, calculated from the RFID data, across multiple levels. At the colony level, the dependent variable was the percentage of tagged bees foraging each day. We did not determine the proportion of the hive that were foragers as we did not want to disturb the hive during the collection of foraging data. At the individual bee level, we computed three dependent variables from the RFID data. For each day, we examined (i) the average duration of a foraging bout per bee (ii) the number of foraging bouts per bee, and (iii) the total duration of foraging per bee (sum of all foraging bout durations per bee). Lastly, at the foraging bout level we used duration of a foraging bout as dependent variable.
We used linear mixed effect models (proc Mixed, SAS v. 9.4) to determine the impact of site, period, bee species and their interactions on the foraging activity metrics. While the fixed effects were similar in all models and included site, period, species and all two-way interactions, the level of replication and the random variables were different across each level of analysis, i.e., colony, individual bee, and foraging bout. For the proportion of tagged bees, the sole colony level foraging activity metric, day was the replicate in the model and the random effect was the three-way interaction, site*period*species (Table 2). For analyses examining foraging metrics at the individual bee level, an individual bee was the replicate and the random factors included the three-way interaction site*period*species together with an additional day (site*period*species) term (Table 2). Finally, at the foraging bout level, where a foraging bout itself was the replicate, the random factors included the two three-way interactions present for the individual bee level analyses, together with a bee (site*period*species*day) term (Table 2). At the foraging bout level, the duration of a foraging bout was log transformed prior to analysis, while at the individual bee level the foraging bout duration and the number of foraging bouts per bee were log transformed to improve the model residuals.
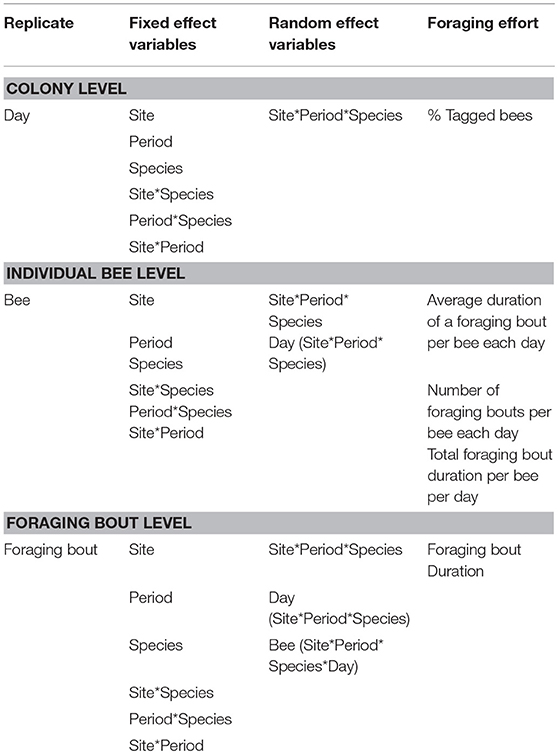
Table 2. The linear mixed effect models used to examine the impact of site, time period, bee species, and their interactions on the different metrics of bee foraging effort, at the colony, individual bee, or foraging bout levels.
In all three models the fixed effect explanatory variables were tested against the site*period*species error. In the colony level model, the random effect variable site*period*species was tested against the residual error (Table 2). In the individual bee model, the site*period*species random effect was tested against the day (site*period*species) error, while the day (site*period*species) random effect was tested against the model residual error (Table 2). Finally, for the model at the foraging bout level, the site*period*species random effect was tested against the day (site*period*species) error, the day (site*period*species) random effect was tested against the bee (site*period*day*bee) error, and the bee (site*period*day*bee) was tested against the model residual error (Table 2).
Pollen Dry Weight
Pollen collection effort is represented by the dry weight of pollen pellets. We used a linear mixed effect model (proc Mixed, SAS v. 9.4) to determine the impact of site, period, bee species, and their interactions on the dry weight of pollen pellets being returned to the hive. The fixed effects in the model included site, period, species and all two-way interactions. A pollen pellet was the unit of replication, and the random factors included the three-way interaction site*period*species together with a day (site*period*species) term (Table 3). While the fixed effect explanatory variables were tested against the site*period*species error, the site*period*species random effect was tested against the day (site*period*species) error, and the day (site*period*species) random effect was tested against the model residual error (Table 3). Pollen dry weights were square root transformed prior to analyses to improve the residuals of the model.
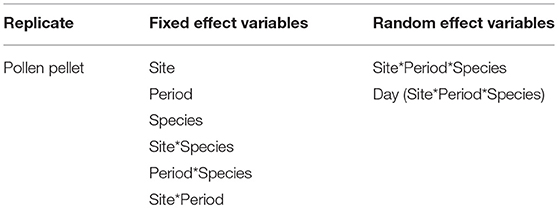
Table 3. Linear mixed effect model used to examine the impact of site, time period, bee species, and their interactions on the weight of individual pollen pellets being returned to the hive by foragers.
Results
Radio Frequency Identification
At the colony level, a greater proportion of tagged bumble bees foraged each day (mean ± SE) (0.28 ± 0.03) relative to the proportion of tagged honey bees (0.19 ± 0.02) (N = 76 days) (Table 4). While we collected RFID data over 9 days at each site, no foraging activity was recorded on some days. This was true for 4 out of 9 days in period 1 for bumble bees and 3 days in period 5. For honey bees, no foraging data were recorded on one day in period 1, 3 days in period 2 and 1 day in periods 3 and 4. Although it varied between bee species, the proportion of tagged bees was not influenced by site or period or by any of the two-way interactions between bee species, site or period (species*site), (species*period), or (site*period) (Table 4). In other words, the proportion of bees foraging each day was similar among sites and time of year (period) and the pattern among sites or among periods was similar for the two bee species (Table 4). Moreover, the proportion of tagged bees foraging during the different periods was similar among sites (period*site) (Table 4).
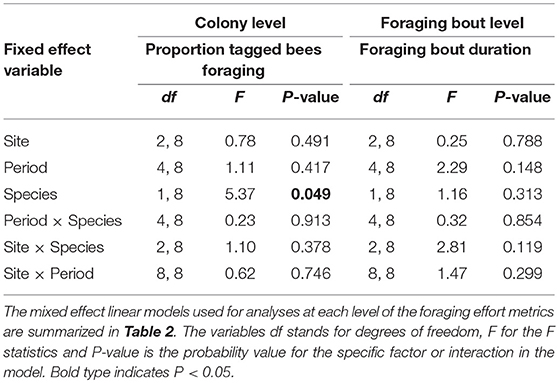
Table 4. The impact of site, time period, bee species, and their two-way interactions on different metrics of bee foraging effort at the colony and foraging bout levels.
At the level of the individual bee (N = 703 individual bees), none of the factors examined, bee species, site, period, or their two-way interactions affected the average duration of a foraging bout (Table 5). Foraging bout duration for a bee was similar among sites, among periods, and among bee species (Table 5). However, on any given day, the number of foraging trips per bee and the total time a bee spent foraging differed among bee species (Table 5). Bumble bees made significantly more foraging trips in a day (5.9 ± 0.4) relative to honey bees (4.6 ± 0.2) and they spent more total time foraging each day (bumble bees: 346.9 min ± 16.2; honey bee: 222.4 min ± 6.6). Site, period and the two-way interactions did not influence either the number of foraging trips per bee or the total time a bee spent foraging each day (Table 5). Finally, at the level of a foraging bout (N = 3,502 foraging bouts), none of the factors or their two-way interactions affected the average duration of a foraging bout (Table 4). An average foraging bout lasted 58.5 ± 2.0 min for bumble bees, in contrast to 48.71 ± 0.8 for honey bees. Although it was slightly longer for bumble bees the difference could not be explained by differences between bee species in our model.
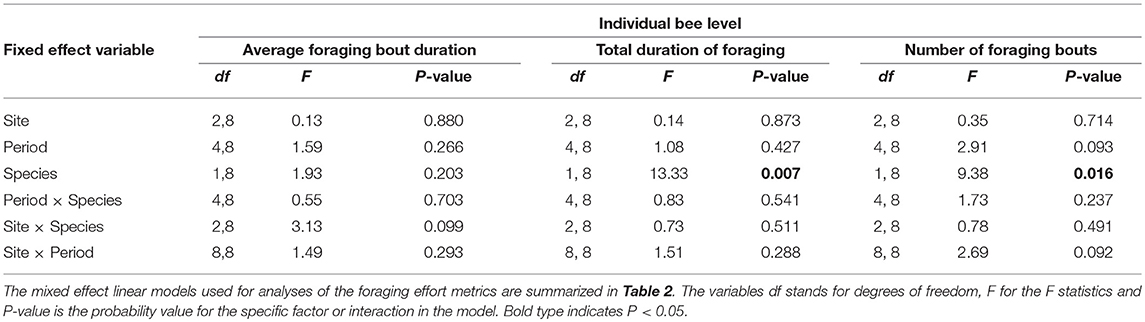
Table 5. The impact of site, time period, bee species and their two-way interactions on different metrics of bee foraging effort at the individual bee level.
Pollen Dry Weight
We obtained the pollen dry weights of 1,598 pollen pellets. There was a statistically significant effect of species and period on the weight of pollen pellets brought back to the hive and a weaker site*species interaction (Table 6). Using multiple means comparisons to examine the interaction between site and species, the average pollen pellet weight was always greater for bumble bees than for honey bees (Figure 2) and the difference between species was statistically significant at two sites and borderline at the third (Site 1: df = 1, 7; t = 4.00; P = 0.0052; Site 2: df = 1, 7; t = 6.56; P = 0.0003; and Site 3: df = 1, 7; t = 2.34, P = 0.052). We therefore considered the impact of the main factor of species on pollen pellet dry weights. For any foraging bout, bumble bees returned with significantly heavier pollen pellets relative to honey bees (bumble bee: 7.73 mg ± 0.25; honey bee: 3.68 mg ± 0.08) (Table 6). Moreover, the weight of pollen pellets brought back to the hive following a foraging bout varied among periods over the flowering season (Table 6). Bees returned to the hive with heavier pollen pellets during the first (mean ± SE) (6.81 mg ± 0.24) and last (6.38 mg ± 0.32) periods, relative to the second (4.09 mg ± 0.16), third (3.34 mg ± 0.19), and fourth (3.71 mg ± 0.25) periods (Figure 3). The weight of pollen pellets brought back to the hive by individual bees were similar between the first and last periods (Figure 3). Such differences among periods were similar for bumble bees and honey bees as indicated by the lack of a statistically significant interaction between period and bee species (Table 6).
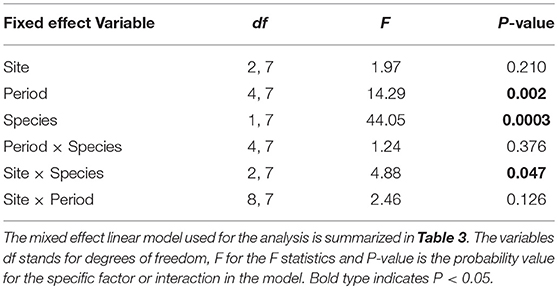
Table 6. The impact of site, time period, bee species and their two-way interactions on the average weight of a pollen pellet returned to the hive by foragers.
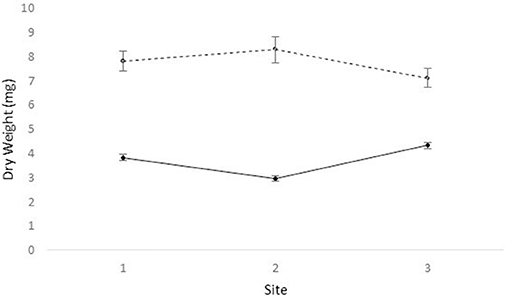
Figure 2. The mean ± dry weight (mg) of individual pollen pellets collected by honey bees (solid line) and bumble bees (dashed line) at sites 1, 2, and 3.
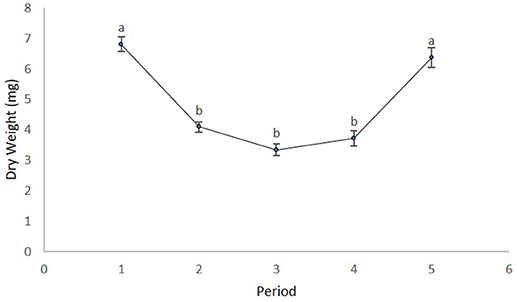
Figure 3. The mean ± dry weight (mg) of individual pollen pellets collected by bees over the five time periods. Time periods with different letters are statistically different from one another as indicated by multiple means tests.
Discussion
The foraging activity of bumble bees was greater than that of honey bees. Relative to honey bees, an individual bumble bee embarked on more foraging bouts each day. In addition, a greater proportion of bumble bee foragers actually foraged on a given day. However, the duration of a foraging bout did not differ between these two bee species. The average duration of a foraging bout by an individual bee each day lasted 58.5 ± 2.0 min for bumble bees, in contrast to 48.71 ± 0.8 for honey bees. But, because individual bumble bees did more foraging trips in a day, they spent more total time foraging each day.
Foraging bout duration can be affected by the time it takes for bees to reach rewarding resource patches and by the time a bee spends foraging at that resource, collecting either pollen or nectar. The waggle dance can facilitate the location of rewarding resources by honey bees, although not all individual bees observe the dance prior to foraging (Biesmeijer and Seeley, 2005). Moreover, honey bees tend to have a larger foraging range relative to bumble bees (Visscher and Seeley, 1982; Knight et al., 2005). Many foraging models for flower visiting insects assume that the time traveling between patches is negligible relative to the time spend foraging within patches (Goulson, 1999). In contrast to honey bees, bumble bees must learn, and remember profitable locations, and develop trapline foraging patterns among patches (Ohashi et al., 2008), while honey bees do not tend to develop optimal trapline routes (Pasquaretta et al., 2017). Results of the current study suggest that the foraging strategies of both bee species translate into similar foraging bout durations, from the time a bee leaves the hive to the time it returns to the hive. The more individualistic trapline foraging mode of bumble bees seems to permit them to gather resources in the same amount of time as the more direct method of information transmission for resource quality and location communicated by the waggle dance of honey bees (Thomson et al., 1997; Ohashi et al., 2007; Lihoreau et al., 2010; Couvillon et al., 2014; Ratnieks and Shackleton, 2015). Future studies should determine the differences in foraging bout durations between individual honey bees that follow the waggle dance and those that do not to increase our understanding of the impact of honey bee communication on foraging bout duration. Moreover, when comparing bumble bees and honey bees foraging within patches, Brunet (unpublished data) observed similar foraging bout duration within a patch for these two bee species. Future studies should examine in more details the reasons why, despite the various differences in their foraging strategies, foraging bout duration from the time a bee leaves the hive to the time it returns to a hive remains similar between these two bee species.
Individual bumble bees spent more time foraging each day and a greater proportion of the foragers were active each day relative to honey bees. Although we did not gather information on the proportion of the colony that were foragers, in order not to disturb the hive during collection of foraging data, the proportion of the foragers that were active each day is a strong descriptor of colony level foraging activity as new foragers were tagged at the start of each time period. The observed interspecific differences were consistent over the flowering season and among sites, as indicated by the lack of significant interactions between bee species and period or site in our mixed model. This pattern supports consistent and stable interspecific differences in the activity levels of honey bees and bumble bees to gather resources. Differences in life history and in colony sizes between these two bee species may help explain observed differences in foraging activity. Bumble bee colonies are annual and small in contrast to the perennial and large honey bee colonies. Given such differences, each bumble bee worker may need to put forth more effort to build up and sustain the colony relative to a honey bee worker. But, if activity level relates to colony size, with an increase in colony size over the season, we would also expect the foraging effort per bee and percent of colony foraging to decrease, which we did not observe. We therefore suspect other factors, besides colony size and life history, help explain observed differences in foraging activities between these two bee species. The more complex division of labor of honey bee colonies could represent such a factor and may facilitate a lower foraging activity per individual and at the colony level. Furthermore, considering the honey bees in this experiment were restricted to a 2-frame observation hive with limited space for the colony to grow, and therefore limiting growth associated changes in colony needs, these results may differ from experiments conducted under more typical circumstances, and further studies should be undertaken on larger hives. Finally, more research is needed to elucidate whether and how differences in life history, colony size, and social structure contribute to interspecific differences in bee foraging activity.
Bumble bees brought heavier pollen pellets back to the hive relative to honey bees, even though both bee species had similar foraging bout durations. Because most bees tend to forage either for pollen or for nectar during a foraging bout (Brunet, unpublished data), this result suggests that bumble bees are more efficient than honey bees at retrieving pollen from the plants they visit. The observed interspecific difference in pollen pellet size may result from honey bees being smaller than bumble bees. Within a bee species, larger pollen, and nectar loads are correlated with increased body size of foragers (Goulson et al., 2002). However, it is unclear how this pattern might translate among bee species. Individual bumble bees made more foraging trips in a day and brought back more pollen to the hive each time, relative to honey bees. Moreover, a greater proportion of the bumble bee foragers were active each day relative to honey bees. Such patterns should translate into a greater amount of pollen available per capita for bumble bees relative to honey bees. Bumble bees, due to their larger size, may have greater pollen requirements than honey bees, and indeed bee body size is correlated to the amount of protein received by developing larvae (Roulston and Cane, 2002). Differences in body size among bee species may therefore help explain differences in foraging patterns (Spaethe and Weidenmüller, 2002) that optimize the amount of pollen brought back to the hive to meet a colony's need.
Across all levels, the foraging activity of these two bee species did not vary over the flowering season (period) or among sites. The time a bee spent foraging per bout or per day and the proportion of foragers active each day did not change over the flowering season and did not differ among sites. Moreover, this pattern was true for both bee species. The lack of variation in foraging activity over the season or among sites was surprising. We expected greater foraging activity early and late in the flowering season because of the lower expected resource availability. Moreover, the known differences in foraging ranges between these two bee species suggested among site variation in foraging activity for bumble bees but not for honey bees (Visscher and Seeley, 1982; Pasquaretta et al., 2017). But colony needs may also change over the flowering season. We expect greater pollen needs earlier in the season for both bee species as more brood may be produced relative to later in the season. Later in the season, we expect greater nectar needs for honey bees as they are building honey reserves for the colony to survive the winter months. Bumble bee colonies, however, are producing new queens and may still have high pollen needs. Interestingly, we gathered some data for bumble bees on the proportion of bees returning to the hive with and without pollen pellets. Although the sample sizes were uneven among periods, the trend suggested that most foragers returned to the hive with pollen pellets during the first (95%) and last (96%) periods, while a greater proportion of the foragers returned with nectar in the three middle periods (47, 15, and 33%, respectively).
We did not gather such data for honey bees although it should be determined in future studies. However, because foraging bout duration did not change over the flowering season, these data suggest no apparent differences in the time a bee spends foraging for pollen vs. nectar. The larger pollen production for bumble bees early and late in the flowering season suggest a greater pollen need, possibly for growing larvae early in the season and queen development in late summer/early fall. Interestingly, colony needs can influence the proportion of foragers collecting pollen or nectar but it did not influence foraging activity in general (time spent foraging and proportion of foragers active each day). Moreover, any variation in resource availability over time and space did not significantly influence foraging activity for these two bee species in the current study.
Both bee species brought more pollen back to the hive per foraging bout at the beginning and end relative to the middle periods of the flowering season, even though the time spent foraging remained constant throughout the flowering season. The temporal differences in the amount of pollen gathered suggest that it took longer to collect resources from flowers in mid-summer relative to early or late summer. Couvillon et al. (2014) proposed that summer is the most challenging season for honey bees because bees foraged at greater distances in mid-summer relative to spring and fall. Danner et al. (2017) found honey bees returned the greatest amount of pollen to the hive early in the season, in April and May. Taken together, these results support the notion that summer may be the most challenging season for bees, at least for eusocial bees. One potential explanation for this pattern is that, although resources may increase in mid-summer, the density of bees also increases and, thus, the level of competition for shared resources.
The use of miniaturized RFID allows for continual tracking of individual bees and provides a real-time view of the activity of foraging bees in both field and laboratory contexts and furthers our ability to test hypotheses of optimal foraging in bees and other invertebrates. Future research using RFID could contrast the foraging activity of these two bee species over different landscapes to determine whether the similarities and differences observed in this study are consistent over variable landscapes. Future research could also further elucidate the role of bee size, colony size, communication strategies, and division of labor on their impact to bee foraging behavior. In addition, relating bee foraging activity more directly to available resources, and to energy intake and expenditure would provide crucial understanding as to the optimal foraging behavior of social bees. Future useful technological developments for the study of bees could include designing miniature RFID tags that can be read from a further distance and to permit their use in solitary bees. In addition, the development of affordable and small-scaled technology that could be used to track bees as they move over the landscape, both among flowers and among plants within patches and among patches would represent a breakthrough in the study of bee foraging and bee movement.
Conclusions
This study is the first to use RFID technology to contrast the foraging activity of two social bee species in a common landscape. The use of RFID was crucial to revealing differences and similarities in various foraging activity metrics in these two bee species. It permitted the detection of strong interspecific differences in foraging activity that were maintained among time periods and sites. At the level of individual bees and of the colony, bumble bees exhibited greater foraging activity relative to honey bees. Per capita, bumble bees also brought more pollen back to the hive relative to honey bees suggesting a stronger need for pollen for bumble bees. Interestingly, the foraging activity of these two bee species did not vary over time or among sites. Many of the observed trends highlighted interesting and unexpected patterns that could not have been discovered without the use of RFID technology.
Data Availability
The raw data which support the conclusions of this manuscript will be made available by the authors when requested by any qualified researcher.
Author Contributions
DM and JB designed the experiment and methodology. DM collected the data. DM and JB worked on data analyses with the help of a statistician. DM led writing the manuscript and JB contributed critically to the drafts and gave final approval for publication.
Conflict of Interest Statement
The authors declare that the research was conducted in the absence of any commercial or financial relationships that could be construed as a potential conflict of interest.
Acknowledgments
We thank Alexandra Kois and Kyle Krellwitz for their contribution to both the field and laboratory components of this research. Furthermore, we want to thank Dr. Murray Clayton for his guidance with statistical analyses. This work was supported by funds from the Garden Club of America – Centennial Pollinator Fellowship (2016) to DM and by a Biotechnology Risk Assessment Grant Program competitive grant no. 2013-33522-20999 from the USDA National Institute of Food and Agriculture and by funds from the USDA-ARS to JB.
References
Beekman, M., and Ratnieks, F. L. W. (2000). Long-range foraging by the honey-bee, Apis mellifera L. Funct. Ecol. 14, 490–496. doi: 10.1046/j.1365-2435.2000.00443.x
Biesmeijer, J. C., and Seeley, T. D. (2005). The use of waggle dance information by honey bees throughout their foraging careers. Behav. Ecol. Sociobiol. 59, 133–142. doi: 10.1007/s00265-005-0019-6
Cameron, S. A., Lozier, J. D., Strange, J. P., Koch, J. B., Cordes, N., Solter, L. F., et al. (2011). Patterns of widespread decline in North American bumble bees. Proc. Natl. Acad. Sci. U.S.A. 108, 662–667. doi: 10.1073/pnas.1014743108
Charnov, E. L. (1976). Optimal foraging, the marginal value theorem. Theor. Popul. Biol. 9, 129–136. doi: 10.1016/0040-5809(76)90040-X
Couvillon, M. J., and Ratnieks, F. L. W. (2015). Environmental consultancy: dancing bee bioindicators to evaluate landscape “health.” Front. Ecol. Evol. 3:44. doi: 10.3389/fevo.2015.00044
Couvillon, M. J., Schürch, R., and Ratnieks, F. L. W. (2014). Waggle dance distances as integrative indicators of seasonal foraging challenges. PLoS ONE 9:93495. doi: 10.1371/journal.pone.0093495
Danner, N., Keller, A., Härtel, S., and Steffan-Dewenter, I. (2017). Honey bee foraging ecology: season but not landscape diversity shapes the amount and diversity of collected pollen. PLoS ONE 12:e0183716. doi: 10.1371/journal.pone.0183716
Decourtye, A., Devillers, J., Aupinel, P., Brun, F., Bagnis, C., Fourrier, J., et al. (2011). Honeybee tracking with microchips: a new methodology to measure the effects of pesticides. Ecotoxicology 20, 429–437. doi: 10.1007/s10646-011-0594-4
Dornhaus, A., and Chittka, L. (2001). Food alert in bumblebees (Bombus terestris): possible mechanisms and evolutionary implications. Behav. Ecol. Sociobiol. 50, 570–576. doi: 10.1007/s002650100395
Doublet, V., Labarussias, M., de Miranda, J. R., Moritz, R. F., and Paxton, R. J. (2015). Bees under stress: sublethal doses of a neonicotinoid pesticide and pathogens interact to elevate honey bee mortality across the life cycle. Environ. Microbiol. 17, 969–983. doi: 10.1111/1462-2920.12426
Fischer, J., Müller, T., Spatz, A. K., Greggers, U., Grünewald, B., and Menzel, R. (2014). Neonicotinoids interfere with specific components of navigation in honeybees. PLoS ONE 9:91364. doi: 10.1371/journal.pone.0091364
Gill, R. J., Ramos-Rodriguez, O., and Raine, N. E. (2012). Combined pesticide exposure severely affects individual-and colony-level traits in bees. Nature 491, 105–108. doi: 10.1038/nature11585
Goulson, D. (1999). Foraging strategies of insects for gathering nectar and pollen, and implications for plant ecology and evolution. Perspect. Plant Ecol. Evol. Syst. 2, 185–209. doi: 10.1078/1433-8319-00070
Goulson, D., Nicholls, E., Botías, C., and Rotheray, E. L. (2015). Bee declines driven by combined stress from parasites, pesticides, and lack of flowers. Science 347:1255957. doi: 10.1126/science.1255957
Goulson, D., Peat, J., Stout, J. C., Tucker, J., Darvill, B., Derwent, L. C., et al. (2002). Can alloethism in workers of the bumblebee, Bombus terrestris, be explained in terms of foraging efficiency? Anim. Behav. 64, 123–130. doi: 10.1006/anbe.2002.3041
Henry, M., Béguin, M., Requier, F., Rollin, O., Odoux, J. F., Aupinel, P., et al. (2012). A common pesticide decreases foraging success and survival in honey bees. Science 336, 348–350. doi: 10.1126/science.1215039
Herrmann, J. D., Haddad, N. M., and Levey, D. J. (2017). Testing the relative importance of local resources and landscape connectivity on Bombus impatiens (Hymenoptera, Apidae) colonies. Apidologie 48, 545–555. doi: 10.1007/s13592-017-0499-1
Johnson, B. R. (2010). Division of labor in honeybees: form, function, and proximate mechanisms. Behav. Ecol. Sociobiol. 64, 305–316. doi: 10.1007/s00265-009-0874-7
Keasar, T., Motro, U., and Shmida, A. (2013). Temporal reward variability promotes sampling of a new flower type by bumblebees. YANBE 86, 747–753. doi: 10.1016/j.anbehav.2013.07.010
Klein, A. M., Vaissière, B. E., Cane, J. H., Steffan-Dewenter, I., Cunningham, S. A., Kremen, C., et al. (2007). Importance of pollinators in changing landscapes for world crops. Proc. R. Soc. Lond. B Biol. Sci. 274, 303–313. doi: 10.1098/rspb.2006.3721
Knight, M. E., Martin, A. P., Bishop, S., Osborne, J. L., Hale, R. J., Sanderson, R. A., et al. (2005). An interspecific comparison of foraging range and nest density of four bumblebee (Bombus) species. Mol. Ecol. 14, 1811–1820. doi: 10.1111/j.1365-294X.2005.02540.x
Lihoreau, M., Chittka, L., and Raine, N. E. (2010). Travel optimization by foraging bumblebees through re-adjustments of traplines after discovery of new feeding locations. Am. Nat. 176, 744 – 767. doi: 10.1086/657042
Lihoreau, M., Raine, N. E., Reynolds, A. M., Stelzer, R. J., Lim, K. S., Smith, A. D., et al. (2012). Radar tracking and motion-sensitive cameras on flowers reveal the development of pollinator multi-destination routes over large spatial scales. PLoS Biol. 10, 19–21. doi: 10.1371/journal.pbio.1001392
Molet, M., Chittka, L., and Raine, N. E. (2009). How floral odours are learned inside the bumblebee (Bombus terrestris) nest. Naturwissenschaften 96, 213–219. doi: 10.1007/s00114-008-0465-x
Naug, D. (2009). Nutritional stress due to habitat loss may explain recent honeybee colony collapses. Biol. Conserv. 142, 2369–2372. doi: 10.1016/j.biocon.2009.04.007
Ohashi, K., Leslie, A., and Thomson, J. D. (2008). Trapline foraging by bumble bees: V. Effects of experience and priority on competitive performance. Behav. Ecol. 19, 936–948. doi: 10.1093/beheco/arn048
Ohashi, K., Thomson, J. D., and D'Souza, D. (2007). Trapline foraging by bumble bees: IV. Optimization of route geometry in the absence of competition. Behav. Ecol. 18, 1–11. doi: 10.1093/beheco/arl053
Ollerton, J., Winfree, R., and Tarrant, S. (2011). How many flowering plants are pollinated by animals? Oikos 120, 321–326. doi: 10.1111/j.1600-0706.2010.18644.x
Pahl, M., Zhu, H., Tautz, J., and Zhang, S. (2011). Large scale homing in honeybees. PLoS ONE 6:e19669. doi: 10.1371/journal.pone.0019669
Pasquaretta, C., Jeanson, R., Andalo, C., Chittka, L., and Lihoreau, M. (2017). Analysing plant–pollinator interactions with spatial movement networks. Ecol. Entomol. 42, 4–17. doi: 10.1111/een.12446
Pyke, G. H. (1984). Optimal foraging theory: a critical review. Annu. Rev. Ecol. Syst. 15, 523–575. doi: 10.1146/annurev.es.15.110184.002515
Ratnieks, F. L. W., and Shackleton, K. (2015). Does the waggle dance help honey bees to forage at greater distances than expected for their body size? Front. Ecol. Evol. 3:31. doi: 10.3389/fevo.2015.00031
Redhead, J. W., Dreier, S., Bourke, A. F., Heard, M. S., Jordan, W. C., Sumner, S., et al. (2016). Effects of habitat composition and landscape structure on worker foraging distances of five bumble bee species. Ecol. Appl. 26, 726–739. doi: 10.1890/15-0546
Roulston, T. H., and Cane, J. H. (2002). The effect of pollen protein concentration on body size in the sweat bee Lasioglossum zephyrum (Hymenoptera: Apiformes). Evol. Ecol. 16, 49–65. doi: 10.1023/A:1016048526475
Saleh, N., and Chittka, L. (2007). Traplining in bumblebees (Bombus impatiens): a foraging strategy's ontogeny and the importance of spatial reference memory in short-range foraging. Oecologia 151, 719–730. doi: 10.1007/s00442-006-0607-9
Schneider, C. W., Tautz, J., Grünewald, B., and Fuchs, S. (2012). RFID tracking of sublethal effects of two neonicotinoid insecticides on the foraging behavior of Apis mellifera. PLoS ONE 7:e30023. doi: 10.1371/journal.pone.0030023
Seeley, T. D. (1978). Life history strategy of the honey bee, Apis mellifera. Oecologia 32, 109–118. doi: 10.1007/BF00344695
Seeley, T. D., Camazine, S., and Sneyd, J. (1991). Collective decision-making in honey bees: how colonies choose among nectar sources. Behav. Ecol. Sociobiol. 28, 277–290.
Spaethe, J., and Weidenmüller, A. (2002). Size variation and foraging rate in bumblebees (Bombus terrestris). Insectes Soc. 49, 142–146. doi: 10.1007/s00040-002-8293-z
Stanley, D. A., Russell, A. L., Morrison, S. J., Rogers, C., and Raine, N. E. (2016). Investigating the impacts of field-realistic exposure to a neonicotinoid pesticide on bumblebee foraging, homing ability and colony growth. J. Appl. Ecol. 53, 1440–1449. doi: 10.1111/1365-2664.12689
Stelzer, R. J., and Chittka, L. (2010). Bumblebee foraging rhythms under the midnight sun measured with radiofrequency identification. BMC Biol. 8:93. doi: 10.1186/1741-7007-8-93
Thomson, J. D., Slatkin, M., and Thomson, B. A. (1997). Trapline foraging by bumble bees: II. Definition and detection from sequence data. Behav. Ecol. 8, 199–210. doi: 10.1093/beheco/8.2.199
Visscher, P., and Seeley, T. D. (1982). Foraging strategy of honeybee colonies in a temperate deciduous forest. Ecology 63, 1790–1801. doi: 10.2307/1940121
Von Frisch, K. (1967). The Dance Language and Orientation of Bees. Cambridge, MA: Belknap Press of Harvard University Press.
Waser, N. M., Chittka, L., Price, M. V., Williams, N. M., and Ollerton, J. (1996). Generalization in pollination systems, and why it matters. Ecology 77, 1043–1060.
Williams, N. M., and Thomson, J. D. (1998). Trapline foraging by bumble bees: III. Temporal patterns of visitation and foraging success at single plants. Behav. Ecol. 9, 612–621. doi: 10.1093/beheco/9.6.612
Winfree, R., Aguilar, R., Vázquez, D. P., LeBuhn, G., and Aizen, M. A. (2009). A meta-analysis of bees' responses to anthropogenic disturbance. Ecology 90, 2068–2076. doi: 10.1890/08-1245.1
Wolf, S., and Moritz, R. F. (2008). Foraging distance in Bombus terrestris L. (Hymenoptera: Apidae). Apidologie 39, 419–427. doi: 10.1051/apido:2008020
Keywords: radio-frequency identification, bumble bee, honey bee, foraging activity, pollen pellet, site, time period
Citation: Minahan DF and Brunet J (2018) Strong Interspecific Differences in Foraging Activity Observed Between Honey Bees and Bumble Bees Using Miniaturized Radio Frequency Identification (RFID). Front. Ecol. Evol. 6:156. doi: 10.3389/fevo.2018.00156
Received: 31 July 2018; Accepted: 18 September 2018;
Published: 05 October 2018.
Edited by:
Thomas Wassmer, Siena Heights University, United StatesReviewed by:
Monique Gauthier, Université Toulouse III Paul Sabatier, FranceBrian R. Johnson, University of California, Davis, United States
Copyright © 2018 Minahan and Brunet. This is an open-access article distributed under the terms of the Creative Commons Attribution License (CC BY). The use, distribution or reproduction in other forums is permitted, provided the original author(s) and the copyright owner(s) are credited and that the original publication in this journal is cited, in accordance with accepted academic practice. No use, distribution or reproduction is permitted which does not comply with these terms.
*Correspondence: Danny F. Minahan, dfminahan@wisc.edu