Morphological Characterization and Topographic Analysis of Multiple Photoreceptor Types in the Retinae of Mesopelagic Hatchetfishes with Tubular Eyes
 Lauren M. Biagioni
 David M. Hunt
 Shaun P. Collin
- 1School of Animal Biology, The University of Western Australia, Crawley, WA, Australia
- 2Lions Eye Institute, University of Western Australia, Crawley, WA, Australia
- 3The Oceans Institute, The University of Western Australia, Crawley, WA, Australia
Marine hatchetfishes, Argyropelecus spp., are one of the 14 genera of mesopelagic teleosts, which possess tubular eyes. The tubular eyes are positioned dorsally on the head and consist of a main retina, which subtends a large dorsal binocular field, and an accessory retina, which subtends the lateral monocular visual field. The topographic distribution of photoreceptors in the retina of Argyropelecus sladeni, Argyropelecus affinis, and Argyropelecus aculeatus was determined using a random, unbiased and systematic stereological approach, which consistently revealed a region of high density (area centralis) in the central region of the main retina (up to a peak of 96,000 receptors per mm2) and a relatively homogeneous density of photoreceptors in the accessory retina (of ~20,000 receptors per mm2). The position of the area centralis in the main retina indicates this retinal region subserves greater spatial resolution in the center of the dorsal binocular visual field. Light microscopy and transmission electron microscopy also revealed the presence of multiple photoreceptor types (two rod-like and one cone-like) based on the size and shape of the inner and outer segments and ultrastructural differences in the ellipsoidal region. The presence of multiple photoreceptor types in these tubular-eyed, mesopelagic hatchetfishes may reflect the need for the visual system to function under different lighting conditions during vertical migratory behavior, especially given their unique dorsally-facing eyes.
Introduction
The mesopelagic zone constitutes the upper 200–1000 m of the water column, and is inhabited by the ocean's most diverse animals (Warrant and Locket, 2004). Within this zone, sunlight is rapidly attenuated and the intensity and spectral bandwidth significantly reduce as depth increases (Bowmaker, 1991; Lythgoe, 1991). Consequently, some teleosts have evolved tubular eyes in order to cope with the very low levels of residual sunlight (Collin, 1997). The marine hatchetfishes, Argyropelecus spp. are among 14 genera found in the mesopelagic zone (between 50 and 800 m), which possess tubular eyes (Whitehead et al., 1989; Warrant et al., 2003). These highly specialized eyes are approximately cylindrical and directed either rostrally or dorsally on top of the head to maximize the capture of downwelling sunlight (Collin, 1997). The base of the cylinder comprises a thick main retina, while the medial wall comprises an accessory retina, which extends both rostrally and caudally (Collin et al., 1997, 1998). The close proximity of the tubular eyes to one another means that a single object in the environment can be imaged simultaneously on both retinae (the main retina of each eye), thus producing binocular vision (Locket, 1977). Binocular vision combined with the dorsal orientation of the eyes provides a number of ecological advantages in the deep. As downwelling light is always brighter than light from other directions, dorsally directed tubular eyes are perhaps more capable of discriminating between downwelling light and bioluminescent light produced by other organisms, which would effectively cast a detectable shadow seen from below (Bunt, 1991). In addition, the intensity gradient produced by the downwelling light might also be used by these species to aid in vertical migration and help maintain specific depths during the day (de Busserolles et al., 2014).
Due to the scotopic conditions, mesopelagic fishes rely on a number of specializations to increase the sensitivity of the eye. The accessory retina on the medial wall of the tubular eye provides an extension of the monocular visual field by detecting light from the lateral environment, although the close proximity of the accessory retina to the lens means that it does not form a focused image (Locket, 1970a; Collin et al., 1997, 1998). This is a useful adaptation in the mesopelagic zone since it allows point sources of bioluminescence from predators and prey in the lateral visual field to be detected, while maintaining a high level of binocularity in the dorsal visual field (Bunt, 1991; Robison, 2004). Other specializations at the retinal level include, multibank retinas, tapetal pits, pure rod retinas (Fröhlich et al., 1995), and elongation of rod outer segments to extend the light path and increase quantum capture (Somiya, 1976). In addition, many studies have revealed that there is a correlation between the maximum sensitivity of rod visual pigments of deep-sea fish and the narrow waveband found in the deep sea (~475 nm; Clarke, 1936; Bunt, 1991). Tubular eyes have also evolved a large spherical lens and a large oblique pupil, presumably to increase sensitivity and maximize light collection at great depths (Fernald, 1985).
To further enhance the efficiency of quantum capture, the retina is often divided morphologically into different regions. This organization allows different regions of the visual field to be optimized toward either spatial resolving power or sensitivity (Collin, 1997). Collin et al. (1997) conducted a comprehensive study on the distribution of retinal ganglion cells in five Argyropelecus spp., and found that each possessed an area centralis, predominantly occurring in the nasal region of the main retina. This reveals that Argyropelecus spp. have improved spatial resolution in a precise region of their visual field, in which to facilitate binocular vision in the temporal visual field (Litherland and Collin, 2008). Almost all topographic studies of deep-sea teleosts are restricted to retinal ganglion cell distributions with the sole exception of a topographic study of photoreceptor densities in mesopelagic myctophids (de Busserolles et al., 2014).
The aims of this study were to investigate the distribution of photoreceptors in the retina of three tubular-eyed species from the genus Argyropelecus and assess whether different photoreceptor types can be differentiated based on ultrastructural criteria. Based on the findings of the retinal ganglion cell topography study by Collin et al. (1997), it was hypothesized that the photoreceptors would not follow a uniform distribution, resulting in specialized regions within the nasal region of the main retina subserving greater spatial resolution. This study also explores the inter- and intra-specific variability in photoreceptor distributions, and attempts to correlate these findings with the visual environment of the mesopelagic zone in the deep sea in which these species live.
Materials and Methods
Specimen Collection and Preparation for Morphological Analysis
Specimens of Argyropelecus sladeni, Argyropelecus affinis, and Argyropelecus aculeatus were available for morphological and topographic analyses. Five specimens were obtained using a Rectangular Mesh Trawl (RMT) net during a deep-sea voyage in the tropical eastern Atlantic Ocean in 1993 on board the RRS Discovery (Table 1). The eyes were excised and fixed shortly after collection to prevent decay of biological material. The eyes were left whole and were fixed in 4% paraformaldehyde in phosphate buffer (0.1 M) or 2% glutaraldehyde and 2% paraformaldehyde in a cacodylate buffer (0.1 M). The left eye of A. sladeni and the right eye of A. affinis were used for morphological analyses and left overnight in 0.1 M phosphate buffer (pH 7.1), before being post-fixed in 1% osmium tetroxide in 0.15 M phosphate buffer for 2 h. The specimens were then rinsed with buffer before being dehydrated in a series of graded alcohols (25, 50, 70, 80, 95, and 100%) and propylene oxide, using a Lynx tissue processor. The samples were then infiltrated in procure-araldite resin and left overnight in the oven at 60°C to set. Retinal tissue of A. aculeatus previously embedded in araldite was also available for analysis (Table 1).
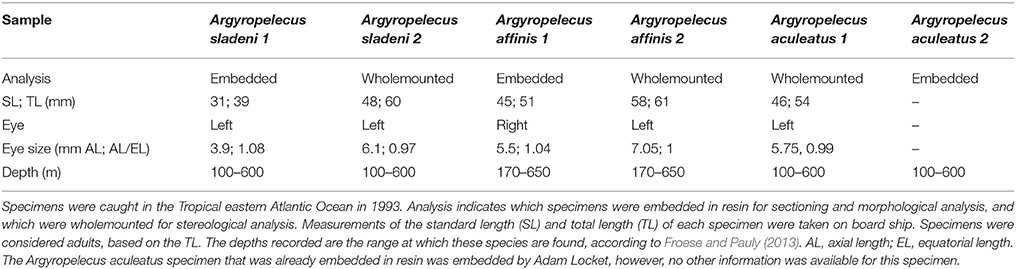
Table 1. Summary of the data collected for the five Argyropelecus specimens examined.
Morphological Analysis using Light and Electron Microscopy
For light microscopy, transverse sections (1 μm) were cut using a Leica EM UC6 ultramicrotome and glass knives. Sections were floated onto positively charged glass slides and dried on a hotplate at 70°C for 5–10 min. The sections were then placed in sodium ethoxide and shaken for 30 s to remove the resin. Following this, the sections were hydrated in a series of alcohols (100, 90, and 70% ethanol for 1 min each) and stained with an aqueous solution of 1% Toluidine blue for 5–10 s on a hotplate. The purpose of removing the resin before staining was to increase the contrast and resolution of the retinal layers and improve image quality. The sections were then blow-dried and coverslipped with Entellan, and analyzed using a Zeiss Axioskop2plus microscope. The samples were imaged using brightfield illumination and images were taken using a Zeiss AxioCam camera mounted on a compound microscope (Carl Zeiss, Oberkocken, Germany). In order to differentiate retinal photoreceptors using transmission electron microscopy, thin sections (100–110 nm) were cut in selected regions of the retina using a diamond knife (45° DiATOME). The sections were placed onto 3 mm, 200 mesh, copper grids, and stained with lead citrate for 2–3 min. These sections were examined using a JEOL 2100 transmission electron microscope, and photographs were taken using an Orius SC 1000 CCD camera from Gatan. The dimensions of each photoreceptor subtype were assessed using Image J freeware (http://rsbweb.nih.gov/ij/download.html). The photoreceptor inner segment width was measured across the broadest diameter, while the outer segment diameter was measured midway between the base and the tip. The inner segment length was measured from the external limiting membrane to the base of the outer segment, and the outer segment length was measured from its base to the sclerad tip. Scale bars and minor adjustments (contrast and brightness) were made to the images using Adobe Photoshop CC, and the images were arranged using Adobe Illustrator CC.
Retinal Wholemounting
Specimens of A. sladeni, A. affinis, and A. aculeatus were transferred to 0.1 M phosphate buffer (pH 7.1) for dissection. An incision was made in the cornea in the dorsal part of the eye. Subsequently, the cornea was removed by cutting along the limbus (Stone, 1981). The lens was removed and the sclera and the retinal pigment epithelium were carefully peeled away from the retina. The orientation of the retina was maintained by the dorsal position of the accessory retina and the ventral position of the main retina for the left and right eyes. Each retina was wholemounted with the photoreceptor layer uppermost (Stone, 1981; Litherland and Collin, 2008). To prevent the photoreceptors being flattened when coverslipped, a thin border was made around each wholemount using filter paper. Each retina was then covered with 100% glycerol, coverslipped and sealed with nail polish to prevent dehydration.
Stereological Analysis of Retinal Wholemounts
The outlines of the retinal wholemounts were digitized using a x4 (numerical aperture 0.13) objective on an Olympus BX50 microscope (Coimbra et al., 2012, 2013). The microscope was fitted with a motorized stage to help with the systematic counting of the photoreceptor array (MAC200, Ludl Electronics Products, USA) and was connected to a computer running Stereo Investigator software (Mircrobrightfield, USA; Coimbra et al., 2013). The outlines of each retinal wholemount were traced using the software, and subsequently overlaid with a defined counting frame and sampling grid. The sampling grids were placed in a random, uniform and systemic fashion across the entire area of each retinal outline. The grid size for each retina was defined as 30 × 30 μm, and ~200 sampling sites per retina were deemed to provide an estimation of the distribution of photoreceptors (Coimbra et al., 2012). Using a x60 (numerical aperture 1.35) oil immersion objective, the inner segments of the photoreceptors were visualized by adjusting the fine focus and moving vertically through the retinal layers. Only the inner segments that were completely within the counting frame or intersecting the acceptance lines were counted. Inner segments that were touching the rejection lines were not included. On completion of each sampling site, the motorized stage moved the objective to the next random sampling site, until the entire retina was sampled. Due to the poor quality of the photoreceptors in the accessory retina of A. sladeni and A. affinis (suboptimal fixation as a result of the delay from time of net retrieval and fixation of eyes on board ship), only the main retinas were sampled. The retinal wholemount of A. sladeni was also subsampled in the nasal region to produce the distributions of two photoreceptor subtypes.
The topographic distribution and total number of photoreceptors in each retina were determined using the optical fractionator method for retinal wholemounts, described by Coimbra et al. (2009). The retina was considered a single section, and therefore the section sampling fraction (ssf) was set to 1 (Coimbra et al., 2012, 2013). As the photoreceptor inner segments were easily identified by focusing through the visual cell layer, the optical dissector height was the same as the thickness of the visual cell layer across the entire retina, giving a thickness sampling factor (tsf) of 1 (Coimbra et al., 2012, 2013). Therefore, only the area sampling fraction (asf; ratio between counting frame and sampling grid) was used to determine the total number of photoreceptors, according to the following equation:
Where ∑Q is the sum of the total photoreceptors counted (Coimbra et al., 2012, 2013). The optical fractionator method for retinal wholemounts is a relatively new technique for estimating the total number of photoreceptors (Coimbra et al., 2012), which has several advantages in that it is time efficient and accurate and the uniform, random and systematic way in which it samples the retina, allows all areas to have equal sampling probability and prevents oversampling (Coimbra et al., 2012). Photomicrographs were taken using a digital camera (Microfire, Optronics, USA) and the Stereo Investigator software. Scale bars and minor adjustments (contrast and brightness) were made to the photomicrographs using Adobe Photoshop CC, and the images were arranged using Adobe Illustrator CC.
Iso-Density Contour Maps
To map the topographic distribution of photoreceptors, the retinal outline data and cell counts for each species were exported (.xml format) from the Stereo Investigator software and uploaded into the statistical program RStudio (http://www.rstudio.com; R Studio, 2013). RStudio is a version of the independent open source program, “R” (http://cran.r-project.org; R Core Team, 2013). Contour maps were produced for the retina of each species to determine the location of visual specializations across the retina. This was done following the methods and R script described by Garza-Gisholt et al. (2014). The contour maps were created by smoothing the original data using a thin plate spline model, whereas peak maximum and minimum densities were derived from the unsmoothed data (Garza-Gisholt et al., 2014). The contour map of the main retina of A. sladeni takes into account the additional area subsampled in order to provide a more accurate representation of the distribution of photoreceptors. Individual maps were also produced for each photoreceptor subtype that was subsampled in the nasal region of A. sladeni. Although multiple specimens of A. sladeni (n = 3) and A. affinis (n = 2) were examined, only one specimen of each was used to determine the topographic distribution of photoreceptors due to the variable fixation quality of the retinas and the reliability of the sampling.
Results
Anatomy of the Tubular Eye
All three Argyropelecus spp. that were examined possessed dorsally directed tubular eyes, and exhibited the typical ocular and retinal features of such (Figure 1). Although specimens of various sizes were examined, the ratio of axial to equatorial length was relatively constant across the three species (0.97–1.03; Table 1). The tubular eyes were large and accounted for an average of 12.5% (s.e. ± 0.16) of the standard length of the fish. The lens was also notably large and yellow in color. The specimens used, had been fixed for a relatively long period and consequently the pigment from the eye had leached out. The tubular eye consisted of two retinal regions, including the main and the accessory retinas (Figure 1). The main retina was situated in the ventral part of the eye and receives input from the dorsal visual field. The accessory retina extended along the medial wall of the eye and receives input from the dorsolateral visual field.
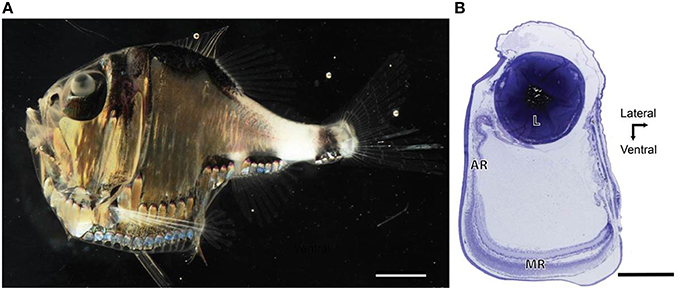
Figure 1. Anatomy of the tubular eye. (A) Lateral view of Argyropelecus spp. Note the large lens, positioned dorsally within the eyecup (Image courtesy of N.J. Marshall and S. P. Collin). (B) Transverse section through the temporal portion of a “typical tubular eye,” Opisthoproctus grimaldii. Note the tubular shape and the large lens (L). The main retain (MR) is at the base of the eye and the accessory retina (AR) extends along the medial wall of the eye. Scale bars = 6 mm (A), 0.5 mm (B).
Retinal Morphology
Analysis of the retinae of the three Argyropelecus spp. reveals that these mesopelagic fishes possess a rod-dominated visual cell layer. However, all three species showed evidence of multiple photoreceptor subtypes when viewed in wholemount and in sectioned material at the level of the light microscope. The inner plexiform layer of all species examined was relatively homogenous with the absence of any large cell nuclei.
Argyropelecus sladeni
Light microscopy revealed marked differences between the nasal and temporal regions of the main retina of A. sladeni. The nasal region of the main retina was ~242.6 ± 11.3 μm thick and comprised a single bank of long, cylindrical photoreceptors (Figures 2A,B; Table 2). The photoreceptors were densely packed into a regular hexagonal array, with the outer segments constituting ~63% of the entire retinal thickness (Figure 2; Table 2). The retinal ganglion cell layer contain a high density of cells, including ganglion cells, glial cells, and displaced amacrine cells (Figure 2A). Based on the morphology of the inner and outer segments of the photoreceptors, two rod photoreceptor subtypes can be distinguished in the visual cell layer. The first rod subtype (R1) differs from the second rod subtype (R2) in that the diameter of both the outer and inner segments are larger (Figure 2B; Table 2). As well as size differences, the outer segments of R2 appeared to be more darkly stained than that of R1, when viewed using light microscopy. These observations were also confirmed when the photoreceptors were viewed in the axial plane in retinal wholemounts (Figure 2C).
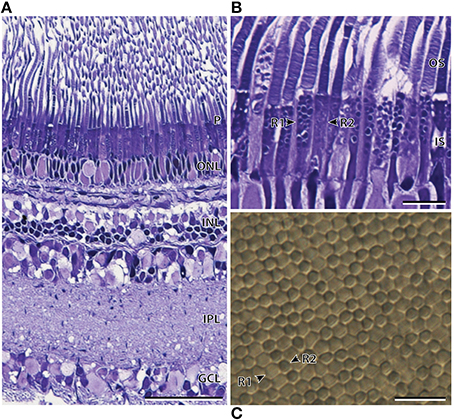
Figure 2. Anatomy of the nasal region of the main retina of Argyropelecus sladeni. (A) Transverse section of the nasal region of the main retina showing the single bank of densely packed photoreceptors (P) and the differentiation of the retina into several distinct layers. ONL, outer nuclear layer; INL, inner nuclear layer; IPL, inner plexiform layer; GCL, ganglion cell layer. (B) Transverse section of the densely packed rod photoreceptors in the nasal main retina. The arrowheads indicate two morphologically distinct rod photoreceptors (R1 and R2). OS, outer segments; IS, inner segments. (C) Tangential view of the inner segments of the nasal main retina viewed in retinal wholemount. Although this specimen is different to that pictured in (A) and (B), the wholemount also reveals two morphologically distinct photoreceptors. The arrowheads depict the two types, which potentially correspond to the R1 and R2 photoreceptors denoted in (B). Note the regular, hexagonal arrangement of the photoreceptors. Scale bars = 50 μm (A), 10 μm (B), 10 μm (C).
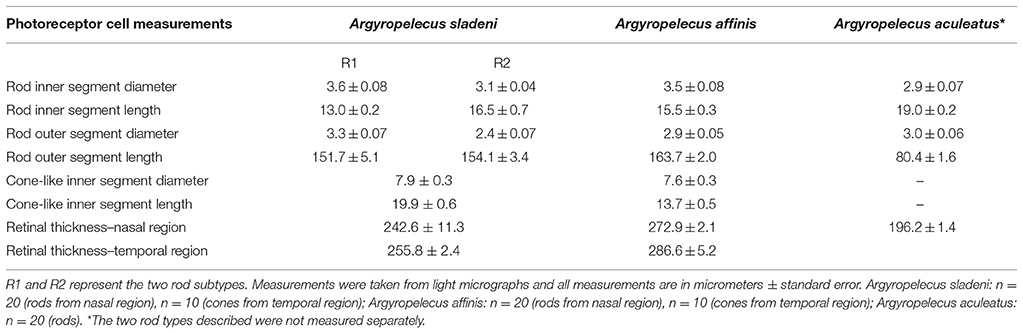
Table 2. Cell dimensions of rod and cone-like photoreceptors in the main retina of the three Argyropelecus spp. examined.
The thickness of the temporal region of the main retina was 255.8 ± 2.4 μm and, like the nasal region, comprised a single bank of photoreceptors (Figure 3A; Table 2). In contrast to the nasal region, the photoreceptors appeared larger, more irregular, less densely packed, and the hexagonal arrangement was no longer as obvious (Figures 3A,E). The retinal ganglion cell layer also showed a marked decrease in the density of cells in the temporal retina (Figure 3A). Discrimination of the R1 and R2 subtypes (described in the nasal region) was more difficult in the temporal region, although, both types were found to be present. Interestingly, there was an addition of a third photoreceptor subtype in the temporal retina, the morphology of which, appears more cone-like than that of the two rod subtypes (Figures 3B,C). Unlike the cylindrical rod inner segments, the cone-like inner segments had a distinct ellipsoid shape, and appeared larger than the neighboring rods. The dimensions of the cone-like inner segments, however, cannot be directly compared to the measurements of the R1 and R2 subtypes as these were measured in the nasal region (Table 2). Instead, differences were confirmed by the proportion of inner segment diameter to inner segment length, in which the cone-like inner segment had a higher proportion (0.4) than both R1 (0.28) and R2 (0.19) inner segments. The presence of three photoreceptor subtypes was also confirmed in the temporal region of the retinal wholemount, where the three receptor subtypes extended as far as the central region of the main retina (Figures 3E,F). Observations from light microscopy suggested that R1 and R2 are more abundant in the temporal region compared to the cone-like photoreceptor; however, the latter was still present in noticeably high densities (Figure 3A). The cone-like photoreceptor was also present in the temporal portion of the accessory retina (Figure 3D).
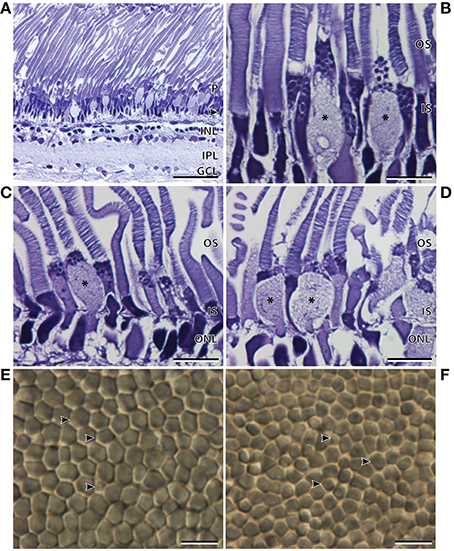
Figure 3. Anatomy of the temporal region of the retina of Argyropelecus sladeni. (A) Transverse section of the temporal region of the main retina showing the single bank of photoreceptors (P) and the differentiation of the retina into several distinct layers. Arrowhead, outer nuclear layer; INL, inner nuclear layer; IPL, inner plexiform layer; GCL, ganglion cell layer. Transverse section of the inner (IS) and outer segments (OS) of the photoreceptors in the medial (B) and lateral (C) regions of the temporal main retina. (D) Transverse section of the accessory retina in the temporal region. * indicates the addition of a third photoreceptor subtype in the temporal main and accessory retina. Note the cone-like, ellipsoid shape of the inner segment. (E) Tangential view of the inner segments of the temporal main retina viewed in retinal wholemount. Although the wholemount represents a different specimen to that pictured in (A–D), the wholemount also indicates three different photoreceptor subtypes. (F) Tangential view of the inner segments of the central main retina also reveal three possible subtypes. The arrowheads indicate the three possible photoreceptor subtypes. Scale bars = 50 μm (A), 10 μm (B–F).
Transmission electron microscopy provided further ultrastructural information pertaining to the differences between the three photoreceptor subtypes. As well as having an ellipsoid shaped inner segment, the cone-like photoreceptor subtype also differ from the R1 and R2 subtypes by the position and shape of the mitochondria (Figure 4). The mitochondria were concentrated in the sclerad portion of the inner segment in the cone-like photoreceptor, while the mitochondria of R1 and R2 were densely packed throughout the length of the inner segment (Figures 4A,D). In addition, the mitochondria of R1 and R2 appeared to be more oval/irregular in shape compared to the spherical mitochondria of the cone-like photoreceptor subtype. Although the photoreceptor depicted in Figure 4A was described here as having a cone-like, ellipsoid inner segment, electron microscopy revealed an incisure within the outer segment, which is typically a rod feature (Figure 4B). The differences between the R1 and R2 receptor subtypes described at the level of the light microscope also became more apparent at the ultrastructural level. The outer segment of R2 appeared slightly darker (osmiophilic) and the diameter of the inner and outer segments was smaller than that of the R1 subtype (Figure 4D; Table 2).
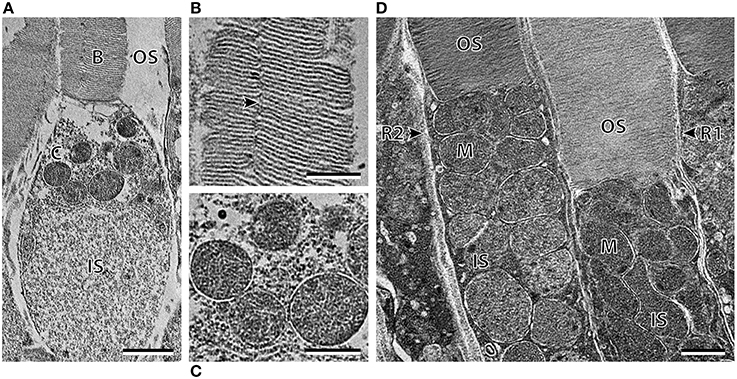
Figure 4. Ultrastructure of the three photoreceptor subtypes of Argyropelecus sladeni. (A) High power electron micrograph of the cone-like photoreceptor in the temporal region of the retina. OS, outer segment; IS, inner segment. B and C correspond to the areas depicted in the following panels (B, C). (B) The outer segment of the cone-like photoreceptor showing the presence of an incisure. (C) The spherical mitochondria of the cone-like photoreceptor. (D) High power electron micrograph of the two types of rods (R1 and R2) from the nasal main retina. Note the densely packed mitochondria (M) throughout the length of the inner segment. Scale bars = 2 μm (A), 1 μm (B–D).
Argyropelecus affinis
Like A. sladeni, the nasal and temporal regions of the main retina of A. affinis exhibited morphological differences. The nasal region of the main retina was ~272.9 ± 2.1 μm in thickness and comprised a single bank of long, cylindrical rod photoreceptors (Figures 5A,B; Table 2). The photoreceptors were densely packed into a regular hexagonal array, and the outer segments of the photoreceptors constituted ~60% of the entire retinal thickness (Figure 5, Table 2). The retinal ganglion cell layer in the nasal region of the main retina in A. affinis appeared to be thinner and more homogenous compared to the nasal region of A. sladeni, and was comprised of one (nasolateral region) to two (nasocentral region) ill-defined layers (Figure 5A). Based on the morphology of the inner and outer segments of the photoreceptors, only one type of rod was identified in the visual cell layer of the nasal retina (Table 2). These observations were also confirmed when the photoreceptors were viewed axially in retinal wholemount (Figure 5C).
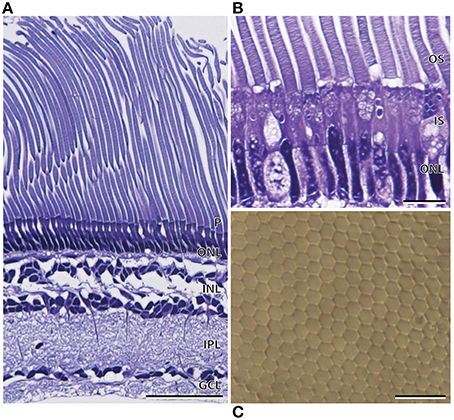
Figure 5. Anatomy of the nasal region of the main retina of Argyropelecus affinis. (A) Transverse section of the main retina in the lateronasal region of the main retina showing the single bank of densely packed photoreceptors (P) and the differentiation of the retina into several distinct layers. Note the elongated rod outer segments, constituting ~60% of the total retinal thickness. ONL, outer nuclear layer; INL, inner nuclear layer; IPL, inner plexiform layer; GCL, ganglion cell layer. (B) Transverse section of the densely packed rod photoreceptors in the nasal region of the main retina. OS, outer segments; IS, inner segments. (C) Tangential view of the inner segments of the nasal main retina viewed in retinal wholemount. Note the regular, hexagonal arrangement of the photoreceptors. Scale bars = 50 μm (A), 10 μm (B), 10 μm (C).
The temporal region of the main retina was ~286.6 ± 5.2 μm in thickness and, like the nasal region, comprised a single bank of photoreceptors (Figure 6A; Table 2). The photoreceptors were larger and consequently less densely packed than those of the nasal region (Figure 6). Furthermore, the photoreceptors in the temporal retina were more irregular, which disrupted the hexagonal arrangement (Figure 6C). The retinal ganglion cells in the temporal retina appeared similar in density to that in the nasolateral retina, with only one ill-defined layer of cells (Figure 6A). Although most of the temporal visual cell layer appeared fairly uniform, a second photoreceptor subtype was present at sparse intervals along the retina (Figure 6B). Unlike the cylindrical rod inner segments, these photoreceptors had an ellipsoidal-shaped inner segment that was wider than the surrounding rods with a cone-like appearance. The dimensions of these cone-like inner segments however, cannot be directly compared to the measurements of the rod inner segments as these were measured in the nasal region (Table 2). Instead, differences were confirmed by the proportion of inner segment diameter to inner segment length, in which the cone-like inner segment had a higher proportion (0.55) than the rod inner segments (0.23). The presence of two photoreceptor subtypes was also confirmed by close examination of the temporal retina in wholemount, in which distinct size differences were revealed (Figure 6C).
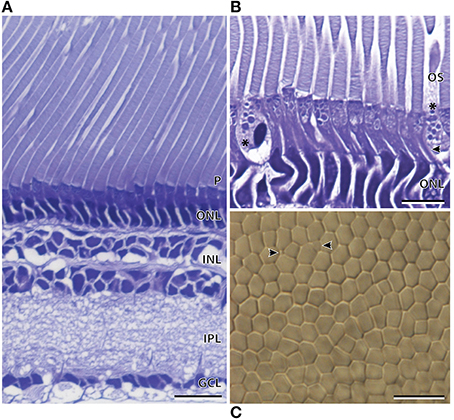
Figure 6. Anatomy of the temporal region of the main retina of Argyropelecus affinis. (A) Transverse section showing the single bank of photoreceptors (P) and the differentiation of the retina into several distinct layers. ONL, outer nuclear layer; INL, inner nuclear layer; IPL, inner plexiform layer; GCL, ganglion cell layer. (B) Transverse section of the inner (arrowhead) and outer segments (OS) of the photoreceptors in the temporal region of the main retina. * indicates a second photoreceptor subtype in the temporal region of the main retina. Note the cone-like, ellipsoidal shape of the inner segment. (C) Tangential view of the inner segments in the temporal region of the main retina viewed in wholemount. Although the wholemount represents a different specimen to that pictured in (A) and (B), a sparsely distributed photoreceptor (indicated by the arrowheads) can be seen among the higher density rod inner segments. Scale bars = 20 μm (A), 10 μm (B), 10 μm (C).
Transmission electron microscopy provided additional ultrastructural characterization of the two photoreceptor subtypes in A. affinis, although it was difficult to locate a fully intact cone inner segment for an acceptable image. Most obvious was the shape of the inner segments, which were cylindrical in the rod, and ellipsoidal or even bulb shaped in the cone-like photoreceptor (Figure 7). The characterization of the mitochondria was similar to that observed in A. sladeni, whereby the spherical mitochondria of the cone-like photoreceptor were mostly concentrated in the sclerad portion of the inner segment and the mitochondria of the rods were densely packed throughout the length of the inner segment (Figure 7). The rod mitochondria were also more oval/irregular in shape compared to the spherical mitochondria of the cone-like photoreceptor. The cone-like photoreceptors also displayed a large, darkly stained (osmiophilic) inclusion in the vitread region of the inner segment. The outer segments of the rods were surrounded by a plasma membrane, however, it was difficult to determine whether this was the same for the cone-like outer segments.
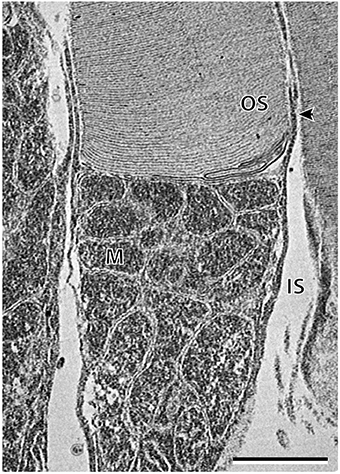
Figure 7. High power electron micrograph of the rod photoreceptor cell of Argyropelecus affinis. Note the densely packed mitochondria (M) throughout the length of the inner segment (IS). The arrowhead indicates the position of the plasma membrane. OS, outer segment. Scale bar = 2 μm.
Argyropelecus aculeatus
The available retina of A. aculeatus was embedded in pieces and sections were taken from an unknown region of the main retina. Light microscopy revealed a region of elongated, densely packed photoreceptors and a single layer of heterogenous ganglion cells within the ganglion cell layer (Figure 8). Out of the three species examined, A. aculeatus had the thinnest retina, with an average thickness of 196.2 ± 1.4 μm, with the outer segments only accounting for ~41% of the entire retinal thickness (Table 2). Two possible rod photoreceptor subtypes were revealed based on variations within the outer nuclear layer (ONL; Figure 8B). The nucleus of the first rod subtype (R1) was elongated/cylindrical and spanned the length of the ONL, while the second rod subtype (R2) had an ellipsoidal shape and was only present within the sclerad two-thirds of the ONL. In addition, staining of the outer segments revealed two contrasting types (Figure 8A). These characteristics are similar to that described for A. sladeni in the nasal region of the main retina.
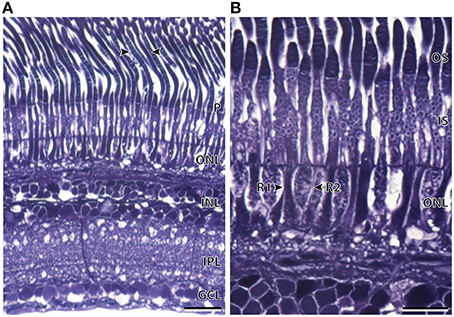
Figure 8. Anatomy of an unknown region of the main retina of Argyropelecus aculeatus. (A) Transverse section of the main retina showing the single bank of densely packed photoreceptors (P) and the differentiation of the retina into several distinct layers. ONL, outer nuclear layer; INL, inner nuclear layer; IPL, inner plexiform layer; GCL, ganglion cell layer. The arrowheads show the two differently stained outer segments. (B) Transverse section of the densely packed rod photoreceptors in the main retina. The arrowheads indicate two morphologically distinct rod photoreceptors (R1 and R2). Note the position and the shape of the nucleus of each rod type within the outer nuclear layer differs. OS, outer segments; IS, inner segments. Scale bars = 20 μm (A), 10 μm (B).
The morphological differences described could not be confirmed using transmission electron microscopy due to inadequate fixation of the retinal tissue. However, a different specimen viewed in retinal wholemount revealed similar features. Like that of A. sladeni, two morphologically distinct photoreceptors were present in the nasal region of the main retina (Figure 9A). The photoreceptors were densely packed into a regular hexagonal array and the two rod types were differentiated based on size and staining pattern. In addition, the two subtypes were still distinguishable from each other in the lateral region of the main retina, and a possible third photoreceptor subtype was present in the temporal and central regions of the main retina (Figures 9B–D). Variable sizes of inner segments were also observed in the temporal accessory retina (Figure 9E).
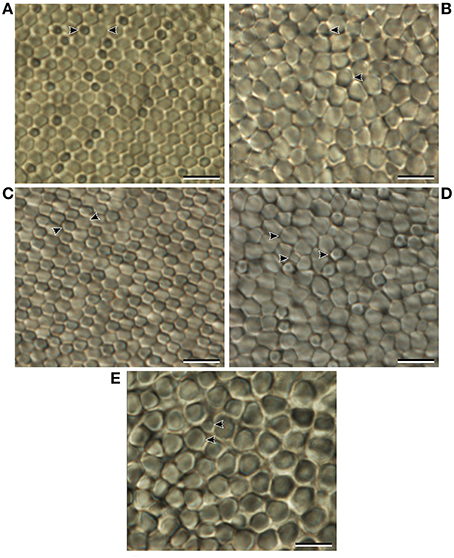
Figure 9. Morphology of the inner segments of Argyropelecus aculeatus viewed in retinal wholemount. (A) Inner segments of the nasal region of the main retina. (B) Inner segments of the temporal region of the main retina. (C) Inner segments of the lateral region of the main retina. (D) Inner segments of the central region of the main retina. (E) Inner segments of the accessory retina. Arrowheads indicate morphologically distinct photoreceptor subtypes that are identified using frequent adjustment of the fine focus of the compound microscope. Note the smaller, slightly darker photoreceptors in (A) and (C). Scale bars = 10 μm (A–E).
Spatial Distribution of Photoreceptors
Isodensity contour maps of the photoreceptor distributions revealed nasotemporal cell density gradients in the main retina of each of the three species examined (Figures 10A–C). The density of photoreceptors increased toward the nasal region in each species, with a region of high density (area centralis) in the central region of the main retina. Similar peak densities were observed in A. affinis and A. aculeatus (up to 73,000 cells mm−2) however, A. sladeni showed the highest peak density of all three species, whereby cell densities increased from 20,000 cells mm−2 in the temporal retina to a peak of 96,000 cells mm−2 in the central part of the retina toward the nasal region. The density of photoreceptors in the accessory retina of A. aculeatus was relatively homogenous and similar to that of the low density area in the temporal region of the main retina (up to 20,000 cells mm−2). Retinal subsampling in the nasal region of A. sladeni revealed that the density of the two rod types, R1 and R2, varied in the nasotemporal axis, however, the gradients were the reverse of each other (Figures 10D–E). The density of the R1 population increased nasally with a peak density of 55,000 cells mm−2, and the density of the R2 population increased temporally with a peak density of 68,000 cells mm−2.
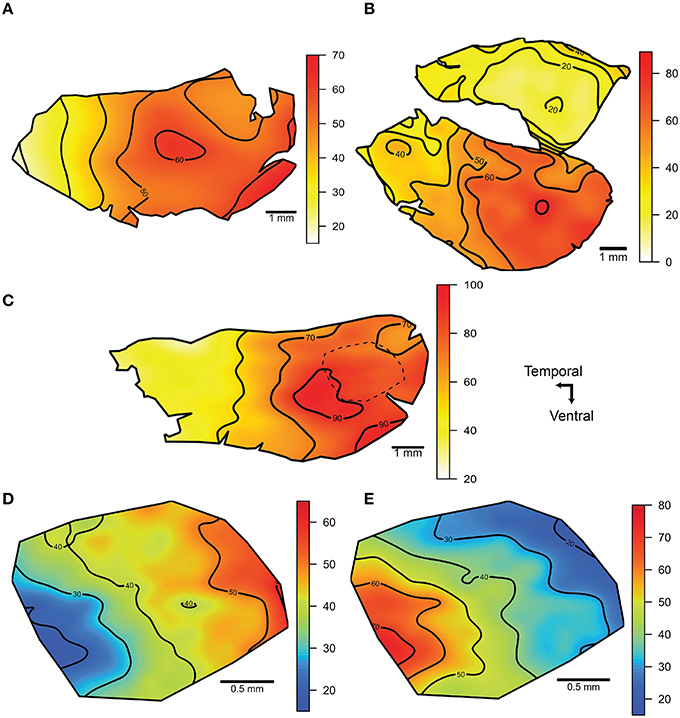
Figure 10. Iso-density contour maps of the distribution of photoreceptors within the retina. (A, C) The distribution of photoreceptors of the main retina of Argyropelecus affinis (A) and Argyropelecus sladeni (C). (B) The distribution of photoreceptors in the main (ventral) and accessory (dorsal) retina of Argyropelecus aculeatus. All eyes examined were left eyes. The dotted line in the nasal region of A. sladeni (C) depicts the region that was subsampled to provide separate contour maps for the two morphologically distinct rod photoreceptors, R1 and R2. (D, E) The distribution of the R1 (D) and R2 (E) photoreceptor types. All densities are x 103 cells per mm2 and represent the smoothed data (using a thin plate spline function).
Discussion
This study reveals the non-uniform nature of the retina with regards to both the morphology and distribution of photoreceptors, in three mesopelagic species of hatchetfishes. All species show evidence of a regional specialization of increased density of photoreceptors indicating the importance of maintaining a region of high acuity. This is consistent with the findings described earlier by Collin et al. (1997) in their study on retinal ganglion cell topography. It is now well-established that the majority of animals possess retinae that are divided morphologically into different zones, which subtend different regions of the visual field to optimize either spatial resolving power or sensitivity (Collin, 1997). Among the tubular-eyed species examined, this is perhaps most evident in Scopelarchus michaelsarsi, in which the comprehensive analysis by Collin et al. (1998) revealed seven retinal specializations across the main and accessory retinae. The regional specializations found in the present study along with evidence from the literature, highlight the important role vision plays even at the restricted light levels of the mesopelagic zone.
Retinal Morphology
An adaptation common among deep-sea teleosts is the elongation of rod photoreceptors, in particular the outer segments. The outer segments consist of loosely stacked membranous discs, which contain photopigments (rhodopsin/porphyropsin) that absorb the incoming wavelengths of light (Bowmaker, 1991). Functionally, a longer outer segment provides a longer light path and a higher density of photopigment for a better chance of quantum capture (Locket, 1970b; Fröhlich and Wagner, 1998). Elongated rod outer segments were observed in all three species examined, although A. affinis and A. sladeni both had lengths almost double that of A. aculeatus. Other studies have also noted variable rod outer segment lengths among tubular-eyed species, with total rod lengths varying from 120 μm in Argyropelecus hemigymnus to as high as 230 μm and 340 μm in Scopelarchus analis and Scopelarchus sagax, respectively, (Locket, 1971; Collin et al., 1997). Although rod length is highly variable in tubular-eyed species, they are typically long in comparison to their shallow water counterparts (10–60 μm) and it is therefore considered an adaptation to living in a low light environment (Saude, 1993). Sensitivity of the retina is further increased by the tight packing and hexagonal arrangement of the photoreceptors, which increases the surface area available for photon capture (Collin et al., 1998).
The waveband of available light becomes both narrower and less intense as depth increases, and it is therefore not surprising that the majority of fish inhabiting the deep-sea possess pure-rod retinas (Denton, 1990). Argyropelecus spp. are among those described as pure-rod, with no previous mention of any other morphologically distinct photoreceptor types (Munk, 1965; Collin et al., 1997). The findings of the current study, however, are not consistent with this literature and present the possibility of different morphologically-distinct rod photoreceptors as well as cone-like photoreceptors. While it is suspected that A. sladeni and A. aculeatus possess two rod subtypes in the nasal region of the retina, it is uncertain whether the cone-like photoreceptors in the temporal region of A. sladeni and A. affinis can truly be classified as cones. Both of the cone-like photoreceptor types show distinct morphological differences to the rods in terms of their size and inner segment shape, and also differ in the shape, density and position of the mitochondria. Inner segments of cones are often depicted as having more of an ellipsoidal shape compared to that of the cylindrical rod inner segments; however, this appears to be the only evidence to suggest that these photoreceptors are cone-like (Bowmaker, 1991).
The presence of cones in the retina of deep-sea fishes is, however, not uncommon. Munk (1965, 1981, 1982, 1984, 1989, 1990) has investigated a number of species, which possess cones, with some regions of the retina even being described as pure-cone. The most definitive morphological distinction between rods and cones comes from the nature of the outer segment. Typically, rod outer segments are cylindrical and the stacks of membranous discs are completely enclosed within the plasma membrane (Munk, 1977). Cone outer segments are conical and the stacks of membranous discs only remain attached to the plasma membrane at the side opposite to the connecting cilium (of the inner segment; Munk, 1977). Unfortunately, no full-length outer segments for these cone-like photoreceptors were obtained, although an outer segment attached to a cone-like cell in A. sladeni was found to possess an incisure. Incisures are typically associated with rod outer segments where the membranous discs are not circular, but have numerous indentations or gaps (Eckmiller, 2000). No incisures were found in the cone-like photoreceptors of A. affinis. While it is clear that there are morphologically distinct photoreceptors within each retina examined, without an analysis of the visual pigments, no clear conclusions can be made about whether these photoreceptors play functionally different roles.
A number of studies reveal that the majority of deep-sea teleosts have a single rod pigment with a wavelength of maximum absorbance (λmax) in the range of 470–495 nm (Munz, 1958; Partridge et al., 1988, 1989, 1992). The spectral sensitivity of these visual pigments is tuned approximately to the spectral distribution of dim downwelling light in the deep ocean, which is around 475–485 nm (Lythgoe, 1991), and the underlying molecular mechanisms involved has been explored by Hunt et al. (2001). Two distinct rod opsins have however been identified in Scopelarcus analis (Pointer et al., 2007) and, in a microspectrophotometery (MSP) study of the pigments present in 15 species of deep-sea fishes, Partridge et al. (1988) found that two species, Bathylagus bericoides and Malacocephalus laevis, also possessed two different rod pigments located in morphologically distinct rod types. In the case of M. laevis, pigments with λmax values of 478 nm and 485 nm were observed in rods with a diameter of 4–5 and 2–3 μm, respectively. B. bericoides exhibited similar patterns with λmax values of 466 nm and 500 nm observed in rods with a diameter of 1.5–3.5 and 3–4 μm, respectively (Partridge et al., 1988). This study is significant as it demonstrates the possibility of finding multiple types of rod pigments absorbing maximally at different wavelengths in rods differing in diameter by as little as 0.5–1 μm. Two rod subtypes were observed in A. sladeni and A. aculeatus, based on the morphology and photoreceptor dimensions, and it is possible that these species may possess a combination of different photopigments. However, previous studies of Argyropelecus spp. using both MSP and extraction techniques have revealed this is not the case. All Argyropelcus spp. appeared to show only one λmax between 475 and 478 nm, and there was no mention of any photoreceptor subtypes (Fernandez, 1979; Partridge et al., 1988, 1989). Only 16 photoreceptor cells were examined in A. aculeatus and these were taken from an unknown region of the retina (Partridge et al., 1988). The density and type of individual photoreceptors have been shown to change across the retina in the nasotemporal axis of all species examined (current study). Therefore, depending on the region of the retina from which these photoreceptors were taken, this could significantly alter or bias the results obtained using MSP. Further analysis is therefore required to determine whether the morphological differences noted in the photoreceptor subtypes in the current study, translate to functional differences in spectral absorbance.
During the development of the retina, the cones are the first photoreceptors to differentiate (Wagner et al., 1998). Cones have been observed during larval development in some deep-sea species, which contain only rods as a mature adult (Wagner et al., 1998). Little is known about the early developmental stages of Argyropelecus spp. but it is understood that these species have planktonic eggs and larvae occurring in the upper 100 m of the water column (Richards, 2005). As these species spend the early stages of their life in the epipelagic zone, before migrating to deeper waters, it is possible that cones may play an important role in vision in higher light conditions. The presence of multiple photoreceptor subtypes in adult specimens may also infer that a small population of cones has been retained. Adult Argyropelecus spp. are known to return to shallower waters to feed (50–300 m), and it is plausible that cones are retained to allow them to maintain their visual capacity in variable light environments.
Argyropelecus spp. make diel migrations in the water column between 50 and 800 m (Whitehead et al., 1989). The lower extent of this boundary is dominated by a narrow bandwidth of light (475–495 nm) and bioluminescent emissions of similar properties (Denton, 1990). The upper limit, however, receives a wider distribution of light potentially between 380 and 590 nm (Denton, 1990). Although these species are thought to migrate to shallower depths at night, depending on the amount of time spent at these depths, there is the potential to use photoreceptors that cover a wider spectral range than the narrow light spectra observed in the deep. It is also worth mentioning the presence of yellow, short wavelength absorbing lenses in these species. The lens of A. affinis has been found to possess four major peak absorbances ranging from 382 to 462 nm (Somiya, 1976; McFall-Ngai et al., 1986). This appears to correspond to the short wavelength spectra that would be experienced in the shallower depths to which they migrate, suggesting the potential for photoreceptor subtypes to absorb longer wavelengths between 462 and 590 nm. The presence of a yellow lens may serve two purposes, firstly to decrease the relative intensity of the downwelling light and thus enhance the contrast of bioluminescent objects, and secondly to enhance image quality by decreasing both chromatic aberration and short wavelength scatter, when in shallower depths (Somiya, 1976; Douglas and Thorpe, 1992; Douglas et al., 1998).
Spatial Distribution of Photoreceptors
Topographic analysis of the photoreceptors revealed all species to possess an area centralis in the central region of the main retina. At present, there are no photoreceptor distribution data available for any tubular-eyed species. However, Collin et al. (1997) estimated a density of 97,600 photoreceptors mm−2 in the main retina of A. sladeni measured from light micrographs of transverse sections of the retina. This reveals a remarkably similar density to that determined in this stereological study of 96,000 photoreceptors mm−2 in the central region of A. sladeni. The position of the area centralis determined by the distribution of photoreceptors is also comparable to that of the area centralis of the ganglion cells determined by Collin and Partridge (1996) and Collin et al. (1997). Topographic analysis of the cells within the ganglion cell layer show that areae centrales are located in the nasal (A. aculeatus), nasolateral (A. affinis), and centro-lateral (A. sladeni) regions of the main retina (Collin et al., 1997). The correlation of the high density photoreceptor and ganglion cell areas in each species suggests that these regions provide increased sampling of an image and higher spatial resolution. Although the ganglion cell density was not quantitatively assessed in this study, a higher density of ganglion cells in the centro-nasal region of the main retina was observed, particularly in the retina of A. sladeni, as revealed by light microscopy. Slight differences in the position of the area centralis determined in this study compared to Collin et al. (1997), may of course be attributed to differences in the size and age of the specimens examined, as well as the techniques used to assess the distribution of cells. Counts were determined using a modern stereological approach (Stereo Investigator), which provides a random, systematic and unbiased method of sampling (Coimbra et al., 2012). In addition, contour maps were constructed based on the newest interpolation methods tested by Garza-Gisholt et al. (2014). This is in contrast to previously used methods of counting whereby analysis was done under a microscope and density values were smoothed “by hand” or “by eye” (Garza-Gisholt et al., 2014).
The location of the area centralis in the central and centro-nasal regions of the main retina subserve greater spatial resolution in the central and centro-temporal regions of the dorsal binocular visual field. As the tubular eyes of these species are assumed to possess little mobility, the position of the area centralis may indicate the position at which an organism needs to be located in the visual field in order to be visualized with high acuity and perhaps to discriminate between predator and prey items (Collin et al., 1997, 1998). These species are not thought to actively orientate their bodies toward prey items, and this is confirmed by the vertical position of the mouth. Argyropelecus spp. may only be able to accurately strike upwards at prey once the prey's leading edge reaches the central area centralis (Collin et al., 1997). This is in contrast to the tubular-eyed species Dolichopteryx spp., which possess a horizontal mouth and a centrally located area centralis, suggesting that the position of the area centralis may be influenced by the structure of the feeding apparatus as well as the light environment. The temporal region of the main retina of each species contains larger photoreceptors, which suggests that this region of the retina is more specialized for increasing sensitivity and enhancing absorption of light originating from the upper part of the frontal visual field.
Subsampling of the nasal region of A. sladeni revealed a well-defined pattern of distribution for both the R1 and R2 photoreceptor subtypes. This finding suggests that these two rod subtypes are indeed morphologically distinct populations of photoreceptors with different functions. Although the distribution of the cone-like photoreceptors of A. sladeni and A. affinis were not quantitatively assessed, distinct distribution patterns were clearly evident from the light microscopy. The cone-like photoreceptors were present in higher abundance in the temporal region of each species, with densities in A. sladeni comparable to the two rod subtypes in this region. Different photoreceptor subtypes subserving different regions of the visual field have also been documented in the deep-sea teleost, Lestidiops affinis (Munk, 1989). This species possesses a temporal retinal region containing only cones, a nasal region containing rods grouped into bundles, and a narrow zone of transition in the central retina (Munk, 1989). The significance of having two or even three morphologically distinct photoreceptor types with distributions subserving different regions of the visual field confirms the concept that the retina is divided specifically to fulfill different visual tasks. Furthermore, possessing two rod subtypes may allow these species to better distinguish between different sources of bioluminescence (Partridge et al., 1988).
Conclusion
In response to the low light characteristics of the deep-sea, some teleosts have evolved tubular eyes to enhance their visual capacity, allowing them to perform biological tasks and survive at such depths. This study reveals a number of retinal specializations in hatchetfishes, including multiple photoreceptor subtypes and photoreceptor density gradients with pronounced areae centrales. These findings confirm that the retina is divided into regions specialized for either optimizing spatial resolving power or sensitivity. The presence of multiple photoreceptor subtypes may be significant although without testing the spectral sensitivities of each type, it is unknown whether these differences translate to a functional level. The multiple photoreceptor types present among these species is perhaps a result of their migratory behavior and their ability to adapt to changing light environments. Further studies are required to determine whether the different photoreceptor types found in these species are maximally sensitive to wavelengths outside of the narrow waveband found in the deep ocean. Future studies combining the topographic analysis of both photoreceptor and ganglion cell distributions would allow the summation of cell densities for a better understanding of the spatial resolving abilities of these species.
Author Contributions
SC responsible for specimen collection and providing assistance during retinal dissection. Specimens prepared for dissection, wholemounting and light/electron microscopy by LB. Stereological analysis and image preparation by LB. Drafting, critical analysis and interpretation of data by SC, DH, and LB.
Conflict of Interest Statement
The authors declare that the research was conducted in the absence of any commercial or financial relationships that could be construed as a potential conflict of interest.
Acknowledgments
We would sincerely like to thank Eduardo Garza-Gisholt for providing his time and assistance with RStudio and contour mapping. Thanks to João Paulo Coimbra for offering his supervision while using the Stereo Investigator. Thanks to Michael Archer for his technical assistance in the lab. Thanks to Adam Locket for allowing us to use the previously preserved specimens. We would also like to acknowledge the facilities, and the scientific and technical assistance of the Australian Microscopy Research Facility at the Centre for Microscopy, Characterisation and Analysis at The University of Western Australia, a facility funded by the University, State and Commonwealth Governments. In particular, thanks to Lyn Kirilak and John Murphy. This research would not have been possible without the funding and support of the School of Animal Biology at the University of Western Australia, the Australian Research Council and the Western Australian Government.
References
Bowmaker, J. K. (1991). “The evolution of vertebrate visual pigments and photoreceptors,” in Vision and Visual Dysfunction, eds J. R. Cronly-Dillon and R. L. Gregory (London: The Macmillan Press Ltd), 63–78.
Bunt, S. M. (1991). ‘Evolution of vision in fish,” in Vision and Visual Dysfunction, ed J. R. Cronly-Dillon and R. L. Gregory (London: The Macmillan Press Ltd), 398–417.
Coimbra, J. P., Hart, N. S., Collin, S. P., and Manger, P. R. (2013). Scene from above: retinal ganglion cell topography and spatial resolving power in the giraffe (Giraffa camelopardalis). J. Comp. Neurol. 521, 2042–2057. doi: 10.1002/cne.23271
Coimbra, J. P., Nolan, P. M., Collin, S. P., and Hart, N. S. (2012). Retinal ganglion cell topography and spatial resolving power in penguins. Brain Behav. Evol. 80, 254–268. doi: 10.1159/000341901
Coimbra, J. P., Trévia, N., Marceliano, M. L., da Silveira Andrade-Da-Costa, B. L., Picanσo-Diniz, C. W., and Yamada, E. S. (2009). Number and distribution of neaurons in the retinal ganglion cell layer in relation to foraging behaviors of tyrant flycatchers. J. Comp. Neurol. 514, 66–73. doi: 10.1002/cne.21992
Collin, S. P. (1997). Specialisations of the teleost visual system: adaptive diversity from shallow-water to deep-sea. Acta. Physiol. Scand. 161, 5–24.
Collin, S. P., and Partridge, J. C. (1996). Retinal specialisations in the eyes of deep-sea teleosts. J. Fish Biol. 49, 157–174. doi: 10.1111/j.1095-8649.1996.tb06073.x
Collin, S. P., Hoskins, R. V., and Partridge, J. C. (1997). Tubular eyes of deep-sea fishes: a comparative study of retinal topography. Brain Behav. Evol. 50, 335–357. doi: 10.1159/000113345
Collin, S. P., Hoskins, R. V., and Partridge, J. C. (1998). Seven retinal specializations in the tubular eye of the deep-sea pearleye, Scopelarchus michaelsarsi: a case study in visual optimization. Brain Behav. Evol. 51, 291–314. doi: 10.1159/000006544
de Busserolles, F., Fitzpatrick, J. L., Marshall, N. J., and Collin, S. P. (2014). The influence of photoreceptor size and distribution on optical sensitivity in the eyes of lanternfishes (Myctophidae). PloS ONE 9:e99957. doi: 10.1371/journal.pone.0099957
Denton, E. J. (1990). “Light and vision at depths greater than 200m,” in Light and Life at Sea, ed P. J. Herring, A. K. Campbell, M. Whitfield, and L. Maddock (Cambridge: Cambridge University Press), 127–148.
Douglas, R. H., and Thorpe, A. (1992). Short-wave absorbing pigments in the ocular lenses of deep-sea teleosts. J. Mar. Biol. Ass. UK. 72, 93–112. doi: 10.1017/S0025315400048815
Douglas, R. H., Partridge, J. C., and Marshall, N. J. (1998). The eyes of deep-sea fish I: lens pigmentation, tapeta and visual pigments. Prog. Retin. Eye Res. 17, 597–636. doi: 10.1016/S1350-9462(98)00002-0
Eckmiller, M. S. (2000). Microtubules in a rod-specific cytoskeleton associated with outer segment incisures. Vis. Neurosci. 17, 711–722. doi: 10.1017/S0952523800175054
Fernald, R. D. (1985). Growth of the teleost eye: novel solutions to complex constraints. Env. Biol. Fish. 12, 113–123. doi: 10.1007/BF00002579
Fernandez, H. R. C. (1979). Visual pigments of bioluminescent and non-bioluminescent deep-sea fishes. Vis. Res. 19, 589–592. doi: 10.1016/0042-6989(79)90144-5
Fröhlich, E., and Wagner, H. J. (1998). Development of multibank rod retinae in deep-sea fishes. Vis. Neurosci. 15, 477–483.
Fröhlich, E., Negishi, K., and Wagner, H. J. (1995). Patterns of rod proliferation in deep-sea fish retinae. Vis. Res. 35, 1799–1811.
Froese, F., and Pauly, D. (2013). FishBase. Available online at: http://www.fishbase.org. (Accessed September 20, 2013.
Garza-Gisholt, E., Hemmi, J. M., Hart, N. S., and Collin, S. P. (2014). A comparison of spatial analysis methods for the construction of topographic maps of retinal cell density. PLoS ONE 9:e93485. doi: 10.1371/journal.pone.0093485
Hunt, D. M., Dulai, K. S., Partridge, J. C., and Cottrill, P. (2001). The molecular basis for spectral tuning of rod visual pigments in deep-sea fish. J. Exp. Biol. 204, 3333–3344.
Litherland, L., and Collin, S. P. (2008). Comparative visual function in elasmobranchs: spatial arrangement and ecological correlates of photoreceptor and ganglion cell distributions. Vis. Neurosci. 25, 549–561. doi: 10.1017/S0952523808080693
Locket, N. A. (1970b). Retinal structure in a deep-sea fish, Sternoptyx diaphana, Hermann. Expl. Eye Res. 9, 22–27.
Locket, N. A. (1971). Retinal anatomy in some scopelarchid deep-sea fishes. Proc. R. Soc. Lond. B. Biol. Sci. 178, 161–184.
Locket, N. A. (1977). “Adaptations to the deep-sea environment,” in Handbook of Sensory Physiology: The Visual System of Vertebrates, ed F. Crescitelli (Berlin: Springer-Verlag), 67–192.
Lythgoe, J. N. (1991). “Evolution of visual behavior,”in Vision and Visual Dysfunction, eds J. R. Cronly-Dillon and R. L. Gregory (London: The Macmillan Press Ltd), 3–12.
McFall-Ngai, M., and Crescitelli, F., Childress, J., Horwitz, J. (1986). Patterns of pigmentation in the eye lens of the deep-sea hatchetfish, Argyropelecus affinis Garman. J. Comp. Physiol. A. 159, 791–800. doi: 10.1007/BF00603732
Munk, O. (1965). Omosudis lowei Günther, 1887 a bathypelagic deep-sea fish with an almost pure-cone retina. Meddr. Dansk. Naturh. 128, 341–355.
Munk, O. (1977). The visual cells and retinal tapetum of the foveate deep-sea fish Scopelosaurus lepidus (Teleostei). Zoomorphology 87, 21–49. doi: 10.1007/BF02568740
Munk, O. (1981). On the cones of the mesopelagic teleost Trachipterus trachypterus (Gmelin, 1789). Meddr. Dansk. Naturh. 143, 101–111.
Munk, O. (1982). Cones in the eye of the deep-sea teleost Diretmus argenteus. Vis. Res. 22, 179–181. doi: 10.1016/0042-6989(82)90180-8
Munk, O. (1984). Duplex retina in the mesopelagic teleost Radiicephalus elongates Osorio, 1917. Meddr. Dansk. Naturh. 145, 183–199.
Munk, O. (1989). Duplex retina in the mesopelagic deep-sea teleost Lestidiops affinis (Ege, 1930). Acto Zool Stockholm. 70, 143–149. doi: 10.1111/j.1463-6395.1989.tb01064.x
Munk, O. (1990). Changes in the visual cell layer of the duplex retina during growth of the eye of a deep-sea teleost, Gempylus serpens, Cuvier, 1829. Acta Zool Stockholm. 71, 89–95. doi: 10.1111/j.1463-6395.1990.tb01073.x
Munz, F. W. (1958). Photosensitive pigments from the retinae of certain deep-sea fishes. J. Physiol. 140, 220–235. doi: 10.1113/jphysiol.1958.sp005929
Partridge, J. C., Archer, S. N., and Lythgoe, J. N. (1988). Visual pigments in the individual rods of deep-sea fishes. J. Comp. Physiol. 162, 543–550. doi: 10.1007/BF00612519
Partridge, J. C., Archer, S. N., and Van Oostrum, J. (1992). Single and multiple visual pigments in deep-sea fishes. J. Mar. Biol. Ass. UK. 72, 113–130. doi: 10.1017/S0025315400048827
Partridge, J. C., Shand, J., Archer, S. N., Lythgoe, J. N., and van Groningen-Luyben (1989). Interspecific variation in the visual pigments of deep-sea fishes. J. Comp. Physiol. 164, 513–529. doi: 10.1007/BF00610445
Pointer, M. A., Carvalho, L. S., Cowing, J. A., Bowmaker, J. K., and Hunt, D. M. (2007). The visual pigments of a deep-sea teleost, the pearl eye Scopelarchus analis. J. Exp. Biol. 210, 2829–2835. doi: 10.1242/jeb.006064
R Core Team (2013). R: A language and Environment for Statistical Computing. Vienna: R Foundation for Statistical Computing.
Richards, W. J. (2005). “Sternoptychidae: marine hatchetfishes and relatives,” in Early Stage of Atlantic fishes: An Identification Guide to the Western Central North Atlantic, ed W. J. Richards (New York, NY: CRC Press, Taylor and Francis group), 241–259.
Robison, B. R. (2004). Deep pelagic biology. J. Exp. Mar. Biol. Ecol. 300, 253–272. doi: 10.1016/j.jembe.2004.01.012
Somiya, H. (1976). Functional significance of the yellow lens in the eyes of Argyropelecus affinis. Mar. Biol. 34, 93–99. doi: 10.1007/BF00390750
Stone, J. (1981). The Whole Mount Handbook: A Guide to the Preparation and Analysis of Retinal Whole Mounts. Sydney, NSW: Maitland Publications.
Wagner, H. J., Fröhlich, E., Negishi, K., and Collin, S. P. (1998). The eyes of deep-sea fish II. Functional morphology of the retina. Prog. Retin. Eye Res. 17, 637–685.
Warrant, E. J., Collin, S. P., and Locket, N. A. (2003). “Eye design and vision in deep-sea fishes,” in Sensory Processing in Aquatic Environments, eds S. P. Collin and J. N. Marshall (New York, NY: Springer-Verlag), 303–322.
Keywords: photoreceptors, retina, topographic, visual field, tubular eyes, mesopelagic
Citation: Biagioni LM, Hunt DM and Collin SP (2016) Morphological Characterization and Topographic Analysis of Multiple Photoreceptor Types in the Retinae of Mesopelagic Hatchetfishes with Tubular Eyes. Front. Ecol. Evol. 4:25. doi: 10.3389/fevo.2016.00025
Received: 26 January 2016; Accepted: 07 March 2016;
Published: 29 March 2016.
Edited by:
Martin Stevens, University of Exeter, UKReviewed by:
Ronald Hamilton Douglas, City University London, UKKaren Carleton, University of Maryland, USA
Copyright © 2016 Biagioni, Hunt and Collin. This is an open-access article distributed under the terms of the Creative Commons Attribution License (CC BY). The use, distribution or reproduction in other forums is permitted, provided the original author(s) or licensor are credited and that the original publication in this journal is cited, in accordance with accepted academic practice. No use, distribution or reproduction is permitted which does not comply with these terms.
*Correspondence: Lauren M. Biagioni, lauren.biag@hotmail.com