Reducing carbon emission in the goat farms by switching from conventional goat farming to green goat farm typology
 Selime Canan
- Department of Agricultural Economics, Faculty of Agriculture, Ondokuzmayıs University, Samsun, Türkiye
The carbon footprint of goat farms associated with the management type and the income sacrifice to switch to green goat farms are still not precise in the literature. Therefore, the objectives of this study were 1) to assess the environmental impacts of goat farming associated with management typology in Türkiye and 2) to explore the link between farm-level income sacrifice and the amount of greenhouse gas (GHG) reduction. Goat farm-level data were collected from randomly selected 284 goat farms through a questionnaire. Environmental impacts of goat farming associated with the management typology were examined using the life cycle assessment (LCA). The GHG emissions were calculated both for the whole goat farm associated with the management type and for individual goat products such as milk, meat, mohair, and replacement. The research results showed that Turkish goat farms emitted GHG emissions for the production of per kg of meat, milk, and mohair by 9.85 kg CO2-eq, 8 kg CO2-eq, and 0.28 kg CO2-eq, respectively. Goat farms in management type 1 emitted the highest GHG emission in a year, while that of goat farms in type 5 was the lowest. The research results also showed that the environmental impact and farm-level income sacrifice per kg GHG emission reduction to reach the level of environmentally friendly goat farms varied according to the management type of goat farms. Typical Turkish goat farms gained agricultural income by 2.47 USD per kg of GHG emission. The amount of agricultural income gained per kg GHG emission varied according to typology. Based on the research results, typical Turkish goat farms faced with an income sacrifice of 2.85 USD per kg GHG emission reduction to reach the level of environmentally friendly goat farms having minimum GHG emission in a year. Turkish goat farms emitted 0.49 kg CO2-eq per USD of agricultural production expenses. The study suggests switching from a conventional management type to environmentally friendly management type goat farms. Facilitating the accessibility of financial resources may enhance the switching process through benefiting investments in infrastructure, equipment, and research and development. Creating resource-efficient and environmentally friendly goat farms by subsidizing the goat farms may decrease GHG emissions.
1 Introduction
Carbon emissions occurring through various production processes are the most important problem of mankind. The agricultural and livestock industries are sources of carbon emissions, leading to climate change (Cerri e al., 2016; Ibidhi and Calsamiglia, 2020; Abbas et al., 2022a; Elahi et al., 2022a; Abbas et al., 2022b; Elahi et al., 2022b; Türkten et al., 2023). Elahi et al. (2022a) focused on agricultural emission and elicited the farmers’ intention and willingness to install renewable energy technology to reduce the environmental emissions of agriculture. Some authors focused on farm-level carbon emission generation by the crop type. Abbas et al. (2022a) conducted farm-level sensitivity analysis of greenhouse emission for grains and other cash crops. Similarly, Abbas et al. (2022b) assessed the greenhouse emission for cotton by using farm-level energy analysis. Accurate evaluation of the interaction of plant and animal production processes with climate change is of great importance for the sustainability of food systems. The supply chain, which extends from production to consumption of animal products, is significantly affected by climate change (Godde et al., 2020). The interaction of small livestock farming, especially goat farming, with climate change is of particular importance. There has been a mutual interaction between goat production and climate change. On one hand, goat production is affected by stress factors sourced mainly by climate changes such as extreme environmental conditions and heat stress. Extreme environmental conditions affect the accessibility of goat farmers to appropriate pastures (Marino et al., 2015). Heat stress can negatively affect milk yield and the contents of total protein, casein, and fat of milk in goats (Sevi et al., 2001; Hamzaoui et al., 2012; Salama et al., 2014). Marino et al. (2015) emphasized that even if the goat was a heat-tolerant species, climate change and other stress factors result in the impairment of production and reproduction performance. On the other hand, goat production also affects the climate change by contributing to the greenhouse gas (GHG) emission. The GHG emissions emitted by goat farms mostly (85%) stem from the release of methane (CH4) and carbon dioxide feed (Gerber et al., 2013). The issue of balancing the mutual interaction is crucial for sustainable goat product supply chains due to the importance of edible and non-edible goat products in human nutrition. The global goat number is more than 100 million heads, which is expected to increase by 1.7% per year. Türkiye ranks 23rd in world and 1st among the European Union (EU) countries in terms of goat numbers. Türkiye constituted 1% of the world’s total goat numbers and 48% of the total number of goats in EU countries (28). It is clear from the aforementioned statistics that goats seriously emit GHG. Therefore, understanding the relationship between goat farming and climate change is vital for the stakeholders of the goat industry, and it has a top rank in the policymakers’ agenda.
To date, some previous studies have focused on measuring the GHG emission of goat meat and milk by using the life cycle assessment (LCA). Opio et al. (2013) stated that goat farms emitted 23.5 kg of emissions of CO2-eq per kg of meat and 5.2 kg of emissions of CO2-eq per kg of milk. Robertson et al. (2015) measured the GHG emission from the cradle to the farm gate for fat and protein-corrected goat milk and found that the carbon footprint was between 0.84 and 1.03 kg CO2-eq. On the other hand, several previous studies have focused on mitigation strategies such as feeding strategies, benefiting rumen modifiers, and selecting the appropriate animal breed for reducing enteric methane and GHG emissions (Dohme et al., 2000; Bhatta et al., 2009; Patra and Saxena, 2010; Ripoll-Bosch et al., 2013; Nagpal et al., 2015; Vagnoni et al., 2015). However, all previous studies ignored the effects of the management system of the goat farm. In general, goat farms tend to combine the production of milk and meat or live weight with non-edible products such as mohair worldwide. Non-edible products of goats, such as mohair, have an important share in the total GHG emission generated by goat farms. Gerber et al. (2013) highlighted that a substantial share of emissions can be attributed to non-edible products of small ruminants, such as wool, cashmere, and mohair, reducing the share of emissions attributed to milk and meat production (Gerber et al., 2013). Similarly, previous studies focusing on mitigation strategies for reducing GHG emissions in goat farms ignored the typological differences among the goat farms and built mitigation strategies based on the carbon footprint per kg of milk or meat. Measuring the carbon footprint independently per kg of milk and meat rather than focusing on the carbon footprint of goat farms associated with typology caused a bias when designing and implementing mitigation strategies.
The estimation of the environmental impacts of goat farming based on the management typology has rarely been studied. Robertson et al. (2015) assessed the carbon footprint of indoor and outdoor dairy goat farming systems from the cradle to the farm gate. Gutiérrez-Peña et al. (2019) compared the three goat farming systems based on grazing levels when assessing the carbon footprint of dairy goat production in southern Spain. Salcedo et al. (2022) examined the GHG emission for different management aspects. However, the carbon footprint of goat farms associated with the management type and the income sacrifice to switch to green goat farms are still not precise in the literature. The aforementioned gaps in the literature motivated the current research. This study intended to answer the research questions of “Does GHG emissions vary depending on the goat farm management type?” and “What are the goat farm-level income sacrifices to minimize GHG emissions?” To answer these questions, the objectives of this study were 1) to assess the environmental impacts of goat farming associated with management typology in Türkiye and 2) to explore the link between farm-level income sacrifice and the amount of GHG emission reduction.
2 Materials and methods
2.1 Research data
Goat farming is conducted in 3 regions, 5 provinces, and 32 districts of Türkiye. The Mediterranean region, Southeastern Anatolia region, and Central Anatolia region were selected as the study areas due to constituting 68% of the total goat population in Türkiye. The Mediterranean region is characterized by a semi-intensive production system, while the goat farms in the Southeastern Anatolia region mainly have an extensive production system. The Central Anatolia region is characterized by an intensive production system (TSI, 2021). Ankara, Antalya, Diyarbakir, Konya, and Mersin were the top provinces in terms of goat farming. Therefore, the research covered all active goat farms conducting their activities in Ankara, Antalya, Diyarbakir, Konya, and Mersin provinces of Türkiye (Figure 1). The optimum sample size was calculated by using a random sampling procedure based on the sampling criteria of the goat number of the farm, with 95% confidence level and a precision level of 10%. Goat farm-level data were collected from randomly selected 284 goat farms through a well-structured questionnaire. The number of respondents in Ankara, Antalya, Diyarbakir, Konya, and Mersin were 50, 62, 42, 65, and 65, respectively. When deciding which goat farm to conduct a survey with during the field study, random numbers were used among the goat farms in the framework list. Questionnaires were administered to operators of goat farms, considering the production year 2020–2021.
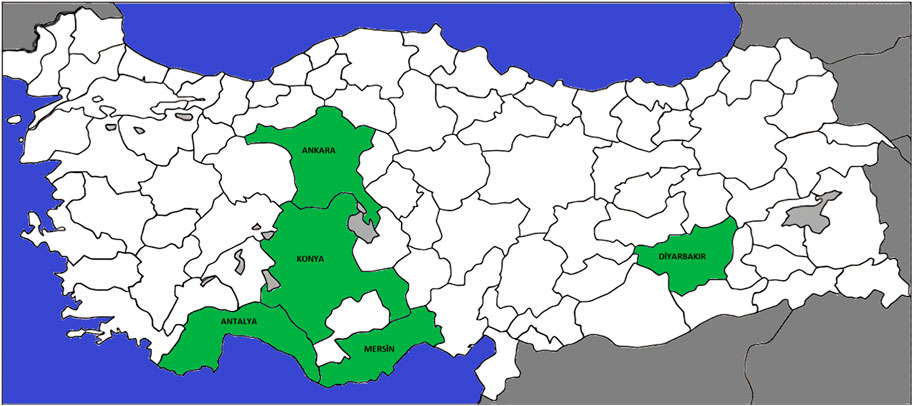
FIGURE 1. Research area.
2.2 Management typologies of goat farms
Management typologies of goat farms characterized by Canan et al. (2022), which is based on the site-specific classification method considering the characteristics of 284 goat farms, were adopted in this study, when examining the link between the goat farm typology and sustainability. Thirty-one validated final indicators were used in the four distinct groups, namely, productive, socio-economic, flock management, and self-sufficiency. Six different goat farm management typologies were considered in this study (Table 1). Here, 17% of the sample goat farms were members of type 1, which was called extensive traditional replacement farms with low input. Replacement breeding was the main activity of these types of goat farms characterized by a large flock size, on average 343 animals, low family labor, and the highest use of labor per animal unit. In this cluster, 10% of the goat farms raised goats for milk purposes. The second goat farm typology was semi-intensive multi-purpose farms with the lowest livestock income ratio and large land that generate their income from the sale of meat, milk, and livestock. Nearly 6% of the sample goat farms were assigned to type 2. They generated their income from the sale of meat, milk, and livestock. This cluster has the lowest reproductive efficiency. Type 3 comprised intensive replacement farms with the highest family labor and fertility. Goat farms focused on the dairy with the lowest amount of labor per animal unit (type 4) were the most common typology in Türkiye. Approximately 33% of the sample goat farms fell into this typology group. Sample goat farms included in type 5 were goat farms focused on mohair production with replacement breeding, and they constituted 32% of sample goat farms. Type 6 was named semi-intensive replacement farms with the smallest flock size, with no land allocated to other activities, and 4% of sample goat farms were included in this group.
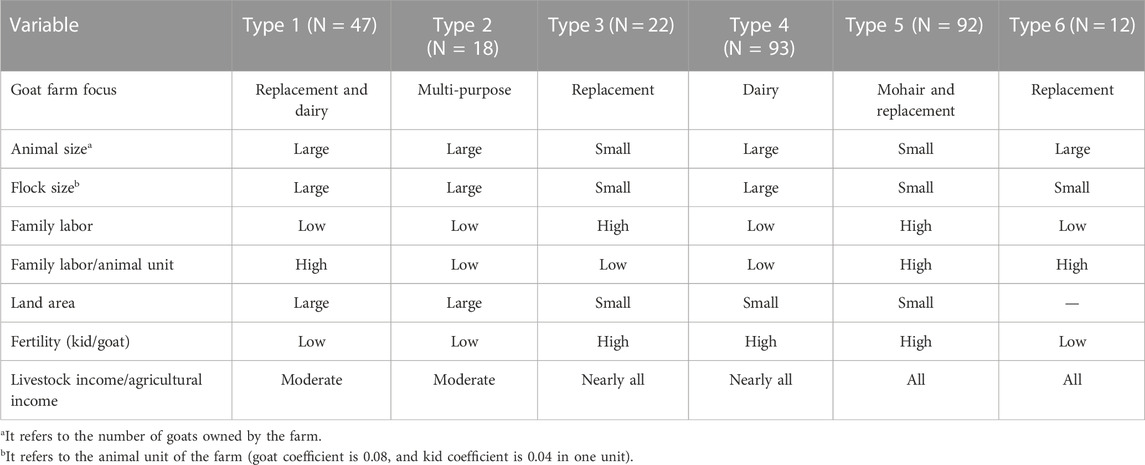
TABLE 1. Management typologies of goat farms.
2.3 Assessing the environmental impacts of goat farms
Environmental impacts of goat farming associated with the management typology were examined by using LCA due to the study comparing the carbon emission of different goat products such as milk, meat, and mohair throughout the life cycle and attributed to goat farm-level carbon emissions. The LCA is a quantitative analysis method that encompasses all pertinent processes across the complete life cycle of a product or production process, as outlined by Heijungs et al. (1992), FAO (2011), and the European Environmental Agency (2015). This methodology establishes a standardized framework for assessing the environmental impact of production processes. Some previous studies examined the environmental impacts of the production of edible and non-edible products of small ruminants (Weiler et al., 2014; Cabral et al., 2020; Mancilla-Leyton et al., 2021). LCA was performed by following the stages of goal and scope definition, inventory analysis, impact analysis, and interpretation. Based on the guidelines and prerequisites outlined by IPCC (2006), this study utilized the LCA approach with a specific focus on small ruminant farms. The functional unit of milk, meat, mohair, and replacement was liter, kg, kg, and animal unit, respectively. Additional farm-level data for defining the goat farming activities (energy consumption, bedding material, productivity and replacement rates, etc.) collected from typical dairy goat farms were used to create a model. The configuration of processes and the scope of the analysis are shown in Figure 2, with the system boundary delineated from the cradle to the farm gate.
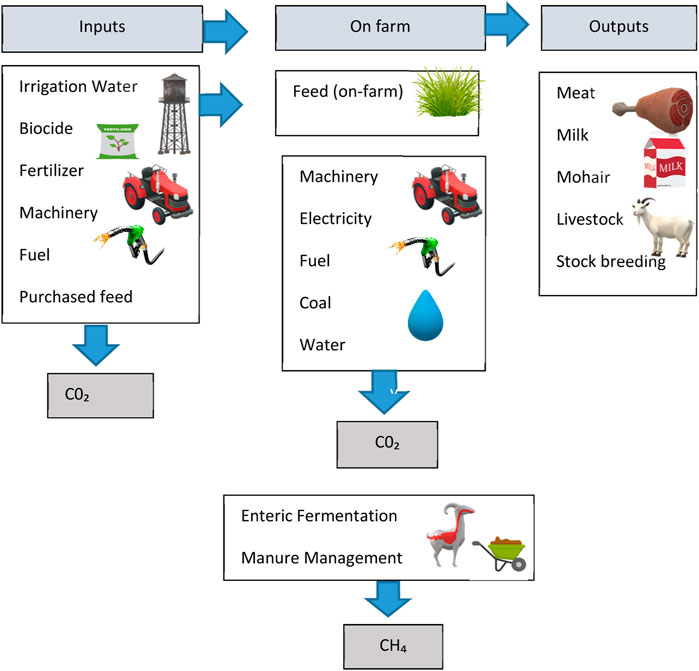
FIGURE 2. System boundaries of the goat farming systems in LCA analysis.
There are two important sources of methane generation from goat farming, one being enteric fermentation during digestion and the other being the management of manure as a result of digestion. Tier 1-level analysis was performed to calculate the carbon footprint of manure management and enteric fermentation (IPCC, 2006). Methane emissions (Gg CH4/year) were calculated as follows:
where EFT is the emission factor (kg CH4 per head/year), NT is the number of heads of livestock species/category T in the country, and T is the species/category of livestock.
The emission factor was used in the measurement of carbon footprint generated from manure management. The methane emission factor reported for goats by IPCC (2006) was adopted (Table 2). The carbon emission factor generated from enteric fermentation of goats was 5 kg CH4/year per head. The equivalence factor was 25 for the conversion of GHG emission calculated as CH4 into CO2.
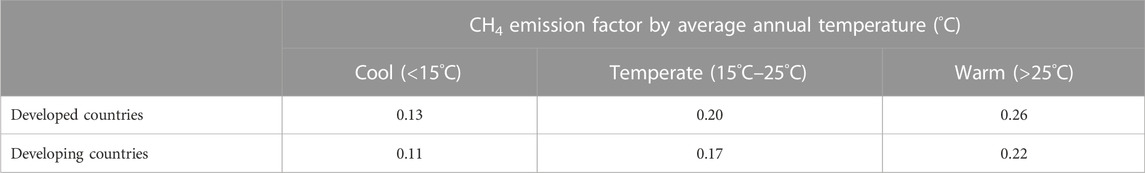
TABLE 2. Manure management methane emission factors for goats associated with temperature.
Emissions generated from water, electricity, coal, fuel, chemicals, and machinery production used in activities such as fertilization, spraying, soil preparation, harvesting, transportation, and irrigation in the feed production process were included in the environmental impact analysis (Table 3). Whether it is produced on goat farms or purchased outside the farm, GHG sourced from feed use was calculated for all goat farms using the corresponding coefficient. In addition, input use in the production stage was included. Emissions generated from water, electricity, coal, fuel, chemicals, and machinery production used in activities such as heating, ventilation, lighting, irrigation, manure plowing, and transportation used in the livestock process were also calculated.
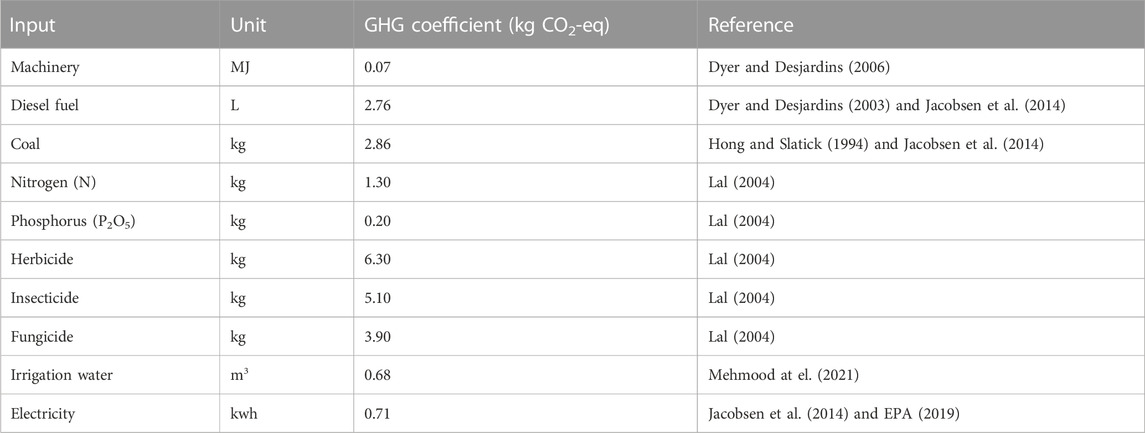
TABLE 3. Emission factor coefficients used in the study.
The total GHG emissions were calculated for the whole goat farm, and then, the GHG emissions falling into the product type such as meat, milk, and mohair were distributed based on their share in the total production value. The GHG emissions per product type were divided by the total production amount, and the GHG emissions per production unit were calculated.
2.4 Exploring the link between farm-level income sacrifice and GHG emission reduction
The assessed GHG emission associated with the typology and goat farm income calculated based on the results of economic analysis were used when exploring the link between farm-level income sacrifice and GHG reduction. Since the only way to attribute the income sacrifice to reduce carbon emission is setting the ceteris paribus conditions among goat farms, we prefer to determine the socio-economically similar goat farms before comparing them. Before calculating the farm-level income sacrifice per kilogram of GHG reduction, similar goat farms in different typologies were determined by using cluster analysis in order to create ceteris paribus conditions. Then, the GHG difference among goat farms was attributed to typologies. The assessed GHG emission associated with the typology and goat farm-level income calculated based on the results of economic analysis were used when exploring the link between farm-level income sacrifice and GHG reduction. Before calculating the farm-level income sacrifice per kilogram of GHG reduction, similar goat farms in different typologies were determined by using cluster analysis in order to create ceteris paribus conditions. The variables of the operator profile, return on asset, and flock size were used in cluster analysis when determining similar goat farms having the same operator profile, return on asset, and flock size except for management typologies. Then, the difference between GHG emissions emitted during goat farming among goat farms was attributed to management typologies. Then, differences between the incomes of the best and selected similar goat farms in terms of GHG emission were divided by the amount of corresponding GHG emission reduction by switching to an environmentally friendly management typology to calculate farm-level income sacrifice per kilogram of GHG reduction. Goat farms having the least GHG emission in a year during goat farming among similar goat farms defined the environmentally friendly management typology.
3 Results and discussion
3.1 Farm attributes
Based on the research results, the age of operators varied across typologies. The operators of goat farms in type 2 were the oldest, followed by the operators of goat farms in type 6. The operators of goat farms included in type 4 were the youngest. The operators in type 2 had more goat farming experience than others, indicating that the operators of semi-intensive multi-purpose and semi-intensive replacement goat farms had more goat farming experience. Regarding the education level of goat farm operators, farm operators of goat farms included in type 2 had the highest education level, while that of operators in type 5 was the lowest. Goat farms included in type 3 required the highest average family labor due to the presence of labor-intensive practices. On contrary, goat farms in types 1 and 2 required lower family labor, and it depends on their extensive traditional and semi-intensive nature (Table 4).
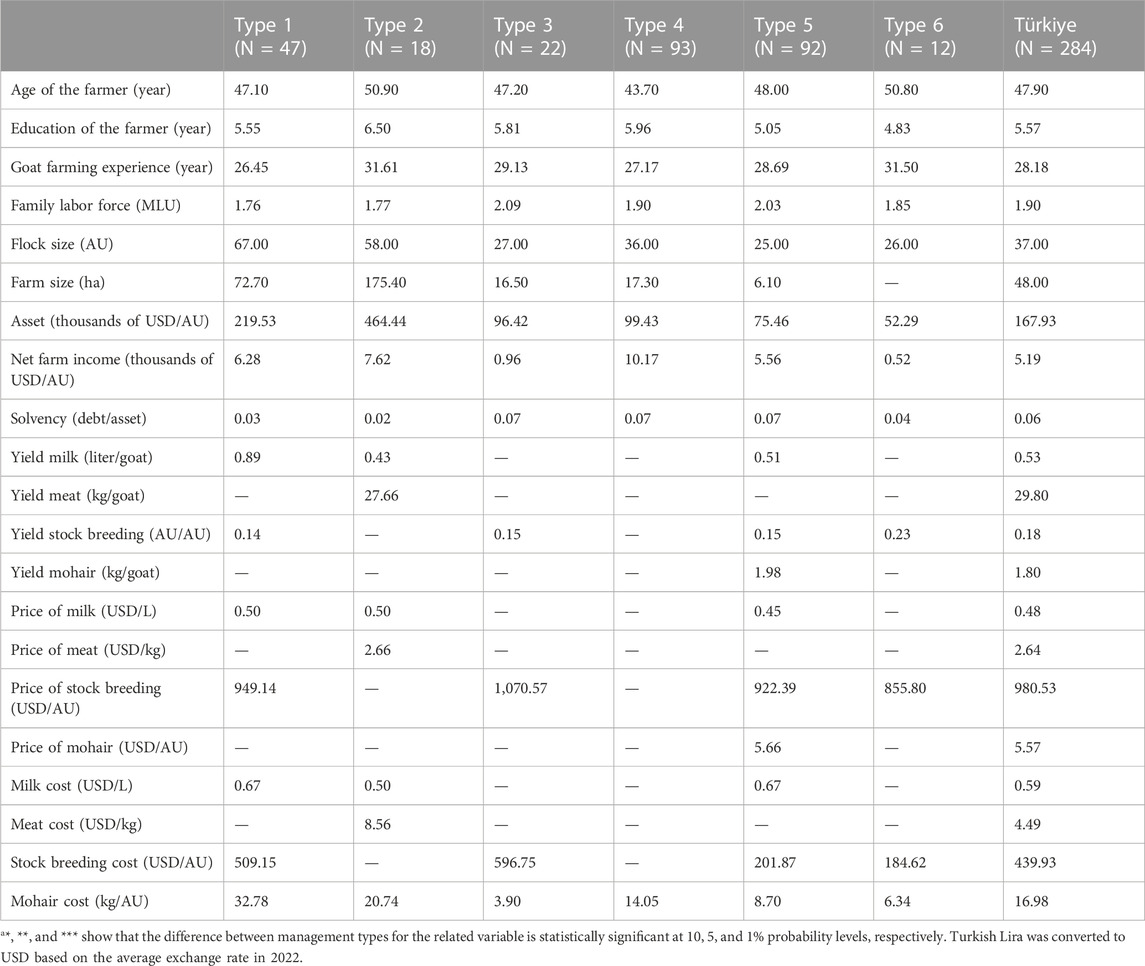
TABLE 4. Socioeconomic characteristics of goat farms according to typologiesa.
Goat farms in types 1 and 4 had the largest flock size among the typologies, while that of goat farms in type 3 was the smallest. It can be tied with the intensive replacement focus of these farms. Goat farms in type 2 had the largest farmland size due to their semi-intensive and multi-purpose nature. Interestingly, goat farms in type 6 had no farmland. Regarding the income and financial performance of goat farms, it was clear based on the research results that goat farms in types 4 and 5 had the highest return on asset, while those of types 6 and 3 were the lowest. Although goat farms in type 2 had the highest average asset value per head, they ranked 3rd among the typologies in terms of profitability. The level of debt of sample goat farms was very low (Table 4).
3.2 Goat farm-level GHG emissions by management type
The research results showed that goat farms in type 1 emitted the highest GHG emission in a year, while that of goat farms in type 5 was the lowest. Concentrated feed crops contributed significantly to overall GHG emissions in all typologies. The contribution of machinery, electricity, and water to GHG emissions was relatively low. Fuel consumption contributed notably to GHG emissions, especially in goat farms in types 1, 3, and 4, while coal consumption was a significant contributor to GHG emissions, especially types 1, 2, and 6. Enteric fermentation and manure management had very low emissions across all typologies (Table 5).
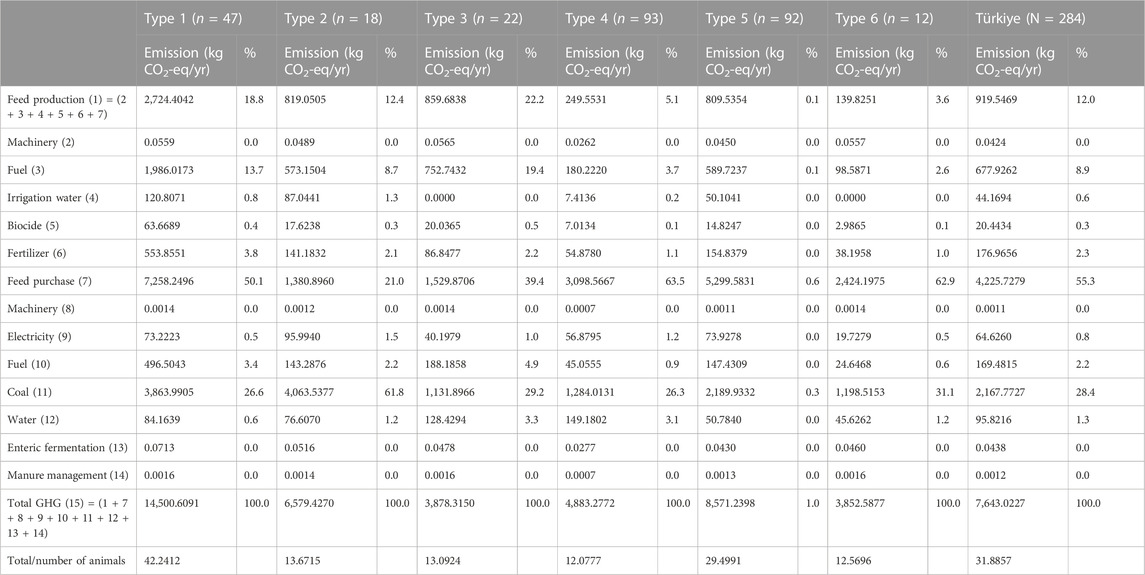
TABLE 5. Distribution of the carbon footprint in goat farms by management types.
Goat farms in type 1 emitted the highest total GHG emissions due to the use of machinery and coal, and having larger flock sizes led to higher feed consumption and waste production. Goat farms in type 2 ranked 3rd in terms of the total GHG emission, and feed production/purchase was the major contributor to GHG emission. Conducting their activities on a large farmland increased the GHG emission due to maintenance and operations, and having a lower reproductive efficiency led to a larger flock size, resulting in high GHG emissions in goat farms included in type 2. Goat farms in type 3, which is focused on replacement breeding with the highest family labor, had a total GHG emission of 3,878.31 kg CO2-eq in a year, and feed production, machinery, and coal consumption were notable contributors to GHG emission. Intensive farming practices and a large amount of input use were the other contributors. Goat farms in type 4 emitted a total GHG emission of 4,883.27 kg CO2-eq in a year, and feed production, feed purchase, machinery, and coal consumption were significant GHG emission contributors. Goat farms in type 5, in which mohair production was the main focus, together with replacement breeding, emitted a total GHG emission of 8,571.23 kg CO2-eq in a year. Feed production, feed purchase, and machinery were the main contributors to GHG emission. The total GHG emission of goat farms in type 6, which had the smallest flock size and no farmland, was 3,852.58 kg CO2-eq in a year. Feed production, feed purchase, and coal consumption were significant contributors to GHG emission in this group of goat farms.
Feed production and feed purchase consistently contributed to a substantial portion of emissions across all typologies. The importance of machinery, fuel, and coal consumption varied among different typologies. Overall, differences in emissions across the typologies were attributed to factors such as flock size, flock composition, breeding practices, land availability, feed production, labor intensity, and management approaches. Each management typology’s specific activities, resource utilization, and management practices played a crucial role in determining their carbon footprints.
The amount of GHG emission varied according to goat product types such as goat meat, milk, and mohair. The GHG emission per kg goat meat was higher than that of goat milk and mohair. Turkish goat farms emitted GHG emissions for the production of per kg of meat, milk, and mohair by 9.85 kg CO2-eq, 8 kg CO2-eq, and 0.28 kg CO2-eq, respectively (Figure 3).
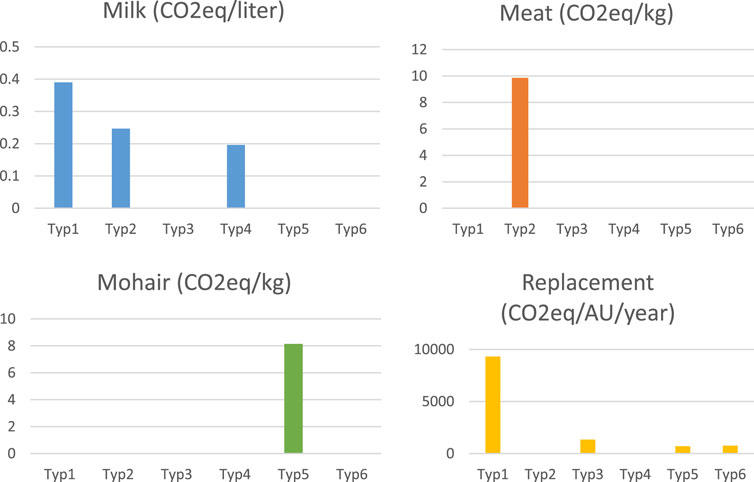
FIGURE 3. Farm-level GHG emission by management typology.
Goat farms in type 1 had higher GHG emissions by 1 kg of milk production than goat farms in types 2 and 4 (p < 0.05). The characteristics of goat farms such as the production methods, flock sizes, feed sources, and specific management practices caused the differences in GHG emissions per liter of milk production associated with the management type. It can be said that the reason for having high GHG emissions in goat farms included in type 1 was the extensive and traditional nature of goat farms, adopting production methods having a low level of efficiency and having larger flock sizes. The semi-intensive and multi-purpose nature of goat farms in type 2 resulted in more controlled resource utilization compared to extensive systems, contributing to moderate emissions. Dairy goat farms in type 4 had a smaller GHG emission for 1 kg of milk production due to benefiting partially from pasture and efficient resource use (Figure 3).
Regarding the GHG emission of replacement breeding, goat farms in type 1 had the highest GHG emissions due to the largest flock size and more resource use. Goat farms in type 5, which are focused on replacement breeding for mohair production, emitted the lowest amount of GHG emission for replacement breeding in a year. The characteristics of goat farms such as flock size, breeding practices, family labor, and management intensity affected the GHG emission differences among management types (Figure 3).
Previous research focusing on livestock underlined that feed production consistently emerged as a major contributor to GHG emissions, aligning with the resource-intensive nature of livestock feed cultivation, harvesting, and transportation (Steinfeld et al., 2006; Sintori et al., 2013). It was also emphasized that emissions can vary substantially due to factors such as the geographical location, breed, management practices, and the nature of livestock systems. This study examined the GHG emissions associated with different typologies of goat farming. The research results showed that larger flock sizes, specific breeding practices, and labor intensity have notable impacts on emissions. These findings aligned with findings of other studies. Sowunmi et al. (2015) in the UAE stated that larger flock sizes, specific breeding practices, and labor intensity affected the GHG emission. They also emphasized the variability of GHG emissions based on the geographical location and livestock population. Furthermore, Marino et al. (2015) highlighted the interconnected nature of GHG emissions and climate change impacts on small ruminant production. They emphasized the need for both mitigation and adaptation strategies to ensure the sustainability of the sector. Similarly, Salcedo et al. (2022) explored strategies for reducing emissions per hectare and per unit of product, illustrating the potential benefits of feed replacement and other management practices. This study also collectively acknowledged the role of specific factors in emissions, such as feedstuff composition, manure management, and the nature of the livestock system. Lesschen et al. (2011) indicated that emissions can vary based on the intensity of the livestock system, with intensive systems potentially having lower emissions per unit of product due to increased productivity. In conclusion, these studies collectively provided a nuanced understanding of the intricate relationship among small ruminant production, emissions, and climate change. They emphasized the need for region-specific strategies that consider factors such as management practices, feed production, and the unique characteristics of livestock systems.
Based on the research results, typical Turkish goat farms gained agricultural income by 2.47 USD per kg of GHG emission. The amount of agricultural income gained per kg GHG emission varied according to typology (p < 0.05). Goat farms in type 4 had the maximum agricultural income per kg of GHG emission, while that of goat farms in type 1 was the minimum. Analyzing the relationship between GHG emission and the income stability of goat farms showed that goat farms in type 3 had the minimum income stability with smaller GHG emission. Typical Turkish goat farms emitted 0.49 kg CO2-eq for per USD of agricultural production expenses. GHG emission for per USD of agricultural production expenses varied according to management typologies (p < 0.05). Goat farms in type 1 emitted the highest GHG compared to others, while that of goat farms in type 2 was the lowest. By knowing the GHG emissions per unit of production expenses, farmers can identify the most cost-effective strategies for emission reduction. This information empowers farmers to invest in practices that provide the highest emission reduction for their budget. For instance, if upgrading machinery has a lower emissions-to-expense ratio than that of changing feed sources, it becomes a priority. It highlights where resources should be allocated for the maximum environmental impact. Farmers can strategically allocate budgets for emission reduction efforts. For example, if feed production is a major contributor to emissions and represents a significant expense, funds can be allocated toward sustainable feed sourcing or on-site production. It establishes a baseline for emissions against which future progress can be measured. Using these data, farmers can set realistic emission reduction targets. They can track improvements over time and adjust strategies as needed. It also allows for meaningful comparison with industry benchmarks. Understanding the emissions-to-expense ratio provides a solid foundation for advocating policy changes and demonstrating compliance with environmental regulations. Using these data, farmers can engage with policymakers to advocate for supportive policies, subsidies, or incentives for sustainable practices. It also helps in demonstrating adherence to environmental regulations.
The research results also showed that goat farms in type 3 had the highest income sacrifice per kg GHG emission reduction to reach the level of goat farms having minimum GHG emission in a year, while that of goat farms in type 1 was minimum. Typical Turkish goat farms faced with an income sacrifice of 2.85 USD per kg GHG emission reduction to reach the level of environmentally friendly goat farms having minimum GHG emission in a year (Table 6). The Turkish government implements different support programs to reduce carbon emissions in small ruminant farming (protection of genetic resources, waste management, etc.), and although it varies according to the characteristics of the farm, it pays support payments by approximately 0.15 USD per kilogram of live weight for reducing carbon emission. It was clear that the government support was not satisfactory for switching to environmentally friendly goat farms. Similar findings were reported for many policy implications worldwide. Tsiouni et al. (2021) stated that goat farms in Greece were not profitable and could not survive without government subsidies. They suggested that agricultural policies could be leveraged to improve environmental outcomes. Preferring short-term profits instead of long-term profits by goat farms negatively affects carbon reduction efforts at the farm level.
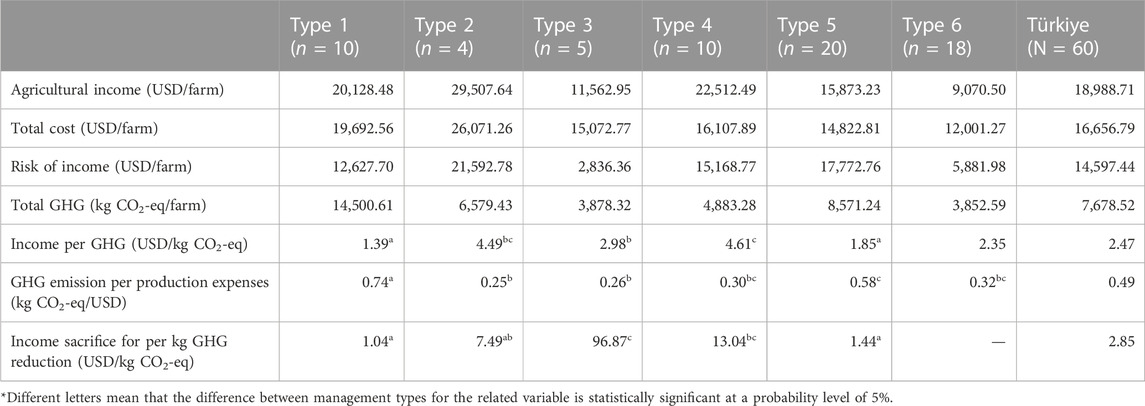
TABLE 6. Income per GHG and income sacrifice per kg GHG emission reduction by management typologies.
Goat farms in type 1 had the largest flock size, and their water usage was higher than that in other typologies, especially for drinking and sanitation water. These farms required more land for grazing due to the extensive nature of their operations. Depending on the region and management practices, extensive farms caused varying impacts on the local biodiversity. For instance, large-scale grazing impacted local flora and fauna.
Water usage was relatively lower in farms assigned in type 2 as these farms had more controlled and efficient water management practices. These farms had larger land areas, potentially influencing local land use patterns. However, they also implement more sustainable land management practices. The impact on the biodiversity was moderate, with potential variations based on specific management strategies.
Goat farms in type 3 had relatively higher water requirements due to their intensive nature, especially for dairy operations. They required less land for grazing but more land for infrastructure and feed production. The impact on biodiversity varies depending on factors like land use practices and presence of natural habitats.
Water usage of dairy-focused goat farms with low labor intensity (type 4) was moderate in terms of water use as dairy farms typically require consistent water supply for hygiene and milking processes. These farms allocated a land for infrastructure and some grazing but did not have extensive land requirements. The impact was relatively lower than that of extensive farms as they did not require large expanses of land.
Water usage was moderate in mohair production farms with replacement breeding (Type 5), depending on factors like herd size and farm practices. These farms required specific types of vegetation for mohair production, potentially influencing local flora composition. The impact on biodiversity was influenced by the choice of vegetation and land management practices.
Goat farms in type 6 had lower water requirements due to their smaller flock size. They did not allocate land for extensive grazing, potentially reducing their land use impact. The impact on biodiversity was lower due to the smaller scale and potentially less disturbance to natural habitats.
4 Conclusion
In this study, the environmental impacts of goat farming associated with the management type in Türkiye were assessed, and the link between farm-level income sacrifice and the amount of GHG reduction was explored. The environmental impact and farm-level income sacrifice per kg GHG emission reduction to reach the level of environmentally friendly goat farms varied according to the management type of goat farms. Switching from a conventional management type to environmentally friendly management type goat farms may reduce the environmental impact of goat farming. Facilitating the accessibility of financial resources may enhance the switching process through benefiting investments in infrastructure, equipment, and research and development. Well-designed government regulations and subsidies may accelerate the transition process in goat farms. To date, several studies have focused on the effect of government regulations and subsidies. Some studies explored the positive effect of government regulations and subsidies to switch green production technology and systems (Chan et al., 2015; Joo et al., 2018; Peng et al., 2023). However, some previous studies reported the negative effects of government regulations and subsidies (Krass et al., 2013; Hafezi and Zolfagharinia, 2018; Ghosh et al., 2020). Government regulations and subsidies may lead to obstacles in production and innovation development and an increase in the product price for the end user. For this reason, special attention should be paid so that the policies to be developed to create environmentally friendly goat farms do not negate product and innovation development and do not cause an unacceptable increase in prices. In addition, providing guidance for switching conventional goat farms may increase the effectiveness of the national-level policy measure-related environmental side of goat farming. On the other hand, creating resource-efficient and environmentally friendly goat farms by subsidizing the goat farms may decrease GHG emissions. Training and extension activities may contribute to decreasing GHG emission of goat farming. Awareness activities on opportunities for GHG emission reduction in goat farms may also positively affect the efficiency of actions for GHG emission reduction in goat farming.
Future research in the goat industry could focus on incorporating all parameters along the supply chains in environmental impact analysis for better understanding the GHG emissions along the goat product such as meat, milk, and mohair supply chains. In addition, exploring economic feasibility of switching to environmentally friendly goat farms may offer alternative research possibilities.
Data availability statement
The raw data supporting the conclusion of this article will be made available by the authors, without undue reservation.
Ethics statement
The studies involving humans were approved by the Social and Humans Ethics Committee of Ondokuzmayıs University. The studies were conducted in accordance with the local legislation and institutional requirements. The participants provided their written informed consent to participate in this study.
Author contributions
SC: conceptualization, data curation, formal analysis, investigation, methodology, project administration, validation, visualization, and writing–original draft.
Funding
The authors declare financial support was received for the research of this article. This work was supported by the Scientific and Technological Research Council of Turkey.
Conflict of interest
The author declares that the research was conducted in the absence of any commercial or financial relationships that could be construed as a potential conflict of interest.
Publisher’s note
All claims expressed in this article are solely those of the authors and do not necessarily represent those of their affiliated organizations, or those of the publisher, the editors, and the reviewers. Any product that may be evaluated in this article, or claim that may be made by its manufacturer, is not guaranteed or endorsed by the publisher.
References
Abbas, A., Waseem, M., Ahmad, R., khan, K. A., Zhao, C., and Zhu, J. (2022a). Sensitivity analysis of greenhouse gas emissions at farm level: case study of grain and cash crops. Environ. Sci. Pollut. Res. 29, 82559–82573. doi:10.1007/s11356-022-21560-9
Abbas, A., Zhao, C., Waseem, M., and Ahmad, R. (2022b). Analysis of energy input–output of farms and assessment of greenhouse gas emissions: a case study of cotton growers. Front. Environ. Sci. 9, 826838. doi:10.3389/fenvs.2021.826838
Bhatta, R., Uyeno, Y., Tajima, K., Takenaka, A., Yabumoto, Y., Nonaka, I., et al. (2009). Difference in the nature of tannins on in vitro ruminal methane and volatile fatty acid production and on methanogenic archaea and protozoal populations. J. Dairy Sci. 92 (11), 5512–5522. doi:10.3168/jds.2008-1441
Cabral, C. F. S., Veiga, L. B. V., Araújo, M. G., and Quiterio de Souza, S. L. (2020). Environmental Life Cycle Assessment of goat cheese production in Brazil: a path towards sustainability. LWT 129, 109550. doi:10.1016/j.lwt.2020.109550
Canan, S., Ocak Yetişgin, S., Bayav, A., Arısoy, H., and Kaya, T. (2022). Determination of typology of farms of small ruminant and the effect of typology on production efficiency of farms. Ankara: Nobel Scientific Works Publishing House Publication.
Cerri, C. C., Moreira, C. S., Alves, P. A., Raucci, G. S., de Almeida Castigioni, B., Mello, F. F., et al. (2016). Assessing the carbon footprint of beef cattle in Brazil: a case study with 22 farms in the State of Mato Grosso. J. Clean. Prod. 112, 2593–2600. doi:10.1016/j.jclepro.2015.10.072
Chan, H. K., Yee, R. W., Dai, J., and Lim, M. K. (2015). The moderating effect of environmental dynamism on green product innovation and performance. Int. J. Prod. Econ. 181, 384–391. doi:10.1016/j.ijpe.2015.12.006
Dohme, F., Machmüller, A., Wasserfallen, A., and Kreuzer, M. (2000). Comparative efficiency of various fats rich in medium-chain fatty acids to suppress ruminal methanogenesis as measured with RUSITEC. Can. J. Anim. Sci. 80, 473–484. doi:10.4141/a99-113
Dyer, J. A., and Desjardins, R. L. (2003). The impact of farm machinery management on the greenhouse gas emissions from Canadian agriculture. J. Sustain. Agric. 22, 59–74. doi:10.1300/J064v22n03_07
Dyer, J. A., and Desjardins, R. L. (2006). Carbon dioxide emissions associated with the manufacturing of tractors and farm machinery in Canada. Biosyst. Eng. 93, 107–118. doi:10.1016/j.biosystemseng.2005.09.011
Elahi, E., Khalid, Z., Tauni, M. Z., Zhang, H., and Lirong, X. (2022b). Extreme weather events risk to crop-production and the adaptation of innovative management strategies to mitigate the risk: a retrospective survey of rural Punjab, Pakistan. Technovation 117, 102255. doi:10.1016/j.technovation.2021.102255
Elahi, E., Khalid, Z., and Zhang, Z. (2022a). Understanding farmers’ intention and willingness to install renewable energy technology: a solution to reduce the environmental emissions of agriculture. Appl. Energy 309, 118459. doi:10.1016/j.apenergy.2021.118459
EPA (Environmental Protection Agency) (2019). Ireland’s greenhouse gas emissions projections. Ireland: Johnstown Castle.
FAO (2011). The state of the world’s fisheries and aquaculture. Rome, Italy. SOFIA 2010: Food and Agricultural Organization.
Gerber, P. J., Steinfeld, H., Henderson, B., Mottet, A., Opio, C., Dijkman, J., et al. (2013). Tackling climate change through livestock—a global assessment of emissions and mitigation opportunities. Rome: FAO.
Ghosh, D., Shah, J., and Swami, S. (2020). Product greening and pricing strategies of firms under green sensitive consumer demand and environmental regulations. Ann. Operations Res. 290, 491–520. doi:10.1007/s10479-018-2903-2
Godde, C. M., Boone, R. B., Ash, A. J., Waha, K., Sloat, L. L., Thornton, P. K., et al. (2020). Global rangeland production systems and livelihoods at threat under climate change and variability. Environ. Res. Lett. 15 (4), 044021. doi:10.1088/1748-9326/ab7395
Gutiérrez-Peña, R., Mena, Y., Batalla, I., and Mancilla-Leytón, J. M. (2019). Carbon footprint of dairy goat production systems: a comparison of three contrasting grazing levels in the Sierra de Grazalema Natural Park (Southern Spain). J. Environ. Manag. 232, 993–998. doi:10.1016/j.jenvman.2018.12.005
Hafezi, M., and Zolfagharinia, H. (2018). Green product development and environmental performance: investigating the role of government regulations. Int. J. Prod. Econ. 204, 395–410. doi:10.1016/j.ijpe.2018.08.012
Hamzaoui, S., Salama, A. A. K., Caja, G., Albanell, E., Flores, C., and Such, X. (2012). “Milk production losses in early lactating dairy goats under heat stress,” in ADSAAMPA-ASA-CSAS-WSASAS joint annual meeting (Phoenix, Arizona. July 15–19.
Heijungs, R., Guin´ee, J. B., Huppes, G., Lankreijer, R. M., Udo de Haes, H. A., Wegener Sleeswijk, A., et al. (1992). Environmental life cycle assessment of products: guide and backgrounds. (part 1).
Hong, B. D., and Slatick, E. R. (1994). Carbon dioxide emission factors for coal. Quarterly coal report.
Ibidhi, R., and Calsamiglia, S. (2020). Carbon footprint assessment of Spanish dairy cattle farms: effectiveness of dietary and farm management practices as a mitigation strategy. Animals 10 (11), 2083. doi:10.3390/ani10112083
Jacobsen, R., Vandermeulen, V., Vanhuylenbroeck, G., and Gellynck, X. (2014). A life cycle assessment application: the carbon footprint of beef in Flanders (Belgium). Assess. Carbon Footpr. Differ. Industrial Sect. 2, 31–52. doi:10.1007/978-981-4585-75-0_2
Joo, H. Y., Seo, Y. W., and Min, H. (2018). Examining the effects of government intervention on the firm’s environmental and technological innovation capabilities and export performance. Int. J. Prod. Res. 56 (18), 6090–6111. doi:10.1080/00207543.2018.1430902
Krass, D., Nedorezov, T., and &Ovchinnikov, A. (2013). Environmental taxes and the choice of green technology. Prod. operations Manag. 22 (5), 1035–1055. doi:10.1111/poms.12023
Lal, R. (2004). Soil carbon sequestration to mitigate climate change. Geoderma 123, 1–22. doi:10.1016/j.geoderma.2004.01.032
Lesschen, J. P., Velthof, G. L., de Vries, W., and Kros, J. (2011). Differentiation of nitrous oxide emission factors for agricultural soils. Environ. Pollut. 159 (11), 3215–3222. doi:10.1016/j.envpol.2011.04.001
Mancilla-Leytón, J. M., Morales Jerrett, E., Delgado-Pertiñez, M., and Mena, Y. (2021). Fat- and protein-corrected milk formulation to be used in the life-cycle assessment of Mediterranean dairy goat systems. Livest. Sci. 253, 104697. doi:10.1016/j.livsci.2021.104697
Marino, R., Albenzio, M., Caroprese, M., Santillo, A., Sevi, A., and Fedele, V. (2015). Greenhouse gas emissions by goat production systems. Animals 5 (3), 518–526.
Mehmood, F., Wang, G., Gao, Y., Liang, Y., Zain, M., Rahman, S. U., et al. (2021). Impacts of irrigation managements on soil CO2 emission and soil CH4 uptake of winter wheat field in the North China plain. Water (Basel) 13, 2052. doi:10.3390/w13152052
Nagpal, R., Shrivastava, B., Kumar, N., Dhewa, T., and Sahay, H. (2015). “Microbial feed additives,” in Rumen microbiology: from evolution to revolution. Editors A. K. Puniya, R. Singh, and D. N. Kamra (India: Springer), 161–175.
Opio, C., Gerber, P., Mottet, A., Falcucci, A., Tempio, G., MacLeod, M., et al. (2013). Greenhouse gas emissions from ruminant supply chains—a global life cycle assessment. Rome: FAO.
Patra, A. K., and Saxena, J. (2010). A new perspective on the use of plant secondary metabolites to inhibit methanogenesis in the rumen. Phytochemistry 71, 1198–1222. doi:10.1016/j.phytochem.2010.05.010
Peng, H., Lu, Y., and Gupta, S. (2023). Promoting value emergence through digital platform ecosystems: perspectives on resource integration in China. Technol. Forecast. Soc. Change 189, 122338. doi:10.1016/j.techfore.2023.122338
Ripoll-Bosch, R., de Boern, I. J. M., Bernués, A., and Vellinga, T. V. (2013). Accounting for multi-functionality of sheep farming in the carbon footprint of lamb: a comparison of three contrasting Mediterranean systems. Agric. Syst. 116, 60–68. doi:10.1016/j.agsy.2012.11.002
Robertson, K., Symes, W., and Garnham, M. (2015). Carbon footprint of dairy goat milk production in New Zealand. J. Dairy Sci. 98 (7), 4279–4293. doi:10.3168/jds.2014-9104
Salama, A. A. K., Caja, G., Hamzaoui, S., Badaoui, B., Castro-Costa, A., Fac¸ Anha, D. A. E., et al. (2014). Different levels of response to heat stress in dairy goats. Small Rum. Res. 121, 73–79. doi:10.1016/j.smallrumres.2013.11.021
Salcedo, J., Mesías, F. J., Blanco, C., Ginés, R., Sánchez-Dávila, F., and Arias, R. (2022). Modelling the environmental impact of small ruminant farms: a case study in Southern Spain. Animals 12 (4), 793. doi:10.3390/ani12060793
Sevi, A., Annicchiarico, G., Albenzio, M., Taibi, L., Muscio, A., and Dell’Aquila, S. (2001). Effects of solar radiation and feeding time on behavior, immune response and production of lactating ewes under high ambient temperature. J. Dairy Sci. 84, 629–640. doi:10.3168/jds.s0022-0302(01)74518-3
Sintori, A. J., Baglieri, A., Ciambrone, L., Cortese, G., Lombardi, P., and Zanasi, R. (2013). Nitrous oxide and methane emissions from animal manure management: a review. Italian J. Animal Sci. 12 (4), e80.
Sowunmi, F. A., Qadir, M. I., and Bichi, M. H. (2015). Carbon emissions from livestock manure in arid regions - technical study on the United Arab Emirates. Environ. Nat. Resour. Res. 5 (3), 82–91. doi:10.5539/enrr.v5n3p1
Steinfeld, H., Gerber, P., Wassenaar, T. D., Castel, V., Rosales, M., Rosales, M., et al. (2006). Livestock’s long shadow: environmental issues and options. Rome, Italy: Food & Agriculture Org.
TSI (2021). Turkish statical institute, statistics of animals. Available at: https://biruni.tuik.gov.tr/medas/?kn=101&locale=tr (Accessed March 15, 2021).
Tsiouni, M., Aggelopoulos, S., Pavloudi, A., and Siggia, D. (2021). Economic and financial sustainability dependency on subsidies: the case of goat farms in Greece. Sustainability 13 (13), 7441. doi:10.3390/su13137441
Türkten, H., Yıldırım, Ç., and Boz, İ. (2023). Factors influencing the adoption of pressurized irrigation systems in hazelnut production and its effect on the water footprint in the çarşamba district of samsun. Erwerbs-Obstbau 65, 775–783. doi:10.1007/s10341-022-00754-y
Vagnoni, E., Franca, A., Breedveld, L., Porqueddu, C., Ferrara, R., and Duce, P. (2015). Environmental performances of Sardinian dairy sheep production systems at different input levels. Sci. Total Environ. 502, 354–361. doi:10.1016/j.scitotenv.2014.09.020
Keywords: goat farming, management typology, life cycle assessment, greenhouse gas emission, income sacrifice
Citation: Canan S (2023) Reducing carbon emission in the goat farms by switching from conventional goat farming to green goat farm typology. Front. Environ. Sci. 11:1289635. doi: 10.3389/fenvs.2023.1289635
Received: 06 September 2023; Accepted: 13 November 2023;
Published: 29 November 2023.
Edited by:
Rocky J. Dwyer, Walden University, United StatesReviewed by:
Adnan Abbas, Nanjing University of Information Science and Technology, ChinaAbdul Sattar, Bahria University, Pakistan
Shakeel Sajjad, Curtin University, Australia, in collaboration with reviewer AS
Copyright © 2023 Canan. This is an open-access article distributed under the terms of the Creative Commons Attribution License (CC BY). The use, distribution or reproduction in other forums is permitted, provided the original author(s) and the copyright owner(s) are credited and that the original publication in this journal is cited, in accordance with accepted academic practice. No use, distribution or reproduction is permitted which does not comply with these terms.
*Correspondence: Selime Canan, selime.canan@omu.edu.tr