Digital research on the resilience control of water ecological space under the concept of urban-water coupling
 Hua Yang
 Qimeng Ning
 Hui Zhou1
  Qianfu Ji
- 1Hunan Provincial Territorial Space Survey and Monitoring Institute, Changsha, China
- 2College of Architecture and Urban Planning, Hunan City University, Yiyang, China
Introduction: The construction of digital governance of national land space depends greatly on the development of a digital model for robust control of water and ecological space. However, how changes to the urban-water coupling relationships affect the resilience control of water ecological space is rarely reported.
Methods: The evolution characteristics of urban and water space in the study area from 2000 to 2020 and the correlation between them are analyzed based on the grid analysis using InVEST and Moran’I methods. Based on the theory of human-environment interaction territorial system to provide a theoretical framework to explain the urban and water space. We used digital to construct an resilience control framework in the Dongting Lake area based on the correlation between the urban and water space.
Results: The results show that: 1) From 2000 to 2020, the geographical evolution of towns and cities in the research area displayed obvious spatial variation in intensity, indicating a process of expansion and change. The regional and temporal fluctuations of the water conservation function are significant. The mountainous areas in the east, south, and northwest are where the high values of the water conservation function are primarily found. These regions have more vegetation, which increases the water conservation function. 2) According to the results of local binary spatial autocorrelation analysis, it can be seen that from 2000 to 2020, the high-high agglomeration of town space and water-related is mainly distributed in Linxiang City, Yueyang County, Miluo City, Li County, and Yiyang City, and the low-low agglomeration is mainly distributed in Dongting Lake, Datong Lake, and along the Yangtze River. 3) Based on how urban spatial evolution affects water ecological space, we construct a theoretical framework of urban-water coupling and establish a digital model of water ecological space resilience control in the Dongting Lake area from four perspectives: threshold, visualization, dynamics, and intelligence.
1 Introduction
Digital governance of land space is an important component of the modernization of the national governance system and governance capacity (Corodescu-Roșca et al., 2023). In May 2019, “Several Opinions of the State Council of the Central Committee of the Communist Party of China on Establishing a Land Space Planning System and Supervising its Implementation” were issued, and land space governance entered a new stage of development. The Proposal of the CPC Central Committee on Formulating the 14th Five-Year Plan for National Economic and Social Development and the 2035 Visionary Goals proposes to realize the digitization, networking and intelligence of the whole process of national land spatial governance and build a new pattern of national land spatial development and protection. Therefore, relying on digital technology to promote the digital transformation of land space governance has become an inevitable choice for the refinement of land space governance under the new situation. Rapid urbanization has caused the destruction of water ecological space, and the government now needs to learn more about its structure and function in order to build a digital model of toughness control that will allow it to assess, monitor, and control changes to water ecological space in an efficient manner (Zeng et al., 2023). This is important for the digital governance of national land space in the Dongting Lake area.
High-urbanization areas in China are generally characterized by more artificial intervention in ecosystems and stronger ecological vulnerability (Zhang et al., 2023). For a long time, the construction of various water conservancy engineering facilities such as river hardening, cut-off and straightening, sluice gates, reservoirs and artificial drainage ditches has changed the connectivity and infiltration capacity of surface water systems, resulting in the reduction of water ecosystem functions (Jaiswal and Pandey, 2021; Wang et al., 2023). Driven by urban expansion, the construction of lake-fenced and reclaimed land has caused a significant reduction in the area of rivers, lakes and wetlands and seriously damaged the circulation system of rivers and wetlands, weakening the ecosystem service role of water ecosystems in storing rain and floods, purifying water bodies, regulating microclimate, controlling soil erosion and beautifying the environment (Paiva et al., 2020; Yao et al., 2021). In the practice of urban spatial planning, how to organize the spatial form, functional layout, road system, open space, infrastructure and other elements of the city to achieve coordination and adaptation with the characteristics of the urban water ecological environment has also been a common concern of planning scholars and local governments in recent years (Huang et al., 2023). Meanwhile, the research on the interaction between urban and water environments shows a development trend from empirical analysis to quantitative and data-based research, and scholars at home and abroad analyze the interaction between urban development and water environments more systematically and completely by combining various computer simulation models such as urban growth models, hydrological models, and ecological models. For example, Maeve McBride and Derek Booth (2005) analyzed the scale sensitivity of the effect of urban construction on water systems and the effect of urban land form through regression models of the physical environmental characteristics of water systems in urban areas and urban construction in watersheds (McBride and Booth, 2005). Bach et al. (2013) simulated the interaction between plot-scale, water-sensitive infrastructure construction (Bhaskar et al., 2016). And Bhaskar et al., 2016 applied the SLEUTH model, which simulates urban spatial growth, and the ParFlow model, which simulates the water circulation system, to study the characteristics of surface vegetation and the water circulation system in Baltimore, United States, as urban spatial growth occurs, and found that urban expansion will lead to a decrease in surface water and that the sensitivity of the water environment varies among different locations. The sensitivity of the water environment varies, and the surface water in some sensitive areas will be more significantly affected by the spatial growth of the town (Bhaskar et al., 2016). Xu Kang et al. (2013) applied a cellular automaton (CA) model and a regional hydrological model (SCS) to simulate the proportion and risk of urban flooding under different urban growth rates, and then guided the delineation of urban growth boundaries (XU et al., 2013). Zhang et al. (2021) used the distributed metacellular automata model (CA) and BP neural network model to construct an urban land use change and water quality response simulation model to simulate regional urban land use change, predict the response relationship of upstream and downstream water quality to urban area pollution discharge, and quantitatively analyze the characteristic law between urban spatial expansion and water environment quality change (Zhang et al., 2021).
There are close interactions and interactions between urban spatial development and water environmental protection, both in terms of constraints and coercion, as well as reciprocal promotion and enhancement (Meng, 2021) (Table 1). Further research is needed on the kind of relationship between urban and water and how to improve the resilience of water ecological space in the process of urban spatial evolution. As an example, this thesis uses the Dongting Lake area to apply the theory of “urban-water coupling concept” and the technical framework of spatio-temporal interaction to identify the urban-water contradiction in the Dongting Lake area, construct a theoretical framework of urban-water coupling, and build a digital model of water-ecological spatial resilience control in the Dongting Lake area from four aspects: threshold, visualization, dynamization, and intelligence. It is investigated how to put the concept of ecological civilization into practice in the field of spatial planning in order to advance the theoretical and methodological framework for the digitalization of territorial spatial governance.
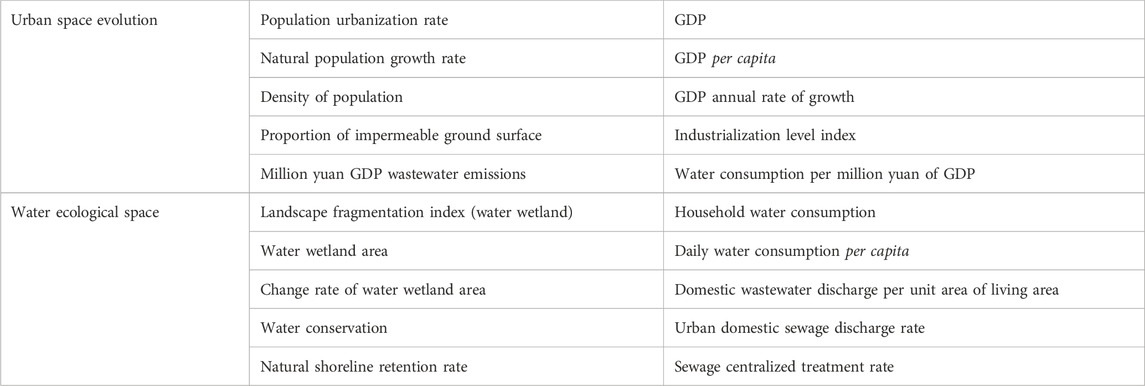
TABLE 1. The core control index system of water ecological space.
2 Study area, methods and data sources
2.1 Study area
Dongting Lake Eco-Economic Zone is located at 28°30′N-29°40′N, 113°10′E-114°40′E, in the north of Hunan Province and the south of Hubei Province, and is the second largest freshwater lake in China, as well as an important storage lake and ecological security function area in the Yangtze River Basin. The overall plain is dominant, but there are still many types of landforms, which can be roughly divided into four types: lake water bodies and continental beaches, plains and hills around the lake, hills and low mountains around the lake area, and river valley plains and hills (Zeng et al., 2023). It is a typical subtropical monsoonal climate, with simultaneous rain and heat, long sunshine hours, abundant precipitation, and a dense network of rivers in the lake area, through which the Xiang, Zizhi, Yuan and Li rivers flow. The region has good coastline resources, thriving interior river ports like Yueyang Port and Jingzhou Port, and is well-served by a variety of transportation modes including high-speed rail, highway, railroad, water transport, and air transport. The area has a thriving agricultural products processing business and is a key producer of agricultural goods such as grain, cotton, oil, and freshwater fish in China (Xiong et al., 2022). Here, some counties (cities and districts) in three prefecture-level cities of Yueyang, Yiyang, and Changde in the Dongting Lake Ecological and Economic Zone were selected as the study area, including Yueyang city, Linxiang city, Yueyang county, Huarong county, Miluo city, Xiangyin county, Yiyang city, Yuanjiang city, Nan county (including Datong lake area), Changde city, Hanshou county, Anxiang county, Li county, Jin city, and Linli county, a total of 19 counties (cities and districts) (the study area in the following refers to this range), as shown in Figure 1, with a total area of about 25,800 km2, accounting for about 12.18% of Hunan Province, a resident population of about 10,075,800 as of the end of 2020, accounting for 16.11% of the province, and a gross product of about 710.44 billion yuan, accounting for about 17% of the province.
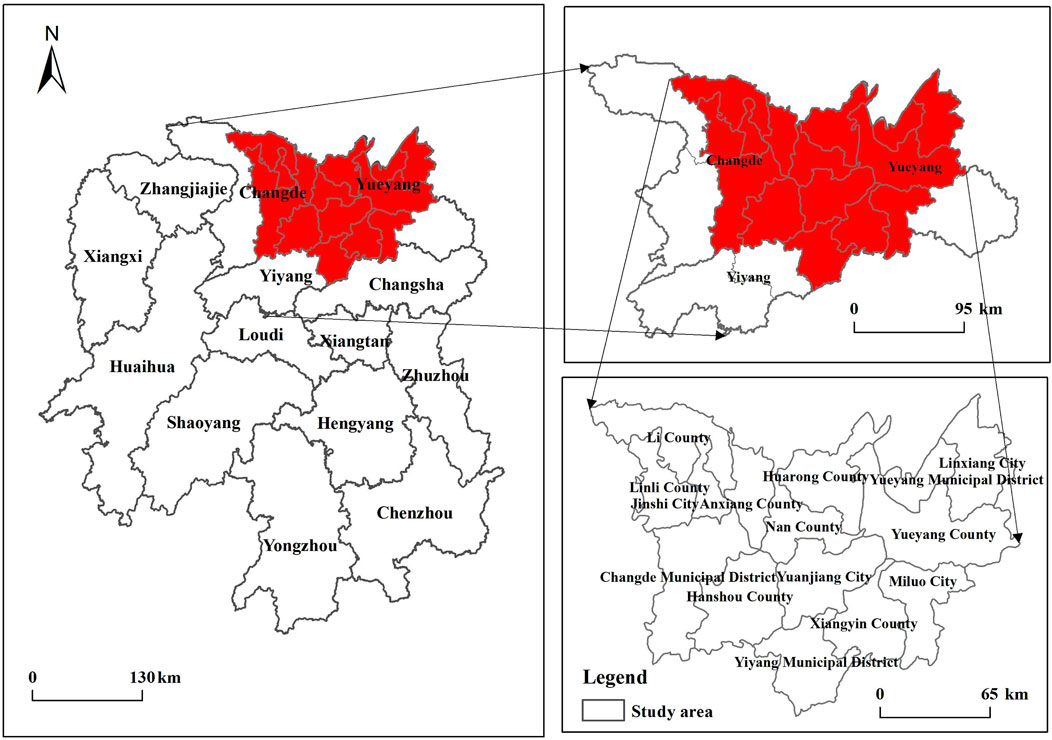
FIGURE 1. Study area.
2.2 Methods
2.2.1 Spatial expansion intensity of urban land
The spatial expansion intensity of urban land (
Where:
2.2.2 Water production service
The water production service is generally defined as the difference between precipitation and evapotranspiration and is one of the measures of the water availability of an ecosystem. Based on the Budyko coupled water-energy balance theory (Jin et al., 2022), the InVEST model’s water production service module (water yield) determines the average annual water yield by subtracting the average annual precipitation from the actual annual evapotranspiration. The calculating formula is as follows:
Where:
2.3 Data sources
The Urban land, Annual actual evapotranspiration and Annual precipitation datasets were obtained from the Resource and Environmental Science and Data Center of the Chinese Academy of Sciences, accessible through the specific website (https://www.resdc.cn/).
3 Results analysis
3.1 Spatial-temporal evolutionary characteristics of urban land intensity and water-related function
Along with the beginning and speeding up of urbanization, the amount of agricultural land being converted into non-agricultural construction land has accelerated and expanded, and the intensity of land disturbance by human activities has steadily increased. This is partially reflected in the spatial evolution of towns. From Figures 2A–C, it can be seen that the intensity of urban spatial evolution in the study area from 2000 to 2020 shows obvious spatial divergence characteristics and exhibits a process of growth and change. In general, the low intensity is mainly distributed in Dongting Lake, coastal rivers and lakes and mountainous hilly areas, while the high intensity is concentrated in areas with higher urbanization levels such as urban counties and cities. The higher intensity is located in the combined urban-rural areas around towns, the medium intensity is mainly distributed in the fringe areas of combined urban-rural areas, and the lower intensity is mainly concentrated around ecologically sound areas such as rivers and hills. From 2000 to 2010, the area of high intensity has shrunk, mainly showing the obvious reduction of high intensity areas in Yiyang city, Miluo city, Huarong county and Nan county; the distribution range of higher intensity has slightly expanded, mainly transformed by the high intensity area in 2000; while the area of low intensity, lower intensity and medium intensity is more stable. This reflects the slow urbanization process, slow population concentration and small scale of economic activities in the ecological economic zone of Dongting Lake during this period, resulting in a small change in the overall land use intensity. From 2010 to 2020, there is a significant increase in land use intensity in the study area, mainly in the high-intensity areas of Huarong County, Nan County, Yuanjiang City, Yiyang City, Changde City, Miluo City and Yueyang County At the same time, the low-intensity area in the northern waters of Dongting Lake, Linxiang City and the eastern side of Yueyang County decreased significantly, while the lower-intensity area increased significantly. In the eastern, southern and western shore areas of Dongting Lake, the higher-intensity and medium-intensity areas also expanded to a certain extent compared with 2010. This is related to the accelerated urbanization in recent years, the increasing concentration of population, the accelerated expansion of construction land, the sharp changes in the original land use structure, and the increased economic pressure on land. Thus, the change process of land use intensity from 2000 to 2018 indicates the importance of continuing to implement the concept of ecological civilization and the development plan of an ecological economic zone in the future study area, vigorously developing the ecological economy, accelerating industrial transformation and upgrading, and strengthening ecological environmental protection.

FIGURE 2. Spatial distribution of urban and water ecology in study area 2000–2020.
In terms of the water-related function (Figures 2D–F), the spatial and temporal variation of the water-related function from 2000 to 2020 is large. The highest value of the water-related function is found mostly in the eastern, southern, and northwestern mountainous areas, where the vegetation cover is dense and thus the water-related function is high. From 2000 to 2010, the distribution area of high water-related function increased slightly, mainly in Changde city, Linli county, Yiyang city and Miluo city; from 2010 to 2020, the area of high water-related function decreased significantly in Linli county, southern Changde city, Yueyang county, Linxiang city and Miluo city. In 2010–2020, the area of high water-related function in Linli County, the southern part of Changde City, Yueyang County, Linxiang City and Miluo City decreased significantly. At the same time, the area of higher water content function in the study area is always shrinking, as the ecological and economic zone of Dongting Lake is in the stage of accelerated urbanization and the scope of human activities is expanding, and the regional water content function is obviously reduced due to the influence of anthropogenic activities such as forest land reclamation and sloping land development, etc. From 2000 to 2020, the area of medium water content function is characterized by a continuous increase, which is manifested in the plains on the west bank of Dongting Lake and the hills and mountains in the east and south. From 2000 to 2020, the area of medium water-related function is characterized by a continuous increase, as shown by the plain on the west bank of Dongting Lake and the hilly mountains in the east and south. The lower values of the water-related function are mainly distributed along the Dongting Lake watershed, Datong Lake, along the Yangtze River, the western part of Xiangyin County, Changde City, and Jincheng City, and their distribution is relatively stable from 2000 to 2020, with little spatial change.
3.2 Spatial-temporal interaction analysis between urban and water ecology
The greater the intensity of urban spatial evolution, the deeper the impact of human activities on water ecology, which will eventually contribute to the decline and reduction of water ecological functions. The analysis of the spatial evolutionary intensity of towns and cities and the spatio-temporal relationship between water ecological functions is of great relevance to the realization of sustainable development. From the results of the local binary spatial autocorrelation analysis (Figure 3), it can be seen that in the local spatial autocorrelation distribution of the spatial evolutionary intensity of towns and cities and water ecological functions, the high-high concentration is mainly distributed in Linxiang City, Yueyang County, Miluo City, Li County and Yiyang City, and from 2000 to 2010, its distribution area shows a shrinking feature, while there is a small expansion in Changde City and Yiyang City; From 2010 to 2020, its distribution area increases, and the expansion is more obvious in Yueyang County, Miluo City, Xiangyin County, Yiyang City, Li County and Linli County. Low-low agglomeration is mainly concentrated in Dongting Lake, Datong Lake and along the Yangtze River; From 2000 to 2010, its distribution area in Datong Lake and North Dongting Lake showed a small increase, and its spatial pattern did not change much from 2010 to 2020. The low-high concentration is mainly located in Li County, Linxiang City, Yueyang County, Miluo City, Linli County, Yiyang City and the southern part of Changde City, and its area has an increasing trend; From 2000 to 2010, the area of low-high concentration in Linli County, the southern part of Changde City, the southern part of Yiyang City and the southeast of Linxiang City increased significantly; From 2010 to 2020, its distribution in Linli County, Changde City, Linxiang City and Yueyang County. From 2010 to 2020, the distribution area in Linli County, Changde City, Linxiang City and Yueyang County decreased significantly, while the distribution area in Yiyang City increased. The area of high-low agglomeration is smaller and more concentrated on the south bank of Dongting Lake, the south bank of the Yangtze River and the Changde urban area. From 2000 to 2010, its area in Xiangyin County showed a large increase, but the area of high-low agglomeration remained basically the same from 2010 to 2020.
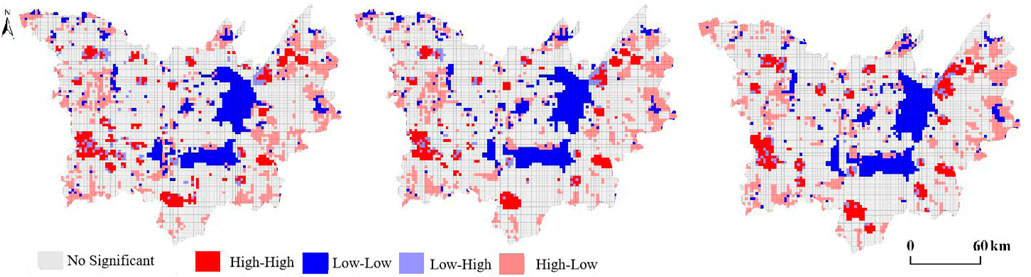
FIGURE 3. Spatio-temporal interaction between towns and water ecology.
4 Digital intelligence control mode of water ecological space under urban water coupling
The urban space in the Dongting Lake area shows the characteristics of spreading expansion, polycentric structure evolution and jumping land expansion. The analysis of water ecological functions reveals that while pressure on the supply of water ecological functions is relieved with the implementation of projects like the return of farmland to the lake in the Dongting Lake area, the problem of water ecological space risk remains severe and water ecological space, such as waters and wetlands, is reduced in a significant amount of urban space (Namavar et al., 2023).
4.1 Theoretical framework of urban water coupling
Established studies have employed a range of quantitative variables to assess the regional population, industrial scale, industrial structure, etc. with regard to the pressure that urban socio-economic development has on the aquatic environment. Among them, for the measurement of population pressure, some studies have used indicators such as population urbanization rate (Lu et al., 2019), natural population growth rate, and population density (Duan et al., 2021) to directly quantify the population scale, arguing that the carrying pressure on the water environment is also higher in regions with a higher population scale; or they have used household water consumption, per capita daily domestic water consumption, domestic wastewater discharge per unit area of living area, urban domestic wastewater discharge rate (Bi et al., 2023) and other indicators to measure the pressure on the water environment caused by domestic water use and sewage discharge. Similarly, for industrial scale and industrial structure, evaluation indexes such as GDP, per capita GDP, annual growth rate of GDP, industrialization level index, water consumption per 10,000 yuan GDP, and wastewater discharge per 10,000 yuan GDP (Ferrer et al., 2012) can be used. According to the principle of representativeness, this study adopts a pressure measurement index that integrates the level of population and economic development, the water resources load index to measure the change in pressure exerted on the water environment by socioeconomic development.
The pressure that urban development has put on the aquatic environment is mostly manifested in the alteration of the original hydrogeomorphological characteristics and the rise in pollutants in surface runoff. As mentioned above, the process of urban construction has the problem of filling small water bodies and rivers and changing the connected structure of water systems, which causes a change in the water flow state and habitat of aquatic animals and plants (Wei et al., 2023a; Wei et al., 2023b). Drawing on the landscape pattern index method of landscape ecology (Yu et al., 2019), this study used the landscape fragmentation index of watershed wetlands to measure the magnitude of changes in hydrogeomorphic characteristics caused by urban construction. For the problem of surface runoff pollution caused by urban construction, which mainly originates from the runoff pollution of impervious surface surfaces in cities and towns, the percentage of impervious surface surfaces is used as an evaluation index, which can be calculated by extracting remote sensing images, and the data are available and connected with the manageable indexes of territorial spatial planning.
4.2 Water ecology spatial digital intelligence control model
Digital intelligence control of territorial space has been emphasized in China’s planning community, but the main control contents are mostly qualitative planning effectiveness and macro-socio-economic indicators, while there is a lack of specific policy evaluation, external evaluation and dynamic monitoring of the implementation process. Therefore, the development trend of the digital intelligence control model must achieve threshold identification, dynamic visualization and intelligence, and improve all aspects of digital intelligence control of land space (Wei et al., 2023a). Thresholds: The indicator thresholds are essentially the boundaries of the numerical interval of the constraints in the water ecology spatial digital intelligence control, which is the key information for the implementation of supervision (Ouyang et al., 2019). The key to measuring indicator thresholds is to identify the key indicators related to human activities, sort out how system components interact, and take into account exogenous factors like large-scale climate change and regional main functions, along with the goals of territorial spatial planning and indicator sets, to establish the many-to-many relationship between human activities and the resource environment. Based on this, the relationship between key indicators and each resource and environmental component is quantified employing system model simulation, and the indicator thresholds are then determined by identifying abrupt change points. The current assessment methods for water resource carrying capacity mainly include the empirical formula method, the multi-objective decision method, the system analysis method, the artificial intelligence algorithm, etc. To determine the threshold value of urban space scale, we need to estimate the total amount of regional water resources and the upper limit of water resource carrying capacity. Then, using the aforementioned method, we can forecast future urban production and living water demand. Based on per capita water consumption, we can then determine the size of the urban population that can be supported by regional water resources, or we can directly forecast it using the aforementioned method. Finally, we can multiply the size of the urban population by the per capita urban construction land area of the planning target. Additionally, the buildable land area of the entire region must be taken into account. The appropriate scale of urban construction land is determined by taking the smaller value of the buildable land area and the maximum scale of urban construction land carried by water resources.
Dynamic: By establishing a long-term monitoring system for national spatial planning, it can realize dynamic mastery of the implementation and operation of the plan and provide powerful support for the development and utilization of national spatial resources and planning management (Ouyang et al., 2022). The scope of long-term monitoring should include monitoring of land use changes, monitoring of planning implementation and approval, monitoring of planning target indicators, etc. The monitoring department should compare the most recent data of each indicator obtained by the system with the historical data and target values, respectively. Through the former, it can learn the benefits and drawbacks of the corresponding planning policies brought on by implementation and change trends, and through the latter, it can clarify the status of planning implementation as well as the next focus and direction of action. Extending the application of artificial intelligence (AI) and regional block chain technology in the field of territorial spatial planning, integrating the complex supervisory views of all social parties, and conducting scientific calculations on the revision of territorial spatial planning to as closely match the needs of all parties as possible.
Visualization: Identifying the key information from a large number of complex data sets to create an interactive image, implementing the two- and three-dimensional integrated graph-number linkage visualization so that the supervision results can be presented to regulators, technical parties, and the general public in a clear and efficient manner, and comprehensively integrating changes to multi-period remote sensing image changes (Eilola et al., 2023). Automatic extraction, video image interpretation, real-time processing of UAV aerial data flow, and other technical means are all realized, as are quick monitoring and verification and quick modeling of three-dimensional situations. Investigate the integration of 3D GIS, BIM, and IOT technology, develop a spatial planning management and application system based on an urban information model (CIM), and provide visual technical support for intelligent scenario simulation.
Intelligent: Form a feedback process of implementation evaluation-planning adjustment for two-way improvement. Therefore, during the decision-making process, the administrative bodies should conduct evaluations and gather feedback data in a timely manner (Ghavami et al., 2022). They should also build a real-time interactive and co-consultative urban spatial governance platform using the metaverse and digital twin city, and they should use a variety of tools like model algorithms to analyze and correct the implementation of policies and regulations, technical standards, and operating guidelines of the territorial spatial planning and enhance the entire system for spatial planning. We will improve the scientific and intelligent level of all aspects of spatial planning and focus on the system construction and platform development of systems for intelligent review of planning results, intelligent approval of construction projects, auxiliary site selection for major projects, intelligent supervision of the whole planning process, and dynamic evaluation of planning implementation.
5 Conclusion and discussion
5.1 Conclusion
1) From 2000 to 2020, the spatial evolutionary intensity of towns in the study area shows obvious spatial differentiation characteristics and exhibits a process of growth and change. The high intensity is concentrated in areas with high urbanization levels, such as urban counties and cities; the higher intensity is located in the urban-rural combination areas around the towns; the medium intensity is mainly distributed in the fringe areas of the urban-rural combination; and the lower intensity is mainly concentrated around ecologically sound areas, such as rivers and hills. The spatial and temporal variation of the water-related function is large. The high value of the water-related function is mainly distributed in the eastern, southern and northwestern mountainous areas, where the vegetation cover is higher and thus the water-related function is higher.
2) According to the results of the local binary spatial autocorrelation analysis, the high-high urban space and water-related agglomerations are primarily distributed in Linxiang City, Yueyang County, Miluo City, Li County, and Yiyang City from 2000 to 2020, while the low-low agglomerations are primarily distributed in Dongting Lake, Datong Lake, and along the Yangtze River.
3) The theoretical framework of urban-water coupling is sorted out, the core index system of digital intelligence control is constructed, and the digital model of water-ecological spatial toughness control in the Dongting Lake area is built from four aspects: threshold, visualization, dynamization, and intelligence.
5.2 Discussion
How to understand the dynamic interaction between urban space and the water environment system from the perspective of spatial planning is one of the core issues of this paper. On the basis of sustainable development theory, ecological adaptability theory, coupling relationship theory and other theories on the harmonious coexistence of humans and nature (Huang et al., 2022), this paper identifies the interaction between urban spatial evolution and water ecological space through a spatial autocorrelation model, constructs a framework for coupling urban spatial evolution and water ecological space, and sorts out and summarizes the core index system for the control of urban spatial and water ecological space. In the current territorial spatial planning, the ecological protection red line mainly refers to the boundary line of spatial management to protect important ecological function areas and sensitive areas (Liu et al., 2023), but for water ecosystems, water quality, water quantity and water ecological space are all three key factors to maintaining the health of water ecosystems, so some scholars propose to construct the water ecological red line framework from the three dimensions of structure-function-quality (Zeng et al., 2023). This paper agrees with and perpetuates this idea of water ecology protection and takes Dongting Lake as an example to discuss the spatial control model of water ecology in the region. Specifically, it is suggested to set the core control indexes related to water ecological space related to urban space and the water environment and to clarify the bottom line of water ecological protection. This paper proposes to use different non-linear methods to get the thresholds of different indexes, and at the same time, it integrates technologies such as the metaverse and digital twin cities to explore the control strategy of water ecological space in a spatial planning system through thresholds, visualization, dynamics and intelligence. For the territorial spatial system, it is not only necessary to couple the relationship between the urban and the water environment, but also to comprehensively coordinate the relationship between other ecological and environmental protection needs, basic farmland protection needs, etc., (Qu et al., 2023). And the water ecological space. Therefore, the spatial planning strategy proposed in this study can be used as a special study on water environment in the process of spatial planning of the whole area, and the complete delineation of “three zones and three lines” should also integrate other ecological environment elements and basic farmland protection related research results. Water ecological space monitoring is a complex project. This paper attempts to construct a digital technology of resilience from the perspective of urban-water relationship, which is an innovation. However, a comprehensive framework should be further constructed for monitoring in the future.
Data availability statement
The original contributions presented in the study are included in the article/Supplementary material, further inquiries can be directed to the corresponding author.
Author contributions
HY: Conceptualization, Data curation, Writing–original draft. QN: Formal Analysis, Methodology, Writing–review and editing. HZ: Data curation, Formal Analysis, Writing–review and editing. NL: Software, Validation, Writing–review and editing. QS: Data curation, Investigation, Writing–review and editing. QJ: Methodology, Writing–review and editing. ZZ: Conceptualization, Validation, Writing–review and editing.
Funding
This research was funded by the “Research project of Hunan Geological Institute” (HNGSTP202206) and “National Science Foundation of Hunan Province of China” (2022JJ50271).
Conflict of interest
The authors declare that the research was conducted in the absence of any commercial or financial relationships that could be construed as a potential conflict of interest.
Publisher’s note
All claims expressed in this article are solely those of the authors and do not necessarily represent those of their affiliated organizations, or those of the publisher, the editors and the reviewers. Any product that may be evaluated in this article, or claim that may be made by its manufacturer, is not guaranteed or endorsed by the publisher.
References
BachDeletic, P. M. A., Urich, C., Sitzenfrei, R., Kleidorfer, M., Rauch, W., and McCarthy, D. T. (2013). Modelling interactions between lot-scale decentralised water infrastructure and urban form - a case study on infiltration systems. Water Resour. Manage 27, 4845–4863. doi:10.1007/s11269-013-0442-9
Bhaskar, A. S., Jantz, C., Welty, C., Drzyzga, S. A., and Miller, A. J. (2016). Coupling of the water cycle with patterns of urban growth in the Baltimore Metropolitan Region, United States. J. Am. Water Resour. Assoc. 52, 1509–1523. doi:10.1111/1752-1688.12479
Bi, Y., Zheng, L., Wang, Y., Li, J., Yang, H., and Zhang, B. (2023). Coupling relationship between urbanization and water-related ecosystem services in China’s Yangtze River economic Belt and its socio-ecological driving forces: a county-level perspective. Ecol. Indic. 146, 109871. doi:10.1016/j.ecolind.2023.109871
Corodescu-Rosca, E., Hamdouch, A., and Iatu, C. (2023). Innovation in urban governance and economic resilience. The case of two Romanian regional metropolises: timișoara and Cluj Napoca. CITIES 132, 104090. doi:10.1016/j.cities.2022.104090
Duan, T., Feng, J., Zhou, Y., Chang, X., and Li, Y. (2021). Systematic evaluation of management measure effects on the water environment based on the DPSIR-Tapio decoupling model: a case study in the Chaohu Lake watershed, China. Sci. Total Environ. 801, 149528. doi:10.1016/j.scitotenv.2021.149528
Eilola, S., Jaalama, K., Kangassalo, P., Nummi, P., Staffans, A., and Fagerholm, N. (2023). 3D visualisations for communicative urban and landscape planning: what systematic mapping of academic literature can tell us of their potential? Landsc. Urban Plan. 234, 104716. doi:10.1016/j.landurbplan.2023.104716
Ferrer, J., Pérez-Martín, M. A., Jiménez, S., Estrela, T., and Andreu, J. (2012). GIS-based models for water quantity and quality assessment in the Júcar River Basin, Spain, including climate change effects. Sci. Total Environ. 440, 42–59. doi:10.1016/j.scitotenv.2012.08.032
Ghavami, S. M., Taleai, M., and Arentze, T. (2022). An intelligent web-based spatial group decision support system to investigate the role of the opponents’ modeling in urban land use planning. Land Use Policy 120, 106256. doi:10.1016/j.landusepol.2022.106256
Huang, M., Li, Y., Xia, C., Zeng, C., and Zhang, B. (2022). Coupling responses of landscape pattern to human activity and their drivers in the hinterland of Three Gorges Reservoir Area. Glob. Ecol. Conservation 33, e01992. doi:10.1016/j.gecco.2021.e01992
Huang, X., Liu, J., Peng, S., and Huang, B. (2023). The impact of multi-scenario land use change on the water conservation in central Yunnan urban agglomeration, China. Ecol. Indic. 147, 109922. doi:10.1016/j.ecolind.2023.109922
Jin, T., Yan, L., Wang, S., and Gong, J. (2022). Spatiotemporal variation in ecological risk on water yield service via land-use and climate change simulations: a case study of the ziwuling mountainous region, China. Front. Environ. Sci. 10, 908057. doi:10.3389/fenvs.2022.908057
Jaiswal, D., and Pandey, J. (2021). Human-driven changes in sediment-water interactions may increase the degradation of ecosystem functioning in the Ganga River. J. Hydrology 598, 126261. doi:10.1016/j.jhydrol.2021.126261
Liu, Y., Wang, L., Lu, Y., Zou, Q., Yang, L., He, Y., et al. (2023). Identification and optimization methods for delineating ecological red lines in Sichuan Province of southwest China. Ecol. Indic. 146, 109786. doi:10.1016/j.ecolind.2022.109786
Lu, W., Xu, C., Wu, J., and Cheng, S. (2019). Ecological effect assessment based on the DPSIR model of a polluted urban river during restoration: a case study of the Nanfei River, China. Ecol. Indic. 96, 146–152. doi:10.1016/j.ecolind.2018.08.054
McBride, M., and Booth, D. B. (2005). Urban impacts on physical stream condition: effects of spatial scale, connectivity, and longitudinal trends. J. Am. Water Resour. Assoc. 41, 565–580. doi:10.1111/j.1752-1688.2005.tb03755.x
Meng, C. L. (2021). Water balance scheme development for urban modelling. Urban Clim. 37, 100843. doi:10.1016/j.uclim.2021.100843
Namavar, M., Moghaddam, M. R. A., and Shafiei, M. (2023). Developing an indicator-based assessment framework for assessing the sustainability of urban water management. Sustain. Prod. Consum. 40, 1–12. doi:10.1016/j.spc.2023.06.006
Ouyang, X., Xu, J., Li, J., Wei, X., and Li, Y. (2022). Land space optimization of urban-agriculture-ecological functions in the Changsha-Zhuzhou-Xiangtan Urban Agglomeration, China. Land Use Policy 117, 106112. doi:10.1016/j.landusepol.2022.106112
Ouyang, X., Shao, Q., Zhu, X., He, Q., Xiang, C., and Wei, G. (2019). Environmental regulation, economic growth and air pollution: panel threshold analysis for OECD countries. Sci. Total Environ. 657, 234–241. doi:10.1016/j.scitotenv.2018.12.056
Paiva, A. C. D. E., Nascimento, N., Rodriguez, D. A., Tomasella, J., Carriello, F., and Rezende, F. S. (2020). Urban expansion and its impact on water security: the case of the Paraíba do Sul River Basin, São Paulo, Brazil. Sci. Total Environ. 720, 137509. doi:10.1016/j.scitotenv.2020.137509
Qu, Y., Dong, X., Su, D., Jiang, G., and Ma, W. (2023). How to balance protection and development? A comprehensive analysis framework for territorial space utilization scale, function and pattern. J. Environ. Manag. 339, 117809. doi:10.1016/j.jenvman.2023.117809
Wang, H., Huang, L., Zhang, H., Fu, Y., Guo, W., Jiao, X., et al. (2023). Development of a decision framework for river health and water yield ecosystem service in watershed. J. Hydrology 623, 129773. doi:10.1016/j.jhydrol.2023.129773
Wang, K., Ouyang, X., He, Q. Y., and Zhu, X. (2022). Impact of urban land expansion efficiency on ecosystem services: a case study of the three major urban agglomerations along the Yangtze River economic belt. Land 11, 1591. doi:10.3390/land11091591
Wei, G., He, B., Sun, P., Liu, Y., Li, R., Ouyang, X., et al. (2023a). Evolutionary trends of urban expansion and its sustainable development: evidence from 80 representative cities in the belt and road initiative region. Cities 138, 104353. doi:10.1016/j.cities.2023.104353
Wei, G., Bi, M., Liu, X., Zhang, Z., and He, B. (2023b). Investigating the impact of multi-dimensional urbanization and FDI on carbon emissions in the belt and road initiative region: direct and spillover effects. J. Clean. Prod., 384. doi:10.1016/j.jclepro.2022.13560
Xiong, J., Wang, X., Zhao, D., and Zhao, Y. (2022). Spatiotemporal pattern and driving forces of ecological carrying capacity during urbanization process in the Dongting Lake area, China. Ecol. Indic. 144, 109486. doi:10.1016/j.ecolind.2022.109486
Xu, K., Wu, S. H., Chen, D. X., Dai, L., and Zhou, S. L. (2013). The urban growth boundary determination based on hydrology effect: taking xinminzhou as an example. Sci. Geogr. Sin. 33 (08), 979–985. doi:10.13249/j.cnki.sgs.2013.08.979
Yao, Y., Ma, L., Che, X., and Dou, H. (2021). Simulation study of urban expansion under ecological constraint—taking Yuzhong County, China as an example. Urban For. Urban Green. 57, 126933. doi:10.1016/j.ufug.2020.126933
Yu, H., Liu, X., Kong, B., Li, R., and Wang, G. (2019). Landscape ecology development supported by geospatial technologies: a review. Ecol. Inf. 51, 185–192. doi:10.1016/j.ecoinf.2019.03.006
Zeng, Z., Yang, H., Zhou, H., Lai, N., Song, Q., Ji, Q., et al. (2023). Monitoring and control of water-ecological space in the Dongting Lake region. Front. Environ. Sci. 11, 1200513. doi:10.3389/fenvs.2023.1200513
Zhang, X., Wang, J., Yue, C., Ma, S., Hou, L., and Wang, L. (2023). Impact of wetland change on ecosystem services in different urbanization stages: a case study in the Hang-Jia-Hu region, China. Ecol. Indic. 153, 110382. doi:10.1016/j.ecolind.2023.110382
Zhang, Y., Chang, X., Liu, Y., Lu, Y., Wang, Y., and Liu, Y. (2021). Urban expansion simulation under constraint of multiple ecosystem services (MESs) based on cellular automata (CA)-Markov model: scenario analysis and policy implications. Land Use Policy 108, 105667. doi:10.1016/j.landusepol.2021.105667
Keywords: urban-water coupling, water ecological space, resilience control, digitalization, Dongting lake area
Citation: Yang H, Ning Q, Zhou H, Lai N, Song Q, Ji Q and Zeng Z (2023) Digital research on the resilience control of water ecological space under the concept of urban-water coupling. Front. Environ. Sci. 11:1270921. doi: 10.3389/fenvs.2023.1270921
Received: 01 August 2023; Accepted: 09 October 2023;
Published: 26 October 2023.
Edited by:
Xue-Chao Wang, Beijing Normal University, ChinaReviewed by:
Xiao Ouyang, Hunan University of Finance and Economics, ChinaKun Wang, Guangxi University Nanning, China in collaboration with reviewer XO
Guoen Wei, Nanchang University, China
Copyright © 2023 Yang, Ning, Zhou, Lai, Song, Ji and Zeng. This is an open-access article distributed under the terms of the Creative Commons Attribution License (CC BY). The use, distribution or reproduction in other forums is permitted, provided the original author(s) and the copyright owner(s) are credited and that the original publication in this journal is cited, in accordance with accepted academic practice. No use, distribution or reproduction is permitted which does not comply with these terms.
*Correspondence: Qimeng Ning, ningqimeng@hncu.edu.cn