Impacts of Water Bodies on Microclimates and Outdoor Thermal Comfort: Implications for Sustainable Rural Revitalization
 Yanyan Cheng1†
  Xiao Liu
 Bao-Jie He
- 1North China University of Water Resources and Electric Power, Zhengzhou, China
- 2School of Architecture, South China University of Technology, Guangzhou, China
- 3Department of Urban Planning and Design, Faculty of Architecture, The University of Hong Kong, Hong Kong SAR, China
- 4Architectural Design & Research Institute Co., Ltd., South China University of Technology, Guangzhou, China
- 5State Key Laboratory of Subtropical Building Science, South China University of Technology, Guangzhou, China
- 6Centre for Climate-Resilient and Low-Carbon Cities, School of Architecture and Urban Planning, Chongqing University, Chongqing, China
- 7Key Laboratory of New Technology for Construction of Cities in Mountain Area, Ministry of Education, Chongqing University, Chongqing, China
Water is the source of life and the fundamental element of ecology, and climate is inseparable from water. To evaluate the influence of water-adaptive space in a traditional Weizi (polder village) settlement on its microclimate, the authors analyzed the morphological characteristics of such a polder village and applied the ENVI-met model to simulate the impact of water bodies and village morphological elements on human thermal comfort. This paper demonstrates the positive impact of water bodies on improving the thermal environment of a village and regulating its microclimate by quantifying the impact of morphological elements of the settlement on microclimate. The results indicate that: 1) The simulation model fits the actual measurements well, and the simulation accurately reflects experimental results; 2) In summer, the cooling effect of water bodies is better in the afternoon than in the morning, especially from 12:00 to 15:00. The cooling effect is significantly correlated with the distance to water bodies, i.e., the closer, the better; 3) Building density and man-made underlying surface are negatively correlated with temperature, humidity, and Physiological Equivalent Temperature value, while greening rate and water body rate are positively correlated with microclimate. Overall, water bodies can improve outdoor comfort in summer and thus should be protected and developed in rural planning and design. Villages can be built around water bodies for a maximized cooling effect, and microclimate comfort can be effectively improved by increasing green plants near the village center, and reducing man-made underlying surface and building density. The results of this study will guide the improvement of the habitat environment in the process of rural revitalization, as well as the protection and re-development of traditional villages.
1 Introduction
Water plays a key role in ecosystem evolution (Zhang et al., 2009), and human intervention makes the impact of water on the ecological environment even more significant (Jewitt, 2002). Ecological revitalization is an important part of rural revitalization, and ecological stability directly affects the quality of human settlements (Li et al., 2020). Water-adaptive space in vernacular settlements reflects a dynamic relationship between human beings and water resources. The water-adaptive space presents ancestors’ wisdom to adapt to and moderately transform the water environment and utilize water resources in a low-technology, low-cost, low-maintenance, and sustainable way. Early human settlements were always near the water, and people developed various methods to utilize water resources. A Weizi settlement or polder village is a typical example of human habitat that adapts to, transforms, and utilizes a water environment. It is a typical model of Chinese traditional human settlement that combines human habitat with farmland and water conservancy (Cheng and Guo, 2015). This type of traditional human habitat that coexists with water has exhibited a live model for current rural revitalization and sustainable development. Water meets the needs of agricultural production and daily life in the village and it also has a regulatory effect on microclimate, especially on thermal comfort (Jin et al., 2017; Zeng et al., 2017; Cruz et al., 2021; Zhou et al., 2021; He et al., 2022).
He et al. studied the relationship between urban heat island (UHI) and the ongoing sponge city (SPC) project in China (He et al., 2019). Paramita et al. used ENVI-met to simulate the outdoor Mean Radiation Temperature (Tmrt) and Physiological Equivalent Temperature (PET) to explore the outdoor thermal comfort surrounding low-rent housing in different layouts in Indonesia, finding that parallel plots of land with buildings facing north and south are the most favorable building forms and configurations (Paramita et al., 2018). Xu et al. took a plateau village (3,500 m above sea level) next to the Sichuan-Tibet Highway as a case and selected four typical courtyard layouts and outdoor reference points in the village to assess Tmrt and PET through field measurements. They confirmed that solar radiation and wind speed are the main factors affecting the courtyard thermal environment (Xu et al., 2022).
Moreover, PET has been widely mentioned and used as a criterion for microclimate evaluation. Sanusi et al. studied the thermal comfort of pedestrians on sidewalks, suggesting that the microclimate benefits increase with Plant Area Index (PAI), and PAI plays a decisive role in determining microclimate and PET benefits (Sanusi et al., 2017). Su et al. selected four typical blocks to simulate the microclimate with the ENVI-met model, showing that direct sunlight and wind speed are the key factors affecting people’s thermal comfort. The outdoor thermal environment can be improved by adjusting the building orientation away from the traditional south direction, increasing the sunshine spacing coefficient, dislocating buildings, or adopting a peripheral-type building layout (Su et al., 2022). Ma et al. simulated and analyzed air temperature, wind speed, wind direction, and relative humidity of the Taihu “Dock Village”, and examined the correlation between spatial characteristics and microclimate from four perspectives: plane space, cross-section space, vertical section space, and linear development space (Ma et al., 2019). Sayad et al. optimized outdoor thermal comfort through vegetation parameterization in a boulevard, finding that planting Washingtonia palm trees along the center of the boulevard can maximize the shaded area within the boulevard, with a maximum reduction of 1.8°C (air temperature) and 3.5°C (UTCI) at 16:00 (Sayad et al., 2021). Park et al. studied how to optimize plant types and vegetation coverage rate on green roof to reduce urban heat island effects. Their studies have shown that the green roof scenario with 70% grass and 30% trees is effective in closed areas, 50% shrubs and 50% trees are best in semi-open areas, and 70% grass with 30% trees, or 30% grass and 70% trees, is best in open areas (Park et al., 2022).
Based on the literature reviews, it is found that research on microclimate around traditional settlements mainly focuses on architectural forms, and plant ratios. However, studies on the relationship between the spatial form of water bodies and microclimate are still lacking. This paper analyzed the spatial-temporal variations of water-induced cooling effect in summer, with a case study of the Weizi settlement in China. The conclusions provide further technical guidance on designing and renovating Weizi settlements for better thermal comfort.
2 Case Study Area
Xufan is a typical Weizi settlement (Figure 1), in Guanweizi Village, Yanhe Town, Guangshan County, Xinyang, Henan, China. Xufan Village was enlisted as one of the traditional Chinese villages in 2017. The settlement site lies against the Fenghuang Mountain with Tasha River to its east and hills to its southwest. This village presents very distinctive water-sun-village characteristics. It was built on a lower hilly area to ensure sufficient sunlight. Ponds are dug around the village to facilitate drainage and help avoid flooding during the rainy season and provide other functions including irrigation, washing clothes, defense against enemies, and firefighting (See Figure 2, the village is surrounded by artificial water bodies).
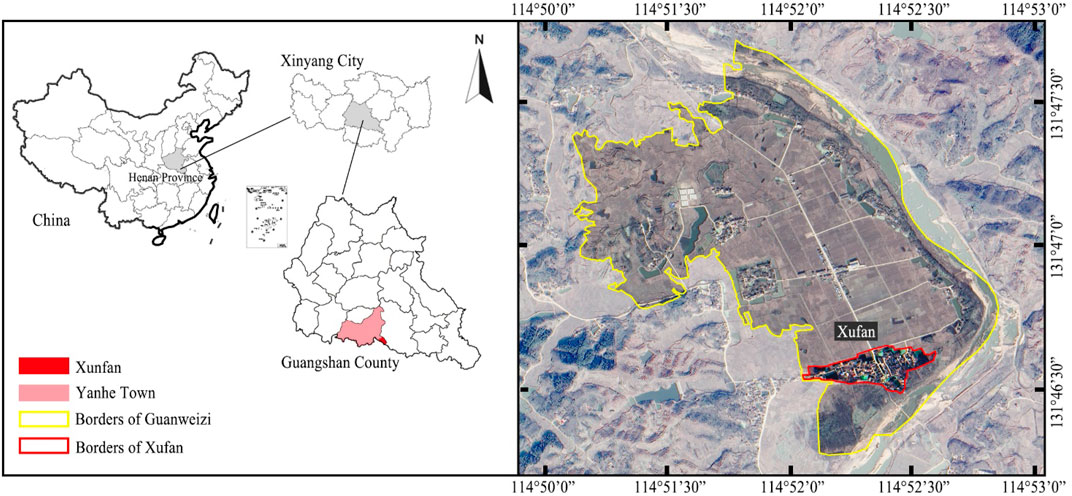
FIGURE 1. Geographic location of the case study area.
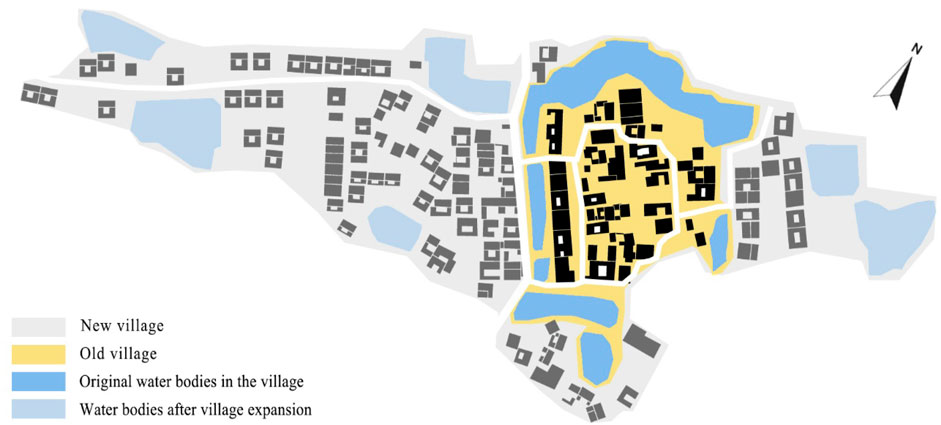
FIGURE 2. Expansion from the old village to the new village with newly dug ponds.
The location and spatial layout of traditional settlements in southern Henan Province are subject to multiple factors, such as climatic conditions, land and water transportation, Fengshui concepts, war, and banditry, as well as farming culture (Gao et al., 2018). Typically, the layout of a traditional settlement site focuses on the following considerations:
1) Availability of surrounding resources. To meet the needs of production and daily life, the site selection should consider the availability of various surrounding resources such as water, terrain, and transportation.
2) Security. The site selection and layout of the settlement should be effectively protected against natural disasters, war, and banditry.
3) Amiable climatic conditions. Moderate temperature, sunlight, and precipitation, as well as a microclimate created by surrounding rivers and mountains as a background, are also considerations in site selection and layout design.
Xinyang City is located in the transition zone from subtropical to warm temperate zones, exactly on the geographical dividing line of the two temperate zones (Qinling Mountains-Huaihe River), with the Huaihe River running through it. In China, it is generally understood as being divided by the mainstream of the Huaihe River. The southern part of the country has a humid subtropical monsoon climate and the northern part has a temperate monsoon semi-humid climate. Xinyang has sufficient sunlight, with an average annual sunshine of 1,990–2,173 h, an average annual air temperature of 15.1–15.3°C, an average annual soil temperature of 16.9°C, and an accumulated temperature of 5,250–5,383°C. It also has abundant rainfall with an annual average of 102–129 precipitation days, and an annual average rainfall of 900–1,400 mm. The air is humid, and the relative humidity is 75%–80% per year. Xinyang has four distinct seasons, which are controlled alternately by maritime tropical air masses and polar air masses in spring, summer, and autumn, and are mainly affected by continental polar air masses in winter. The salient characteristics of its climate are hot and humid summer, dry and cold winter, cool spring and autumn, four distinct seasons, rainy days with high temperature, and abundant precipitation. The dominant wind direction is south-southwest (SSW) in summer, and the average outdoor wind speed in summer is 3.2 m/s (Table 1) (Tsinghua University, 2018).
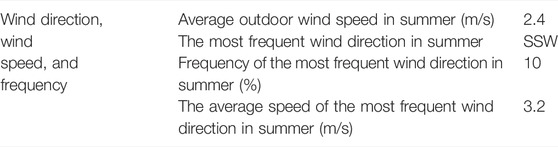
TABLE 1. Dominant wind direction, and wind speed in summer in Xinyang City.
2.1 Spatial Forms of Weizi Settlements
The most prominent morphological feature of the Weizi settlement is its water bodies. The settlement space is composed of surrounding water bodies (i.e., the enclosing ditches), a water center island, dykes, enclosing walls, the gatehouse, and residential courtyards (Cheng, 2009). Weizi can be divided into a joint pattern and a continuous pattern in terms of form. A joint Weizi means several parallel Weizi connected via water bodies while a continuous Weizi is a cluster of Weizi connected via water bodies. Based on building purpose, Weizi can be divided into lake type, river type, and mountain torrent type. Based on the ownership in history, it can be divided into official type, civil type, and private type. Based on the location of residential dwellings, there are two types: residential houses built in the enclosure and residential houses built outside the enclosure (polder).
2.2 Adaptive Water Management in Weizi Settlements
Water is an indispensable part of the location selection of villages. Ponds were dug around Guanweizi Village to ensure drainage, water storage, and rainwater infiltration during the rainy season, and to provide irrigation, defensive, and firefighting functions. They also help improve the microclimate of the village together with other factors such as vegetation. Water bodies were retained during the expansion process of the new village and new water bodies were added to the area (Figure 2).
Water has a regulatory effect on climate. The water body absorbs and accumulates heat in summer, and through evaporation, it absorbs heat from the surrounding environment and keeps it cool. The unique natural environment, historical factors, and climate all contributed to the morphological characteristics of a Weizi settlement, which was born of water, built on the waterside, and made good use of water. In ancient times, people living in the settlement relied on water bodies around Weizi to defend against enemies. Gradually, the water bodies lost their defensive value and mainly provided irritation functions and helped improve living comfort.
This study focuses on the evaluation and improvement of thermal comfort in water-adaptive space in Weizi. Compared with urban space, the decay of outdoor open space in the rural area is mainly because of a lack of investment, weakened public function, and weak development theory (Li et al., 2019; Guo and Liu, 2021; Kan, 2021). In addition, the neglect of the comfort of rural outdoor spaces is also one of the factors. Human thermal perception depends not only on environmental conditions, but also on psychological, physiological, physical, and economic factors (Pacheco et al., 2012; Hsl et al., 2021). This study follows the guidelines of rural revitalization and takes thermal comfort in a rural area with water-adaptive space in the Weizi settlement as the major topic. It adopts computer fluid dynamics (CFD) technology in analyzing how a Weizi settlement can be better adapted to and integrated into the surrounding environment and how to build new countryside with rich ecological value. The water adaptability of Weizi settlements is manifested in the active and passive aspects of the relationship between people and water, that is, the utilization of water resources by the village and the impact of water bodies on the living environment of the settlement. From the perspective of thermal comfort assessment and improvement, this study explores the water adaptability characteristics of Xufan Weizi settlements.
3 Methodology
3.1 Field Measurement
Three locations are selected for field measurement (Figure 3), namely monitoring points 1, 2, and 3. Among them, Point 1 is located at the village entrance and near the water, Point 2 on the wide road, and point 3 at a road corner. The measurements were taken on 15 July 2021, the hottest period of the year. Air temperature (Ta), relative humidity (RH), and wind speed (Va) were measured and recorded at the same time at a pedestrian height of 1.5 m.
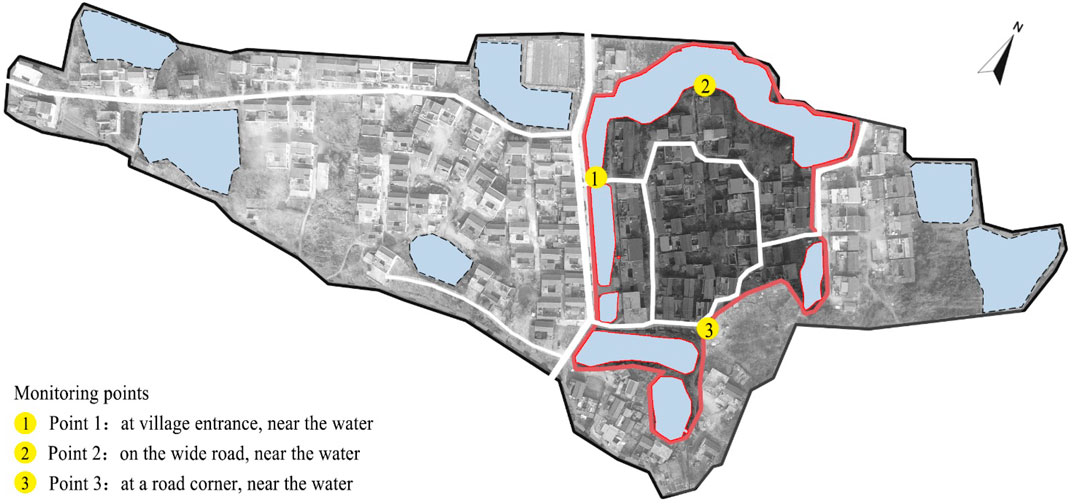
FIGURE 3. Locations of monitoring points.
3.2 Data Simulation
This paper uses ENVI-met 5.0 to simulate the ambient microclimate of a traditional settlement. ENVI-met is derived from meteorological studies in Germany, and the accuracy of this model has been confirmed in a large number of studies of outdoor microclimate. In previous studies, ENVI-met has been proven to have some advantages in analyzing microclimate on a regional and local scale. In addition, ENVI-met performs well in small- and medium-scale urban microclimate simulations. ENVI-met can also incorporate air temperature, relative humidity, solar insolation, soil, vegetation, pollution, etc. into the simulated boundary conditions (Nikolova et al., 2011).
3.3 Assessment Indicators
3.3.1 Outdoor Thermal Environment
As a direct indicator of the thermal sensation experienced by the human body related to the environment, thermal comfort is a hot topic in studies of outdoor microclimate. The PET will be used in this paper to evaluate outdoor thermal comfort. It is based on the Munich Energy-balance Model for Individuals (MEMI) (Cheng et al., 2019). Based on the ranges of PET, human thermal sensation and physiological stress on human beings are divided into nine grades (Table 2) (Matzarakis and Mayer, 1997; Lin and Matzarakis, 2008).
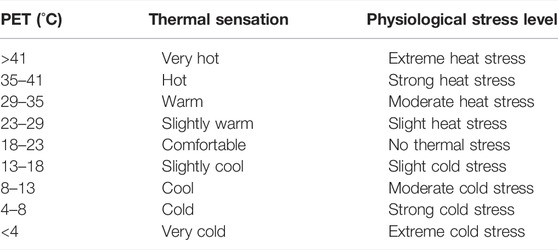
TABLE 2. PET for different grades of thermal sensation.
3.3.2 Water Body Cooling Effect
Since the thermal environment at 1.5 m above the ground is most closely related to pedestrian activity and comfort, the water-cooling effect is calculated as per temperature at this height. The cooling effect of water bodies on air temperature can be calculated as follows:
where
3.3.3 Village Morphological Indicators
The morphological indicators of villages and towns selected in this paper are as follows: 1) Water body morphological indicator includes water body rate and distance to a water body. Waterbody rate refers to the ratio of water body area to the case study area. Distance to the water body is the nearest distance between the monitoring point and the water body boundary. 2) The greening indicator, as represented by the greening rate, refers to the ratio of public greening area to the case study area. 3) The village spatial morphology indicator is indicated by building density and man-made underlying surface ratio. In the latter, the man-made underlying surface refers to hard pavement such as asphalt roads and cement.
As shown in Figure 4, data extraction points were selected every 21 m in the case study area, and 95 data points were available excluding useless ones on buildings. According to the satellite map of the villages and towns, a master plan was drawn in AutoCAD, and the area of each element was processed by a geographic information system (GIS). Buffer analysis in ArcGIS software was used to create a circular buffer around each monitoring point with a radius of 10, 20, 30, 40, and 50 m. The buffer layers were intersected with village building density, water bodies, greening, and man-made underlying surface to calculate the area proportion of each element. The nearest neighbor analysis tool in ArcGIS was used to calculate the nearest distance between each monitoring point and the water body boundary. Finally, Statistical Product Service Solutions (SPSS) software was used to conduct correlation analysis between various elements and temperature, humidity, and PET value, and finally confirmed their degree of impact on microclimate.
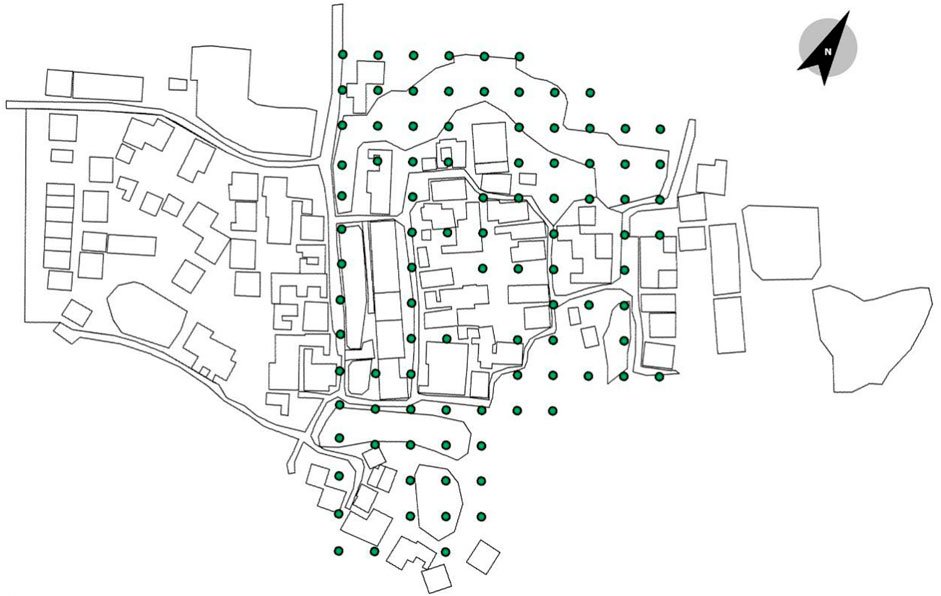
FIGURE 4. Village configuration and data extraction points in ArcGIS.
3.4 Modeling
The modeling grid is 204*146*10. The grid size is set to 3 × 3 × 3 m for more precise data (Figure 5). Most of the buildings are reinforced concrete buildings, the width of the road is between 3 and 6 m, surrounded by water, and the depth of water is about 2 m.
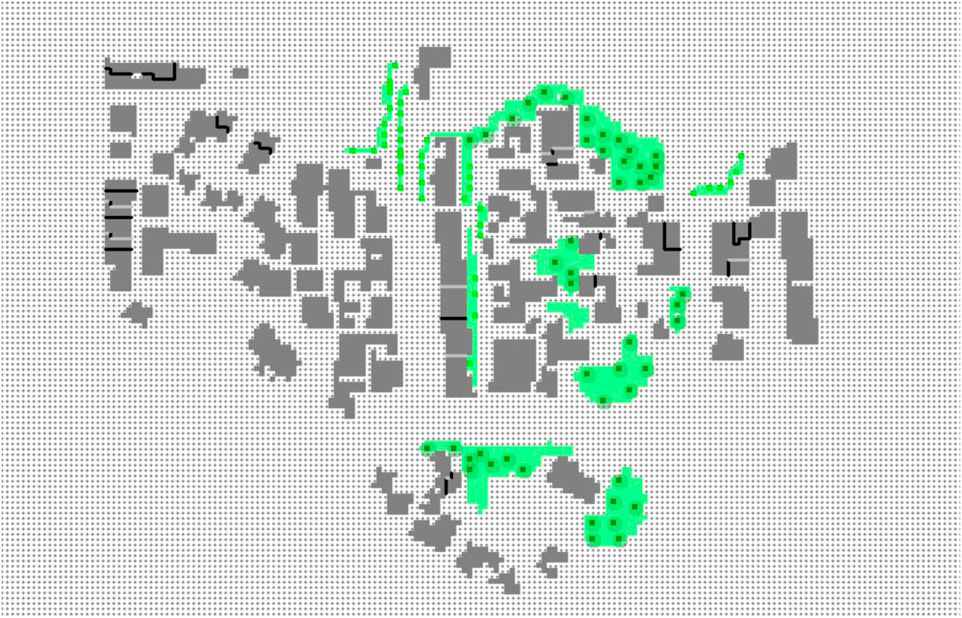
FIGURE 5. ENVI-met model of the case study area.
3.5 Meteorological Input Parameters
Meteorological data such as hourly temperature, relative humidity, wind speed, and wind direction are required for simulations. The average hourly temperature and relative humidity data measured at the three monitoring points are used as input meteorological data. Wind speed data at 10 m above the ground, and the most frequent daily wind direction data serve as wind environment boundary, while the wind environment data come from government weather stations. In addition, ENVI-met calculates incident solar radiation based on latitude/longitude, date, and time.
3.6 ENVI-met Model Evaluation
In this study, the accuracy of the model is evaluated by comparing the measured meteorological data with the simulated meteorological data. Commonly used evaluation metrics for predictive error analysis are Mean Bias Error (MBE), Mean Absolute Error (MAE), Root-Mean Square Error (RMSE), Mean Absolute Percentage Error (MAPE), and Theil’s Inequality Coefficient (TIC) (Khan et al., 2021). Although MAE and RMSE can reflect the average error of the model, the use of RMSE is more common, but it does not reflect the relative magnitude of the average error (Willmott, 1982). Therefore, in addition to using RMSE and MAPE as evaluation indicators in this study, the Index of Agreement (d) developed by Willmott is also introduced to evaluate how the simulated data is close to the measured data, and the larger the d is, the closer the former is to the latter (Rosso et al., 2018).
where
Figure 6 indicates that the measured and simulated air temperature and relative humidity of the three monitoring points have a high degree of coincidence. ENVI-met model is not able to simulate the impact of contingencies, such as heat waves from air conditioners in the afternoon that increase outdoor air temperature. Besides, cloud cover in the air is also an important factor affecting the ambient temperature.
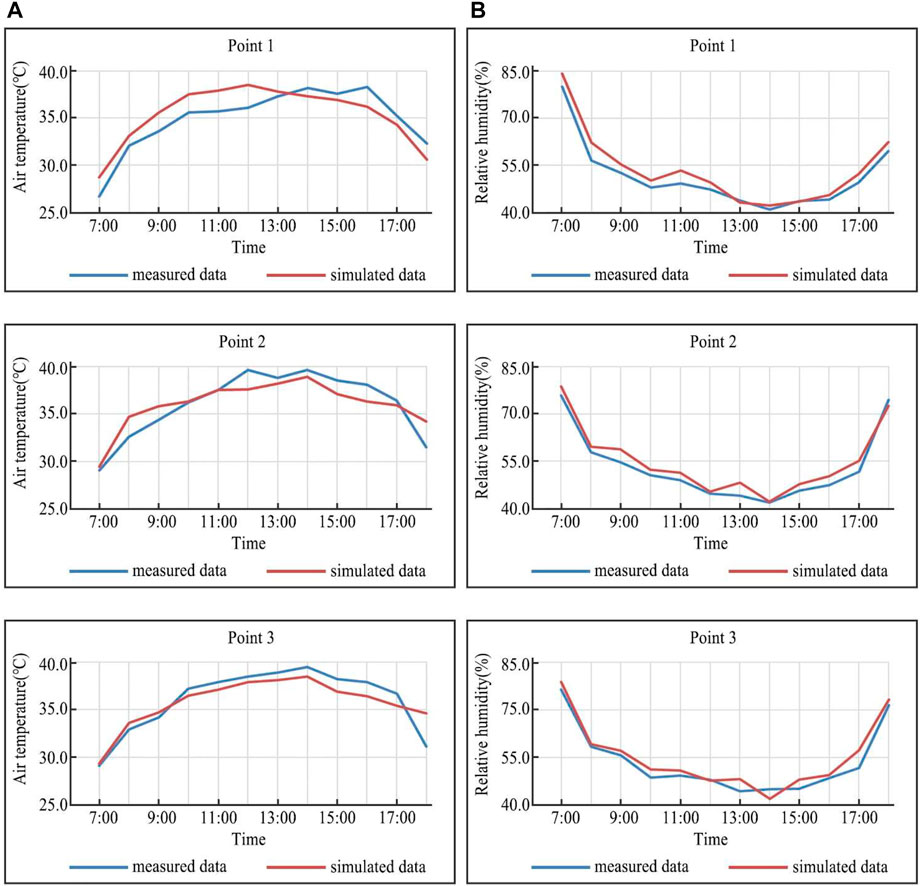
FIGURE 6. Comparisons of data measured at 1.5 m above the ground from three monitoring points and simulated data are used to verify the effectiveness of the ENVI-met software. (A) air temperature. (B) relative humidity.
Based on the measured and simulated data of each point, the accuracy of the ENVI-met simulation is analyzed, and the findings are that the temperature RMSEs of the three points are between 1.34–1.65°C, which fall in the generally accepted range of 0.52–4.30°C (Table 3). Humidity RMSEs are between 2.63%–2.94% and less than 5% (Rosso et al., 2018). The MAPEs of temperature and relative humidity are less than 10% (Chow et al., 2011; Salata et al., 2017). The Indexes of Agreement (d) are between 0.92–0.98, indicating that ENVI-met has a high simulation accuracy of outdoor temperature and relative humidity (Jiang et al., 2019).
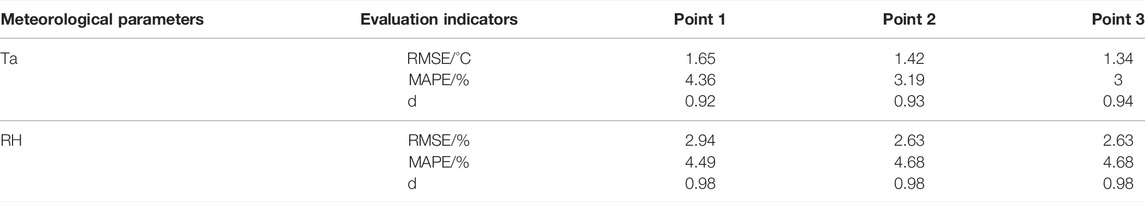
TABLE 3. The goodness of fit analysis of measured data and simulated data.
4 Results of Simulation
4.1 Time-Space Variation of Water Body Cooling Effect
The minimum ΔTmin and the average ΔTave of ΔT were calculated (Figure 7). Meanwhile, the cooling values within the 12 h of study were divided into eight intervals, to calculate the space proportion corresponding to each cooling value interval (Figure 8). Water bodies can reduce the ambient air temperature in summer, but produce a different cooling effect at different times.
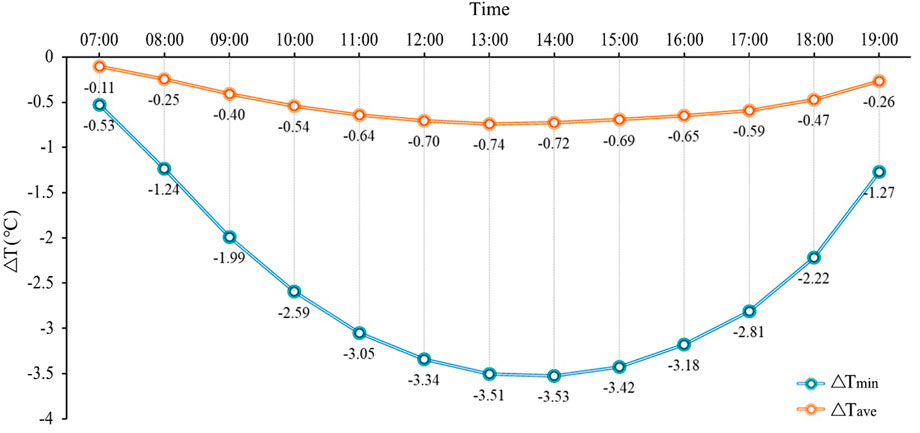
FIGURE 7. Time-space distribution of minimum and maximum water body cooling effect.
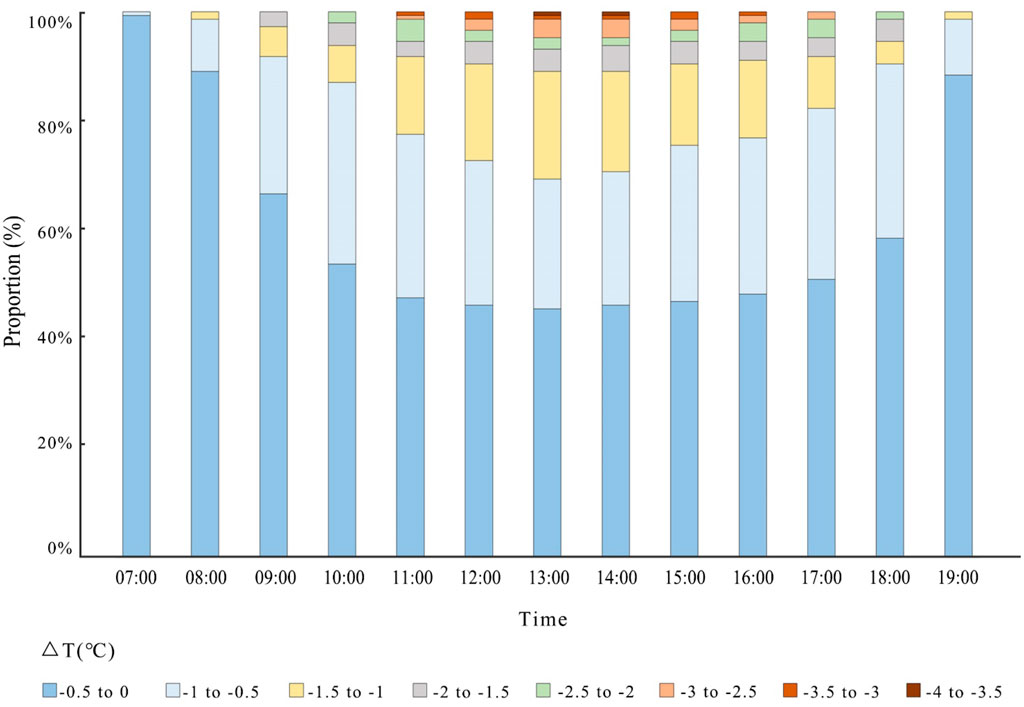
FIGURE 8. Time-space proportion of water body cooling effect.
Figure 7 pointed out during the 12 h, ΔTmin reached the minimum value of −3.53°C at 14:00 and the maximum value of −0.53°C at 7:00. ΔTave reached the minimum value of −0.74°C at 14:00 and the maximum value of −0.11°C at 7:00. According to the spatial and temporal distribution of ΔT in Figure 8, the cooling effect of water bodies varies with temperature. ΔT in 46%–99% of the area is from −0.5 to 0°C, that in 10%–33% of the area from −1°C to −0.5°C, and that in 4%–20% of the area from −1.5°C to −1°C. In a very limited area, the cooling value can vary by over 3°C. During the 12 h of the day, the cooling value in the afternoon is higher than that in the morning, reaching the highest during 12:00 and 15:00, which is precisely the hottest time of the day. This indicates that water bodies can significantly improve local thermal environment and play a cooling effect in summer.
Figure 9 shows that the cooling effect of water bodies gradually weakens towards the village center. This is because an increase in wind speed can enhance the vapor-cooling effect of water bodies, and the convective heat transfer between water bodies and the surrounding air can also enhance the cooling intensity. Due to the shielding of buildings, wind speed gradually decreases towards the village center, and so does the cooling intensity. This indicates that wind speed and direction have an impact on the cooling effect and range of water bodies, and the shielding of buildings accounts for the main reason affecting wind speed, and eventually compromises the cooling effect of water bodies.
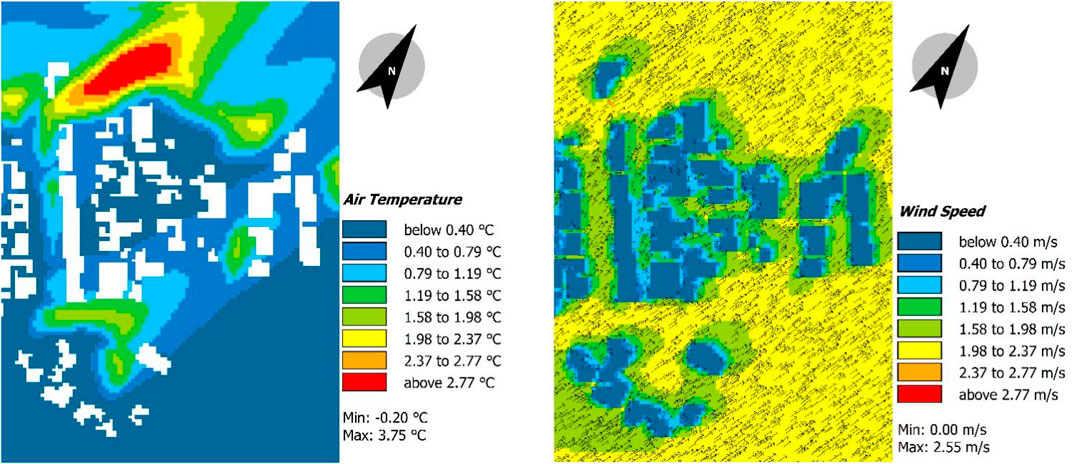
FIGURE 9. Air temperature (left) and wind speed (right) within the case study area at 14:00 on July 15.
4.2 Impact of Village Morphological Elements on Microclimate
Overall, water bodies have a cooling effect. To further reveal factors influencing village microclimate, ArcGIS software was used to map village morphological elements and analyze their correlation with temperature, humidity, and PET value of each monitoring point.
Table 4 shows the Pearson correlation coefficient (r) between the distance of different monitoring points to a water body and simulated data. The distance of each monitoring point to the water body is significantly correlated with air temperature, relative humidity, and PET value. The distance of the monitoring point to the water body is positively, and very significantly, correlated with PET value and air temperature, but negatively, and also significantly, correlated with relative humidity.
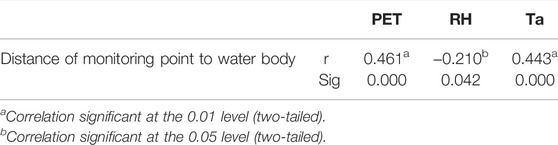
TABLE 4. Correlation coefficients between distance to the water body and simulated data.
Table 5 shows the Pearson correlation coefficient (r) between greening rate and simulated data within different buffer radiuses. Within a radius of 10m, the greening rate is significantly correlated with PET value but has no significant correlation with air temperature or relative humidity. Within a radius of 20 m, the greening rate is significantly correlated with PET value and relative humidity but has no significant correlation with air temperature. There is no significant correlation between greening rate and simulated data within other buffer radiuses. This may be explained by the limited green areas in the village, which are mainly concentrated near the water bodies.
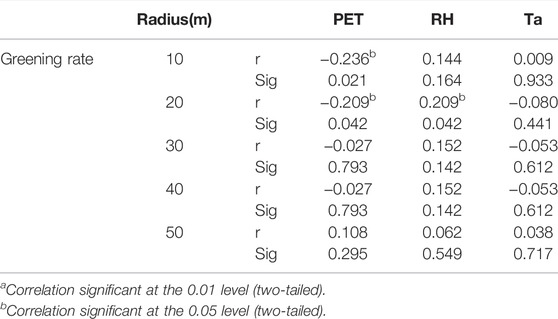
TABLE 5. Correlation coefficients between greening rate and simulated data within different buffer radiuses.
Table 6 shows the Pearson correlation coefficient (r) between building density and simulated data within different buffer radiuses. As can be seen from the table, building density is significantly positively correlated with PET value and air temperature, and significantly negatively correlated with relative humidity. Among all, the r between building density and PET value reaches the highest within a radius of 20 m, which is 0.61. The r of building density with relative humidity and air temperature reaches the highest within a radius of 30 m, which is −0.594 and 0.702, respectively.
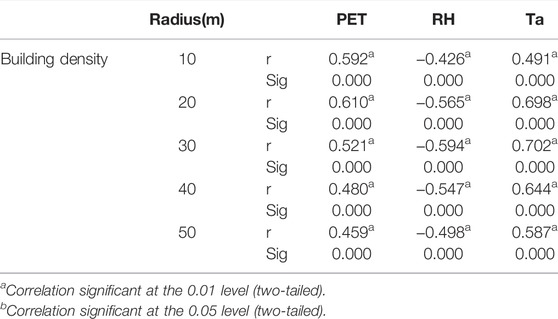
TABLE 6. Correlation coefficients between building density and simulated data within different buffer radiuses.
Table 7 shows the Pearson correlation coefficient (r) between water body rate and simulated data within different buffer radiuses. Water body rate is significantly negatively correlated with PET value and air temperature, and significantly positively correlated with relative humidity. Among all, the r between water body rate and PET value reaches the highest within a radius of 40 m, which is −0.513. The r with relative humidity and air temperature reaches the highest within a radius of 20m, which is −0.75 and 0.388, respectively.
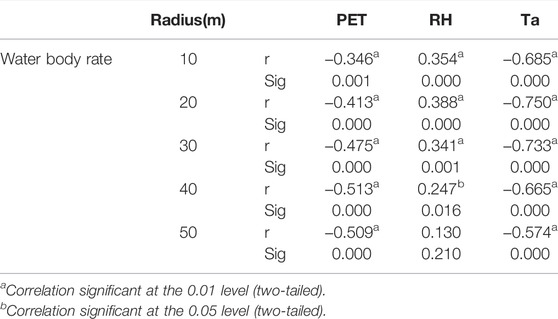
TABLE 7. Correlation coefficients between water body rate and simulated data within different buffer radiuses.
Table 8 shows the Pearson correlation coefficient (r) between man-made underlying surface ratio and simulated data within different buffer radiuses. Man-made underlying surface ratio is significantly positively correlated with PET value and air temperature, and significantly negatively correlated with relative humidity. Among all, the r of man-made underlying surface ratio with PET value reaches the highest within a radius of 40m, which is 0.269. The correlation of man-made underlying surface ratio with relative humidity and air temperature reaches the highest within a radius of 20 m, which is −0.56 and 0.502, respectively.
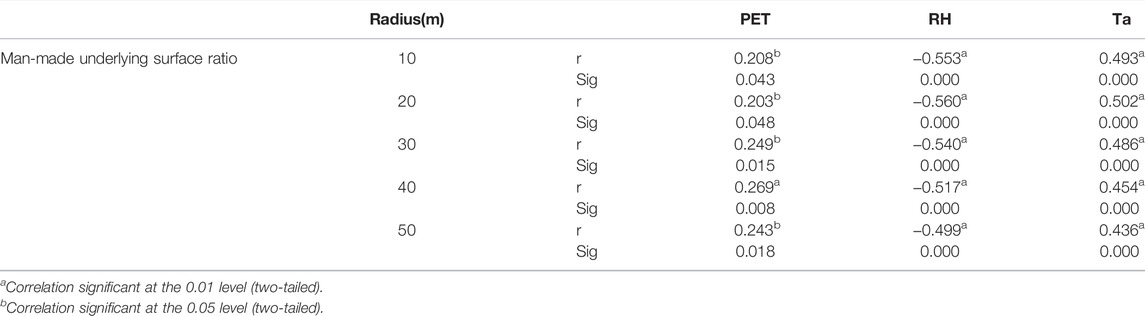
TABLE 8. Correlation coefficients between man-made underlying surface ratio and simulated data within different buffer radiuses.
5 Discussion
Analysis of the temporal and spatial variation of water body cooling effect shows that the cooling effect of water bodies in summer is stronger in the afternoon than in the morning, reaching the highest from 12:00 to 15:00. On the one hand, the cooling range and intensity decrease with the increase of distance; on the other hand, wind speed also constitutes an important factor influencing the cooling effect. The air temperature in the village center is generally higher than that outside, as increased building density will shield the wind, thus affecting the cooling effect of water bodies (Yang et al., 2020). Therefore, for developing and constructing Weizi settlements, living around the peripheral water sources is suggested for maximized cooling effect (Yang et al., 2019).
Analysis of building density, water body rate, greening rate, and man-made underlying surface shows less correlation between greening rate and microclimate than expected. This is probably because of the relatively small greening areas in Xufan Village, which are mainly concentrated on water banks, and the low greening rate in the village, where only a limited number of green plants grow on the roadside. At the same time, a significant correlation exists between water body rate and microclimate, which is consistent with the conclusion of Dachuan Shi et al. that greening and water body can co-produce a stronger cooling effect on microclimate than acting alone. Because greening space has less resistance to wind than architectural space (Shi et al., 2020; Yang et al., 2021). In general, the appropriate placement of greening space helps lower temperature and cool the surrounding environment (Tsuyoshi et al., 1985; Safikhani et al., 2014). In a hot and humid climate, different vegetations can bring different cooling effects, and overall, they positively affect local temperature (Richards et al., 2020).
The impact of man-made underlying surfaces on microclimate should not be ignored either (Li et al., 2021). The study shows the man-made underlying surface ratio has a significantly positive correlation with PET value and air temperature and a significantly negative correlation with relative humidity. One of the impacts of urbanization on villages is the large area of hard pavement, but the increase of hard pavement also leads to temperature rise. Therefore, village development should never merely aim at the aesthetic appearance of hard pavement, but more importantly, should consider its impact on microclimate (He et al., 2021; Xie et al., 2021; Yang et al., 2022).
This paper studies the cooling effect of water bodies and the impact of village morphological elements on microclimate, but still lacks sufficient study on different forms of water bodies. As there are various enclosure forms of water bodies in Weizi settlements, the impact of different enclosure forms on microclimate will be the focus of our future studies.
6 Conclusion
For traditional villages, a combined approach of both protection and development is not only the primary principle of survival and development but also a major challenge in the context of modernization and urbanization (Zhao and Wang, 2018). This study explains the ecological wisdom of the water-adaptive space in Weizi settlements and applies software simulation method in the discussion of the impact of water bodies and settlement forms on local microclimate. This study provides new ideas for the development of traditional Weizi settlements:
1) Water bodies have a significant impact on the microclimate of a Weizi settlement, so they should not be directly filled but instead protected and utilized scientifically and rationally.
2) The distance to the water body is negatively correlated with the cooling effect, so villages can be constructed around water bodies to maximize the cooling effect.
3) Water body rate and greening rate are positively correlated with thermal comfort while building density and man-made underlying surface are negatively correlated with thermal comfort. Therefore, increasing green plants near the village center, while reducing man-made underlying surface and building density can effectively improve microclimate and thermal comfort.
There are essential differences between countryside and cities and in the process of countryside development, we should not follow the aesthetics of urbanization by increasing hard paving which harms human thermal comfort. On the contrary, we should build a comfortable, healthy, and livable rural habitat based on local conditions and actual needs.
Data Availability Statement
The raw data supporting the conclusions of this article will be made available by the authors, without undue reservation.
Author Contributions
All authors contributed to the development of the research and the elaboration of this article. Specifically, conceptualization, YC, BH, and XL; methodology, YC and XL; software, ZZ and XT; validation, SL and ZW; investigation, YC, ZW, and XL; data curation, ZZ, SL, and XL; writing—original draft preparation, YC, ZZ, SL, ZW, and XL; writing—review and editing, YC, XT, XL, and BH; supervision, XL and BH; funding acquisition, XL and BH. All authors have read and agreed to the published version of the manuscript.
Funding
This research is funded by the National Natural Science Foundation of China (Grant No. 52108011); Guangzhou Philosophy and Social Science Planning 2022 Annual Project (Grant No. 2022GZQN14); China Postdoctoral Science Foundation (Grant No. 2021M701249); Department of Education of Guangdong Province (Grant No. 2021KTSCX004); Science and Technology Program of Guangzhou, China (Grant No. 202102020302); Department of Housing and Urban-Rural Development of Guangdong Province (Grant No. 2021-K2-305243); State Key Laboratory of Subtropical Building Science, South China University of Technology (Grant No. 2021ZB16 and Grant No. 2022ZA01).
Conflict of Interest
Author XL was employed by Architectural Design & Research Institute Co., Ltd.
The remaining authors declare that the research was conducted in the absence of any commercial or financial relationships that could be construed as a potential conflict of interest.
Publisher’s Note
All claims expressed in this article are solely those of the authors and do not necessarily represent those of their affiliated organizations, or those of the publisher, the editors and the reviewers. Any product that may be evaluated in this article, or claim that may be made by its manufacturer, is not guaranteed or endorsed by the publisher.
Acknowledgments
The authors thank the editors and the reviewers for their helpful recommendations for improving this article.
References
Cheng, B., Gou, Z., Zhang, F., Feng, Q., and Huang, Z. (2019). Thermal Comfort in Urban Mountain Parks in the Hot Summer and Cold Winter Climate. Sustain. Cities Soc. 51, 101756. doi:10.1016/j.scs.2019.101756
Cheng, Y., and Guo, W. (2015). An Analysis of the Principles that Create the Microclimate of Courtyards in Vernacular Houses Surrounded by Embankment (In Chinese). Archit. J. 70, 73.
Cheng, Y. (2009). Weizi Folk House in Western Anhui -- on the Construction Strategy of Traditional Architecture Adapting to the Climate (In Chinese). Sichuan Build. Sci. 35, 244–249. doi:10.3969/j.issn.1008-1933.2009.04.067
Chow, W. T. L., Pope, R. L., Martin, C. A., and Brazel, A. J. (2011). Observing and Modeling the Nocturnal Park Cool Island of an Arid City: Horizontal and Vertical Impacts. Theor. Appl. Climatol. 103, 197–211. doi:10.1007/s00704-010-0293-8
Cruz, J. A., Blanco, A. C., Garcia, J. J., Santos, J. A., and Moscoso, A. D. (2021). Evaluation of the Cooling Effect of Green and Blue Spaces on Urban Microclimate Through Numerical Simulation: A Case Study of Iloilo River Esplanade, Philippines. Sustain. Cities Soc. 74, 103184. doi:10.1016/j.scs.2021.103184
Gao, H., Wang, Y., Wang, S., Yi, L., and Fu, L. (2018). Studies on the Protection and Renewal of the Characteristics of Traditional Villages in the South of Henan Province——Take Xinyang Xihe Village as an Example (in Chinese). J. Xinyang Norm. Univ. Sci. Ed. 31, 687–692. doi:10.3969/j.issn.1003-0972.2018.04.033
Guo, Y., and Liu, Y. (2021). Poverty Alleviation Through Land Assetization and its Implications for Rural Revitalization in China. Land Use Policy 105, 105418. doi:10.1016/j.landusepol.2021.105418
He, B.-J., Wang, J., Zhu, J., and Qi, J. (2022). Beating the Urban Heat: Situation, Background, Impacts and the Way Forward in China. Renew. Sustain. Energy Rev. 161, 112350. doi:10.1016/j.rser.2022.112350
He, B.-J., Zhao, D., Xiong, K., Qi, J., Ulpiani, G., Pignatta, G., et al. (2021). A framework for Addressing Urban Heat Challenges and Associated Adaptive Behavior by the Public and the Issue of Willingness to Pay for Heat Resilient Infrastructure in Chongqing, China. Sustain. Cities Soc. 75, 103361. doi:10.1016/j.scs.2021.103361
He, B.-J., Zhu, J., Zhao, D.-X., Gou, Z.-H., Qi, J.-D., and Wang, J. (2019). Co-benefits approach: Opportunities for Implementing Sponge City and Urban Heat Island Mitigation. Land Use Policy 86, 147–157. doi:10.1016/j.landusepol.2019.05.003
Honjo, H., and Takakura, T. (1985). Analysis of Temperature Distribution of Urban Green Spaces Using Remote Sensing Data. J. Jpn. Inst. Landsc. Archit. 49, 299–304. doi:10.5632/jila1934.49.5_299
Jewitt, G. (2002). Can Integrated Water Resources Management Sustain the Provision of Ecosystem Goods and Services? Phys. Chem. Earth, Parts A/B/C 27, 887–895. doi:10.1016/S1474-7065(02)00091-8
Jiang, Y., Han, X., Shi, T., and Song, D. (2019). Microclimatic Impact Analysis of Multi-Dimensional Indicators of Streetscape Fabric in the Medium Spatial Zone. Ijerph 16, 952. doi:10.3390/ijerph16060952
Jin, H., Shao, T., and Zhang, R. (2017). Effect of Water Body Forms on Microclimate of Residential District. Energy Procedia 134, 256–265. doi:10.1016/j.egypro.2017.09.615
Kan, K. (2021). Creating Land Markets for Rural Revitalization: Land Transfer, Property Rights and Gentrification in China. J. Rural Stud. 81, 68–77. doi:10.1016/j.jrurstud.2020.08.006
Khan, A., Chatterjee, S., and Weng, Y. (2021). Simulating Microscale Thermal Interactions Using ENVI-met Climate Model. Urban Heat. Isl. Model. Trop. Clim. 2021, 179–213. doi:10.1016/B978-0-12-819669-4.00006-4
Li, B., Guo, W., Liu, X., Zhang, Y., Russell, P. J., and Schnabel, M. A. (2021). Sustainable Passive Design for Building Performance of Healthy Built Environment in the Lingnan Area. Sustainability 13, 9115. doi:10.3390/su13169115
Li, J., Yan, J., and Wang, J. (2019). Research Status of Rural Community Public Space in China and Related Reflections (In Chinese). City Plan. Rev. 43, 128–134. doi:10.11819/cpr20191115a
Li, Y., Zhang, X., Chen, Y., and Liu, Y. (2020). The Impact of Human Settlement Quality on Rural Development (In Chinese). China Popul. Environ. 30, 158–167. doi:10.12062/cpre.20200116
Lin, T.-P., and Matzarakis, A. (2008). Tourism Climate and Thermal Comfort in Sun Moon Lake, Taiwan. Int. J. Biometeorol. 52, 281–290. doi:10.1007/s00484-007-0122-7
Lopes, A., Remoaldo, B., Ribeiro, C., and Martín-Vide, D. (2021). Perceptions of Human Thermal Comfort in an Urban Tourism Destination - A Case Study of Porto (Portugal). Build. Environ. 205, 108246. doi:10.1016/j.buildenv.2021.108246
Ma, K., Tang, X., Ren, Y., and Wang, Y. (2019). Research on the Spatial Pattern Characteristics of the Taihu Lake “Dock Village” Based on Microclimate: A Case Study of Tangli Village. Sustainability 11, 368. doi:10.3390/su11020368
Matzarakis, A., and Mayer, H. (1997). Heat Stress in Greece. Int. J. Biometeorology 41, 34–39. doi:10.1007/s004840050051
Nikolova, I., Janssen, S., Vos, P., Vrancken, K., Mishra, V., and Berghmans, P. (2011). Dispersion Modelling of Traffic Induced Ultrafine Particles in a Street canyon in Antwerp, Belgium and Comparison with Observations. Sci. Total Environ. 412-413, 336–343. doi:10.1016/j.scitotenv.2011.09.081
Pacheco, R., Ordóñez, J., and Martínez, G. (2012). Energy Efficient Design of Building: A Review. Renew. Sustain. Energy Rev. 16, 3559–3573. doi:10.1016/j.rser.2012.03.045
Paramita, B., Fukuda, H., Perdana Khidmat, R., and Matzarakis, A. (2018). Building Configuration of Low-Cost Apartments in Bandung-Its Contribution to the Microclimate and Outdoor Thermal Comfort. Buildings 8, 123. doi:10.3390/buildings8090123
Park, J., Shin, Y., Kim, S., Lee, S.-W., and An, K. (2022). Efficient Plant Types and Coverage Rates for Optimal Green Roof to Reduce Urban Heat Island Effect. Sustainability 14, 2146. doi:10.3390/su14042146
Richards, D. R., Fung, T. K., Belcher, R. N., and Edwards, P. J. (2020). Differential Air Temperature Cooling Performance of Urban Vegetation Types in the Tropics. Urban For. Urban Green. 50, 126651. doi:10.1016/j.ufug.2020.126651
Rosso, F., Golasi, I., Castaldo, V. L., Piselli, C., Pisello, A. L., Salata, F., et al. (2018). On the Impact of Innovative Materials on Outdoor Thermal Comfort of Pedestrians in Historical Urban Canyons. Renew. Energy 118, 825–839. doi:10.1016/j.renene.2017.11.074
Safikhani, T., Abdullah, A. M., Ossen, D. R., and Baharvand, M. (2014). A Review of Energy Characteristic of Vertical Greenery Systems. Renew. Sustain. Energy Rev. 40, 450–462. doi:10.1016/j.rser.2014.07.166
Salata, F., Golasi, I., Petitti, D., de Lieto Vollaro, E., Coppi, M., and de Lieto Vollaro, A. (2017). Relating Microclimate, Human Thermal Comfort and Health During Heat Waves: An Analysis of Heat Island Mitigation Strategies Through a Case Study in an Urban Outdoor Environment. Sustain. Cities Soc. 30, 79–96. doi:10.1016/j.scs.2017.01.006
Sanusi, R., Johnstone, D., May, P., and Livesley, S. J. (2017). Microclimate benefits that Different Street Tree Species Provide to Sidewalk Pedestrians Relate to Differences in Plant Area Index. Landsc. Urban Plan. 157, 502–511. doi:10.1016/j.landurbplan.2016.08.010
Sayad, B., Alkama, D., Rebhi, R., Menni, Y., Ahmad, H., Inc, M., et al. (2021). Outdoor Thermal Comfort Optimization Through Vegetation Parameterization: Species and Tree Layout. Sustainability 13, 11791. doi:10.3390/su132111791
Shi, D., Song, J., Huang, J., Zhuang, C., Guo, R., and Gao, Y. (2020). Synergistic Cooling Effects (SCEs) of Urban Green-Blue Spaces on Local Thermal Environment: A Case Study in Chongqing, China. Sustain. Cities Soc. 55, 102065. doi:10.1016/j.scs.2020.102065
Su, Y., Zhao, Q., and Zhou, N. (2022). Improvement Strategies for Thermal Comfort of a City Block Based on PET Simulation- A case Study of Dalian, a Cold-Region City in China. Energy Build. 261, 111557. doi:10.1016/j.enbuild.2021.111557
Tsinghua University (2018). JGJ/T449-2018 Standard For Green Performance Calculation of Civil Buildings. (In Chinese) Beijing: China Construction Industry Press.
Willmott, C. J. (1982). Some Comments on the Evaluation of Model Performance. Bull. Amer. Meteor. Soc. 63, 1309–1313. doi:10.1175/1520-0477(1982)063<1309:scoteo>2.0.co;2
Xie, J., Sun, Y., Liu, X., Ding, Z., and Lu, M. (2021). Human Activities Introduced Degenerations of Wetlands (1975-2013) Across the Sanjiang Plain North of the Wandashan Mountain, China. Land 10, 1361. doi:10.3390/land10121361
Xu, S., Cheng, B., Huang, Z., and Shen, C. (2022). An Investigation on the Thermal Environment of Residential Courtyards in the Cold Area of Western Sichuan Plateau. Buildings 12, 49. doi:10.3390/buildings12010049
Yang, J., Ren, J., Sun, D., Xiao, X., Xia, J., Jin, C., et al. (2021). Understanding Land Surface Temperature Impact Factors Based on Local Climate Zones. Sustain. Cities Soc. 69, 102818. doi:10.1016/j.scs.2021.102818
Yang, J., Wang, Y., Xiao, X., Jin, C., Xia, J., and Li, X. (2019). Spatial Differentiation of Urban Wind and Thermal Environment in Different Grid Sizes. Urban Clim. 28, 100458. doi:10.1016/j.uclim.2019.100458
Yang, J., Wang, Y., Xiu, C., Xiao, X., Xia, J., and Jin, C. (2020). Optimizing Local Climate Zones to Mitigate Urban Heat Island Effect in Human Settlements. J. Clean. Prod. 275, 123767. doi:10.1016/j.jclepro.2020.123767
Yang, L., Liang, Y., He, B., Lu, Y., and Gou, Z. (2022). COVID-19Effects on Property Markets: The Pandemic Decreases the Implicit Price of Metro Accessibility. Tunn. Undergr. Space Technol. 125, 104528. doi:10.1016/j.tust.2022.104528
Zeng, Z., Zhou, X., and Li, L. (2017). The Impact of Water on Microclimate in Lingnan Area. Procedia Eng. 205, 2034–2040. doi:10.1016/j.proeng.2017.10.082
Zhang, S., Xiao, H., and Liu, Y. (2009). Analysis of the Relationship Between Ecological Environment and Water Environment (In Chinese). Yellow River 31, 3–4+7. doi:10.3969/j.issn.1000-1379.2009.08.002
Zhao, Y., and Wang, J. (2018). Research on the Traditional Rural Settlements Planning Based on Morphological Integration: The Application of Performance-Based Planning Techniques. (In Chinese) City Plan. Rev. 42, 33–40+53. doi:10.11819/cpr20181105a
Keywords: water bodies, water-sensitive design, microclimate, thermal comfort, ENVI-met, rural revitalization
Citation: Cheng Y, Liu X, Zeng Z, Liu S, Wang Z, Tang X and He B-J (2022) Impacts of Water Bodies on Microclimates and Outdoor Thermal Comfort: Implications for Sustainable Rural Revitalization. Front. Environ. Sci. 10:940482. doi: 10.3389/fenvs.2022.940482
Received: 10 May 2022; Accepted: 15 June 2022;
Published: 14 July 2022.
Edited by:
Jianhong Xia, Curtin University, AustraliaReviewed by:
Andong Guo, Zhejiang University, ChinaDahao Zhang, Sun Yat-sen University, China
Decheng Zhou, Nanjing University of Information Science and Technology, China
Copyright © 2022 Cheng, Liu, Zeng, Liu, Wang, Tang and He. This is an open-access article distributed under the terms of the Creative Commons Attribution License (CC BY). The use, distribution or reproduction in other forums is permitted, provided the original author(s) and the copyright owner(s) are credited and that the original publication in this journal is cited, in accordance with accepted academic practice. No use, distribution or reproduction is permitted which does not comply with these terms.
*Correspondence: Xiao Liu, xiaoliu@scut.edu.cn; Bao-Jie He, baojie.he@cqu.edu.cn
†These authors have contributed equally to this work and share first authorship