Defining Quantitative Targets for Topsoil Organic Carbon Stock Increase in European Croplands: Case Studies With Exogenous Organic Matter Inputs
 Elisa Bruni1*
  Bertrand Guenet2
  Hugues Clivot3
  Thomas Kätterer4
  Manuel Martin5
  Iñigo Virto6
  Claire Chenu7
- 1Laboratoire des Sciences du Climat et de l’Environnement, LSCE/IPSL, CEA-CNRS-UVSQ, Université Paris-Saclay, Gif-sur-Yvette, France
- 2LG-ENS (Laboratoire de Géologie) – CNRS UMR 8538 – École Normale Supérieure, PSL University – IPSL, Paris, France
- 3Université de Reims Champagne Ardenne, INRAE, FARE, UMR A 614, Reims, France
- 4Department of Ecology, Swedish University of Agricultural Sciences, Uppsala, Sweden
- 5INRA Orléans, InfoSolUnit, Orléans, France
- 6Departamento de Ciencias, IS-FOOD, Universidad Pública de Navarra, Pamplona, Spain
- 7Ecosys, INRA-AgroParisTech, Université Paris-Saclay, Campus AgroParisTech, Thiverval-Grignon, France
The EU Mission Board for Soil Health and Food proposed a series of quantitative targets for European soils to become healthier. Among them, current soil organic carbon (SOC) concentration losses in croplands (0.5% yr−1 on average at 20 cm depth) should be reversed to an increase of 0.1–0.4% yr−1 by 2030. Quantitative targets are used by policy makers to incentivize the implementation of agricultural practices that increase SOC stocks. However, there are different approaches to calculate them. In this paper, we analyzed the effect of exogenous organic matter (EOM) inputs on the evolution of SOC stocks, with a particular focus on the new European targets and the different approaches to calculate them. First, we illustrated through two case-study experiments the different targets set when the SOC stock increase is calculated considering as reference: 1) the SOC stock level at the onset of the experiment and 2) the SOC stock trend in a baseline, i.e., a control treatment without EOM addition. Then, we used 11 long-term experiments (LTEs) with EOM addition in European croplands to estimate the amount of carbon (C) input needed to reach the 0.1 and 0.4% SOC stock increase targets proposed by the Mission Board for Soil Health and Food, calculated with two different approaches. We found that, to reach a 0.1 and 0.4% increase target relative to the onset of the experiment, 2.51 and 2.61 Mg C ha−1 yr−1 of additional C input were necessary, respectively. Reaching a 0.1 and 0.4% increase target relative to the baseline required 1.38 and 1.77 Mg C ha−1 yr−1 of additional input, respectively. Depending on the calculation method used, the estimated amounts of additional C input required to reach each quantitative target were significantly different from each other. Furthermore, the quality of C input as represented by the C retention rate of the additional organic material (EOM and crop residue), had a significant effect on the variation of SOC stocks. Our work highlights the necessity to take into consideration the additional C input required to increase SOC stocks, especially for soils with decreasing SOC stocks, when targets are set independently of the baseline.
Introduction
Land based agricultural activities contribute globally to greenhouse gases (GHG) emissions with approximately 6.2 Gt carbon dioxide equivalents (CO2eq) each year (including non-food use of agricultural products and excluding emissions associated to land use change) (IPCC, 2019). Improved management practices have the potential to reduce the impact of agriculture on GHG emissions (Smith et al., 1997), and additionally to sequester carbon (C) from the atmosphere through increased soil organic carbon (SOC) stocks (Lal, 2008; Minasny et al., 2017). The potential of agricultural soils to both mitigate climate change and increase food security through improved soil quality [e.g., increased soil fertility and water retention (Lal, 2008)], has been an issue in numerous political agendas for years. It finally gained an international breakthrough in 2015, with the 4 per 1000 initiative proposed at the COP21 (Minasny et al., 2017). The name of the initiative comes from the idea that an increase of SOC stocks of 0.4% (i.e., 4‰) yr−1 in the first 30–40 cm of the soil could, at least partially, compensate for the CO2 emissions from fossil fuel burning. More recently, the Mission Board for Soil Health and Food of the European Union (EU) proposed a series of quantitative targets for European soils to become healthier. Among them, current SOC concentration losses in croplands (calculated in the first 20 cm of the soil from the LUCAS survey as being 0.5% yr−1 on average) should be reversed to an increase of 0.1–0.4% yr−1 by 2030 (Veerman et al., 2020). It is important to note that SOC concentration losses can result in no changes or even increases in SOC stocks when soil bulk density (BD) increases. Veerman et al. (2020) refer to SOC concentration losses. However, to avoid confusion, we point out that the aimed target in order to have a climate mitigation benefit, should refer to SOC stock increases (i.e., amount of C per hectare).
Management practices that potentially increase SOC stocks include, among others, cover cropping, improved crop rotations, agroforestry systems, converting cropland to grassland, and adding fertilizers and organic amendments to the soil (Chenu et al., 2019; Soussana et al., 2019; Bolinder et al., 2020). Although this latter does not contribute to sequester CO2 from the atmosphere, adding exogenous organic matter (EOM) can improve soil quality. For instance, through increased water retention and soil fertility (Reeves, 1997; Robertson et al., 2014), EOM may reduce soil erosion and increase crop productivity, indirectly enhancing a virtuous C cycle. That is, by increasing crop productivity, plants’ CO2 fixation is enhanced and higher amounts of crop residue might be left on the soil, increasing the C input and hence the SOC stocks.
Farm-level payments can be used to incentivize the adoption of practices that increase SOC stocks. Payments can be action-based or result-based. Action-based schemes reward farmers for implementing agricultural practices that potentially increase SOC stocks. In contrast, the payment of result-based schemes is contingent upon the achievement of a certain measurable result (European Commission, 2021). Policy makers tend to prefer result-based incentives because the use of funds is more directly linked to the benefit they provide. In this context, it is necessary to set quantitative SOC stock increase targets in order to measure, report and verify the achieved results, and to define a reference against which the SOC stock increase is calculated.
Pellerin et al. (2019) and Soussana et al. (2019) illustrated a 0.4% SOC stock increase target, calculated against a baseline of reference or independently of it, in a set of theoretical examples. On the one hand, setting the target of SOC stocks independently of a baseline, i.e., considering the SOC stocks at the onset of the implementation of an improved practice (that is, at time t0) as the reference, requires the measurement of SOC stocks only at t0. However, if SOC stocks are not at steady-state, the rate of increase required to reach the target will depend on the SOC stock trend previous to the implementation of the improved practice (Soussana et al., 2019). In this case, the pressure will be set on soils with degrading SOC stocks, because the rate at which they will have to increase will be higher than soils with stable or increasing stocks (Soussana et al., 2019). On the other hand, increasing SOC stocks relative to a baseline means that the rate of increase to reach the target will be fixed, i.e., independent of the previous SOC stock trend. However, to fix the target it is necessary to collect data on the previous SOC stock trend for at least 5–10 years, which is considered the minimum duration to derive a trend in SOC stocks (Pellerin et al., 2019). For this reason, a large-scale deployment of this latter approach is not straightforward since each SOC storing practice must be associated with a control treatment and this adds complexity to land management.
Topsoil OC stocks are often decreasing in cropland soils in Europe (Goidts and van Wesemael, 2007; Saffih-Hdadi and Mary, 2008; Fernández-Ugalde et al., 2011; Meersmans et al., 2011; Sanderman et al., 2017; Clivot et al., 2019; Veerman et al., 2020). However, opposite examples exist. For instance, SOC stocks (at 15–20 cm depth) are increasing in Swedish cropland due to the presence of more perennial forage crops (Poeplau et al., 2015). In this context, calculating a quantitative target of SOC stocks’ increase independently of the baseline seems more appropriate, since it puts the priority on the restoration of degraded soils (Soussana et al., 2019). This is particularly relevant considering the land degradation neutrality (LDN) target of the United Nation Convention to Combat Desertification (UNCCD) (Soussana et al., 2019) and the recently adopted European Green New Deal, which aims to bring the EU (27 countries) to climate-neutrality by 2050.
Although some agricultural practices such as reduced tillage may decrease C outputs from the soil through decreased SOC mineralization rates (Powlson et al., 2012; Haddaway et al., 2016), there is a general consensus that the most efficient way to increase SOC stocks is to increase C inputs to the soil (Virto et al., 2012; Autret et al., 2016; Fujisaki et al., 2018). Increasing SOC stocks independently of the baseline means that additional efforts to increase C inputs will be necessary in soils with decreasing trends. The amount of additional C input required to increase SOC stocks by 0.1 and 0.4% yr−1 (as targeted by the Mission Board for Soil Health and Food, Veerman et al., 2020), relative to the baseline or independently from it, has not been quantified yet.
In this study, we estimated the amount of C input required to reach the 0.1 and 0.4% SOC stock increase targets to 20–30 cm depth, calculated with two different approaches, for 11 cropland long-term experiments (LTEs) of additional EOM inputs, located in France and Sweden. We hypothesized that reaching the quantitative targets calculated independently of the baseline would require higher C inputs relative to the same targets calculated against a baseline with decreasing SOC stocks. We also hypothesized that the quality of the EOM would have an impact on the SOC stock change. We used the largely available data on LTEs with EOM treatments as an example that can be expanded to other practices. For other practices such as agroforestry systems or cover cropping, however, one should correct the statistical relationship between C input and SOC stocks, since the C input quality is not the same as for EOM.
Materials and Methods
Experimental Sites
We analyzed SOC stock data from 11 long-term cropland experiments in France and Sweden. Each experiment consisted of one control treatment [with or without nitrogen (N) inputs], and one or several treatments of EOM addition (i.e., different types of animal manure, green compost, sewage sludge, peat and sawdust). The total number of treatments with additional EOM was 33, with an average C input from additional organic material of 1.86 Mg C ha−1 yr−1 (1.46 Mg C ha−1 yr−1 from EOM inputs and 0.40 Mg C ha−1 yr−1 from additional crop residue input due to increased crop growth, relative to the control treatment) and a median of 1.84 Mg C ha−1 yr−1. The duration of the experiments varied between 9 and 53 years, with an average of 19 years and a median of 16 years (Table 1). The experiments were established in the period between 1956 and 2013. EOM inputs were applied at different frequencies and quantities and the evolution of SOC stocks (at 20–30 cm depth) over time relative to a control treatment without any EOM addition was monitored. Plant inputs to the soil were transformed to C input via allometric functions, following the Bolinder method (Bolinder et al., 2007) and its adaptation to French cropland experiments from Clivot et al. (2019) [see also its application to European cropland experiments in Bruni et al. (2021)]. The Bolinder method uses yields’ measurements and crop-specific coefficients (i.e., the harvest index and the shoot-to-root ratio), to allocate the C to the aboveground and belowground part of the plant (Bolinder et al., 2007). If not specified otherwise, mean annual surface temperature and precipitation were derived from an hourly global climate dataset at 0.5° (GSWP3 http://hydro.iis.u-tokyo.ac.jp/GSWP3/). Average annual surface temperature of the experiments ranged from 5.7°C (in Ultuna) to 12.8°C (in La Jaillière 2), with an average 11.3°C surface temperature across the sites (Table 1). Mean annual rainfall was 881.7 mm across the experiments, with a minimum of 541.9 mm yr−1 in Ultuna and a maximum of 1314.5 mm yr−1 in Trévarez. The experiments were all under arable use during the study period and, most of them, had a long-term arable history (Levavasseur et al., 2020; Clivot et al., 2019; Kätterer et al., 2011) (for details, see Supplementary Table S1). All treatments were rainfed. French sites underwent conventional tillage, with deep ploughing performed almost every year, in addition to some superficial tillage operations (Supplementary Table S1). At Ultuna, tillage was performed with a spade at 20 cm depth. Cropping systems were cereal-dominated rotations (Triticum aestivum, Zea mays, Hordeum vulgare and Avena sativa) (Supplementary Table S1). In particular, three were cereal monocultures of silage Zea mays (Champ Noël 3, Le Rheu 1 and Le Rheu 2); four sites had rotations of different cereals (Triticum aestivum and silage or grain Zea mays in Crécom 3, Feucherolles, La Jaillière 2 and Avrillé); and the other sites rotated cereal crops with root crops (Beta vulgaris fodder beet, Brassica napus fodder rape and Brassica napus Swedish turnip), oilseed crops (Brassica napus) and silage Zea mays. Straw residue was partially or totally incorporated into the soil (Supplementary Table S1), except in Ultuna, where all aboveground residues were removed. Champ Noël 3, Crécom 3, La Jaillière 2, Le Rheu 1 and Trévarez received optimal amounts of mineral N fertilizers both in the control and in the EOM treatments, while the other experiments did not receive any N inputs. EOM treatments included: cow manure (12 treatments); 1 treatment where different types of farmyard manure were mixed together; compost (6 treatments, including 2 treatments of biowaste compost, 2 treatments of green manure mixed with sewage sludge, 1 treatment of household waste and 1 treatment of green manure); pig manure (6 treatments, including 2 treatments of composted pig manure and 1 treatment of pig slurry); poultry manure (3 treatments, including one treatment of composted poultry manure); sewage sludge (2 treatments); 1 treatment of straw residue incorporation; 1 peat treatment; and 1 sawdust treatment. Sources of green manure and straw residue, and animal species are specified in Supplementary Table S1.
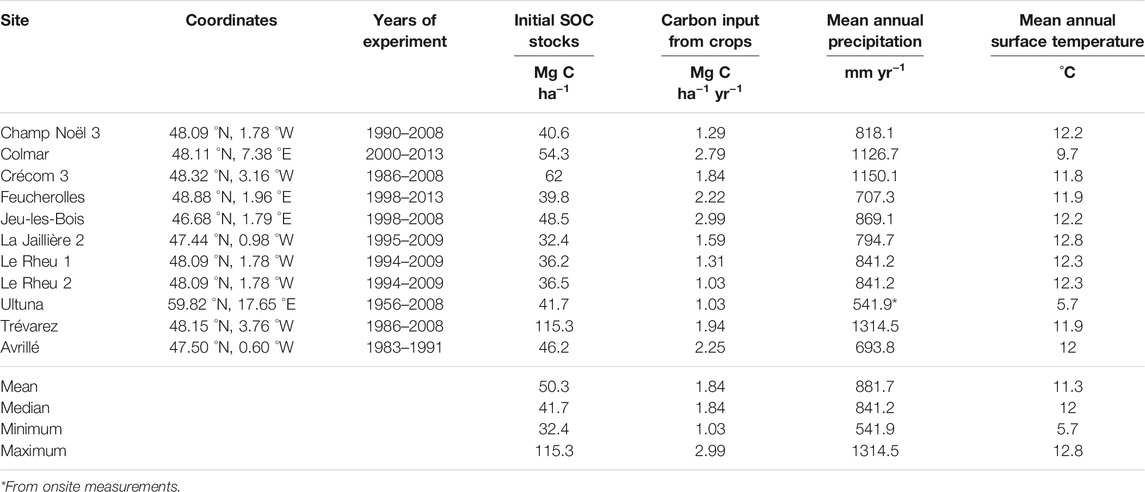
TABLE 1. Characterization of the control treatments at the long-term experiments (LTEs). Mean annual surface temperature and precipitation were derived from an hourly global climate dataset at 0.5° (GSWP3 http://hydro.iis.u-tokyo.ac.jp/GSWP3/).
Soil Samples
Soils were sampled between 0–20 and 0–30 cm depth (Table 2) in 3–4 replicated plots (plot sizes for each treatment are listed in Supplementary Table S1). The SOC stocks were calculated using (Eq. 1) (Poeplau et al., 2017):
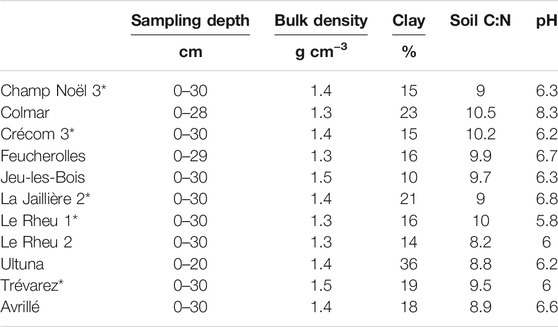
TABLE 2. Soil properties for the minerally unfertilized and fertilized* control treatments at the beginning of the experiment. More information on the experiments can be found in Clivot et al. (2019), Kätterer et al. (2011), Levavasseur et al. (2020) and Bruni et al. (2021).
where SOC (%) is soil organic carbon content and BD is the bulk density (Table 2). Multiple BD measurements were performed over time at Ultuna, Colmar and Feucherolles. Significant changes of BD with time were found for Ultuna and Feucherolles, while BD remained constant in Colmar and was assumed to be constant for all other sites (i.e., only one measurement of BD was performed). SOC stocks were thus calculated at a fixed soil depth for these sites. Clay content varied between 10 and 36%. Soil pH ranged from 5.8 to 8.3 (Table 2).
Statistical Analysis
It is well established that SOC does not accumulate indefinitely but eventually reaches a steady-state (i.e., under constant conditions, C inputs and C outputs eventually outbalance each other and SOC is approximately stable). Hence, SOC accumulation can be represented by an asymptotic curve (Poulton et al., 2018). However, a linear approximation holds well for short periods of time (Arrouays et al., 2002). Since we were studying a relatively short-term period (i.e., 30 years), we analyzed the simulation of SOC stocks’ evolution in each treatment with a linear regression (see Supplementary Figure S1) and obtained an average coefficient of determination (R2) of 0.59. This can be written as Eq. 2:
Where SOC is the soil organic carbon stock in Mg C ha−1, m is the slope coefficient, b the intercept, t is time (i.e. the number of years since the beginning of the experiment).
We evaluated the effect of total C input on the evolution of SOC stocks, calculated with two approaches (T0 and B, see Eqs 4, 5). We used a linear mixed effect model, with an interaction effect between the quantity and the quality of the total C input. The quality was expressed through the C retention coefficient of the exogenous C input, which represents the proportion of exogenous C that is incorporated into SOC and is not mineralized within 1 year. Values for the C retention coefficient were taken from Levavasseur et al. (2020) and Clivot et al. (2019) for each EOM and crop type (Supplementary Table S1). The authors derived this coefficient by optimizing the “h” parameter of the AMG model, a multi-compartmental SOC model that simulates the dynamics of SOC (Andriulo et al., 1999). Parameter “h” was derived by fitting time series of differences in SOC stocks between EOM treatments and controls (Levavasseur et al., 2020). Thus, the C input quality factor (i.e., the C retention coefficient) expresses numerically the quality of the crop species and EOM input of the treatment. Since C input in each treatment came from multiple sources with different C retention coefficients (i.e., aboveground plant material, belowground plant material and EOM inputs),
With
To test the significance of differences between C input quantities to reach the 0.1 and 0.4% targets (calculated with T0 or B approaches) at the experimental sites, one-way ANOVA combined with post-hoc tests (Bonferroni) and Student’s t tests were applied. Normal distribution of the data was tested with a Shapiro-Wilks normality test.
Calculating a 0.1 and 0.4% Soil Organic Carbon Stock Increase Target
The increase of SOC stocks can be calculated 1) relative to the value of the SOC stocks at the onset of the study period (i.e. at t0) or 2) relative to a baseline, i.e., the SOC stock trend of a control treatment. Assuming that we want to increase SOC stocks by 0.1% or 0.4% each year, the first approach (T0) can be written as Eq. 4:
Where
Where
Results
Effect of the Target Calculation Approach: Two Case Studies
We applied the two approaches described above (i.e., Eq. 4 for T0 and Eq. 5 for B) to two case study LTEs with very different SOC stock dynamics in their control treatment, to illustrate how different SOC stock increase targets are set. The first case study was the 23 years old experiment Crécom 3, where SOC stocks in the first 30 cm are approximately at steady-state (Figure 1A) (i.e., over time, fresh C inputs to the soil compensate SOC losses by decomposition and SOC stocks can be approximated with a constant line). This site, located in northwestern France, has a control treatment with an annual SOC stock change of −0.06% (correlation coefficient of the regression line between SOC stocks and time, R2 = 0.04). The slope coefficient of the correlation between SOC stocks and time in the control treatment was −0.038
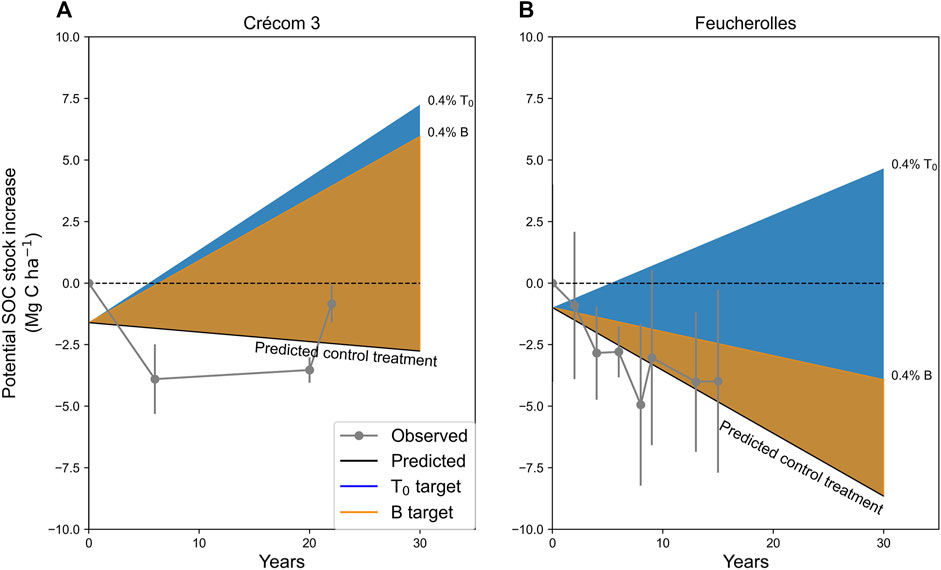
FIGURE 1. Theoretical soil organic carbon (SOC) stock evolution needed to reach an average annual 0.4% SOC stock increase for 30 years, based on two calculation methods (T0 and B, calculated with Eq. 4 and Eq. 5, respectively) for (A) Crécom 3 and (B) Feucherolles (detailed demonstration available in Appendix A). Observed SOC stocks (at 0–30 and 0–29 cm depth, respectively) and predicted SOC stocks (with a linear regression) for the control treatments are normalized against initial SOC stocks.
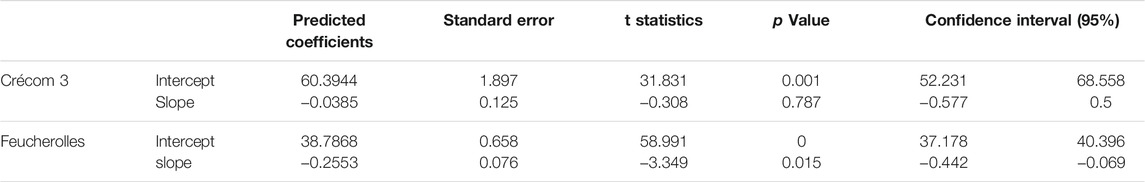
TABLE 3. Predicted coefficients of the linear regressions of soil organic carbon (SOC) stock changes with time, for the Crécom 3 (0–30 cm) and Feucherolles (0–29 cm) control treatments.
The Importance of Considering the Baseline
In Figure 1, we illustrate the theoretical SOC stock increase imposed by a 0.4% target calculated with T0 (Eq. 4) (blue colored area) and B (Eq. 5) (orange colored area). Outcomes are different whether the control treatment’s trend is at steady-state (Figure 1A) or not (Figure 1B). If SOC stocks in the control treatment are approximately stable (e.g., Crécom 3), calculating the 0.4% increase with Eqs 4 or 5 sets similar targets of SOC stock increases. In both cases, the SOC stocks after 30 years of implementation of the storing practice have to be higher than the initial SOC stock level. If SOC stocks in the control treatment are not at steady-state (Figure 1A), the two approaches result in different SOC stock increase targets. If SOC stocks are decreasing, we can see from Figure 1B that the target based on B allows increasing SOC stocks relative to the control treatment. However, SOC stocks are still decreasing (though at a weaker rate than the baseline, since the SOC stock target increase was set against the baseline).
To summarize, B (relative to the baseline) sets fixed targets for soils with decreasing, stable or increasing SOC stocks, but does not guarantee to have a net increase of SOC stocks after n years. On the contrary, T0 (relative to SOC stocks at t0) imposes both stable and decreasing SOC stocks to increase (accruing SOC stocks have to increase only if their rate of increase is lower than the target rate). However, in this case, soils with decreasing SOC stocks have to increase at a much higher rate. Note that we showed the theoretical results for two case studies for illustrative purposes. However, these results are generalizable to any soil with stable or decreasing SOC stocks that can be approximated with a linear regression (Appendix A).
Supplementary Table S2 shows the predicted annual average CO2 fluxes at the control treatments of all the 11 experimental sites, considering SOC stock changes over 30 years relative to t0, and the potential annual average CO2 fluxes at the virtual treatments that would allow to reach the 0.1 and 0.4%, T0 and B targets, over 30 years. We can see that all control treatments were emitting CO2 to the atmosphere (1.63
Temporal Changes in Topsoil Organic Carbon Stocks at the Long-Term Experiments
Concerning all the 11 LTEs, in the control treatments SOC stocks were decreasing by 0.98
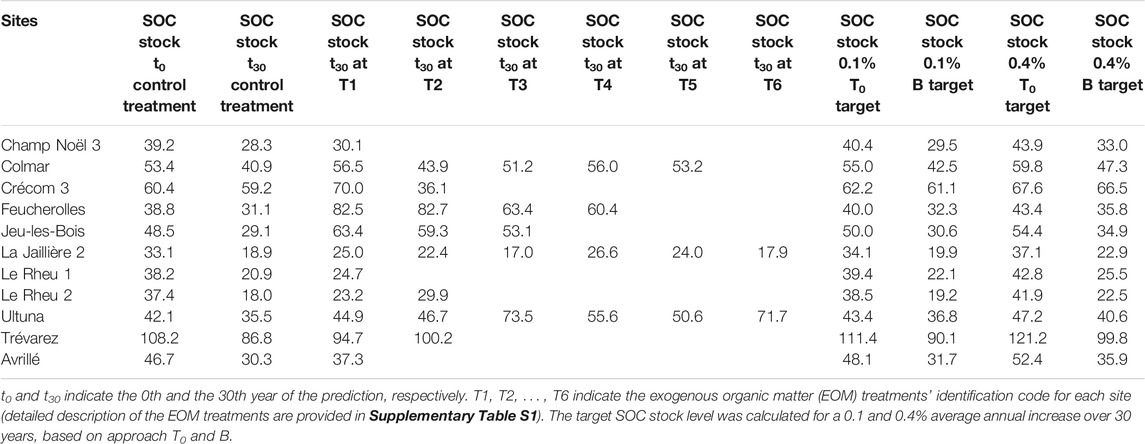
TABLE 4. Predicted soil organic carbon (SOC) stocks (Mg C ha−1) of the experimental sites.
Amount of Additional Carbon Input Needed to Reach the 0.1 and 0.4% Soil Organic Carbon Stocks Increase Targets
The increase in SOC stocks at 20–30 cm depth was positively correlated to the additional C input from EOM and increased crop growth (R2 = 0.71) (Figure 2). Figure 2 shows the relationship between additional C input and SOC stock increase, highlighting the levels of C input in the treatments where the 0.1 and 0.4% targets were reached, according to T0 and B. Table 5 shows the additional C input in the treatments where both the 0.1 and 0.4% increase target were reached, or not. We found that the amount of additional C in the group of treatments that reached a 0.1% T0 target was significantly different (p
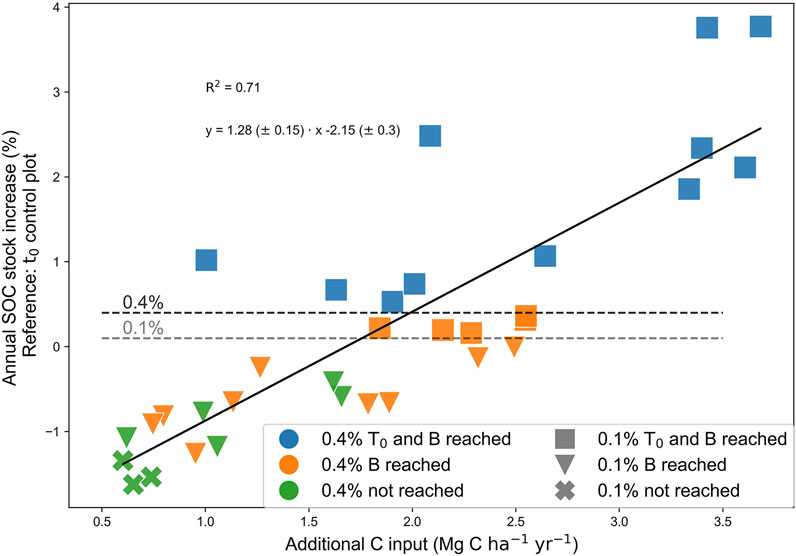
FIGURE 2. Correlation between annual soil organic carbon (SOC) stock increase (%) (at 20–30 cm depth) and additional carbon (C) input in the exogenous organic matter (EOM) treatments (Mg C ha−1 yr−1). Different colors indicate whether the 0.4% SOC stock increase target was reached, based on the different approaches used to calculate the target (blue indicates that both 0.4% T0 and 0.4% B targets were reached, orange indicates that 0.4% B was reached and green indicates that no 0.4% target was reached). Different symbols indicate whether the 0.1% SOC stock increase target was reached, based on the different approaches used (squares indicate that both 0.1% T0 and 0.1% B targets were reached, inverse triangles indicate that 0.1% B was reached and crosses indicate that no target was reached). SOC stock increase was calculated relative to the first year of experiment in the control treatment. Additional C input consisted of EOM inputs and additional C from increased crop growth, relative to the control treatment.
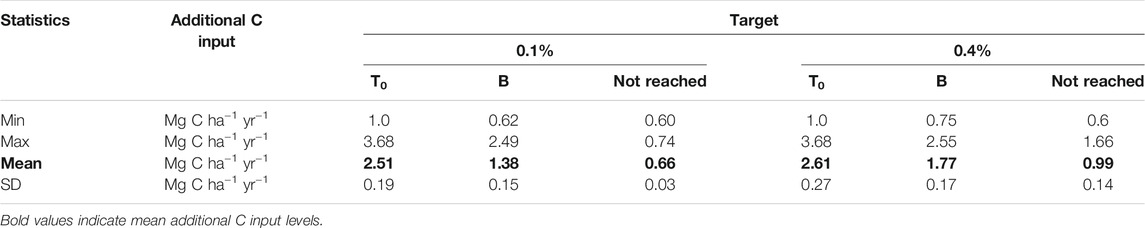
TABLE 5. Amount of additional carbon (C) input (Mg C ha−1 yr−1) (relative to the C input in the control treatment) that increased soil organic carbon (SOC) stocks by 0.1 and 0.4% yr−1 on average for 30 years, according to T0 and B. Additional C input refers to exogenous organic matter (EOM) inputs plus C input from increased crop growth relative to the control treatment.
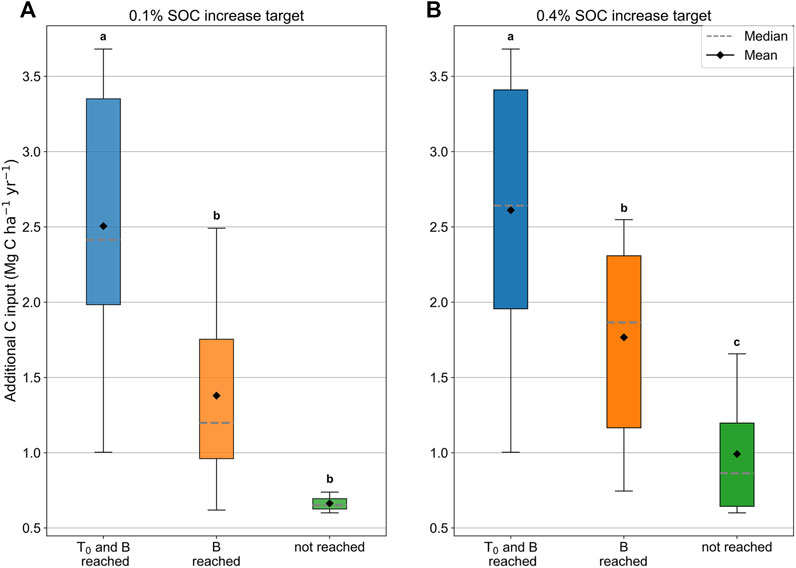
FIGURE 3. Additional carbon (C) input (Mg C ha−1 yr−1) relative to the control treatment for groups of treatments where: (A) 0.1% T0 and B targets were reached or not, (B) 0.4% T0 and B targets were reached or not. Boxes extend from the lower to the upper quartile values of the data, with a line at the median and a spot at the mean. Whiskers show the range of the data and points past the end of the whiskers are flier points. Groups within the same panel with different lowercase letters are significantly different (p ≤ 0.05) from each other.
Effect of the Quality of Carbon Input on the Variation of Soil Organic Carbon Stocks
We found that the quantity of C input and the quality of C input (i.e., the C retention coefficient) both had an effect on the increase of SOC stocks (p
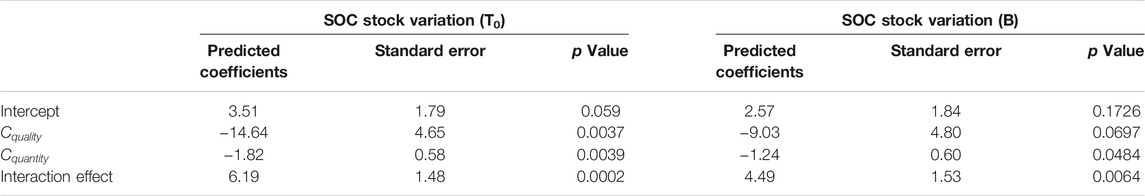
TABLE 6. Results of the linear mixed effect model of Eq. 3.
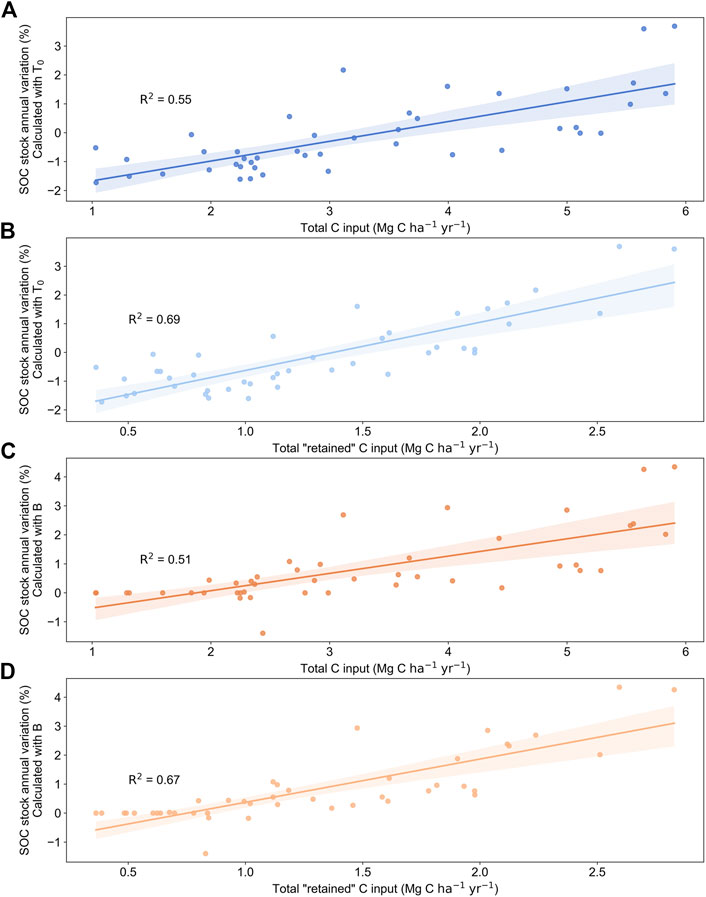
FIGURE 4. Relationship between soil organic carbon (SOC) stock annual variation (%) and 1) total carbon (C) input (Mg C ha−1 yr−1) [panel (A) and (C)]; 2) retained C input (Mg C ha−1 yr−1) [panel (B) and (C)]. Retained C inputs were calculated as the total C input, multiplied by the C retention coeffcient for each C input quality (Supplementary Table S1). The SOC stock annual variation was calculated with T0 [panel (A) and (B)] and with B [panel (C) and (D)].
Discussion
Reaching Targets of Soil Organic Carbon Stock Increase to 20–30 cm Depth
We compared two approaches to calculate the increase of SOC stocks. One, where the control was the SOC stock at the onset of the experiment (Eq. 4), and one, where the control was the trend of the SOC stocks in the control treatment (Eq. 5). Both can be used to set quantitative targets for the implementation of SOC stock increasing practices, in the context of result-based incentives. The two case studies of Crécom 3 and Feucherolles illustrated that the two approaches set different targets, depending on the initial state of the SOC stocks due to previous practices. In particular, if SOC stocks are declining in the control treatment, a target calculated against a baseline (B), might not be sufficient to induce a net positive SOC storage after implementation of the improved practice. In contrast, the T0 target will guarantee decreasing SOC stocks to reverse their trend. However, reaching such target requires the implementation of practices that supply sufficient levels of additional C input (e.g., from EOM and crop residue inputs).
Note that, in Supplementary Table S2, we provided the potential annual average CO2 storage rates, in case any of the targets were reached, over 30 years, at the 11 LTEs. However, this supposes that the improved management practice contributes to CO2 sequestration (e.g., by enhancing photosynthesis via the introduction of cover cropping or agroforestry systems). In fact, adding EOM inputs to the soil does not sequester CO2 from the atmosphere, since EOMs contain C that was already fixed and is only redistributed elsewhere. Nonetheless, many authors have shown that adding EOM inputs to the soil does increase SOC stocks (e.g., Maillard and Angers, 2014; Li et al., 2021). Hence, C from this atmospheric CO2 fixation will still be sequestered in soils for a given time period. In the 11 LTEs studied, the majority of EOM input treatments increased SOC stocks by 0.1 and 0.4% yr−1 on average for 30 years, relative to the baseline situation where no additional EOM was added to the soil (target B). However, we found that the increase of SOC stocks from additional EOM treatments was not sufficient to reach a 0.1% or 0.4% SOC stock target relative to the initial SOC stocks after 30 years (target T0), unless very high amounts of C input were added to the soil. That is, 2.51 Mg C ha−1 yr−1 for a 0.1% T0 target and 2.61 Mg C ha−1 yr−1 for a 0.4% T0 target over 30 years, considering total additional C input, and 1.84 and 1.95
Additionally, we found that the quality of the C input, as expressed by its C retention coefficient, had a main significant effect on the SOC stocks’ increase only when this was calculated against t0. This is probably due to the lower target set by B, and because almost any quantity of EOM input increased SOC stocks compared to a reference situation where SOC stocks were decreasing (see Table 4). However, we found that the interaction effect between C input quantity and quality was significant for both calculation approaches. This means that not only the quantity but also the quality of the C input has a significant effect on the SOC stock increase. The relevance of adequately determining the mineralization and C retention coefficients of EOMs for accurate estimations of their long-term effects on soil fertility and SOC stocks is well known, as recently summarized by Levavasseur et al. (2022). The work from Levavasseur et al. (2022) provides evidence from controlled laboratory experiments that some sources of EOM after application remain in soils in higher proportions over time. For example, they found that composts generally had a lower C mineralization rate compared to other EOMs, such as sewage sludges and animal residues (e.g., animal manures and anaerobic digestates) (Levavasseur et al., 2022). That is, on average only 33% of added composts were mineralized within 1 year, while the fraction of readily mineralized EOM in the first year was: 34% for digestates, 52% for livestock manures and 50% for sewage sludges. This can be expected since the composting process converts biodegradable organic matter into more stable organic materials.
The evolution of the retained C input with time (i.e., the amount of C input multiplied by its associated C retention coefficient over time), together with the evolution of the measured and predicted SOC stocks over the experiments’ length can be found in Supplementary Figure S2, for each treatment. Because the number of SOC stock measures in time was small in the majority of the treatments, it was not possible to assess correctly the cross-correlation between retained C input and measured SOC stocks with time. Using the predicted SOC stocks (see Eq. 2) instead of measured SOC stocks, we found that the average R2 between retained C input and predicted SOC stocks was 0.17. While our results suggested that the average SOC stock change rates depended on the quality of the C input, more experiments with frequent SOC stock measures would be needed to assess the temporal effect of the quality of C input on SOC stocks. More frequent SOC stock measures would also allow to predict SOC stock trends with more reliability and avoid overfitting the data. This was the case in Crécom 3 T2 and Jeu-les-Bois treatments, where only two measures of SOC stocks with time were available. Furthermore, a higher number of treatments with similar qualities of C input would be necessary to assess the effect of “categories” of C inputs (e.g., cow manures, composted cow manures and sewage sludges) on SOC stocks.
Reaching the 0.1 and 0.4% Targets in European Croplands
The Mission Board for Soil Health and Food (Veerman et al., 2020) reported that 23% of European soils have low SOC concentration and declining SOC stocks in the top 20 cm, almost all being under agricultural use. Panagos et al. (2020) estimated that arable land has experienced a SOC stock loss, at the same depth, of about 0.06% between 2009/2012 and 2015 (LUCAS JRC). This loss amounts to 0.5% yr−1 in soils that were under cropland at both survey dates (i.e., 2009/2012 and 2015), with a large variability of the SOC stock variation across the database (Hiederer, 2018; Veerman et al., 2020). In the LTEs analyzed here, SOC stocks in the control treatments (including both fertilized and unfertilized controls) were decreasing on average by 0.98
It is important to note that we used EOM treatments as a study case, since we had access to data from 11 LTEs where SOC stocks (at 20–30 cm depth) and C input were monitored, over 9–53 years. However, large scale additional increases in SOC stocks through EOM management in Europe are unlikely because EOM are already applied to soils (Foged et al., 2011; Zhang et al., 2017; Soussana et al., 2019). Moreover, although EOM inputs improve soil fertility and soil health, they are not per se a climate mitigation measure. In fact, adding EOM inputs to the soil does not sequester additional CO2 from the atmosphere but it redistributes spatially C that is already fixed and can be stabilized in the soil. In the experiments analyzed, EOM inputs were spread on the soil surface. Hence, the major effects on SOC stocks can be expected in topsoil layers. Although there might be an impact of the addition of EOM inputs at deeper soil layers because of advection or bioturbation processes, deeper soil layers were not considered because data on the biological activity or on deeper SOC were not available.
Our results, together with the recent work from Levavasseur et al. (2022), show that the quality of the additional C input is critical to increase SOC stocks. Strategies to enhance SOC stocks should increase the quality of the EOM brought to soils, as well as redistributing EOMs from lands with high EOM inputs to croplands that do not have sufficient EOMs (Asai et al., 2014; Aillery et al., 2018). The cost associated to the transportation of EOMs is often a limit to the distance at which they are commuted. A study from Asai et al. (2014) reported that the maximum distance covered from the majority of farmers involved in manure exchange in Denmark ranged between 1 and 5 km. Although the distance was higher for organic farmers, the majority of them still hauled less than 10 km. Also, transporting EOM induces GHG emissions that might offset the benefits of increased SOC stocks.
Our results show that SOC stock increase targets in cropland soils might be feasible using sufficient amounts of C input (i.e., between 1.38 and 2.61 Mg C ha−1 yr−1 on average, according to the 11 LTEs analyzed, and depending on the calculation method used) and supposing that SOC variations are linearly controlled by C input. Such linear relationships remain to be established for other agricultural practices that provide additional C input to the soil, such as cover crops, improved crop rotations, temporary leys and agroforestry (Soussana et al., 2019). For instance, Cardinael et al. (2018) estimated that, in an agroforestry system in Southern France, 2.73 additional Mg C ha−1 yr−1 from vegetation, litterfall, and crop residues increased SOC stocks by 0.45% yr−1 for 18 years up to 30 cm depth, compared to an agricultural control treatment. This is similar to our results with EOM treatments in the first 20–30 cm depth, suggesting that a 0.4% target might be feasible with the implementation of other practices, such as agroforestry systems. To predict with more confidence the potential of different qualities of C input to increase SOC stocks, other LTEs with such practices should be considered. For example, Wiesmeier et al. (2020) identified cover cropping and agroforestry systems as the practices with the highest potential to increase SOC stocks up to 40 cm depth in Bavaria, compared to current land management. However, they estimated that a 0.4% SOC stock increase target was not possible in that region.
Conclusion
In the 11 cropland LTEs analyzed, reaching quantitative targets of SOC stock increase required significantly different amounts of additional C input, whether the targets were calculated against the initial level of SOC stocks or against a baseline practice (i.e., a control treatment with or without mineral fertilizer inputs and without any EOM, where SOC stocks were mainly decreasing). Incentives to implement agricultural practices that increase SOC stocks should take into consideration that higher C inputs are required for soils with decreasing SOC stocks, if quantitative targets of SOC stock increase are calculated regardless of the current SOC stock trends. Since EOM inputs are already widely applied in European croplands, future works should analyze the effect of C input on SOC stocks in LTEs, considering the implementation of other practices (e.g., agroforestry systems and cover cropping, which are also able to sequester additional CO2 from the atmosphere). Strategies to implement a portfolio of agricultural practices that allow increasing SOC stocks should be considered to reach the Mission Board for Soil Health and Food’s targets by 2030.
Data Availability Statement
Data owners maintain and can access the data. Requests to access these datasets should be directed to them (i.e. Thomas Kätterer for Swedish experiment and Annie Duparque for French experiments).
Author Contributions
EB performed the calculations and prepared the manuscript with contributions from all co-authors. HC, TK, IV, and MM provided the data.
Funding
This work benefited from the French state aid managed by the ANR under the “Investissements d’avenir” programme with the reference ANR-16-CONV-0003 (CLAND project).
Conflict of Interest
The authors declare that the research was conducted in the absence of any commercial or financial relationships that could be construed as a potential conflict of interest.
Publisher’s Note
All claims expressed in this article are solely those of the authors and do not necessarily represent those of their affiliated organizations, or those of the publisher, the editors and the reviewers. Any product that may be evaluated in this article, or claim that may be made by its manufacturer, is not guaranteed or endorsed by the publisher.
Acknowledgments
The Colmar and Feucherolles field experiments form part of the SOERE-PRO (network of long-term experiments dedicated to the study of impacts of organic waste product recycling) certified by ALLENVI (Alliance Nationale de Recherche pour l’Environnement) and integrated as a service of the “Investment for future” infrastructure AnaEE-France, overseen by the French National Research Agency (ANR-11-INBS-0001).
Supplementary Material
The Supplementary Material for this article can be found online at: https://www.frontiersin.org/articles/10.3389/fenvs.2022.824724/full#supplementary-material
References
Aillery, F., Antoni, V., Aouir, C., Arnaud, M., Bonnet, A., Besancon, M., et al. (2018). Environnement & Agriculture - Les Chiffres Clés – Édition 2018. Paris, France: Le service de la donnée et des études statistiques (SDES), 124pp.
Andriulo, A., Mary, B., and Guerif, J. (1999). Modelling Soil Carbon Dynamics with Various Cropping Sequences on the Rolling Pampas. Agronomie 19, 365–377. doi:10.1051/agro:19990504
Arrouays, D., Balesdent, J., Germon, J. C., Jayet, P. A., Soussana, J. F., and Stengel, P. (Editors)(2002). Mitigation of the greenhouse effect. Increasing carbon stocks in French agricultural soils? An assessment report compiled by the French Institute for Agricultural Research (INRA) on the request of the French Ministry for Ecology and Sustainable Development, 32
Asai, M., Langer, V., and Frederiksen, P. (2014). Responding to Environmental Regulations through Collaborative Arrangements: Social Aspects of Manure Partnerships in Denmark. Livestock Sci. 167, 370–380. doi:10.1016/j.livsci.2014.07.002
Autret, B., Mary, B., Chenu, C., Balabane, M., Girardin, C., Bertrand, M., et al. (2016). Alternative Arable Cropping Systems: A Key to Increase Soil Organic Carbon Storage? Results from a 16 Year Field experiment. Agric. Ecosyst. Environ. 232, 150–164. doi:10.1016/j.agee.2016.07.008
Bolinder, M. A., Crotty, F., Elsen, A., Frac, M., Kismányoky, T., Lipiec, J., et al. (2020). The Effect of Crop Residues, Cover Crops, Manures and Nitrogen Fertilization on Soil Organic Carbon Changes in Agroecosystems: a Synthesis of Reviews. Mitig Adapt Strateg. Glob. Change 25, 929–952. doi:10.1007/s11027-020-09916-3
Bolinder, M. A., Janzen, H. H., Gregorich, E. G., Angers, D. A., and VandenBygaart, A. J. (2007). An Approach for Estimating Net Primary Productivity and Annual Carbon Inputs to Soil for Common Agricultural Crops in Canada. Agric. Ecosyst. Environ. 118, 29–42. doi:10.1016/j.agee.2006.05.013
Bruni, E., Guenet, B., Huang, Y., Clivot, H., Virto, I., Farina, R., et al. (2021). Additional Carbon Inputs to Reach a 4 Per 1000 Objective in Europe: Feasibility and Projected Impacts of Climate Change Based on Century Simulations of Long-Term Arable Experiments. Biogeosciences 18 (13), 3981–4004. doi:10.5194/bg-2020-489
Cardinael, R., Guenet, B., Chevallier, T., Dupraz, C., Cozzi, T., and Chenu, C. (2018). High Organic Inputs Explain Shallow and Deep SOC Storage in a Long-Term Agroforestry System - Combining Experimental and Modeling Approaches. Biogeosciences 15, 297–317. doi:10.5194/bg-15-297-2018
Chenu, C., Angers, D. A., Barré, P., Derrien, D., Arrouays, D., and Balesdent, J. (2019). Increasing Organic Stocks in Agricultural Soils: Knowledge Gaps and Potential Innovations. Soil Tillage Res. 188, 41–52. doi:10.1016/j.still.2018.04.011
Clivot, H., Mouny, J.-C., Duparque, A., Dinh, J.-L., Denoroy, P., Houot, S., et al. (2019). Modeling Soil Organic Carbon Evolution in Long-Term Arable Experiments with AMG Model. Environ. Model. Softw. 118, 99–113. doi:10.1016/j.envsoft.2019.04.004
European Commission (2021). “Operationalising an EU Carbon Farming Initiative,” in Executive Summary (Luxembourg: Publications Office of the European Union). doi:10.2834/594818
Fernández-Ugalde, O., Virto, I., Barré, P., Gartzia-Bengoetxea, N., Enrique, A., Imaz, M. J., et al. (2011). Effect of Carbonates on the Hierarchical Model of Aggregation in Calcareous Semi-arid Mediterranean Soils. Geoderma 164, 203–214. doi:10.1016/j.geoderma.2011.06.008
Foged, H. L., Flotats, X., Bommatí, A., and Palatsi, J. (2011). Inventory of Manure Processing Activities in Europe. European Commission. ENV.B.1/ETU/2010/0007.
Fujisaki, K., Chapuis-Lardy, L., Albrecht, A., Razafimbelo, T., Chotte, J.-L., and Chevallier, T. (2018). Data Synthesis of Carbon Distribution in Particle Size Fractions of Tropical Soils: Implications for Soil Carbon Storage Potential in Croplands. Geoderma 313, 41–51. doi:10.1016/j.geoderma.2017.10.010
Goidts, E., and van Wesemael, B. (2007). Regional Assessment of Soil Organic Carbon Changes under Agriculture in Southern Belgium (1955-2005). Geoderma 141, 341–354. doi:10.1016/j.geoderma.2007.06.013
Haddaway, N. R., Hedlund, K., Jackson, L. E., Kätterer, T., Lugato, E., Thomsen, I. K., et al. (2016). How Does Tillage Intensity Affect Soil Organic Carbon? A Systematic Review Protocol. Environ. Evid. 5, 1. doi:10.1186/s13750-016-0052-0
Hiederer, R. (2018). Data Evaluation of LUCAS Soil Component Laboratory Data for Soil Organic Carbon. Luxembourg: Publications Office of the European Union, 63pp.
IPCC (Forthcoming2019). Summary for Policymakers. In Climate Change and Land: an IPCC special report on climate change, desertification, land degradation, sustainable land management, food security, and greenhouse gas fluxes in terrestrial ecosystems. Editors P.R. Shukla, J. Skea, E. Calvo Buendia, V. Masson-Delmotte, H.-O. Pörtner, D. C. Robertset al. .
Kätterer, T., Bolinder, M. A., Andrén, O., Kirchmann, H., and Menichetti, L. (2011). Roots Contribute More to Refractory Soil Organic Matter Than Above-Ground Crop Residues, as Revealed by a Long-Term Field experiment. Agric. Ecosyst. Environ. 141, 184–192. doi:10.1016/j.agee.2011.02.029
Lal, R. (2008). Carbon Sequestration. Phil. Trans. R. Soc. B 363, 815–830. doi:10.1098/rstb.2007.2185
Levavasseur, F., Lashermes, G., Mary, B., Morvan, T., Nicolardot, B., Parnaudeau, V., et al. (2022). Quantifying and Simulating Carbon and Nitrogen Mineralization from Diverse Exogenous Organic Matters. Soil Use Manage. 38, 411–425. doi:10.1111/sum.12745
Levavasseur, F., Mary, B., Christensen, B. T., Duparque, A., Ferchaud, F., Kätterer, T., et al. (2020). The Simple AMG Model Accurately Simulates Organic Carbon Storage in Soils after Repeated Application of Exogenous Organic Matter. Nutr. Cycl Agroecosyst 117, 215–229. doi:10.1007/s10705-020-10065-x
Li, X., Zhu, W., Xu, F., Du, J., Tian, X., Shi, J., et al. (2021). Organic Amendments Affect Soil Organic Carbon Sequestration and Fractions in Fields with Long-Term Contrasting Nitrogen Applications. Agric. Ecosyst. Environ. 322, 107643. doi:10.1016/j.agee.2021.107643
Maillard, É., and Angers, D. A. (2014). Animal Manure Application and Soil Organic Carbon Stocks: A Meta-Analysis. Glob. Change Biol. 20, 666–679. doi:10.1111/gcb.12438
Meersmans, J., Van Wesemael, B., Goidts, E., Van Molle, M., De Baets, S., and De Ridder, F. (2011). Spatial Analysis of Soil Organic Carbon Evolution in Belgian Croplands and Grasslands, 1960-2006. Spat. Anal. Soil Org. Carbon Evol. 17, 466–479. doi:10.1111/j.1365-2486.2010.02183.x
Minasny, B., Malone, B. P., McBratney, A. B., Angers, D. A., Arrouays, D., Chambers, A., et al. (2017). Soil Carbon 4 Per Mille. Geoderma 292, 59–86. doi:10.1016/j.geoderma.2017.01.002
Panagos, P., Ballabio, C., Scarpa, S., Borrelli, P., Lugato, E., and Montanarella, L. (2020). European Commission, and Joint Research Centre: Soil Related Indicators to Support Agro-Environmental Policies: Soil Erosion Soil Carbon Soil Nutrients and Fertility. Luxembourg: Publications Office of the European Union.
Pellerin, S., Bamière, L., Denis, A., Béline, F., Benoit, M., Butault, J.-P., et al. (2019). Stocker du carbone dans les sols français, Quel potentiel au regard de l’objectif 4 pour 1000 et à quel coût ? Synthèse du rapport d’étude. France: INRA, 114.
Poeplau, C., Bolinder, M. A., Eriksson, J., Lundblad, M., and Kätterer, T. (2015). Positive Trends in Organic Carbon Storage in Swedish Agricultural Soils Due to Unexpected Socio-Economic Drivers. Biogeosciences 12, 3241–3251. doi:10.5194/bg-12-3241-2015
Poeplau, C., Vos, C., and Don, A. (2017). Soil Organic Carbon Stocks Are Systematically Overestimated by Misuse of the Parameters Bulk Density and Rock Fragment Content. SOIL 3 (1), 61–66. doi:10.5194/soil-3-61-2017
Poulton, P., Johnston, J., Macdonald, A., White, R., and Powlson, D. (2018). Major Limitations to Achieving "4 Per 1000" Increases in Soil Organic Carbon Stock in Temperate Regions: Evidence from Long-Term Experiments at Rothamsted Research, United Kingdom. Glob. Change Biol. 24, 2563–2584. doi:10.1111/gcb.14066
Powlson, D. S., Bhogal, A., Chambers, B. J., Coleman, K., Macdonald, A. J., Goulding, K. W. T., et al. (2012). The Potential to Increase Soil Carbon Stocks through Reduced Tillage or Organic Material Additions in England and Wales. A case study 146, 23–33. doi:10.1016/j.agee.2011.10.004
Reeves, D. W. (1997). The Role of Soil Organic Matter in Maintaining Soil Quality in Continuous Cropping Systems. Soil Tillage Res. 43, 131–167. doi:10.1016/S0167-1987(97)00038-X
Robertson, G. P., Gross, K. L., Hamilton, S. K., Landis, D. A., Schmidt, T. M., Snapp, S. S., et al. (2014). Farming for Ecosystem Services: An Ecological Approach to Production Agriculture. Ecol. Approach Prod. Agric. 64, 404–415. doi:10.1093/biosci/biu037
Saffih-Hdadi, K., and Mary, B. (2008). Modeling Consequences of Straw Residues export on Soil Organic Carbon. Soil Biol. Biochem. 40, 594–607. doi:10.1016/j.soilbio.2007.08.022
Sanderman, J., Hengl, T., and Fiske, G. J. (2017). Soil Carbon Debt of 12,000 Years of Human Land Use. Proc. Natl. Acad. Sci. USA 114, 9575–9580. doi:10.1073/pnas.1706103114
Smith, P., Powlson, D., Glendining, M., and Smith, J. (1997). Potential for Carbon Sequestration in European Soils: Preliminary Estimates for Five Scenarios Using Results from Long-Term Experiments. Glob. Change Biol. 3, 67–79. doi:10.1046/j.1365-2486.1997.00055.x
Soussana, J.-F., Lutfalla, S., Ehrhardt, F., Rosenstock, T., Lamanna, C., Havlík, P., et al. (2019). Matching Policy and Science: Rationale for the ‘4 Per 1000 - Soils for Food Security and Climate’ Initiative. Soil Tillage Res. 188, 3–15. doi:10.1016/j.still.2017.12.002
Veerman, C., Correia, T. P., Bastioli, C., Biro, B., Bouma, J., Cienciala, E., et al. (2020). Caring for Soil Is Caring for Life. Luxembourg: Publications Office of the European Union. doi:10.2777/821504
Virto, I., Barré, P., Burlot, A., and Chenu, C. (2012). Carbon Input Differences as the Main Factor Explaining the Variability in Soil Organic C Storage in No-Tilled Compared to Inversion Tilled Agrosystems. Biogeochemistry 108, 17–26. doi:10.1007/s10533-011-9600-4
Wiesmeier, M., Mayer, S., Burmeister, J., Hübner, R., and Kögel-Knabner, I. (2020). Feasibility of the 4 Per 1000 Initiative in Bavaria: A Reality Check of Agricultural Soil Management and Carbon Sequestration Scenarios. Geoderma 369, 114333. doi:10.1016/j.geoderma.2020.114333
Zhang, B., Tian, H., Lu, C., Dangal, S. R. S., Yang, J., and Pan, S. (2017). Global Manure Nitrogen Production and Application in Cropland during 1860–2014: A 5 Arcmin Gridded Global Dataset for Earth System Modeling. Earth Syst. Sci. Data 9, 667–678. doi:10.5194/essd-9-667-2017
Appendix A Generalization of the Targets’ Comparison
Demonstration that T0 target is always higher than B target if SOC stocks in a control treatment are decreasing and approximated with a linear regression.
Imagine that a control treatment can be approximated by a linear regression. Then, it can be written as Eq. A1:
Where:
The relative slope (i.e., the slope of the SOC stocks, relative to the first year of SOC stocks in the control treatment) can be written as Eq. A2:
If we suppose that the control treatment has a decreasing SOC stock trend, this means that the slope (
From Eqs 4, 5 we derive the targets set, based on T0 (i.e.,
Since
Similarly, we can demonstrate that T0 target is equal to B target if SOC stocks in the control treatment are at steady-state and approximated with a linear regression.
If SOC stocks are at steady-state,
Keywords: soil organic carbon, 4 per 1000, exogenous organic matter, agriculture, Europe 2030 targets, climate change
Citation: Bruni E, Guenet B, Clivot H, Kätterer T, Martin M, Virto I and Chenu C (2022) Defining Quantitative Targets for Topsoil Organic Carbon Stock Increase in European Croplands: Case Studies With Exogenous Organic Matter Inputs. Front. Environ. Sci. 10:824724. doi: 10.3389/fenvs.2022.824724
Received: 30 November 2021; Accepted: 19 January 2022;
Published: 14 February 2022.
Edited by:
Rosa Francaviglia, Council for Agricultural and Economics Research (CREA), ItalyReviewed by:
Matthias Kaestner, Helmholtz Association of German Research Centres (HZ), GermanyKlaus Lorenz, The Ohio State University, United States
Copyright © 2022 Bruni, Guenet, Clivot, Kätterer, Martin, Virto and Chenu. This is an open-access article distributed under the terms of the Creative Commons Attribution License (CC BY). The use, distribution or reproduction in other forums is permitted, provided the original author(s) and the copyright owner(s) are credited and that the original publication in this journal is cited, in accordance with accepted academic practice. No use, distribution or reproduction is permitted which does not comply with these terms.
*Correspondence: Elisa Bruni, elisa.bruni@lsce.ipsl.fr