Calculation of inter-provincial differences in the appropriate proportioning of land transfer income to support rural revitalization
 Yubo Wang*
  Yuyu Xue
- School of Humanities and Law, Northeastern University, Shenyang, Liaoning
This research examined the suitability and regional differences of the distribution ratio of land transfer income aimed at supporting rural revitalization by calculating the distribution ratio of 31 provincial-level administrative divisions (abbreviated as 31PLAD), while providing a reference template for land transfer incomes. Herein, we collated and calculated the fiscal expenditure of five dimensions of each province (city, district) in 2005, 2010, 2015, and 2020, and then predicted the situation of the next period (that is, 2025) using GM (1, 1). Further, we used a time series to calculate the land transfer income of each province in 2025. After combining these two, the possible support of land transfer income in all dimensions of rural revitalization across the 31PLAD in 2025 was calculated. Then, according to the Dagum Gini coefficient method, the regional differences of each dimension across the 31PLAD were observed. The financial expenditure of the 31PLAD across the five dimensions studied revealed that the expenditure of industrial prosperity and its proportion is higher, followed by the dimensions of ecological livability and rural civilization. The expenditure of the other dimensions, except for that of affluence in Regions I and II, is better than that of the same dimension in the region. The overall differences among the 31PLAD represent low industrial prosperity, high affluent life, similar overall differences between rural civilization and effective governance, and relatively large differences in ecological livability. Our findings provide relevant suggestions that would help support rural revitalization effectively. After focusing on the first four dimensions of rural revitalization, we suggest measures to promote the development of other dimensions within industrial prosperity and the linkage and cross-development of all dimensions so as to achieve complete rural revitalization. Further, we specify local policies and regulations for using land transfer income to make overall plans and proper arrangements. According to the industrial development and changes found among the 31PLAD, the necessary support path ahead is clear. According to the forecast trend and changes in the income difference found in this study, the PLAD could use these to plan objectives, clarify fund management, establish relevant supervision systems, and develop policy communication methods, among other measures.
1 Introduction
During the 14th Five-Year Plan period, the sustained and rapid revitalization of rural areas requires a variety of methods with which to achieve its goals. That is, villages that have been successfully influenced by urbanization can lead to revitalizing the overall market, with the saved financial resources being transferred to those that have not yet been urbanized (Liu, 2018a; Yao and Shi, 2020; Yang et al., 2021). Further, according to their advantages, these urbanized villages could also explore endogenous power (Liu and Li, 2020; Guo and Liu, 2021), promote industrial reform, and actively connect with the surrounding areas of the local city for further development. Under these conditions, both the urbanization and modernization of He Xuefeng are essentially completed, meaning that China’s rural revitalization plan can progress to the stages involving strong and rich construction (He, 2021). Herein, future research needs to focus on the mutual feedback mechanism and regional model of urban-rural integration development and rural revitalization (Long and Chen, 2021).
Rural revitalization is an indispensable strategic choice needed to solve the current lack of endogenous motivation (Wang and Su, 2017; Huang, 2018); that is, China has begun to implement the “land finance” policy intended to promote rural and agricultural development. The more traditional financial system tends to develop cities and industrialization in the initial redistribution of national income, while most farmers have to continue to undertake more burdensome tasks involved in their less advanced accumulation of capital, which is one key motive for the formation of the “three rural issues” (Xu, 2019). The National Rural Revitalization Strategic Plan (2018–2022) states that it is “continuing to adhere to the financial priority guarantee” (Chen et al., 2018; Guo et al., 2018; Tan and Luo, 2018), while the Opinions of the Ministry of Finance on Implementing the Rural Revitalization Strategy (2018) outline the overall requirements of financial support needed for rural revitalization and the multi-input guarantee system. Existing research states that finance is the basic element needed for implementing this rural revitalization strategy, with the modern rural financial systems needing to cover all fields of rural revitalization, the fiscal expenditure needing to assign priority to agriculture and rural areas (Xiao, 2020), and the rural methods of pluralistic governance needing to be constructed through the use of more detailed financial guidance (Yan and Bao, 2019a). In terms of “improving the multi-input guarantee mechanism,” the second article of the National Rural Revitalization Strategic Plan (2018–2022) states that, after “continuing to adhere to the financial priority guarantee,” it is “increasing the proportion of land transfer income used for agriculture and rural areas.” The Opinions of the General Office of the CPC Central Committee and the General Office of the State Council on Adjusting and Perfecting the Use Scope of Land Transfer Income and Giving Priority to Supporting Rural Revitalization (2020) (hereinafter referred to as the Opinions [2020]) state that, for a long time, the proportion of land value-added income directly used in agriculture and rural areas is low. During the first year of the “14th Five-Year Plan,” more than 10.0% of the land transfer income was used in both agriculture and rural areas. At the end of this plan, the proportion of land transfer income used in agriculture and rural areas reached more than 50.0%. However, the actual proportion of specific support areas in the PLAD has not been well researched. The five-dimensional development of rural revitalization showcases that developing the industry is the fundamental policy of rural revitalization (Liu and Wang, 2020; Guo and Lu, 2021), ecological livability is the more realistic requirement and key content of rural revitalization (Kong and Lu, 2019), rural civilization is the soul and guarantee of rural revitalization (Tang and Li, 2019; Liu and Chen, 2020; Zhao et al., 2021), effective governance is the most effective way of ensuring rural revitalization, as well as that affluent life is the ultimate goal of rural revitalization. Fiscal expenditure has a long history of rural development (Yan and Bao, 2019b), with insufficient current research on fiscal expenditure from these five dimensions. The structure and proportion of financial support for agriculture have constantly been adjusted according to the development of each stage (Li and Qian, 2004; Ju, 2005). In this regard, scholars have concluded, from different levels, that the internal use of finance for rural revitalization and the construction/management of related institutional mechanisms can exist within the wider financial support strategy for rural revitalization (Liu, 2021; Shi and Jin, 2021), while also giving guidance for the problems that occur in the actual development of rural revitalization (Zhang and Ouyang, 2021). Previously, most of the land value-added benefits came from rural collectives (Liu and Song, 2020; Zou et al., 2021), despite these collectives lacking the right to distribute the benefits generated by land development rights, while cities can enjoy these benefits (Peng, 2016). As such, scholars provide answers from different angles on the fair, effective, and reasonable distribution of land value-added income. Some scholars believe that after land-losing farmers get due land compensation, the land value-added income should belong to the state (Zhang and Yue, 2016; Liu and Hu, 2017; Hai and Chen, 2019). Conversely, some researchers think that farmers have complete land income rights, meaning that they and the state can rationally distribute land value-added income according to the given situation (Yang, 2015).
In the new journey of modernization during the 14th Five-Year Plan period, the construction of new countryside is very important for socialist modernization. Existing policies mention that rural development pays attention to rural farmland water conservancy and hydropower construction and promotes rural multi-industry linkage development, cultural construction, education, etc. To ensure rural development, the rural financial input mechanism should be diversified. At present, the policy orientation of land transfer income is used for the development of rural undertakings (Liu, 2014). Studying the possible support of land transfer income can not only scientifically guide the use of land transfer income but also have certain reference significance for other kinds of funds to invest in rural construction.
In different areas of China, there is no uniform structure for the use and distribution of land transfer fees due to their characteristics. The current guidelines on land transfer income mention that the resulting income funds are to be used for the key implementation of state support under rural revitalization. As such, this study explains the mechanism of land transfer income that supports rural revitalization, reveals the different laws involved in the proportion of different fields in rural revitalization, predicts the trend in the next fifth year, allocates the proportion in various fields, and puts forward reasonable proportional countermeasures of possible land transfer income that would support rural revitalization in various provincial-level administrative divisions (PLAD).
2 Materials and methods
2.1 Scope of study
The research data are selected from 31PLAD. The selected time nodes are 2005, 2010, 2015, and 2020, and each dimension meets the data described by each dimension index. There are 34 provincial administrative units in China, including 23 provinces, five autonomous regions, four municipalities directly under the Central government, and two special administrative regions. Different from other provinces’ land systems, Hong Kong, Macao, and Taiwan are not included in current policies, with their data on land transfer income and related rural construction not being easy to obtain. As such, we did not include these three regions in our sample.
2.2 Dimensions and indicators of rural revitalization
The five dimensions of industrial prosperity, ecological livability, rural civilization, effective governance, and affluent life were all selected for use in this study. The selection principles were objective, reasonable, and relevant, with the universality and suitability of these dimensions being measured as accurately as possible. In addition to matching the relevant content of the Rural Revitalization Strategy from 2018 to 2022 and the Guiding Opinions, these indicators were also selected based on the key direction of future expenditure of land transfer income and in combination with the consistent direction of previous agricultural support. The focus of the expenditure direction in each stage is constantly changing, while some statistics are inconsistent. The selected indicators herein cover the rural expenditure direction in each planning stage as much as possible, allowing us to calculate this part of the data to observe its specific expenditure. Many domestic scholars have evaluated rural revitalization (Lv and Cui, 2021; Tian et al., 2021; Wang et al., 2022). From this perspective, we chose to measure the effectiveness that is highly related to fiscal expenditure. Table 1 shows the selection of indicators.
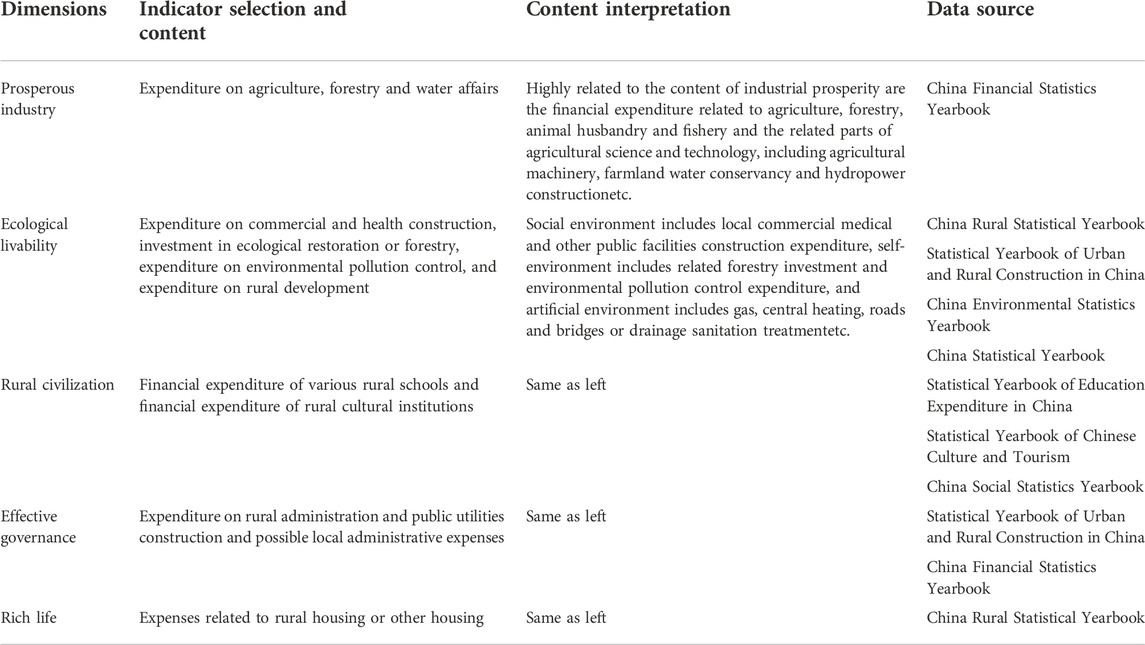
TABLE 1. Selection of indicators of each dimension.
Herein, we calculated the key and related expenditures under the five dimensions of rural revitalization while observing and predicting the differences in the distribution ratio of rural revitalization in various fields of PLAD. Additionally, the total effect of the 5-year expenditure was planned using a 5-year time series. This time series is the same as the 5-year schedule outlined in China’s national economic plan. According to the 5-year planning schedule, the node data from 2005, 2010, 2015, and 2020 were selected for our analysis. These data are continuous at the same time point. This time point is selected to observe the specific development results of each stage under the 5-year plan, and it is difficult to obtain continuous annual data under more statistical indicators. Statistical indicators of the same type are consistent every year. Table 1 explains the specific indicators, showing the statistical indicators and specific connotations of each dimension. The data of each PLAD are from various statistical yearbooks, as shown in Table 1. Among them, the surveyable data of Tibet in some dimensions are blank. As such, we were able to quantitatively predict the possible expenditure ratio and quota of various fields in the next phase of this 5-year plan—that is, 2025—and analyzed the developmental trends of the next five fields under the guidance of existing environmental, system, and internal policies, as well as observe its environmental evolution and the effectiveness of policy implementation. Further, after using the data of land transfer income combined with the five-dimensional fiscal expenditure ratio, this study calculated the future possible use direction and degree of land transfer income that provides a possible basis for developing future policies.
The Dagum Gini coefficient method was used to observe the regional differences in fiscal expenditure for rural revitalization. According to the degree of rural revitalization, we divided the dataset into a series of regions (Mao, 2021; Zhang et al., 2021; Lu et al., 2022), with the regional division shown in Table 2.
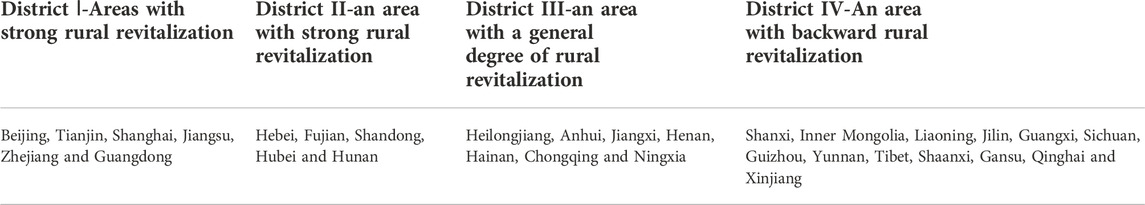
TABLE 2. Classification table of four regions of 31PLAD.
2.3 Research methods
After comprehensively analyzing various options, we chose a time series prediction model. A time series is simple, with its numerical value only relating to time, which avoids the influence of any other factors on the index while having a good degree of accuracy. Under the premise of a stable environment, the numerical value also has a certain reference significance. The one disadvantage is that it depends solely on time. This paper selects the Holt model, simple linear regression model, and AMIMA model for the data of each PLAD.
There are only four fiscal expenditure data periods of rural revitalization in the current statistics, with the amount of data being small overall; as such, the grey system prediction model was selected. The GM (Yao and Shi, 2020) model is one of the most widely used grey dynamic prediction models in grey system theory, which is composed of a single variable first-order differential equation. Specifically, it is suitable for forecasting with less data. Generally, only four data sources are needed. The integrity and reliability of the sequence are low, while the essence of the system can be fully excavated by differential equations with high precision. Further, it can generate irregular original data to obtain regular generation sequences, which is simple in operation and convenient for inspection, without considering distribution law and change trends. Herein, only the data from the later period are needed, which belongs to the short-term forecast and is suitable for the application. The operation of the GM (Yao and Shi, 2020) model was carried out by Matlab in this research.
The Dagum Gini coefficient was used to study regional differences. When measuring regional differences, the Gini coefficient is classified into three parts according to the subgroup decomposition method: intra-regional difference contribution, inter-regional difference contribution, and super-variable density contribution. These represent the sources of developmental differences in various dimensions within each region, as well as the overlapping effects of the various regions.
The Gini coefficient is then calculated as follows:
Finally, to calculate
When defining relevant variables, we can refer to the following equations representing the relative impact of fiscal expenditure in this dimension between two regions.
3 Results
3.1 Previous changes in land transfer income across different provinces and the future forecast
After selecting the time series model in SPSS, as well as after using the traditional model, the data values of the 31PLAD from 2002 to 2017 were used to predict those leading up to 2025; that is, the values from 2018 to 2025 were predicted. The traditional method involves selecting the most suitable model for the data characteristics of the different 31PLAD. Table 3 shows the specific model.
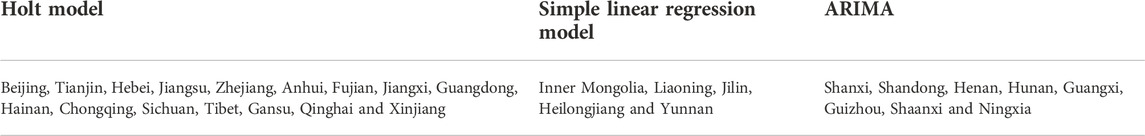
TABLE 3. Classification table of forecasting models used by 31PLAD.
Furthermore, the Holt model is an advanced exponential smoothing model. This method is suitable for non-stationary series with linear trends and periodic fluctuations. The exponential smoothing method (EMA) was used to continuously adapt the model parameters to the changes of non-stationary series while predicting short-term trends. Further, we also used a simple linear regression model—that is, a unary linear regression model, when the causal variables include only one dependent and one independent variable, with its expression form being y = ax + b + ε. Here, a is the slope of the model, b is the intercept, and ε is the error. This model is easy to read and is only related to time-based data. Additionally, the ARIMA is an autoregressive moving average model, which is abbreviated as the ARIMA (P, D, Q) model. In particular, when D = 0, the ARIMA (P, D, Q) model is the ARMA (P, Q) model. When d = 1 and p = q = 0, the ARIMA (0, 1, 0) model is also called the “random walk” or the “drunk model.” Most provinces under the ARIMA model are predicted using ARIMA (0, 1, 0), except for the Shaanxi Province, which is predicted by ARIMA (0, 1, 2), and the Ningxia Autonomous Region, which is predicted by ARIMA (1, 1, 0). Figure 1 shows the above predictions.
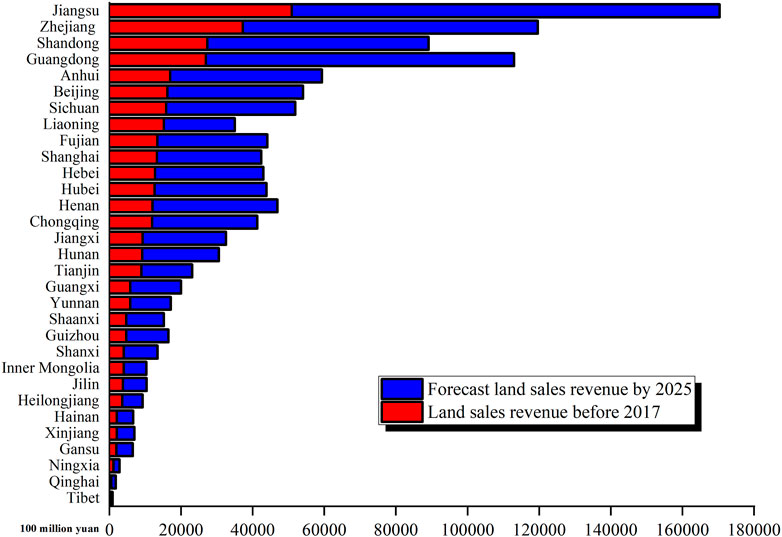
FIGURE 1. Previous and forecasted changes of land transfer income in the 31PLAD.
Figure 1 shows the changes in the total land transfer income of PLAD before 2017 and the changes in total land transfer income before 2025. Herein, 2018–2025 is the forecast result, meaning that the forecast period is long. Further, the results in 2025 only have a certain reference value. Different PLAD have different data conditions, while different provinces choose different methods of time series forecasting. These results show that the land transfer income in Tibet, Ningxia, and Gansu, as well as other economically disadvantaged areas, has not been significantly enhanced either before or after the forecast. In Jilin, Heilongjiang, and Liaoning, the increase in land transfer income is not obvious. A possible reason for this lies in the sharp decline of land transfer behaviors caused by large population loss and low fertility rate. In the Guangdong, Shandong, Zhejiang, and Jiangsu regions, the economic development is good, and the geographical characteristics are wide. Although not much land can be sold, the price of land sold by units is high. In the next few years, the income from land transfer should be sufficient without considering the crises caused by external environmental epidemics or other risks.
3.2 Fiscal expenditure of PLAD in each dimension
3.2.1 Financial expenditure of the 31PLAD in each dimension
First, we looked at the expenditure of the industrial prosperity dimension and its forecast results. The key directions of fiscal expenditure in this dimension are high-standard farmland construction, farmland water conservancy construction, modern seed industry promotion, the comprehensive improvement of agricultural land, and the permanent basic protection of cultivated land. To this end, we explored the existing guidance on land transfer income that supports rural revitalization and the related description of industrial prosperity in the rural revitalization strategy. To accurately describe the financial expenditure of industrial prosperity, the indicators arising from investments in agriculture, forestry, animal husbandry, the fishery industry, and agricultural science and technology to the industrial prosperity expenditure represented by the expenditure on agriculture, forestry, and water affairs were measured. The specific values are shown in Table 4 (left).
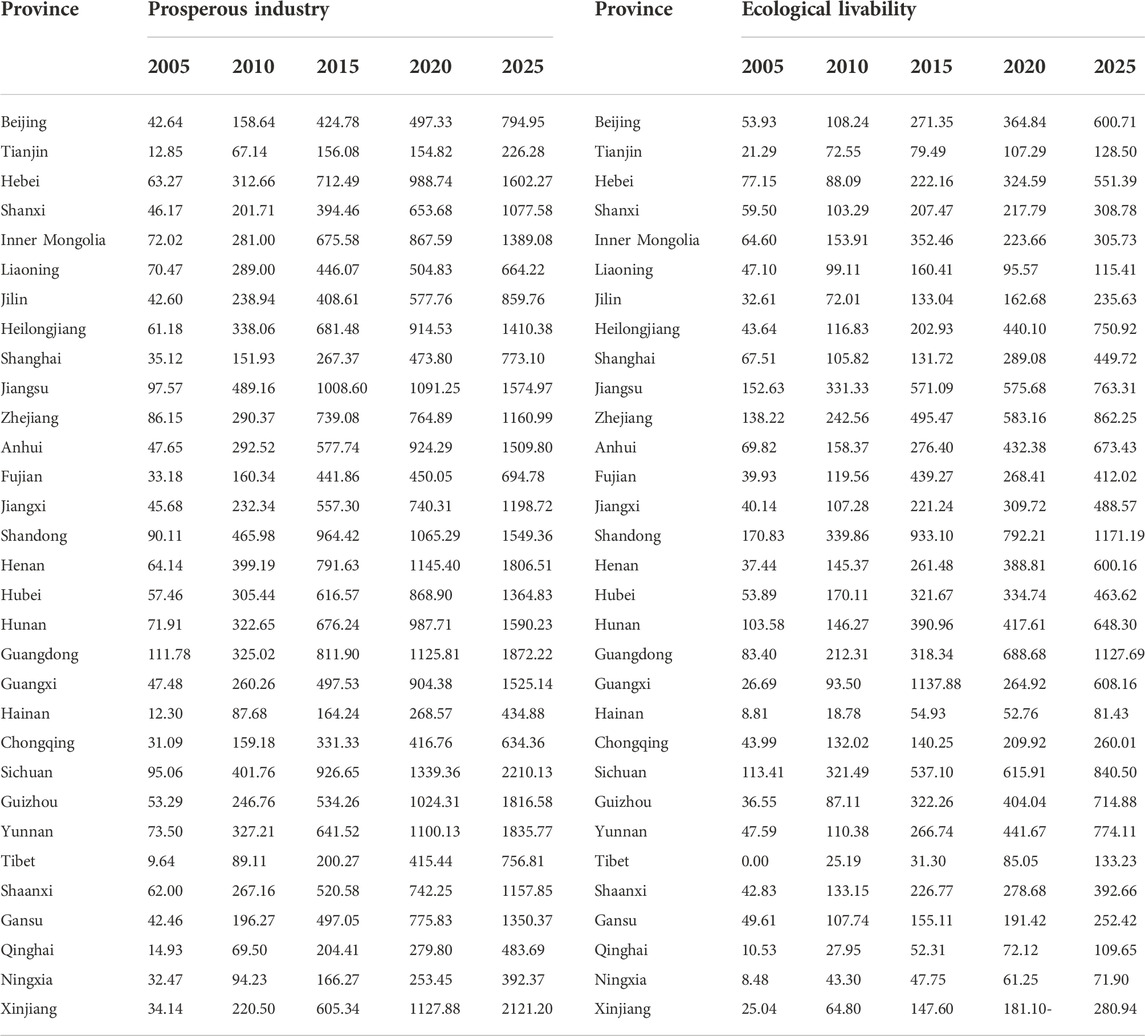
TABLE 4. Financial Expenditure on Industrial Prosperity-Ecological Livability in 31PLAD (Unit: 100 million).
Table 4 (left) shows that from 2005 to 2020, almost every province experienced a substantial leap forward in the fiscal expenditure of industrial prosperity, which coincides with the 11th Five-Year Plan period, with notable achievements in the development of the national economy. The financial expenditure for the prosperity of rural industries has also greatly improved. During 2010–2015 (i.e., the 12th Five-Year Plan period), the nation’s economic situation underwent certain profound changes, with industrial prosperity having greatly improved across every province and their regions. However, during 2015–2020, the economy was still developing ahead of schedule, but economic development was not as rapid as that of the previous two stages. Specifically, compared with the fiscal expenditure of industrial prosperity in 2015 and 2020, the current growth situation is not as rapid as that of the previous two stages.
We further investigated the statistics of the ecological livability dimension’s expenditure and its forecast results. Ecological livability measures how well residents can experience both the beauty of their environment and how much enjoyment they feel, both spiritually and materially, as a result. Spiritually speaking, residents need a clean, tidy, comfortable, and convenient living environment that is fresh and natural. From the material point of view, residents need to have an environmental area suitable for ensuring health. Health service construction and old-age care institutions belong to public buildings, which are counted as a whole in the Statistical Yearbook of Urban and Rural Construction in China, and belong to public building expenditures. Public buildings are divided into six categories: administrative, educational welfare, cultural and scientific, medical and health, commercial service, and public utilities. The medical and old-age service buildings mentioned here belong to this group of statistics. In this group, according to the nature of various public buildings, each area’s contents were divided into dimensions. Administrative and public utilities construction expenditures are strongly based on public management, which is divided into effective governance dimensions. Among them, commercial service and medical and health service buildings cover the expenditure on health service construction and old-age care institutions, which are further divided into ecological livability dimensions. Cultural, scientific, educational, and welfare buildings are in line with the financial expenditure from the perspective of rural civilization and are divided within this dimension.
After access, the data related to public buildings are from rural areas. Herein, let public building expenditure be (
The calculation is as follows:
After data review and comparison, the coefficient of each region was determined to identify the specific expenditure within each. After fuzzy estimation, the coefficients of each part of the population are determined as follows:
Among them…
It is speculated that the proportion of various expenditures in each stage always changes. It is based on economic development and changes in planning requirements in each stage. As such, we need to adjust slightly for changes in planning objectives and development results at each stage. This information comes from the Wind database and the China Fiscal Yearbook, which collates the structure of fiscal expenditure in each stage, and then extracts and re-determines its proportion according to the total of various fiscal expenditure parts.
Assuming that the 10th Five-Year Plan was from 2001 to 2005 after the reform and opening up of the national economy, the economic development mode changed, with the education level improved, the infrastructure construction improved further, and the industrial science and technology developed, which was followed by a high energy-consuming growth mode. The income gap between urban and rural areas widened, along with the high growth of secondary and tertiary industries and low employment.
During the 11th Five-Year Plan from 2006 to 2010, the deepening reform and opening of the national economy, the ever-increasing and excessive levels of heavy industrialization, high consumption of economic growth, high pollution, and rising proportion of natural assets loss (i.e., rapid economic growth and deepening of economic structure contradictions) all occurred. The development in all aspects has deepened, with the administration and public utility management having been further improved.
At this point.
The 12th Five-Year Plan was from 2011 to 2015.
The 13th Five-Year Plan was from 2016 to 2020.
After examining the above descriptions and statistics, the specific expenditures of the six types of public buildings were obtained, with us then combining them with the other expenditures of ecological livability, rural civilization, and effective governance, which allowed us to obtain the specific fiscal expenditure results of all three dimensions. Table 3 (right) shows the effects of ecological livability.
As shown in Table 4 (right), the ecological livability of the 31PLAD experienced a leap-forward growth in some areas, while the investment in other areas increased annually along with the regional economic development. The large amount of data in Guangxi are due to the large increase in forestry investment in this region in that year. With the economic development and response to the national environmental protection policy, the overall governance and forestry investment levels in other regions have also improved.
We now present the expenditure of the rural civilization dimension and its prediction results. This section primarily includes the financial expenditure related to rural education, as well as that of various recreational institutions or activities. Table 5 (left) shows the specific statistical results.
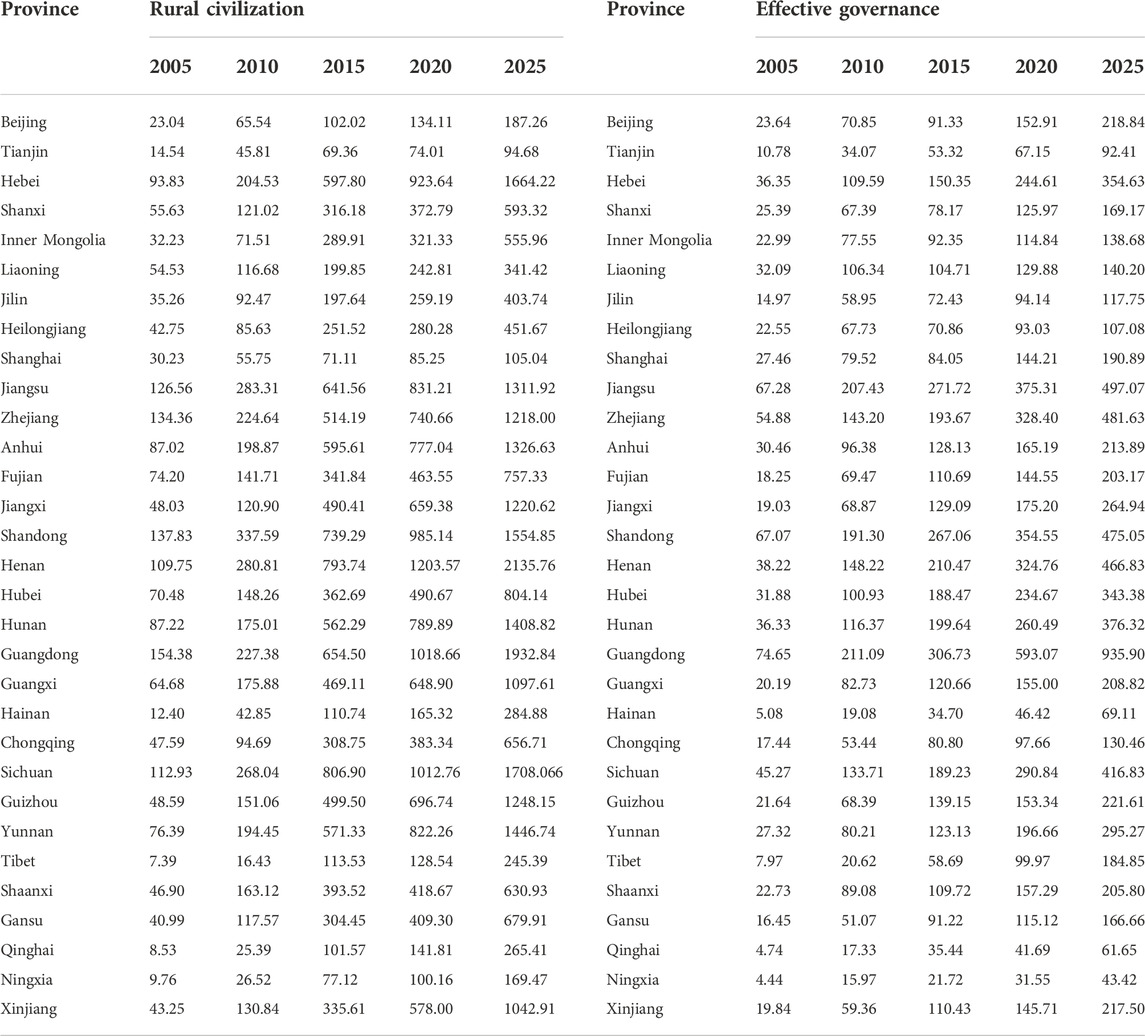
TABLE 5. 31PLAD Rural Civilization-Effective Financial Expenditure for Governance (Unit: 100 million).
The findings for Beijing, Shanghai, and Tianjin are not significant, which may be due to their high urbanization levels, their relatively few rural areas, and their superior overall development compared with the state of rural development in other regions, with their expenditure on rural education and culture thus not being significant. For Shandong and Henan, with large populations and wide rural areas, the expenditure on rural education and culture is larger than that in other regions. Guangdong and Sichuan are economically developed and geographically wide, with their expenditure on rural education and culture particularly noteworthy. In areas with less advanced education and economic development levels, such as Qinghai and Gansu, the overall financial expenditure on education and culture is relatively low.
Next, we present the effectiveness of the governance dimension’s expenditure and its forecast results. It was difficult to obtain the measurement effect of this section. The land transfer income, as clearly mentioned in the policy, showcases that the direction of promotion does not cover this section, meaning that its measurement content was vaguely determined. The content herein includes the construction expenditure of administrative and public management and the expenses related to rural public management or administration, which have all been vaguely determined. Table 5 (right) shows the statistical results. The degree of effective fiscal expenditure is mainly restricted by that of the local economic development, while it is related to both the latter and fiscal revenue. For example, the overall regional economy in developed regions, such as Beijing and Shanghai, is progressing well, with the expenditure in the effective governance dimension being better than that in other dimensions. Additionally, the expenditure of the effective dimension of governance is also affected by the minority in local rural areas. Rural areas are wide in the area and large in quantity, meaning that the overall expenditure on affluent lifestyles is greater.
Further, we calculated the expenditure of the affluent living dimension and its forecast. The measurement of fiscal expenditure in this dimension is as follows. The overall affluence dimension is closely related to housing, the relevant statistics, and the housing-related equipment engineering costs. Table 6 shows these statistics.
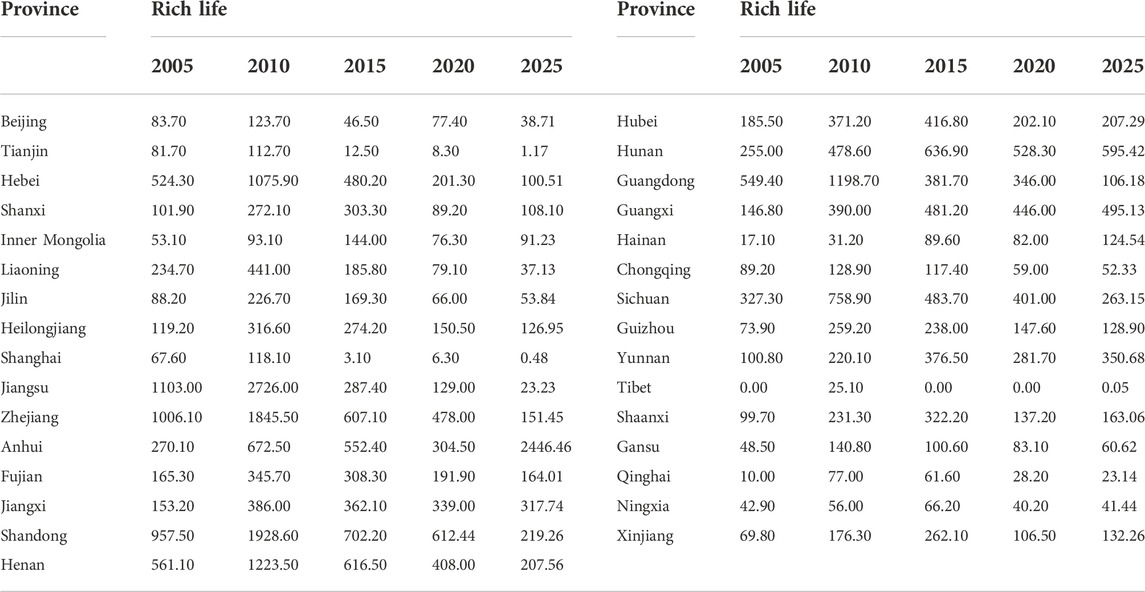
TABLE 6. Financial expenditure of affluent living in 31PLAD (unit: 100 million).
Some statistics in Tibet are unclear as the Tibetan data in this section not being particularly strong. As seen from Table 6, the financial expenditure of affluent life is also increasing sequentially. There are few rural areas in Beijing, Shanghai, and Tianjin, with the financial expenditure related to affluence not being high. From 2005 to 2010, the rural areas in Jiangsu and Zhejiang developed rapidly, with the housing investment related to affluence also increasing. Shandong and Henan have large populations and wide rural areas, with their financial expenditure related to affluent life being more than that of other regions. Roughly observed, the expenditure of affluence in other rural areas is similar at each stage.
3.2.2 Calculation and forecast of the fiscal expenditure ratio of the 31PLAD in each dimension
First, we present the calculation results of the fiscal expenditure ratio of each node in each dimension of the 31 PLAD. Using the specific fiscal expenditure data of each dimension mentioned above, the five-dimensional expenditure ratio of these four nodes was calculated, with the results shown in Tables 7, 8.
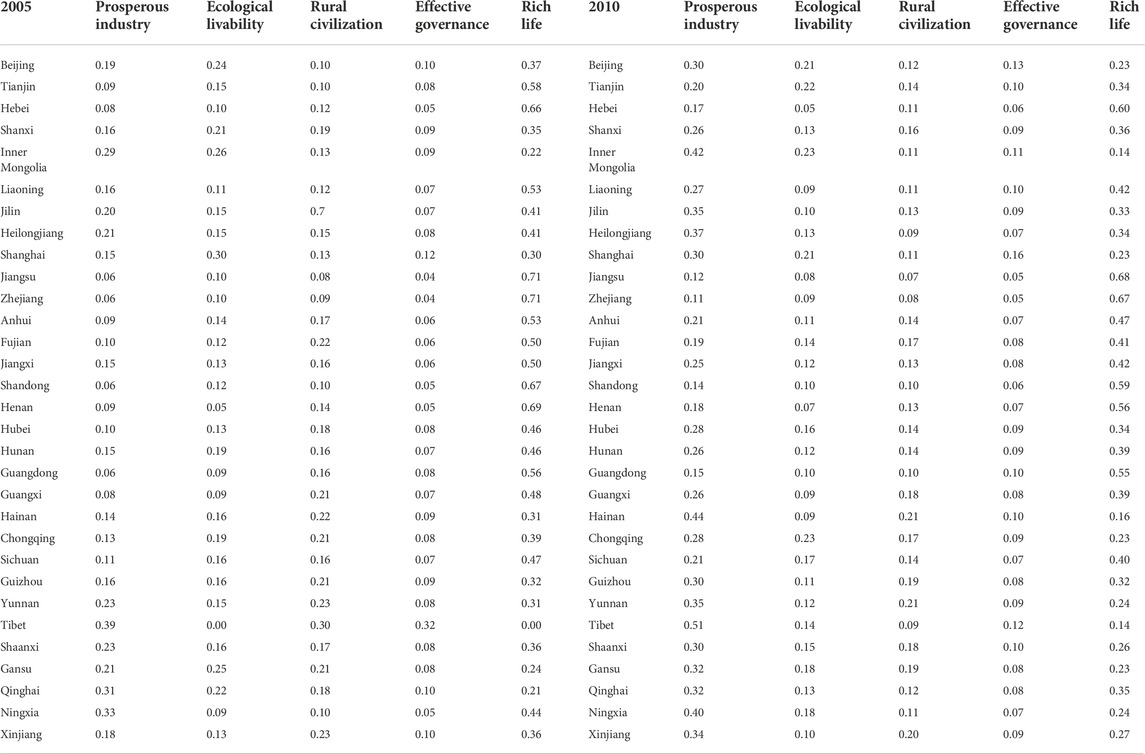
TABLE 7. Calculation results of each dimension proportion of 31 PLAD in 2005 and 2010.
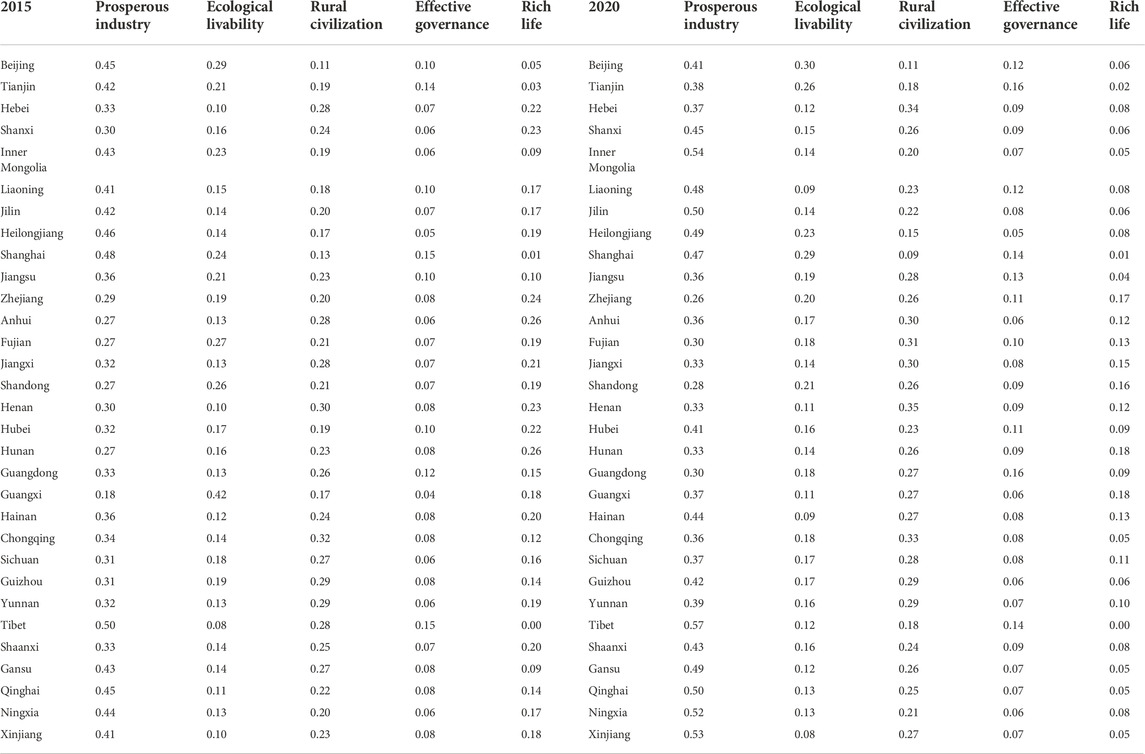
TABLE 8. Calculation results of each dimension proportion of 31PLAD in 2015 and 2020.
As shown in Tables 7, 8, the proportion of the industrial prosperity dimension expenditure in various PLAD is increasing, indicating that their investments related to farmland water conservancy and hydropower are increasing annually. Under the general policy of ensuring basic agriculture to protect cultivated land, the goal of high-quality farmland construction and the improvement of rural industrial development infrastructure are pursued. Conversely, the proportion of the affluent life dimension is extremely low in all PLAD. Either the demand for perfect rural housing is low, or the expenditure ratio is relatively low. Compared with the investment in urban real estate housing, it is not needed in rural areas. Most PLAD reached the largest investment in housing around 2010, with the subsequent investment dropping sharply. To a certain extent, this unproductive investment will not increase continuously over time but will change or fluctuate slightly with the need for depreciation or breakage. Investments in the rural ecological livability and civilization dimensions have increased to a certain extent, but the change in this proportion is not obvious. The living and natural environments in rural areas have greatly improved, with the state’s financial support for these areas being strong. In particular, this has always been the focus of investment in the past and will continue in the future.
Next, we cover the forecast results of the fiscal expenditure ratio at the end of the 14th Five-Year Plan in 31PLAD. Using the GM (Yao and Shi, 2020) grey system prediction method, the data of the first five dimensions and four periods are predicted up to the next period, 2025, with the results shown in Table 9.
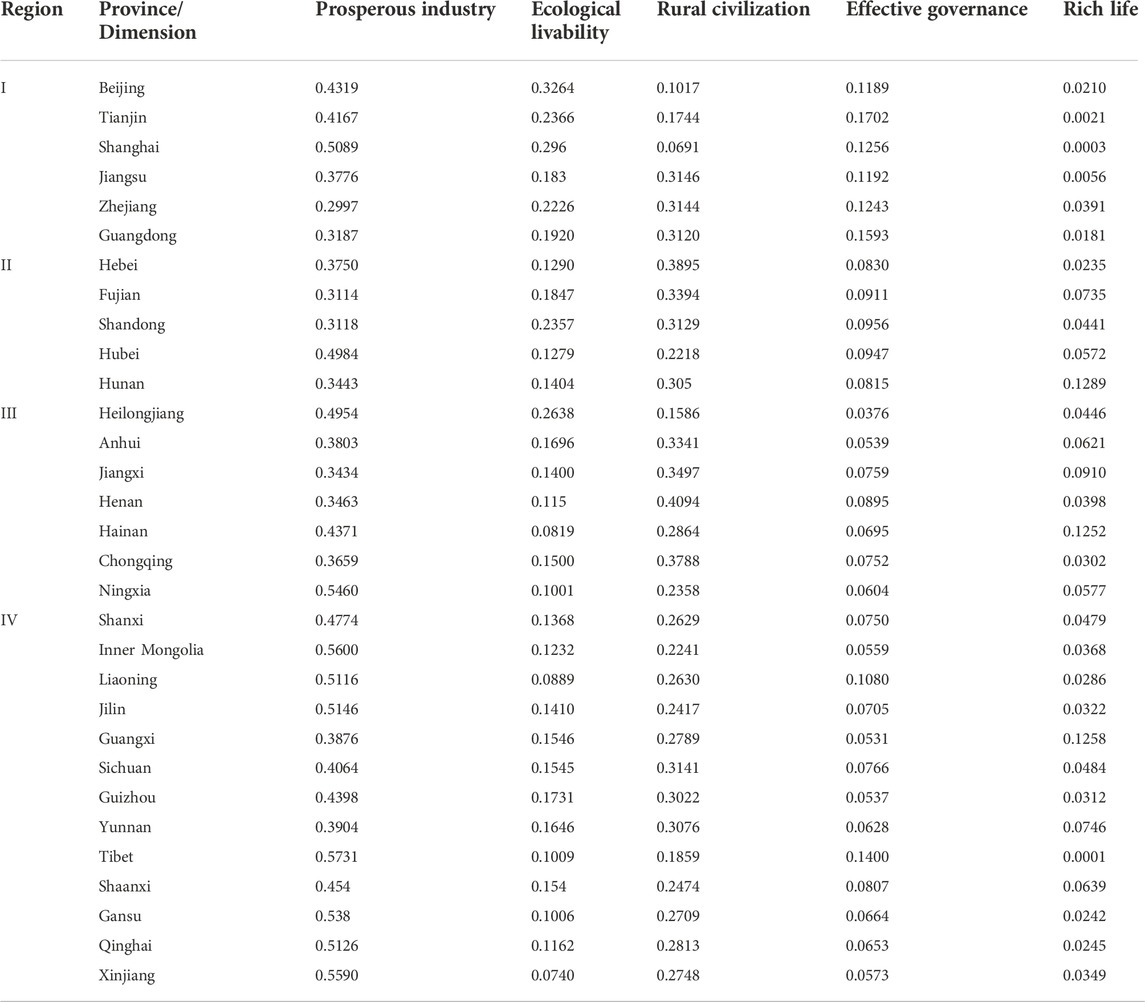
TABLE 9. Forecast results of each dimension proportion of 31PLAD in 2025.
Table 9 shows that the change in fiscal expenditure ratio in this stage was not obvious compared with that of the previous period. Overall, the expenditure on industrial prosperity, ecological livability, and rural civilization is increasing, while the proportions of effective governance and affluent life dimensions are declining. When five dimensions are put into a system, the above results and changes exist. Considering the reasons underlying this prediction model, it reveals a certain tendency to the data. When combined with the 14th Five-Year Plan and relevant policy opinions, the focus of rural revitalization in China still lies in the construction of high-standard farmland and its related water conservancy and hydropower facilities, the governance of its natural environment, and the improvement of its living environment, as well as an emphasis on rural education. These behavioral measures may mean that the orientation of fiscal expenditure to this system will continue. In addition, Table 9 showcases that the proportion of provinces (cities and districts) changes among different regions. The proportion of the whole industry prosperity is quite prominent, among which the proportion of industry prosperity in Region IV is slightly higher than that in other regions, while the proportion of affluent life is relatively small. In the dimension of rural civilization, the proportion change is the largest in Region II, the smallest in Region I, and is similar among Regions III and IV. The ecological livability dimension shows that the proportion value of Region I is large, while the proportion values of the other regions are similar.
3.2.3 Evolution results of the gini coefficient difference of fiscal expenditure in the 31PLAD in each dimension
Using the Dagum Gini coefficient and its subgroup decomposition method, the Gini coefficients of fiscal expenditure intensity in each dimension of rural revitalization in the 31PLAD were calculated, with the results shown in Table 10.
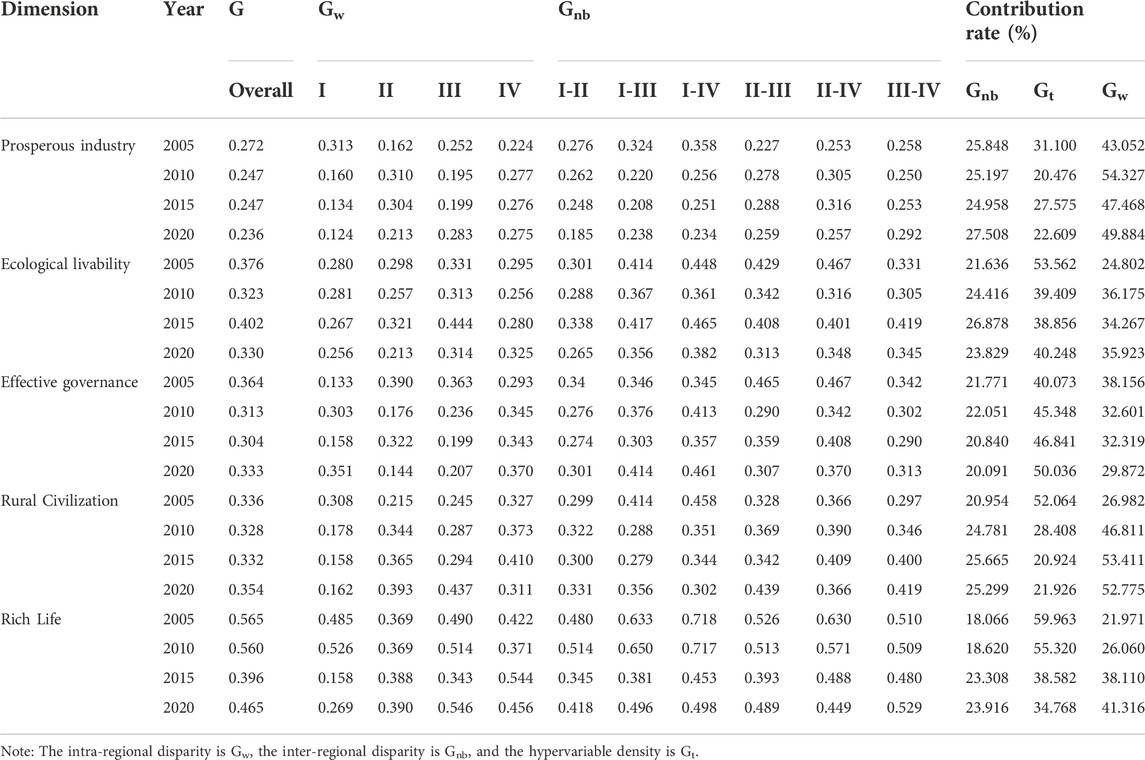
TABLE 10. Regional difference data results of 31PLAD based on Dagum.
Table 10 shows the Gini numerical calculation results in 2005, 2010, 2015, and 2020 from five dimensions: prosperous industry, ecological livability, civilized rural customs, effective governance, and affluent life. Table 10 also visualizes the intra-regional, inter-regional, and super-density contribution rates of the various dimensions. The overall intra-regional and inter-regional differences in industrial prosperity are relatively stable and low, while those with affluent life are higher than the other dimensions. The differences among the other three dimensions are similar, but the numerical differences are not large.
4 Discussion
4.1 Interpretation of the mechanism of how land income supports rural revitalization
To industrialize and urbanize its cities faster, as well as to maximize China’s advantage of being able to concentrate on multiple areas, the state is planning to tilt more resources to cities and towns. The national fiscal expenditure has primarily been directed to various fields in cities and towns to support the development of modernization. With the rapid development of urbanization and industrialization, China’s overall fiscal revenue has been greatly improved. At this stage, the proportion of fiscal expenditure in rural areas is gradually increasing, with its overall situation improving, which can be compared with the level of investment in cities and towns over the past few years, although the results seem to be extremely low. This behavior has caused a great separation between rural and urban development, with high urbanization levels and low rural modernization (Ning, 2012; Zhang et al., 2018). Especially in rural areas of various underdeveloped areas, money and human elements flow out in great numbers (Wang, 2006). The loss of a rural labor force leads to a lack of resources for rural development. In some areas, only land has been expropriated or transferred, while money and human elements are not in place, and rural development lacks core elements. Figure 2 shows the mechanism of land transfer income supporting rural revitalization.
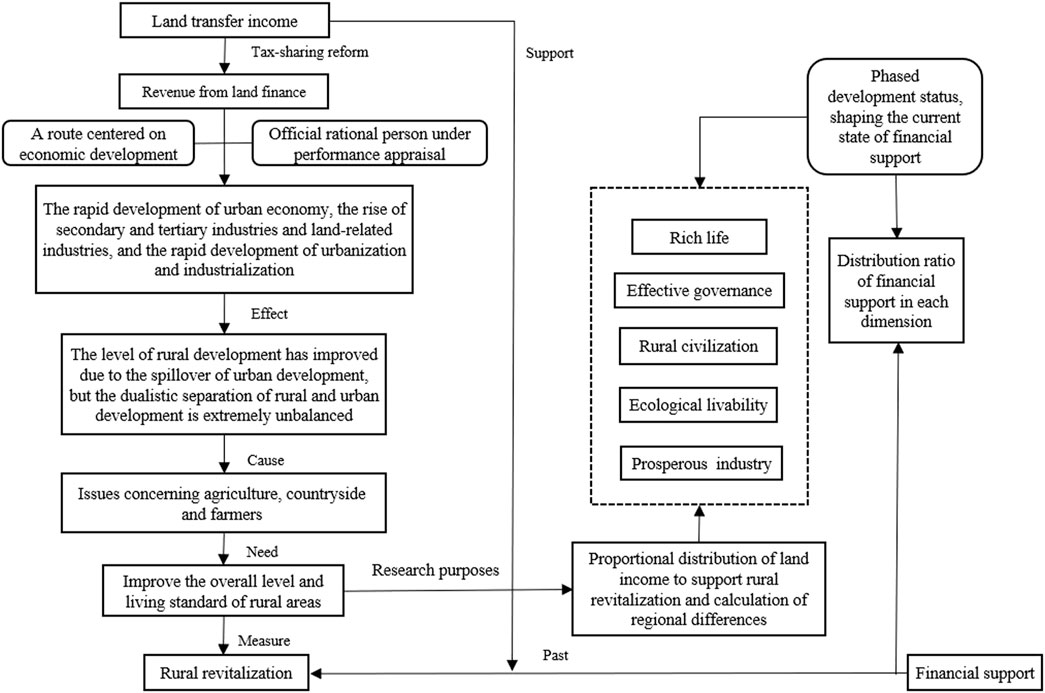
FIGURE 2. Operation mechanism of how land transfer income is used to support rural revitalization.
The imbalance between urban and rural development has produced numerous problems (Liu, 2018b). For rural areas, these include increasing wastelands and hollowing out, left-behind elderly, and children who lack care and support, among others. As far as cities are concerned, there are various other challenges, such as migrant workers living in cities without fixed homes, having to move around, crowded cities, high vacancy rates, and high housing prices. These problems require focus and proper solutions on the road toward prosperity. Rural revitalization is an important means to solve the problems of agriculture, rural areas, and farmers, as well as various exogenous problems derived from these (Wang and Su, 2017). In the process of urbanization, the role of land finance cannot be ignored. Land finance accounts for a high proportion of local finance and is the source of funds for urbanization in China. Further, land transfer income is a significant part of land finance. Generally speaking, land transfer is the income obtained by transferring land in various ways. In the past, it was rationalized by the local government as supporting urbanization. Now, to make up for the lack of resources for rural development, the existing policy orientation aims to use land transfer income for rural development. This includes a focus on financial input and where exactly to invest. In the past, it was unclear how to match the directions of financial support for agriculture in numerous fields in various PLAD. Further, the existing policies stipulate that the land transfer income should support rural revitalization with its key expenditure direction. Herein, according to the calculation of its key expenditure objects, the specific proportion of land transfer income supporting rural revitalization in various fields is observed. Based on this, the same proportion of land transfer income after 5 years was calculated, which is of constructive significance for different PLAD to formulate expenditure strategies.
4.2 Forecast of land transfer income supporting rural revitalization in the 31PLAD
Based on the proportion of each dimension predicted in Table 9, combined with the predicted data of land transfer income, the possible fiscal expenditure at the end of the 14th Five-Year Plan was calculated. The calculation results provide a reference for PLAD in formulating and implementing policy plans. The calculation results are shown in Table 11.
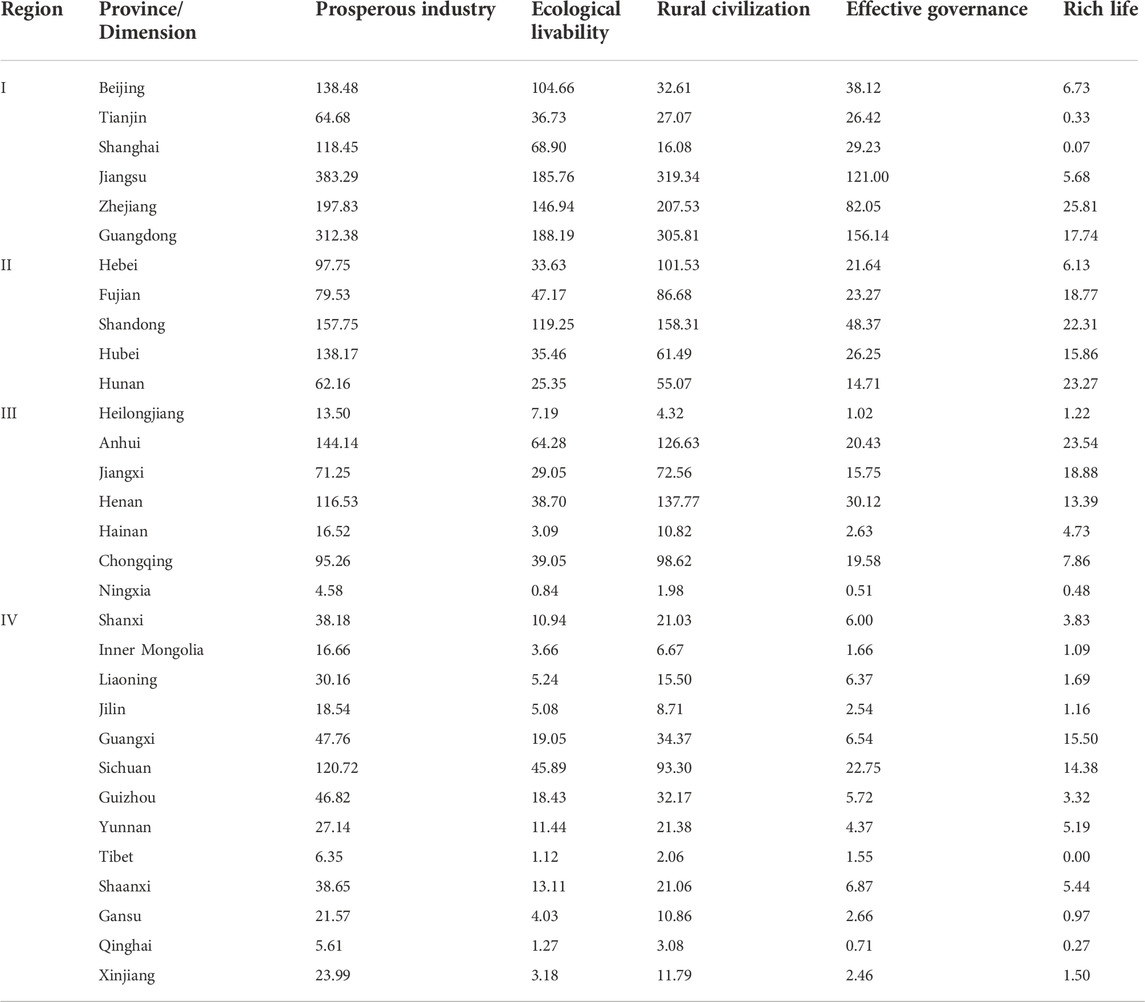
TABLE 11. Forecast of land transfer income support in 31 PLAD in 2025.
As shown in Table 11, the expenditure on land transfer income that supports rural revitalization in all dimensions is small as it is limited by the magnitude of land transfer income of each province, except for Beijing, Shanghai, Jiangsu, and Guangdong, which have better land transfer income and good expenditure in all dimensions, especially in terms of industrial prosperity and ecological livability. Moreover, few rural areas in Beijing and Shanghai are more developed than others, which means their expenditure on rural education, governance, and affluence is less. Regions I and II are those with significant expenditure on rural civilization and ecological livability in China, with the expenditure magnitude being larger than that in other regions. Conversely, very few provinces in Region I have lower affluent living expenditures than those in Region IV, except for Guangxi, Sichuan, and Shaanxi. The expenditure magnitude of the governance effectiveness dimension in Regions III and IV is generally lower than that in Regions I and II.
4.3 Evolution of Gini Differences by region
According to the data in Table 9, the specific evolution of the Gini Differences is shown in Figures 3–6 as visual observation of its changes. Considering the difficulty of data retrieval, the data from 2005, 2010, 2015, and 2020 were selected for observation, with the missing years during each period, such as the data from 2005 to 2010, not being processed or counted, with them being positively correlated by default. From this, we can observe three consecutive planning periods: 2006–2010 is the 11th Five-Year Plan period, 2011–2015 is the 12th Five-Year Plan period, and 2016–2020 is the 13th Five-Year Plan period. This provides phased goals for developing agricultural and rural areas in different planning periods. The differences in overall, intra-regional, inter-regional, and super-density contributions in the different planning periods were also observed.
Figure 3 shows the overall Gini coefficient changes of the five dimensions. By placing their ordinates in the same interval, we not only see the changes in each dimension but can also make intuitive comparisons among each one.
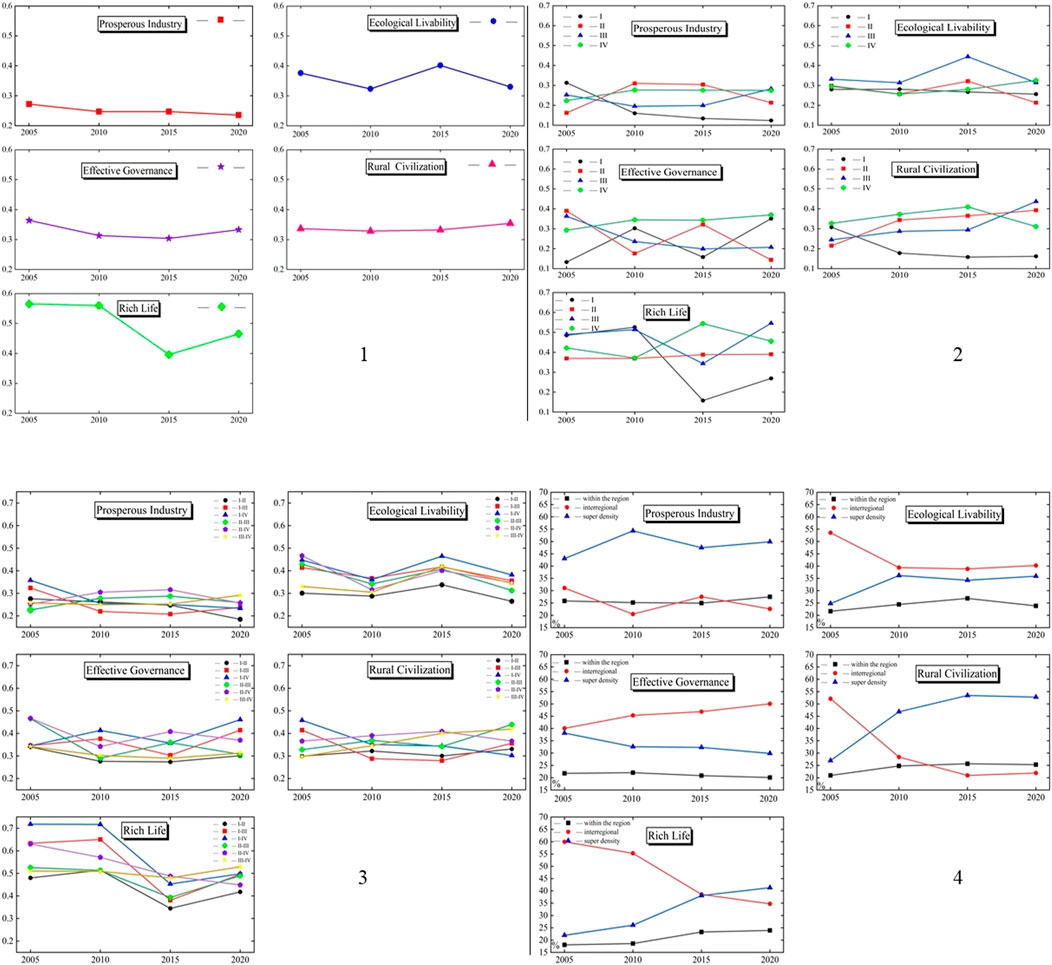
FIGURE 3. The evolution results of Gini coefficient of each type from 2005 to 2020.
The overall difference in industrial prosperity is lower than that of the other dimensions, with the dimension of affluence having the highest overall difference. The difference between effective governance and rural civilization is roughly similar. Herein, the prosperous industry, effective governance, and rural civilization dimensions have not changed significantly in these three planning periods, with the differences displayed fluctuating little. The overall difference in industrial prosperity was only 0.236 in 2020. This shows that the industry is booming and that there was little difference in the fiscal expenditure for developing agriculture and agriculture-related industries. In the three planning periods, the ecological livability dimension shows a fluctuating trend of initially falling, then rising, and then falling again. In the first two planning periods, the improvement effect of rural environmental remediation is obvious, with the rural environment improving within the capacity of PLAD. The difference between effective governance and rural civilization is about 0.3–0.4, with that in fiscal expenditure not being particularly large. However, the affluent life dimension was more limited by the economic development of each province, with a high Gini coefficient and large differences. This dimension reflects the large gap between the rich and the poor in the affluent life dimension in rural areas.
The intra-regional differences and their evolution are shown in Figure 3. The difference in the Gini coefficients between prosperous industry, effective governance, and rural civilization are similar, with it all occurring in the range of 0.1–0.4.
The Gini coefficient was the highest in 2005 and declined in the following years, reaching its lowest value of 0.124 in 2020. In the second region, it shows an inverted V-shaped trend, with the lowest point rising, reaching its highest in 2010, and then starting to decline again. However, the Gini coefficient in 2020 is still higher than that in 2005. In the third region, it presents a positive V shape, with the high point dropping to a low point and then rising again. Region IV demonstrates an overall upward trend, reaching the highest value of 0.277 in 2010, and slightly decreasing in the other 2 years, which were generally similar.
The difference in the ecological livable dimension in Region I is generally low and shows a downward trend, while the development of Region IV is generally upward. The trend of Region I in the last 2 years of 2010 is downward, while that of Region II is upward. The different trends of ecological livability in Regions II and III are the same, with both ups and downs.
Regions III and IV, with their effective governance, generally demonstrated a downward trend. The starting point of Region III is high, and the ending point is low, showing a downward trend as a whole. However, the intra-regional differences between Regions I and II declined in 2005 and 2010 and then showed different trends, with I first falling and then rising and II first rising and then falling. Wave curves with different trends in each stage are presented in Regions I and II.
There is a change in the regional differences of rural civilization, except for Region I, with those of Regions II, III, and IV rising in the first two stages and the differences between Regions II and III continuing to rise thereafter, while that of Region IV then begins to decline. From 2005 to 2015, China’s economy developed rapidly, implying that people’s demand for education increased. Compared with the PLAD, there is a gap in the rural magnitude and financial expenditure degree in the second and third regions.
The difference in affluent areas is somewhat higher than that in the other dimensions, with its range being large. Specifically, both Regions I and III show a state of repeated changes from top to bottom, with the changing state being the same in each stage, with them showing a trend of rising first, then falling, and then rising again. Region I had a large downward trend in the second stage, from 0.526 in 2010 to 0.158 in 2015, and the regional differences changed greatly.
Figure 3 shows the inter-regional gap and its evolution. The 31PLAD is divided into four regions, with six differences between them.
As shown in Figure 3, the trend changes of Regions II–IV and Regions II–III within the industrial prosperity dimension are similar. They rise in the first two stages and fall in the latter stage. The Gini coefficient of the difference between Regions I and II decreased. Between Regions I and IV, it first decreased, then slightly increased, and then decreased again. The Gini coefficient between Regions I-III initially decreased and then increased, while the difference between Regions III-IV first decreased slightly and then increased. The Gini coefficient of the regional differences in industrial prosperity is generally lower than 0.358.
Changes in the six regions in terms of the ecological livability dimension all showcase the same trend, as they first decline, then rise, and then fall. A possible reason for this is that the overall ecological livability dimension experienced the same trend as the other differences among the six regions. In this dimension, the regional differences of different revitalization intensity levels are similar to those among provinces.
Effective governance in Regions I–IV and II–IV showcase the same trend, falling initially, then rising, and then falling again. The trend between Regions I–III and I–IV is the opposite, first rising, then falling, and then rising again. However, the trend of Regions III–IV and I–II is the same as the overall trend, which decreases slowly in the first two stages and then rises slowly in the latter stage; however, the overall change is not large. Regions I–II and III–IV share a similar intensity of rural revitalization level, with the changes between these regions being similar to those between the whole.
From 2005 to 2020, the Gini coefficient between Regions I–IV of rural civilization decreased continuously, while that between Regions III–IV increased continuously. The intensity of rural revitalization varied greatly between Regions I and IV. The degree of rural revitalization in Regions III and IV was similar, with it rising continuously across all three stages, with the difference in fiscal expenditure between the two regions increasing. The trends of Regions I–II and II–III are the same in the first two stages but opposite in the latter stage. The difference between Regions I and III showcase a V-shaped trend, which first decreased, then slightly decreased again, and then increased in the next stage. The difference between Regions II and IV is inverted and V-shaped, rising first, then rising slightly again, and then falling.
In the affluent life dimension, the difference trend among the other four regions, except for Regions II–IV and III–IV, is almost the same as the overall difference trend. There may be a slight increase or a significant decrease in the first stage between the other IV regions. Further, the difference between other regions, such as Regions II–IV, decreased, and the decline was almost straight and inclined. The main difference between Regions III–IV is that their rise and decline are not obvious, with a slight increase in the first stage, a slight decrease in the second stage, and a slight increase in the third stage.
The changes in intra-regional, inter-regional, and super-density contribution rates among the five dimensions are shown in Figure 3.
As shown in Figure 3, the contribution within the region is the lowest of the five dimensions. The contribution rate of ultra-density is high in industrial prosperity and ranks second in the dimensions of ecological livability and effective governance. The contribution rates of the rural civilization and affluent life dimensions between regions and the over-density show large changes. The super-density contribution rate of rural civilization shows a sequentially rising trend, while the super-density contribution rate between regions decreased continuously in the first two stages and then rose slightly, with the highest super-density contribution rate reaching 52.775% and the highest inter-regional contribution rate reaching 52.064%. The super-density contribution rate of affluent life continues to rise, while the contribution rate between regions is declining at each stage, with the highest contribution rate of super-density reaching 41.316% and the highest contribution rate between regions reaching 59.963%. After observing the changes in these five dimensions, we can see that there is a negative correlation between the contribution rate of hyperdensity and that between regions.
5 Conclusion
This study attempted to investigate the fiscal expenditure on certain rural dimensions to examine its effectiveness and the degree of differences therein, as well as the possible future support ratio to make an effective forecast of future trends. According to the statistical data and the reasons for the index selection, there are some errors therein, indicating a margin for speculation. There may be a gap between the calculation of data expenditure and the actual expenditure. First, the gap source lies in the fact that the index coverage of statistical data cannot cover all relevant fiscal expenditures. After repeatedly considering the feasibility and computability of the indicators, the indicators with strong correlations are selected for calculation. Second, whether the indicators can represent the expenditure in this area is mainly analyzed using the existing data and interpreted subjectively, so there are differences from the specific real expenditure. It is the limitation of this study in estimating expenditure. However, the merit of this paper is to select a large number of minute indicators, collect and calculate them, and classify and sort the fiscal expenditure of various dimensions. All kinds of trend changes and overall proportion changes that may exist are obtained. The real expenditure value is not specific, but the change of proportion can be used for reference, which is also the core content of this study.
This paper explores the expenditure of each dimension from the results, provides references for provinces and cities to observe the development of each dimension and suggests policies on this basis. Each dimension pays more attention to supporting agriculture, that is, putting forward suggestions from the perspective of financial support for the development of each dimension. From the two levels of time and region, the former was used to investigate the changes in expenditure effectiveness in different periods in the same region, while the latter was used to investigate the differences in expenditure effectiveness in the same period in different regions. According to our results, we put forward the following policy recommendations.
First, in terms of all dimensions of rural revitalization, to enhance the linkage development among them—for example, when promoting industrial development—local industries should be examined simultaneously to develop tourism, expand investment, strengthen inter-regional mobility, and promote the development of basic culture, education, and entertainment. Villages should also focus on green development in developing industries and enhance the development of basic industries and the efficiency of governance on a pro-environmental basis.
Second, in the industrial prosperity dimension, we should try to scale agricultural operations, accelerate industrial diversification, and engage in local industries according to local conditions. Further, we should guide the land transfer income to gradually and reasonably flow into the construction and investment of basic agriculture. The state has always attached great importance to the development of basic agriculture, with the proportion of fiscal expenditure in various provinces being reflected herein. In addition to the large scale of fiscal expenditure, when arranging funds for supporting agriculture, we should also focus on the rational distribution of land transfer income to various industries. Based on the ecological livability dimension and rural living environment improvement, tourism development relies on the local ecological landscape, as well as the local history and culture. Increasing local characteristics and preserving their cultural forms is thus important herein. Rural infrastructure has developed well in recent years; however, environmental sanitation management is still imperfect and is less developed when compared with that of cities. Combined with the local governance level, building a high-level governance team is thus necessary.
Third, we should focus on basic education in less developed rural areas in the rural civilization dimension. The PLAD with relatively underdeveloped rural education in Regions II and III should improve their level of financial expenditure or land transfer income to support basic education, attach importance to educational infrastructure construction and basic education investment, introduce teachers with high-quality teaching level, and protect the rights and interests of teachers and students. In the effective dimension of governance, the distribution ratio among several regions is higher in the first region, while the expenditure degree of the effective dimension of governance in the second, third, and fourth regions is low. Another PLAD with weak rural revitalization intensity has a relatively low rural governance level and efficiency. Therefore, the rural grass-roots government organizations in the introspection (city, district) of this region should introduce high-level talent with advanced ideas suiting the local situation and gradually improve the level of grass-roots governance.
Finally, in terms of land revenue arrangement, combined with the data forecast to improve the use efficiency of land transfer revenue and clarify the path of grass-roots government and actual implementers, the following suggestions are provided. These include implementing phased planning mission objectives that comprehensively consider the financial strength of each region, the scale of land transfer income, and the needs of local production and development. Fund management should be strengthened and the overall fund structure should be planned. Further, provincial-level planning should be implemented and the difference ratio determined. Additionally, strengthening the accounting of capital revenue and expenditure, the degree of capital for all provinces, cities, and counties, as well as the degree of development of all dimensions, should be considered when making a unified plan. National key investment directions, such as farmland or basic water conservancy and hydropower construction funds, should primarily be retained in the policy coordination of provinces, cities, and counties (districts). Further, a clear supervision system and the establishment of land transfer income to support the rural development of the relevant institutions should be organized. Further, clear capital and personnel supervision need to be ensured. Next, fund supervision should be used to strengthen relevant audits to ensure the transparent and efficient use of funds. Additionally, personnel supervision should be used to strengthen internal and external supervision, as well as the opening of hotlines in relevant areas to ensure timely feedback of information and relevant amendments. Regions should also reasonably arrange their local organizational structure and be familiar with the measures and regulations for managing land transfer income to solve the problem of rural revitalization in cities, counties, and rural areas. The development of publicity methods to ensure the implementation of policies should also be ensured. All provinces, cities, and counties should observe the local rural characteristics and publicize them through multiple channels. Further, they should organize and arrange personnel to clarify the land transfer income and rural revitalization-related policies. Additionally, they should train personnel with high efficiency and strong execution ability to organize and implement relevant policies. Finally, the implementation of policies should be flexible overall.
Data availability statement
Publicly available datasets were analyzed in this study. This data can be found here: https://www.cnki.net/.
Author contributions
YW and YX wrote the main manuscript text. YW directed and revised the manuscript and contributed to all aspects of this work. YW and YX worked together to collect and process data. All author reviewed the manuscript.
Funding
This research was supported by the National Natural Science Foundation of China 2020 (grant no. 42071248); Key discipline Construction Project of Liaoning Province Social Science Planning Fund in 2022: A study on the alternative Land supply and financing Model of Liaoning Province Land Finance based on Regional differentiation (L22DZ057) and General subject of Economic and Social Development of Liaoning Union of Social Sciences in 2022: study on the formation Mechanism and scale estimation of Ecological cost of Land Finance Model in Liaoning Province (2022lslybkt-021).
Acknowledgments
The authors would like to acknowledge all colleagues and friends who have voluntarily reviewed the translation of the survey and the manuscript of this study.
Conflict of interest
The authors declare that the research was conducted in the absence of any commercial or financial relationships that could be construed as a potential conflict of interest.
Publisher’s note
All claims expressed in this article are solely those of the authors and do not necessarily represent those of their affiliated organizations, or those of the publisher, the editors and the reviewers. Any product that may be evaluated in this article, or claim that may be made by its manufacturer, is not guaranteed or endorsed by the publisher.
References
Chen, X., Liu, J., Zhou, J., Wang, J., Chen, C., and Song, Y. (2018). Urban particulate matter (PM) suppresses airway antibacterial defence. Respir. Res. 35 (1), 5–12. doi:10.1186/s12931-017-0700-0
Guo, J., and Lu, J. (2021). Mode choice and path of rural revitalization promoted by industrial prosperity [J]. J. Northwest Univ. (Philosophy Soc. Sci. Ed. 51 (6), 42–51. doi:10.16152/j.cnki.xdxbsk.2021-06-004
Guo, X., Zhang, K., and Yu, H. (2018). etc. Systematic understanding and road choice of implementing rural revitalization strategy [J]. Rural. Econ. 1, 11–20.
Guo, Y., and Liu, Y. (2021). China's rural development process and rural revitalization path [J]. J. Geogr. 76 (6), 1408–1421.
Hai, J., and Chen, L. (2019). Group consensus on fair distribution of land value-added income and its promotion path [J]. China Land Sci. 33 (2), 33–40.
He, X. (2021). Homestead, rural revitalization and urbanization [J]. J. Nanjing Agric. Univ. Soc. Sci. Ed. 21 (4), 1–8. doi:10.19714/j.cnki.1671-7465.2021.0050
Huang, Z. (2018). Accurately grasp China's rural revitalization strategy [J]. China Rural. Econ. 4, 2–12.
Ju, Z. (2005). Historical review of China's financial support for agriculture since the reform and opening up [J]. J. Shandong Agric. Manag. Cadre Coll. 4, 36–37.
Kong, X., and Lu, Y. (2019). Five models and countermeasures for building ecologically livable beautiful countryside-Enlightenment from the investigation of 20 villages in 5 provinces [J]. Econ. Horiz. 1, 19–28. doi:10.16528/j.cnki.22-1054/f.201901019
Li, H., and Qian, Z. (2004). Fiscal policy of supporting agriculture and China's agricultural growth: Causal and structural analysis [J]. China Rural. Econ. 8, 38–43.
Liu, B., and Chen, Y. (2020). The realization path of rural civilization construction under the background of rural revitalization [J]. Agric. Econ. 10, 50–52.
Liu, M., and Wang, S. (2020). Organic connection between industrial poverty alleviation and industrial prosperity: Logical relationship, difficulties and realization path [J]. J. Northwest Normal Univ. Soc. Sci. Ed. 57 (4), 137–144. doi:10.16783/j.cnki.nwnus.2020.04.017
Liu, T., and Song, J. (2020). Path, problems and countermeasures of rural revitalization promoted by financial support for agriculture policy [J]. Econ. Horiz. 6, 55–60. doi:10.16528/j.cnki.22-1054/f.202006055
Liu, X. (2021). Institutional mechanism innovation and policy optimization of financial support for rural revitalization strategy [J]. Account. Res. 11, 4–12.
Liu, X., and Li, Q. (2020). Study on the subjective endogenous motivation of rural revitalization and its stimulating path [J]. Resour. Environ. Arid Area 34 (8), 27–34. doi:10.13448/j.cnki.jalre.2020.207
Liu, Y. (2014). Analysis and reconstruction of the ownership of collective land value-added income [J]. J. Northeast Normal Univ. (Philosophy Soc. Sci. Ed. 6 (43), 43–46.
Liu, Y., and Hu, Y. (2017). Farmers' rights and interests: The fundamental problem of rural land value-added income distribution [J]. Financial Sci. 7, 40–49.
Liu, Y. (2018). Introduction to land use and rural sustainability in China. Land Use Policy 74, 1–4. doi:10.1016/j.landusepol.2018.01.032
Liu, Y. (2018). Urban-rural integration and rural revitalization in China's new era [J]. J. Geogr. 73 (4), 637–650.
Long, H., and Chen, K. (2021). Realizing the effective connection between consolidating and expanding poverty alleviation and difficulties tackling achievements and rural revitalization: Research framework and prospect [J]. Econ. Geogr. 41 (8), 1–9. doi:10.15957/j.cnki.jjdl.2021.08.001
Lu, F., Pang, Z., and Deng, G. (2022). Measurement and formation mechanism of regional differences in rural revitalization and development in China [J]. Explor. Econ. Problems 4, 19–36.
Lv, C., and Cui, Y. (2021). Rural revitalization and development: Index evaluation system, regional gap and spatial polarization [J]. Agric. Econ. Issues 5, 20–32. doi:10.13246/j.cnki.iae.2021.05.004
Mao, J. (2021). Improvement of the construction method of rural revitalization evaluation index system and its empirical study [J]. J. Lanzhou Univ. Soc. Sci. Ed. 49 (3), 47–58. doi:10.13885/j.issn.1000-2804.2021.03.005
Ning, Y. (2012). Characteristics, problems and governance of urbanization in China [J]. Nanjing Soc. Sci. 10, 19–27. doi:10.15937/j.cnki.issn1001-8263.2012.10.014
Peng, L. (2016). Land development right and distribution of land value-added income in China and British experience [J]. Chin. Foreign Law 28 (6), 1536–1553.
Shi, L., and Jin, Z. (2021). Research on the optimization of financial support for agriculture efficiency in rural revitalization in China [J]. Contemp. Econ. Res. 5, 103–112.
Tan, H., and Luo, J. (2018). Rural revitalization strategy: Solution and development path of "agriculture, rural areas and farmers" in the new era [J]. Jiangxi Soc. Sci. 38 (9), 209–217.
Tang, X., and Li, D. (2019). Cultural embedding: The value orientation and realistic path of rural civilization construction in the new era [J]. Seek. truth 2, 86–96.
Tian, Y., Chun, W., and An, M. (2021). Evaluation of agricultural modernization development efficiency under rural revitalization strategy-Joint analysis based on super-efficiency DEA and comprehensive entropy method [J]. Agric. Econ. Probl. 3, 100–113. doi:10.13246/j.cnki.iae.2021.03.009
Wang, C. (2006). Research on the "semi-urbanization" of rural floating population [J]. Sociol. Res. 5, 107–122 +244. doi:10.19934/j.cnki.shxyj.2006.05.005
Wang, Y., and Su, Y. (2017). Rural revitalization-A new strategy for rural development in China [J]. J. Central Inst. Social. 6, 49–55.
Wang, Y., Xue, Y., and Xi, J. (2022). Inter-provincial differences in potential obstacles to land transfer income to support rural revitalization in China. Land 11, 510. doi:10.3390/land11040510
Xiao, W. (2020). Financial support for rural revitalization: Theoretical interpretation and important role [J]. J. Theory 4, 58–66. doi:10.14110/j.cnki.cn-37-1059/d.2020.04.008
Xu, J. (2019). Implementing rural revitalization strategy and deepening financial system reform [J]. Agric. Econ. Manag. 6, 5–13.
Yan, K., and Bao, S. (2019). Study on the sustainability of land transfer income [J]. Financ. Think. Tank. 4 (6), 57–79 +142.
Yan, K., and Bao, S. (2019). Thinking and implementation path of financial support for rural revitalization strategy [J]. Res. Financial Issues 3, 90–97. doi:10.19654/j.cnki.cjwtyj.2019.03.011
Yang, H. (2015). On the institutional guarantee for farmers to share land value-added benefits fairly [J]. Rural. Econ. 3 (34), 30–34.
Yang, J., Yang, R., Chen, M-H., Su, C-H., Zhi, Y., and Xi, J. (2021). Effects of rural revitalization on rural tourism. J. Hosp. Tour. Manag. 47, 35–45. doi:10.1016/j.jhtm.2021.02.008
Yao, S., and Shi, Y. (2020). Research on the path of co-construction, governance and sharing of rural revitalization [J]. China Rural. Econ. 2, 14–29.
Zhang, A., and Yue, H. (2016). On the balanced distribution of land value-added income in linking the increase and decrease of urban and rural construction land-taking Yinji Township, Xiangyang City, Hubei Province as an example [J]. J. Huazhong Univ. Sci. Technol. Soc. Sci. Ed. 30 (4), 91–98. doi:10.19648/j.cnki.jhustss1980.2016.04.017
Zhang, T., Xu, Y., and Li, H. (2018). Study on the effectiveness evaluation of rural construction and the internal influence mechanism of indicators [J]. China Popul. Resour. Environ. 28 (11), 37–46.
Zhang, W., and Ouyang, J. (2021). Financial support policy choice for high-quality agricultural development from the perspective of rural revitalization [J]. Jiangxi Soc. Sci. 41 (2), 72–84.
Zhang, Y., Zhao, Y., and Zhou, L. (2021). Rural revitalization evaluation and regional comparison based on improved TOPSIS method [J]. China Agric. Resour. Regionalization 42 (2), 207–217.
Zhao, T., Zhang, Y., and Li, Y. (2021). Rural civilization construction under the background of rural revitalization-based on the typical case analysis of village-level "rural civilization construction" in China [J]. J. Northwest A&F Univ. Soc. Sci. Ed. 21 (3), 46–53. doi:10.13968/j.cnki.1009-9107.2021.03.06
Keywords: land transfer income, rural revitalization, proportion is suitable for distribution, regional differences, PLAD
Citation: Wang Y and Xue Y (2022) Calculation of inter-provincial differences in the appropriate proportioning of land transfer income to support rural revitalization. Front. Environ. Sci. 10:1061401. doi: 10.3389/fenvs.2022.1061401
Received: 04 October 2022; Accepted: 11 November 2022;
Published: 28 November 2022.
Edited by:
Bao-Jie He, Chongqing University, ChinaReviewed by:
Xiaowei Li, Xi’an University of Architecture and Technology, ChinaChenxi Li, Xi’an University of Architecture and Technology, China
Copyright © 2022 Wang and Xue. This is an open-access article distributed under the terms of the Creative Commons Attribution License (CC BY). The use, distribution or reproduction in other forums is permitted, provided the original author(s) and the copyright owner(s) are credited and that the original publication in this journal is cited, in accordance with accepted academic practice. No use, distribution or reproduction is permitted which does not comply with these terms.
*Correspondence: Yubo Wang, wangyubo@wfxy.neu.edu.cn