How big data drives green economic development: Evidence from China
 Li Wang
 Yuhan Wu
 Zeyu Huang
 Yanan Wang
- 1School of Economics, Faculty of Economics and Management, East China Normal University, Shanghai, China
- 2School of Economics Faculty of Economics, Renmin University of China, Beijing, China
- 3School of Economics and Finance, South China University of Technology, Guangzhou, Guangdong, China
Big data can improve production efficiency and optimize resource allocation, which is conductive to achieve sustainable development. This paper explores the impact of big data on green economic development. The global MINDW-MML model is used to measure green economic development and text analysis method is used to quantify the development of big data. An empirical study is conducted based on the panel data from 30 provinces in China from 2011 to 2018. Results show that, big data promotes the development of green economy and plays a greater role in facilitating technological progress than improving efficiency. As for sub-indicators of big data, cloud computing, Internet of things, artificial intelligence, and Hadoop positively affect technological progress, while blockchain can improve efficiency. In addition, the positive role of big data in promoting green technological progress and green efficiency will vary according to geographical location, the intensity of environmental governance and the development of digital financial inclusion. As moving into the good phase of the economy, big data is more inclined to enhance green technological progress, while in a sluggish phase, it improves green efficiency more. These findings point the way forward for sustainable development. The Chinese government can actively build information infrastructure and improve the technical level and application capacity of big data.
1 Introduction
Over the past decades, China’s economy has experienced rapid growth, which has also resulted in a host of problems including environmental pollution, excessive energy consumption, and unbalanced economic growth. These problems of unsustainable development need to be solved urgently. China’s new development concept adheres to innovation, coordination, greenness, openness, and sharing, especially emphasizing that green development is the key to high-quality development. To achieve this goal, resource conservation and environmental protection must be considered, and economic quality can be improved through technological innovation, industrial development, and resource allocation.
Since the Fourth Industrial Revolution, big data is increasingly becoming a strategic resource. The 2021 China Big Data Industry Development Report anticipates that “China’s big data industry market will maintain a growth rate of more than 12% in the future, and the overall scale will reach 1,152.25 billion yuan by 2023.” By utilizing modern technology to collect, refine, analyze and create value from data, the social economy will be transformed into a new model of high yield, low consumption and collaboration. In other word, big data plays an important role in promoting green and sustainable development. In this context, it is necessary to examine the impact of big data on the development of green economy. This will not only help clarify the practical role of big data, but also provide a new direction for China’s sustainable development.
In fact, the question whether big data promotes green economic development in China deserves further consideration. First of all, considering the Fourth Industrial Revolution sweeping the world and the prevalence of digitalization, no country can avoid the necessity of developing big data (Manyika et al., 2011). Next, in order to transform economic growth, the role of big data in fostering sustainable development and leading a new round of scientific and technological innovation must be strengthened (Xu et al., 2019). However, the academic community has not yet reached a unified conclusion on the impact of big data on environmental sustainability, and systematic studies are lacking. The study of Xu et al. (2019) has explained how big data and green economic development are linked, but there is not enough empirical research to prove it. Big data is a broad concept, which contains many technologies, and research on the impact of the sub-indicators of big data on green economic development is still insufficient. In addition, whether there is heterogeneity between different geographical locations, environmental governance and the development of digital financial inclusion requires further investigation. Under the strategic goal of sustainable development, it is important to clarify the characteristics and mechanisms of big data that influence the development of green economy. Therefore, empirical studies on the impact of big data on green economic development are needed.
To this end, GTFP (green total factor productivity) is considered as an important measure of green economic development in this study. A text analysis method is used to quantify the development of big data on the basis of Baidu Index. Based on the panel data of 30 provinces in China from 2011 to 2018, this paper explores the impact and mechanism of big data on GTFP in detail. Empirical findings show that big data has a positive effect on the development of green economy, and this positive effect is more reflected in green technology progress than green efficiency improvements. This main finding provides important empirical evidence for the development of green economy driven by big data and give a light on the direction of sustainable development in China. In addition, this paper finds that there is a heterogeneity of big data on green technological progress and green efficiency improvement in different areas and periods. Specially, as moving into the good phase of the economy, big data is more inclined to enhance green technological progress, while in a sluggish phase, it improves green efficiency more. This indicates that more developing countries can increase the construction of information facilities to make big data a new economic growth point.
Compared to previous literature, this paper provides four marginal contributions. First, as for the research topic, this paper pays more attention to the impact of big data on green economy development rather than simply focusing on economic benefits. Some studies on the economic benefit of big data (e.g., Del Giudice et al., 2020; Johnson et al., 2021) explored the impact of big data on industry, workforce, and supply chain. However, few studies include environment and sustainable concept into the research framework. It has gradually become a new consensus that big data plays an important role in promoting green and sustainable development (Jin et al., 2021). Therefore, this paper puts forward a new research direction in the field of big data and economy. It not only expands the research on the economic benefits of big data, but also provides new ideas for promoting the development of green economy. Second, a MML (meta-Frontier Malmquist-Luenberger) productivity index is used to calculate GTFP for 30 provinces throughout China from 2011 to 2018. This paper also identifies the dual drivers of GTFP, green technological progress and green efficiency improvements, which helps to clarify China’s green economic development status. Third, as for index construction, this paper divides big data indicators into six sub-indicators based on different technologies, such as big data, artificial intelligence, blockchain, Internet of things, cloud computing, and Hadoop. Decompose each index to identify its decomposition effect on promoting green economic development. Fourth, based on econometric analysis, this paper focuses on the mechanism of big data affecting the green economic development, as well as looking at the heterogeneous effects of big data on green economic development, in relation to geographical location, environmental regulation, digital financial inclusion and economic conditions.
The remainder of the article is organized as follows. Section 2 provides the introduction of big data and literature review. Section 3 gives theoretical analysis and hypotheses. Section 4 describes the empirical model, the variables, and the data. Section 5 shows the empirical results and further discussions. Section 6 summarizes the conclusions, limitations and provides policy implications.
2 Literature review
2.1 Big data
With the fusion of the human, machine, and material world, the explosion of data has brought about the networked big data era. A wide range of Internet technologies, such as big data and cloud computing, have been contributed to widespread use in fields like economy, society, biology, and environment. They improve the efficiency of information production and dissemination, and thus promote high-quality development through innovation and structural upgrading.
As far as research trends are concerned, Jim Gray, who won the Turing Award, proposed the fourth paradigm, emphasizing data-intensive scientific research. Top international journals such as Nature and Science have published special issues on big data since 2008. In 2011, the famous consulting firm McKinsey suggested that the application of big data could translate into a new wave of productivity growth. Aside from academia, governments around the world are also paying close attention to the development and application of big data technologies. United States officials announced in 2012 the “Big Data Development Plan,” which focuses on the use of big data in areas such as the environment, engineering, scientific research, etc. In the same year, the United Nations released “Big data for development” to describe the initial applications of big data and the opportunities and challenges faced by countries. In China, a Big Data Expert Committee was established by China Computer Federation to discuss scientific and technical issues related to big data.
Generally, big data refers to a collection of data that cannot be acquired, managed, and processed by traditional IT tools in a reasonable amount of time1. Data redundancy, high dimensions, and complex feature relationships are its main characteristics (Wu et al., 2014). Big data comes in many forms, ranging from structured data logically expressed in two-dimensional tables to unstructured data such as text, images, video, and audio. “Big Data,” published by Victor Mayer-Schönberg and Kenneth Kaye in 2013, summarizes the 4 V principles of it, which are Volume (large data capacity), Variety (multiple types of data), Velocity (rapid processing speed) and Value (low value density). To extract the hidden value in the massive data, it would be necessary to apply technologies such as cloud computing and Hadoop. The use of data coupled with labor, technology, and management can be used to analyze, judge, and predict natural and socioeconomic issues.
At present, big data is considered as a strategic information resource. Research on big data is mainly concerned with the acquisition, storage, processing, management, and application of data. Scholars from diverse fields collect and process text data, high-frequency price data, population and land data, transaction data, daily business data et al., calculating proxy indicators and conducting further research. Other research examines the impact of big data, since it is triggering shifts in various fields such as pedagogy, healthcare, and transport. In specific, educational big data is used for employment recommendation and student academic performance prediction (Bai et al., 2021). As for healthcare industry, by helping design, analyze and optimize operations, big data leads to better management of healthcare resources. Mitroshin et al. (2022) collected and interpreted data of Moscow transport system by using data mining. In economics research, Magazzino and Mele (2020) combined supervised Machine Learning and econometric methods to verify causality.
2.2 Green economic development
Since the Industrial Revolution, human society has created countless material wealth and economic achievements. However, environmental problems have also occurred, causing worldwide attention to the concept of green development. The report of the 19th National Congress of the Communist Party of China highlights that, as China enters a new stage, it is necessary to adhere to the new development concept of “innovation, coordination, green, openness, and sharing.” Since then green economic development has gradually become a research hot topic.
Researchers are interested in green economic development mainly in terms of measuring it and studying its influences. As for measurement of green economic development, foreign scholars incorporated environmental factors into their calculations and reached breakthrough results. Based on traditional production efficiency indicators (Malmquist, 1953; Caves et al., 1982), Chung et al. (1997) constructed a Malmquist-Luenberger (ML) productivity function that takes into account undesired outputs like environmental pollution. Some scholars (Chung et al., 1997; Watanabe and Tanaka, 2007) use it to measure GTFP. On this basis, Tao and Qi (2012) used the ML and GML indices to determine China’s inter-provincial GTFP under resource and environmental limitations. With data from 2000–2010, Wang and Huang (2014) performed a regional analysis of green development efficiency and green total factor productivity in China.
As for factors influencing green economic development, scholars examined a lot. Guo Y. et al. (2020) found that industrial agglomeration has a U-shaped effect on green development in northeast China. According to Li G. et al. (2021), digital financial inclusion stimulates green development by aggregating producer services. Through short- and long-term external finance mechanisms, Xu et al. (2022) described how environmental regulation impacts green finance. According to Taş k ı n et al. (2020), renewable energy consumption and trade openness contribute to green economic growth. Yue et al. (2016) found that foreign investment can promote green economic development, but it will be constrained by threshold conditions such as institutional environment and industry structure.
2.3 Big data and green economic development
The drivers of GTFP have been extensively studied in terms of environmental regulations, human capital, FDI, and industrial agglomeration, but there is relatively little research on the impact of big data on green economic development.
Literature on big data is divided: one view is that big data can contribute significantly to green economic development. As a micro perspective, Intizar Ali et al. (2021) suggested that big data can enhance enterprise performance by enhancing competitive advantages. El-Kassar and Singh (2019) pointed out that big data promoted green innovation in enterprises, thereby encouraging green growth. Jin et al. (2021) found that big data has become an increasingly important catalyst for green technology development. From a macro perspective, digital technologies such as the Internet of things, big data analytics, cloud computing, and artificial intelligence are enabling manufacturing and logistics cooperation to move towards GTFP (Khan et al., 2021). Liu et al. (2022) found that digitalization, represented by Internet of things and other digital technologies, is the primary driver of inclusive green growth in cities. Considering ecological priority, 43% of China’s population benefited from the development of digital technology in 2019 (Wen, 2022). Besides, big data can be used to guide green building development, new products, green building materials, and new materials, to implement cleaner production, and to prevent pollution (Fang, 2018).
There is another view that big data does not necessarily have a significant impact on green economic development, and possibly even a negative one. Cowen (2012) pointed out that computer and Internet technology had not had a significant impact on productivity. Chasemaghaei and Calic (2020) categorized big data into three dimensions: quantity, type, and speed, and found that increasing the quantity of big data would not improve green efficiency of enterprises. As Crawford (2013) mentioned, big data analysis may be biased depending on agendas. Big data analysis is limited by existing way of collecting and storage, existing infrastructure, and the lack of experience in green entrepreneurship, alternative energy, and green production (Ignatyuk et al., 2020). A study by Brynjolfsson et al. (2017) also suggested that there are four possible explanations for the AI productivity paradox: false expectations, measurement errors, centralized distribution, and dissipation of rent, and implementation and restructuring delays.
In conclusion, no consensus has been reached on the impact of big data on green economic development. And there is a lack of direct research on the relationship between big data and green economic development. Therefore, this study analyzes the mechanism of big data on the development of green economy, providing a new perspective for the green transformation and upgrading of China’s economy. At the same time, the relationships between different types of big data technologies and green economic development are also examined. These findings will be of great practical significance to improving China’s digitalization level and promoting green development.
3 Hypothesis
3.1 Effects of big data on green economic development
In recent years, information technology has advanced, Internet of things has spread, cloud computing has grown, smart devices have become more popular, and the infrastructure for information has continually improved. Having established these foundations, big data can flourish. CPC Central Committee’s Fourth Plenary Session identified “data” as one of the production factors, and for the first time explicitly stated that data are involved at all stages of input, production, and distribution of income. Despite its own enormous value, big data also creates social value by collaborating with other factors like labor, capital, and management. In one hand, big data itself possesses immense capacity, reproducibility and speed. By generating, refining, and analyzing data through modern information technology, one can capture the potential information contained in massive amounts of data, and maximize value. Meanwhile, integration of big data and traditional production factors may accelerate the pace of technological upgrading. Along with the spillover effect of knowledge and technology, big data creates greater output with less input.
In practice, green economic development refers to an economy’s improvement of quality and efficiency through technological innovation, industrial development, and resource allocation while protecting the environment and preserving resources. To realize green economic development strategies, big data helps promote economic and social changes on micro, meso, and macro levels.
At the micro level, big data has changed the way of thinking, and then changed traditional management modes. Data thinking emphasizes obtaining all data rather than samples, weakening statistical requirements, and finding correlations rather than causality (Meng and Zhu, 2013). By obtaining massive amounts of real-time data, enterprises can leverage technology to mine value, locate customers’ needs accurately, and streamline production, operation, and marketing. The study showed that data-driven decision-making increased the output and productivity of companies by 5%–6% over those using other investment and information technologies (Graetz and Michaels, 2015). Further, businesses utilize big data technology to carry out digital transformation, which optimizes business models and integrates online and offline resources. The result is improved production efficiency and reduced resource waste, thereby achieving sustainable development.
At the meso level, big data facilitates industrial upgrading and sophistication. In China, secondary industries take up relatively large proportions. High pollution levels, high energy use, and high emissions have adversely affected the ecology and environment. Big data serves as the “rich ore” of the 21st century, not only spawning new industries, but also transforming and upgrading existing ones. By implementing technology, the industry of big data management and processing has been formed. Its upstream and downstream industries, especially those related to electronic information, have also expanded rapidly. Additionally, big data drives the digital and intelligent transformation of traditional industries. It improves their production efficiency and technical level, which helps reduce resource consumption, increase resource utilization efficiency, and reduce environmental pollution. As a result, traditional industries are being innovatively transformed to produce new service formats, such as smart medical care, smart manufacturing, etc. By eliminating backward industries unable to adapt to emerging markets, they have progressed the modernization of the industrial structure.
At the macro level, big data promotes free flow of data and improves resource allocation. At present, China’s unbalanced economic structure and misallocation of resources are impeding sustainable development. The improvement of the data market facilitates the marketization of production factors, so as to better match supply and demand, and thereby facilitate the effective allocation of resources. Meanwhile, big data enhances public governance. Governments can carry out macro, systematic, and scientific analyses and monitor various economic sectors with the help of big data. Green economic development strategies and policies that consider environmental governance, resource conservation, and economic benefits can be created by the government to complement market-oriented initiatives.
On the basis of the above analysis, Hypothesis 1 is proposed.
Hypothesis 1: Big data can help drive green economic development.
3.2 Mechanism
3.2.1 Technological progress
Technological progress is defined as the change in optimal output caused by the same input over time (Farrell, 1957). At the micro level, big data can promote the innovation of technology, organization and business model of enterprises, increasing optimal output.
Firstly, big data improves the intelligence level of enterprises. In the rising labor cost scenario, enterprises can use big data technology to transform production equipment into intelligent machines, and upgrade their hardware and software. It helps improve capital returns and labor productivity (Li et al., 2017), which consolidate and develop company’s own technological advantages. As the big data market develops, it fosters the flow of production factors, cross-industry cooperation and information exchanges. As a result, enterprises are able to introduce and absorb external technology, promoting their own technological innovation.
Secondly, open, shared, and unlimited data disrupts traditional corporate organizational structures. The vertical management model has broken down, and individuals and enterprises join as nodes. Thus, a digital, networked, and collaborative data management platform is replacing the traditional mode which relies on executives. Using big data analysis, enterprises refine, update and expand organizational capabilities by absorbing internal and external resources extensively. Furthermore, the company promotes an institutionalized digital organization to adapt to the changing market environment.
Thirdly, big data helps enterprises improve production and operations, and it facilitates changes in business models as well. During the preliminary research phase, companies gather and process massive amounts of data to determine market demands, and come up with targeted product solutions. In the research and development stage, external data and demand information identify problems timely, so that the technological innovations of the team can meet customer’s needs. Also, big data technology can shorten product pilot cycles and prevent resource waste. Using AR/VR, cloud computing, and other information technologies to manage and monitor production can save human capital and improve product quality. In the marketing stage, enterprises can collect, process, and analyze multidimensional data, such as product sales and service evaluation, in order to perform more accurately and determine effective strategy. Therefore, a green manufacturing process can be achieved through the use of big data by utilizing resources more efficiently while improving productivity.
On the basis of transforming micro-enterprises and individuals, big data further promotes the development and progress of the industry. According to “The 14th Five-Year Plan for Big Data Industry Development,” big data is an emerging strategic industry involved in data generation, collection, storage, processing, analysis, and service. It is a comprehensive industry that covers the entire data generation to application process, i.e., digital industrialization. As a general information technology, big data also drives the development of artificial intelligence, cloud computing, and other related technologies, products, and services, promoting the high-quality development directly.
As labor, technology, and capital link industries together, traditional industries are able to undergo digitalization and intelligent transformation, which is referred to as “industry digitization.” In terms of business models and organizational forms, big data technology has transformed traditional industries, improved the efficiency of production and the accuracy of supply and demand matching, so that resources can be allocated more efficiently. Also, integration of big data technology into traditional industries leads to the advancement of the industrial structure. “2021–2022 Big Data Industry Report of China” observes that the Internet, government, finance, and telecommunications industries have formed new formats using big data, including financial technology, data security governance, and smart medical care. These emerging industries have advanced technical levels, management models, and product quality, which are leading industrial transformation.
Therefore, big data can lead to innovation at the micro-enterprise level, and industrial development at the meso-level, thereby enhancing pure technological development. Hypothesis 2a is proposed.
Hypothesis 2a: Green economic development is driven by big data through technological progress.
3.2.2 Utilization efficiency
Utilization efficiency is measured by the gap between maximum output and actual output (Farrell, 1957). Through resource-optimized allocation, big data enhances efficiency.
Firstly, big data improves production efficiency. In a traditional way, products need to go through the process of research and development, production, launch, analysis, adjustment, and reproduction. It is based on post-event sampling analysis, which is time-consuming and inefficient. Nowadays, due to big data technology, consumers and producers are becoming closer. By employing intelligent tools and technologies during the whole process, producers can get timely and direct feedback. As opposed to traditional data analysis, which emphasizes precise sampling, big data technology is based on full-sample, mixed, real data analysis. In this way, consumers’ diverse and personalized needs can be better analyzed to guide production, reduce waste, and improve efficiency. A recent study shows that companies that invest in big data can increase their production efficiency by 3%–7% (Müller et al., 2018).
Secondly, big data transforms organizational efficiency. A traditional organization model depends on the expansion of production scale to realize economic benefits. It is relatively closed, vertical, and linear. With big data, supply-side-oriented organizational management models based on economies of scale are gradually giving way to demand-side-oriented organizations based on economies of scope. Through the use of big data technology, companies can form collaborative networks to access data, scenarios, and processes. By effectively integrating information flow, talent flow, and capital flow, companies can communicate information between all parties in a short period of time, making it possible to take action in a timely and accurate manner. At the same time, big data guides enterprise efficiency improvement through top-down organizational reform, and optimizes business through bottom-up technology empowerment. It performs the role of operational management and detailed tracking, thereby improving enterprise efficiency.
Thirdly, due to big data, transaction efficiency has improved. Knowledge and information flow incompletely in traditional markets. Asymmetric information results in market failures such as adverse selection and moral hazard, causing a low transaction efficiency. However, big data era has greatly accelerated information circulation and dissemination due to its large capacity, rapid dissemination speed, and dynamic feedback. In the purchasing process, upstream and downstream enterprises communicate and monitor each other online instead of on-site, so cost is reduced and quality is guaranteed. To analyze consumer data comprehensively, companies use big data algorithms to target individual consumers. They accurately recommend suitable products to customers and place advertisements, which increases the success rate of transactions. In the circulation link, enterprises benefit from big data technology by receiving timely updates and feedback from offline sources. As a consequence, companies can arrange their own business ahead of time to shorten circulation times and improve overall transaction efficiency.
On the basis of the above analysis, Hypothesis 2b is proposed.
Hypothesis 2b: Green economic development is driven by big data through efficiency improvement.
3.3 Heterogeneity analysis
3.3.1 Regional heterogeneity
In China, regional development is unbalanced, and infrastructure construction, natural resources, and industrial layouts differ considerably among the eastern, central, and western parts of the nation. Regional TFP in China is found to be “high in the east and low in the west” according to some scholars. As a high-tech Frontier demonstration area, the eastern region has the advantages of resources, technology, and talent. Since the central region has taken over its industrial transfer from the eastern region, it also has advanced resources and infrastructure, such as the Industrial Internet and the IoT. Therefore, big data technology gathers various production factors, such as labor and energy, facilitating technological progress in the central and eastern regions, which enhances green economic development. In the western region, production methods are fairly extensive, and there are problems such as insufficient factor endowment and resources shortages. As a result of imperfect information infrastructure, modern information technology cannot fully contribute to sustainable development.
Rapid industrialization brought environmental problems such as high energy consumption and pollution, as well as damaging economic interests. In this regard, effective environmental governance helps promote high-quality development by improving the ecological environment. According to the “2021 China Environmental Status Bulletin,” water governance, air pollution, and soil pollution have been greatly improved the past few years, and environmental protection supervision has been bolstered. It indicates that innovative environmental governance policies, like the river chief system, can significantly alleviate environmental external pressures. The government’s emphasis on environmental governance allows local officials to consider environmental protection when urging enterprises to produce and operate. As a result of appropriate environmental regulation, enterprises are more likely to innovate technologically and implement energy-saving and emission-reducing equipment (Porter and Linde, 1995). Meanwhile, local governments encourage industries to form a cluster of environmentally friendly enterprises. This approach can convert traditional extensive production methods to low-carbon and green ones, eliminate high-polluting production capacities, and improve economic quality and quantity.
Technology empowers traditional finance, which benefits all groups by improving convenience and accessibility to financial services. Peking University’s Digital Financial Inclusion Index (2011–2020) shows a 29.1% annual growth rate in the province’s level, indicating its new stage of deep expansion (Guo F. et al., 2020). The majority of studies suggest that digital financial inclusion plays an important role in the promotion of green economic development. Using emerging technologies, such as big data and cloud computing, inclusive finance can offer suitable services to underdeveloped areas, small businesses, and low-income groups that are not covered by traditional finance, thereby reducing financing constraints and encouraging technological innovation (Hottenrott and Peters, 2012). Especially in the area of low-carbon and environmentally friendly production, there are many small and sophisticated companies whose financial needs can be accommodated by digital finance. By eliminating outdated technologies and developing new ones that are energy-saving and environmentally friendly, digital financial inclusion stimulates technology spillover effects and improve GTFP. It, therefore, promotes the optimization and upgrading of industrial structures by stimulating the vitality of entrepreneurship, improving the technological innovation of businesses, and thereby promoting inclusive and sustainable growth of the economy.
On the basis of the above analysis, Hypothesis 3 is proposed.
Hypothesis 3 Regional heterogeneities exist in the role of big data in promoting green economic development.
3.3.2 Temporal heterogeneity
On the basis of the research of Hodrick and Prescott (1997), this paper divides the economy stage of China into two stages: a good one and a sluggish one. During the sluggish economy stage, several derivative crises occurred, such as the European and American debt crises. During this time, China’s economic growth depended on large-scale industrial investment and infrastructure development. In the good economy stage, China entered a period of economic “new normal,” characterized by a change in growth rate, optimization of industrial structure, and a transformation of development momentum. This period saw a gradual rise in the tertiary industry, while consumption played an increasingly crucial role in economic development. Therefore, the transformation of economic cycle can be explained by transforming macroeconomic management from stimulating to nurturing, promoting technological innovation and industrial restructuring. It marks the beginning of a long-term growth trend in GDP and prepares the ground for the development of big data.
Therefore, Hypothesis 4 is proposed as follow:
Hypothesis 4 Big data’s impact on green economic development is heterogeneous across economic stages.Figure 1 presents the theoretical framework of big data affecting green economic development.
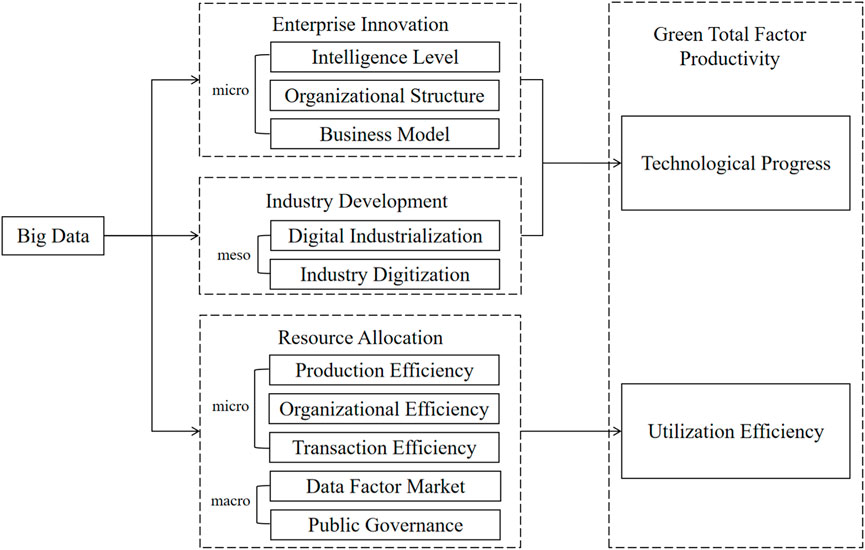
FIGURE 1. Mechanism of big Data’s impact on green economic development.
4 Research method
4.1 Measurement of green total factor productivity
4.1.1 Model specification
TFP (total factor productivity) refers to the speed at which economic growth occurs when the inputs of capital, labor, and other factors remain constant (Solow, 1957). In comparison with quantitative indicators of economic growth such as GDP, TFP can better reflect the quality of economic growth. As Farrell (1957) explains, changes in TFP are a function of technological progress and the efficiency of technology use. In order to measure green economic development, scholars mainly use GTFP (Chung et al., 1997; Watanabe and Tanaka, 2007). Labor, capital, and energy inputs are accounted for in the GTFP, as well as increases in desired outputs and decreases in undesired outputs. This aligns with the energy and environmental problems that China will be solving during economic development.
Currently, the non-parametric Malmquist index method is widely used in research. Shi and Li (2019) used MML productivity index to evaluate GTFP of China’s manufacturing. Based on the SBM model, Li J. et al. (2021) constructed MML index to comprehensively access GTFP on Chinese laying hens (GTCL). A quantitative analysis of the changes in industrial GTFP in the Yangtze River Economic Zone was performed by Zhang et al. (2022) using the MML index which takes into account expected and unexpected output. The key benefit of the MML index is its ability to avoid the mutual concealment of technological advancements and efficacy in research, so that the conclusion is more accurate.
This paper constructs the MML model using the MINDW distance function instead of the traditional SBM distance function. As in the SBM distance function, the projected point of the evaluated DMU is the farthest point on the Frontier from the evaluated DMU, which is a shortcoming as well as unreasonable. In the evaluator’s perspective, the shortest path is expected to reach the Frontier, but the target value provided by the SBM model is quite contrary to this (Cheng, 2015). In the MINDW distance function, the projected point on the effective front is the nearest point to the evaluated unit, which is more reasonable and in line with how the evaluators expect. Therefore, this paper uses the MML (meta-Frontier Malmquist-Luenberger) productivity index to calculate GTFP for 30 provinces of China from 2011 to 2018. It is decomposed into green technological progress index and green efficiency improvement index, which indicate how much technological innovation has taken place and how much efficiency has been improved.
According to Oh and Lee (2010), this paper constructs an estimation model of the dynamic productivity index, namely the global MINDW-MML model. Assuming that all decision units can be divided into G groups with different technical possibilities, the production possibility set of Group
Among them, the current reference set
For group
In Eq. 2,
Similarly, based on the MINDW distance function and the global reference set
In Eq. 3,
Further, the intra-group global ML index and the global MML index considering all groups can be decomposed. First, this paper defines the change in efficiency as the efficiency change index. Although the same global Frontier is referred when calculating the global ML index or MML index, calculation of the changes in efficiency still needs to refer to the respective frontiers of each period, namely:
In Eq. 4,
Additionally, the extent to which the group
where
In Eq. 6,
At the same time, this paper can also define TGR (Technological Gap Ratio) and its change Technological Gap Change. TGR connects the common Frontier of all groups and the Frontier of a single group, measuring the gaps between them, which is the efficiency gap of a decision-making unit under different frontiers. The larger TGR is, the closer the actual efficiency is to the potential efficiency. Specifically, TGR and its change TGC can be defined as:
Based on the above definitions of Efficiency Change, Technological Change and Technological Gap Ratio, this paper can decompose the global ML index within a group and the global MML index of all groups. There, as Eq. 8 shows, the global ML index within a group could be decomposed into
Similarly, the global MML index based on all groups can also be decomposed into
4.1.2 Data and variables
To keep the sample data comparable and reliable, the paper selects 30 provinces (autonomous regions and municipalities) in China as research samples from 2011 to 2018. The inputs, desirable outputs and undesirable output used for estimation come from China’s Urban Statistical Yearbook, China Land Resources Statistical Yearbook, China Urban Construction Statistical Yearbook, China Statistical Yearbook, Wind database and CEIC database.
4.1.2.1 Input variables
The input variables used for efficiency estimation involve three input variables: labor, capital, and energy. Firstly, this paper selects the number of employees in the unit as the measure of labor. Secondly, for the selection of energy indicators, this paper uses energy inputs from the province’s annual industrial electricity consumption. Finally, this paper takes the “perpetual inventory method” one step further in estimating capital stock at provinces based on the depreciation period.
4.1.2.2 Desirable output variables
The desirable output variable is the actual province-level GDP based on year 2000. The GDP index (previous year = 100) reflecting the actual GDP growth can be obtained from the Wind database. Based on the nominal GDP and the GDP Index, this paper can obtain the actual values of each province. Gross domestic product and GDP deflator (year 2000 = 100).
4.1.2.3 Undesirable output variables
This paper takes environmental pollutants during production as the undesirable output of production process. This paper utilizes three indicators as the undesired outputs, namely, industrial wastewater discharge, industrial soot discharge, and industrial sulfur dioxide production. It appears that the higher the value of these three indicators, the more undesired output and the more serious the environmental pollution problem is.
4.2 Measurement of big data
Using the Baidu Index keyword search big data and the required supporting technology, this paper chooses big data, artificial intelligence, blockchain, Internet of things, cloud computing, Hadoop, and data mining as the technologies to index. Specifically, Baidu’s index is searched for keywords plus provinces or municipalities in order to obtain the number of daily news headlines in each region. With the help of web crawler technology, the paper sums the daily data of each region every year, and then integrates the daily data into annual data. Finally, it summarizes the annual data of each region and year, and obtains a dataset of big data indicators.
4.3 Empirical models
As a test of Hypothesis 1, this paper introduces an econometric model that identifies the role of big data in promoting green economic development.
In this case,
As for Hypotheses 2a, 2b this paper examines how big data contributes to green economic development through technological progress and efficiency improvement.
Where
In addition, this paper examines the role of big data sub-indicators in promoting green economic development.
In this case,
To test Hypothesis 3, this paper conducts a sub-sample regression of 30 provinces and cities based on their geographic location, environmental governance level, and development of digital inclusive finance. Firstly, this paper divides the provinces into three geographical regions: east, middle, and west, and perform empirical analysis on each region. Secondly, based on the average number of national and provincial environmental protection professionals in each province, the top 15 provinces are classified as having high environmental governance levels, and the bottom 15 as having low ones. Finally, based on the average level of financial inclusion in each province, it is divided into two groups. Regressions are used to determine whether there are differences in the promotion of big data across provinces.
According to Hypothesis 4, the data of each province are divided into two stages based on economic states. This paper adopts HP filtering method to identify the state of economic development, and conducts HP filtering processing on the GDP data measured by constant price in each province (Hodrick and Prescott, 1997). If the GDP data is greater than the HP trend, it indicates that the economy stage is good, otherwise, the economy stage is sluggish.
4.4 Control variables
Based on existing literature, the model incorporates multiple inter-provincial variables, such as urbanization rate (
Urbanization rate (
Informatization level (
Government investments in science and technology (
Human capital level (
Industrial structure (
The descriptive statistics based on annual data from 2011 to 2018, are shown in Table 1. The average value of GTFP is about 1.0015. The average values of green technological progress and green efficiency change are 1.0024 and 0.9991, respectively. They show lower standard variation (around 0.008) than total green economic development (around 0.009). Besides, standard deviations of blockchain and industry structure are large, indicating a significant difference among different provinces.
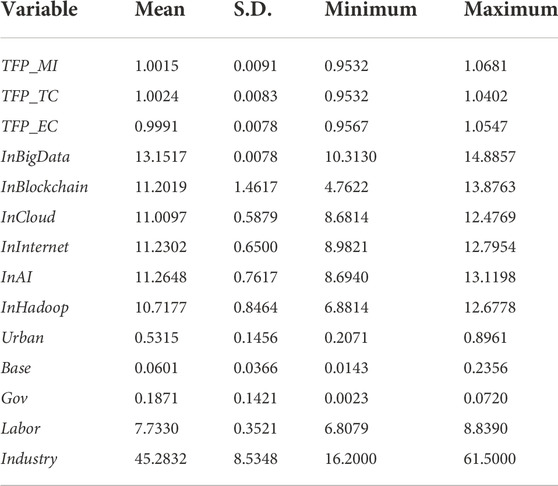
TABLE 1. Descriptive statistics.
5 Empirical results
5.1 Effects of big data on green economic development
Table 2 shows the regression results. With regard to the core variable big data, column (1) shows that the regression coefficient for big data is 0.004 without taking control variables into account. In columns (2), (3), and (4), the regression coefficient is 0.005 when control variables are considered, and all are significant at the 1% level. These results indicate that big data plays a significant role in promoting green economic development, supporting Hypothesis 1. This finding is similar to that of the Xu et al. (2019) and Liu et al. (2022). Modern information and advanced technologies, such as the big data, have become increasingly important to all aspects of economy, society, and ecology (Anser et al., 2021). Big data improves enterprise production efficiency at the micro level, promotes industrial development at the medium level, optimizes resource allocation at the macro level. By achieving inclusive growth in the economic utilization of resources and environmental protection, it promotes the development of green economy.
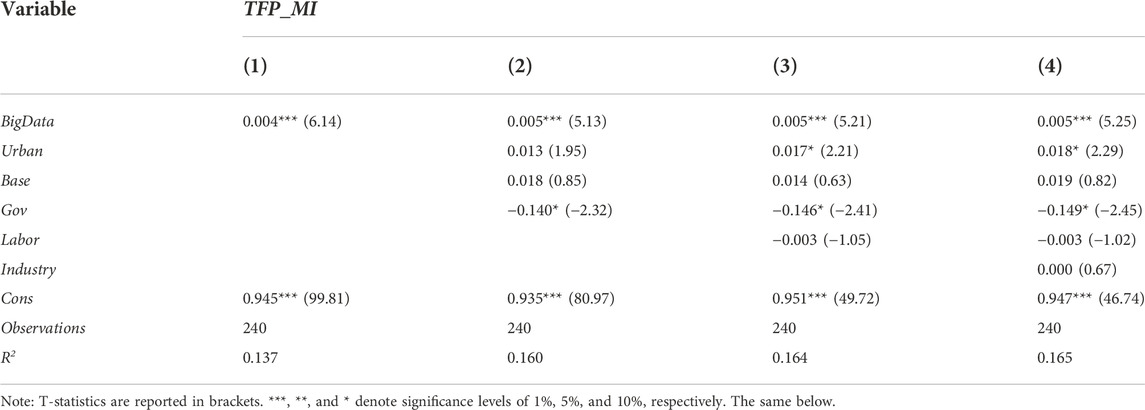
TABLE 2. Empirical results of big Data’s impact on green economic development.
In terms of control variables, first, the regression coefficient for urbanization rate on green economic development level is positive at 10%. The massive migration of rural populations to cities leads to an agglomeration of population and industries, bringing about high-quality development through economies of scale. It is also consistent with Burton’s (2000) findings that higher urban density improves environmental quality.
Second, the level of informatization has no significant impact on green economic development. A region’s postal service reflects its level of informatization. As reported in “60 Years of New China: Rapid Development of Post and Telecommunications Industry,” China’s mobile phone and Internet user growth rate has passed the point of rapid growth, showing a significant slowdown. In the early stages of reform and opening up, the communication business brought great achievements. Nevertheless, with the development of mobile Internet and big data, it is no longer relevant to high-quality economic development. It is consistent with the findings of researchers Zheng et al. (2014) that telecom infrastructure contributed gradually less to China’s economic growth after 2000.
Third, for green economic development, government investment in science and technology is negative at 10%. As defined by UNESCO, science and technology investment can be divided into basic research, applied research, and experimental development. Among these, basic research supports high-quality economic development. It is a known fact that China has an unreasonable structure of science and technology expenditures, and basic research expenditures are poor (Li, 2011). As a result, increasing the proportion of fiscal science and technology expenditures affects its green economic development negatively.
Lastly, education level and industrial structure have no significant influence on green economic development. As China’s development stage changes, the contribution of labor factors to the green economy is becoming less important. It is possible that this is the reason why education has no significant effect on green economic development. It also echoes the conclusion made by some scholars that human capital has a threshold effect and a nonlinear effect on green economic efficiency. In terms of industrial structure, since the development of the secondary industry is one of the major causes of environmental pollution, the proportion of the secondary industry is used to evaluate the structure. Possibly, the industrial structure of China does not have a significant impact due to its recent overserving trend, which also challenges the conclusions of previous research (Auty, 1997; Dinda, 2004).
5.2 Mechanism
For a deeper understanding of the mechanism of big data for green economic development, this paper examines the two channels of technological progress and efficiency improvement. Table 3 shows the results. Column (1) and (2) indicate that the regression coefficient for big data on technological progress is 0.003, and both are significant at 5%. Also, column (3) and (4) show that big data for efficiency improvement has a regression coefficient of 0.002 at the significant level of 10%. Hence, big data drives the level of green economic development through technological advancements and efficiency improvements. GTFP growth is driven by “two wheels,” in which technological progress plays a bigger role. Due to the application of big data technology, data becomes more and more important. Companies that take the lead in digital transformation can gain the upper hand in the market, thereby accumulating valuable data resources and forming monopolies. At the same time, through the application of big data technology, enterprises can carry out intelligent transformation for their own production, organization and operation, improving their production efficiency and reducing the waste of resources. Furthermore, the extensive application of modern information technology makes the industries related to big data get unprecedented development, and promotes the integration of industries, which is conducive to technological innovation and practice. However, for traditional enterprises that rely on large-scale equipment for production and operation, it takes considerable time and money to adapt to transformation (Brynjolfsson and Hitt, 2000). With the emergence of big data, standardized products are gradually difficult to meet diversified and personalized needs, which reduces the overall efficiency improvement. Therefore, big data plays a greater role in advancing technology than in improving efficiency.
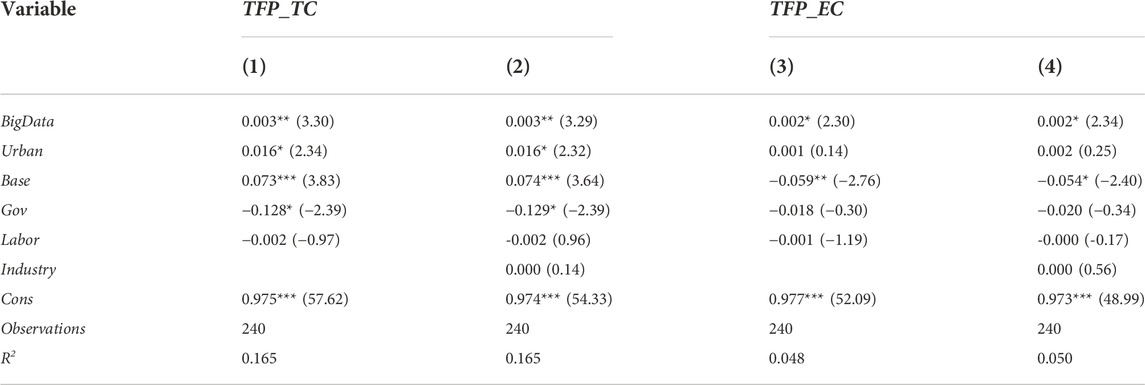
TABLE 3. Analysis of mechanisms affecting green economic development.
In terms of control variables, first, urbanization has a differential effect on technological progress and efficiency. Urbanization rate is positively correlated at the 10% level for the former, but not for the latter. This indicates that technological progress is more important than efficiency improvements in promoting urbanization to green economic development.
Second, the level of communication service has opposite effects on technology progress and efficiency. There is a significant positive regression coefficient for the former, and a significant negative regression coefficient for the latter at the 5% and 10% levels. Other scholars have found similar results. Wang and Li. (2019) determined that the ASEAN’s construction of information infrastructure promotes technological progress, but hinders the improvement of technological efficiency.
Finally, government technology investment impacts technological progress and efficiency differently. Investing in science and technology by the government has a negative effect on the former at the 10% level, but no significant effect on the latter. The reason could be that the funding is likely given to SOEs and politically connected companies. These companies are generally inferior to non-state-owned companies at transforming innovations, which hinders the overall market from progressing technologically.
Big data technology includes factors such as artificial intelligence, blockchain, IoT, cloud computing, and Hadoop. This paper examines the role of these big data sub-indicators in promoting green economic development. The results are presented in Table 4. It is shown that blockchain development results in improved technical efficiency, and artificial intelligence, IoT, cloud computing, and Hadoop development lead to technological progress, which in turn facilitates green economic development.
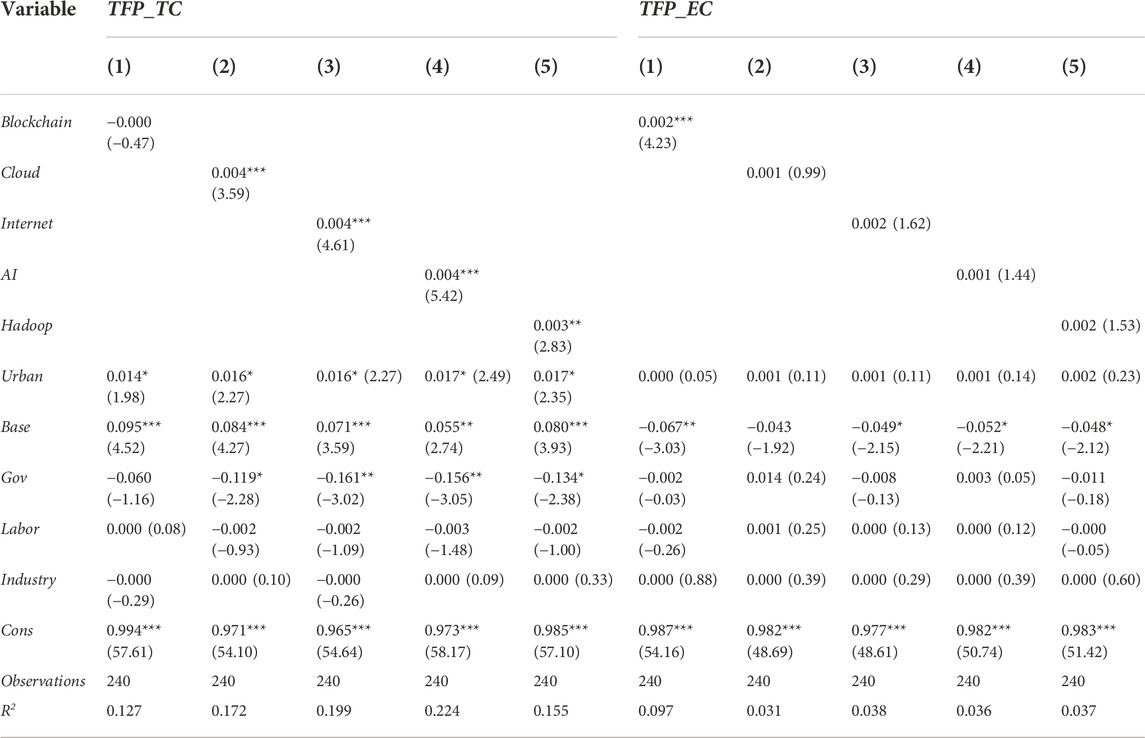
TABLE 4. Empirical results of big data sub-indicators’ impact on green economic development.
Blockchain’s regression coefficient for technical efficiency is 0.002, which is significant at 1%. It appears that blockchain can improve the efficiency of production because of its decentralization, non-tampering, and de-trust characteristics, thereby increasing the digitalization level of provinces. Researchers also showed that blockchain technology can aid enterprises to achieve green transformations through quasi-natural experiments (Li and Feng, 2021).
Cloud computing’s regression coefficient for technological progress is 0.004, which is significant at 1%. At the core of the city’s new infrastructure, cloud computing agglomerates the industrial chain in a horizontal and vertical manner. It can advance information technology and make better use of data resources, which improves the technical level of the province where it is located.
The regression coefficient for IoT and technological progress is 0.004, and it is significant at the 1% level. IoT technology integrates information technology with physical industry by organically interconnecting people and things in production. Also, new demands in the industrial chain have encouraged the development of data mining technology, new energy technology, etc., forming a new technology chain.
In 1% of cases, artificial intelligence shows a significant correlation with technological progress, with a regression coefficient of 0.04. It demonstrates how artificial intelligence can improve production, increasing the attractiveness of the real economy and improving technology.
Hadoop’s regression coefficient for technological progress is 0.003 at the 5% level, which is significant. According to recent studies, Hadoop, as a platform for distributing information, has been widely used and has contributed to the development of big data processing technology for its low cost, cross-platform capabilities, and high fault tolerance.
5.3 Regional heterogeneity analysis
5.3.1 Heterogeneity analysis in geographical differences
The economy of China is characterized by spatial gradients. Using the three economic belts proposed in the “Seventh Five-Year Plan,” this paper divides China’s provinces and cities into eastern, central and western regions. Results of regression are reported in Table 5. The coefficients of big data are obviously heterogeneous, which is similar to that of the current papers (Wu et al., 2021). In the eastern and central regions, big data and technological progress are positively correlated at the 5% level, suggesting the regions take full advantage of technological progress to promote green economic development. However, big data has not significantly improved the efficiency of technology use. Rather than using technology directly to improve enterprises’ technical efficiency, the eastern and central regions mainly promote technological upgrades through smart technologies like big data. In the western region, no relationship between big data and green technology progress and green efficiency improvement has been found. It is due to the fact that big data technology is still in its infancy in the western of China, the industry is still underdeveloped, and there is a big gap between it and the rest of the country.
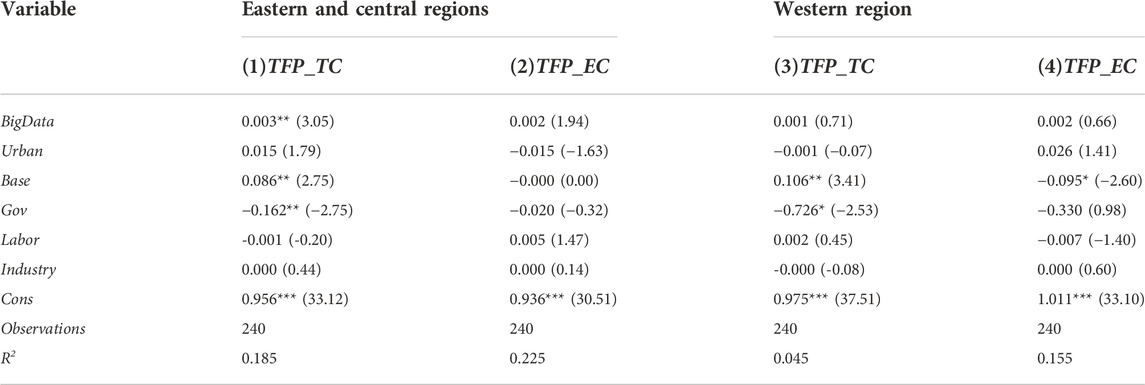
TABLE 5. Empirical results of geographical heterogeneity.
5.3.2 Heterogeneity analysis in environmental governance levels
A dichotomy method is used based on the average of the number of national and provincial personnel contributing to the environmental protection system. Therefore, provinces are divided into low environmental governance groups (below the average) and high ones (above average). Table 6 presents the results. The coefficient of big data on technical progress in areas with high environmental governance is 0.005, and its significance level is 1%, while the coefficient on technical efficiency in areas with low environmental governance is 0.004, and it is significant at the level of 10%. Big data primarily improves green economic development in high environmental governance areas by promoting technological progress, while it mainly improves green economic development in low environmental governance areas by optimizing technology utilization efficiency.
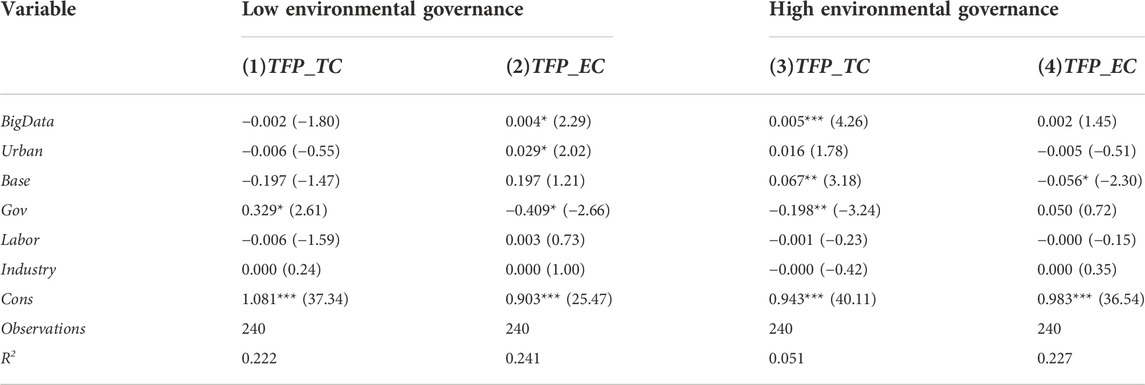
TABLE 6. Empirical results of environmental governance heterogeneity.
High-level environmental governance areas have good environmental infrastructure construction and governance inspection teams, as well as more environmentally friendly enterprises and advanced industries. Taking advantage of big data, it can accelerate the progress of technologies such as energy conservation and emissions reduction on the original basis. This helps generate more scientific research and innovation results that promote green economic development, and optimize and upgrade the industrial structure. In areas with low environmental governance, due to poor environmental awareness, an atmosphere that is conducive to the greening of the industry has not yet been created, and traditional production forms continue to prevail. In the current state, big data technology aims to improve the level of information services in order to improve production and transaction efficiency.
5.3.3 Heterogeneity analysis in digital financial inclusion levels
According to average levels of digital financial inclusion in each province, this paper divides China’s provinces into low financial inclusion (below the average) and high financial inclusion provinces (above the average). Table 7 presents the results. Big data contributes significantly to technological progress in areas with high financial inclusion levels (0.006), while big data contributes significantly to technical efficiency in areas with low financial inclusion levels (0.003).
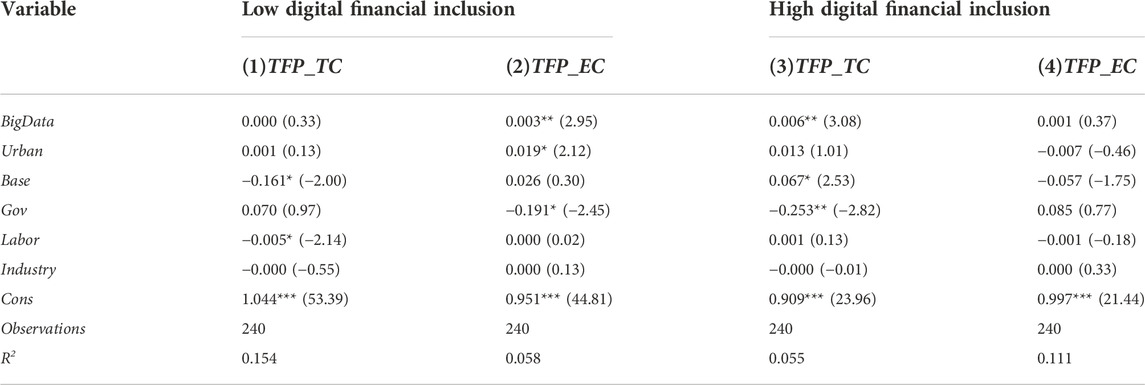
TABLE 7. Empirical results of digital financial inclusion heterogeneity.
Digital finance has better coverage, depth of use, and digitalization in regions where financial inclusion is high. In conjunction with the infrastructure of digital finance, big data can successfully integrate with traditional finance, overcoming its inability to provide services to remote regions and small and micro enterprises. By providing appropriate financial support, this can meet the needs of various market players, thus promoting technological innovation and business model changes. In low financial inclusion areas, small and medium-sized enterprises have difficulty obtaining financing, and they are less technically savvy. In addition to optimizing resource allocation, big data technology eases entrepreneurs’ financing constraints and promotes inclusive economic growth (Bianchi, 2010).
5.4 Temporal heterogeneity analysis
According to HP filtering processing, this paper divides data into good economy stage and sluggish one. Results are presented in Table 8. In the sluggish stage of economic cycle, the coefficient of big data on technical efficiency is 0.005, and it is significant at 5%. In the good stage of economic cycle, the coefficient of big data on technological progress is 0.006, and it is significant at 1%.
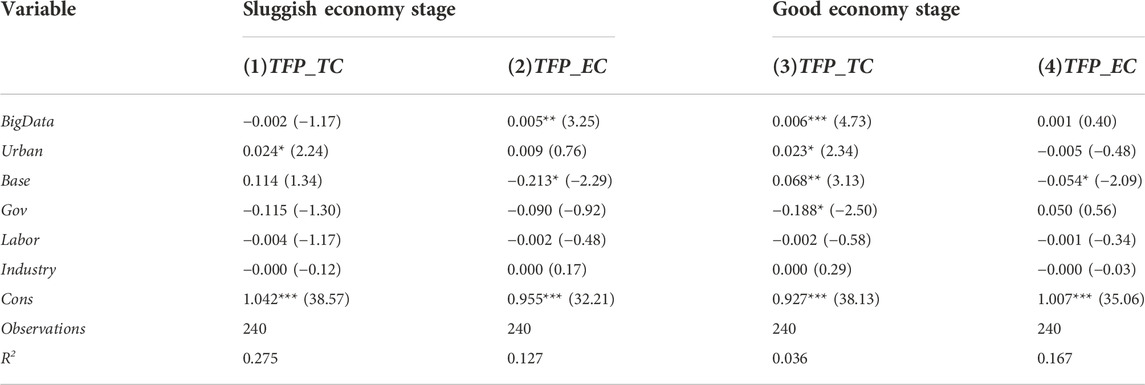
TABLE 8. Empirical results of time heterogeneity.
As the economic cycle enters a sluggish stage, economic growth was mainly driven by industrial and infrastructure investment. As a result, big data exploitation on physical devices is promoted, the flow and configuration of data elements is accelerated, and enterprise production efficiency is improved. When entering a good stage of economic development, consumption also played a large role in driving economic growth besides investment. Through the customer-centric transformation of operation, organization, and business model, enterprises spurred technological innovation, which in turn has promoted industrial growth. The big data industry, with data elements at its core, as well as the digital upgrade of traditional industries, have been improving their competitiveness in the market by better identifying user needs, as well as moving towards sustainability.
5.5 Robustness checks
5.5.1 One-period lag for explanation variables
Due to the fact that the impact of big data on green economic development may not be reflected in the current period, there could be a lag. At the same time, in order to mitigate the problem of reverse causality, this study tests the explanatory variables one period after the current period. Table 9 shows the results. Despite the lagging impact of big data on technological progress, the development of big data technology has a continuously positive impact on green economic development. Also, the regression coefficient for big data lag one period is larger than that of the benchmark regression case (Table 3), suggesting that the lag effect of big data technology development may be more significant.
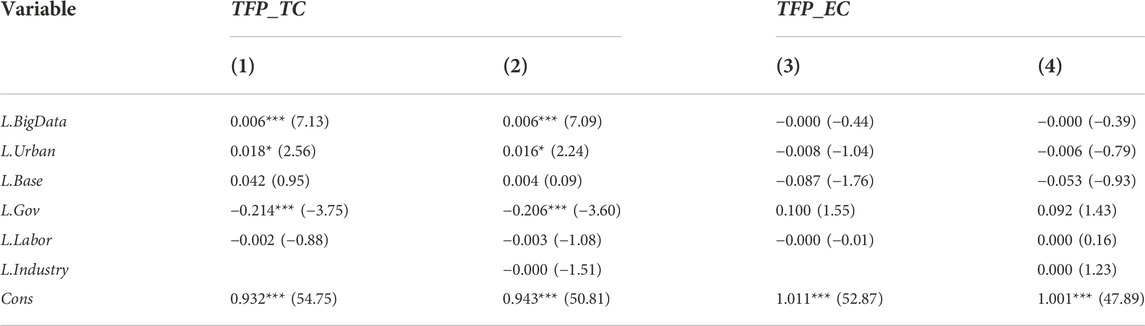
TABLE 9. Robustness test for one-lag explanatory variables.
5.5.2 Replace core explanatory variable
To separate the effects of the indicator selection, this study adds sub-indicators of digital economy and financial technology to the original big data indicators. Results are shown in Table 10. Digital finance’s regression coefficient on technological progress is still significantly positive and larger than the benchmark regression (Table 3). In light of the development of the digital economy and financial technology, big data plays a greater role in promoting technological advancement.
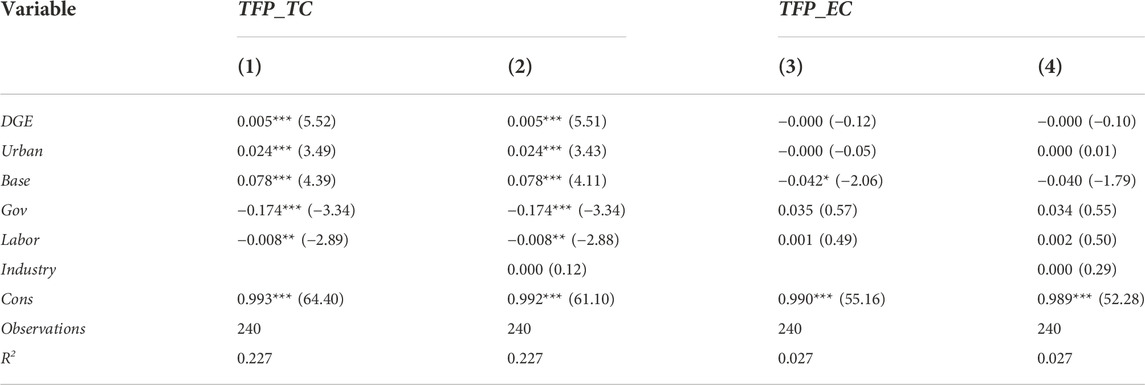
TABLE 10. Robustness test for replacing core explanatory variables.
5.5.3 Adding control variable
Based on previous studies (Menguc et al., 2010; Li and Li, 2019), corporate innovation can significantly improve environmental performance. Hence, this paper adds technological innovation (
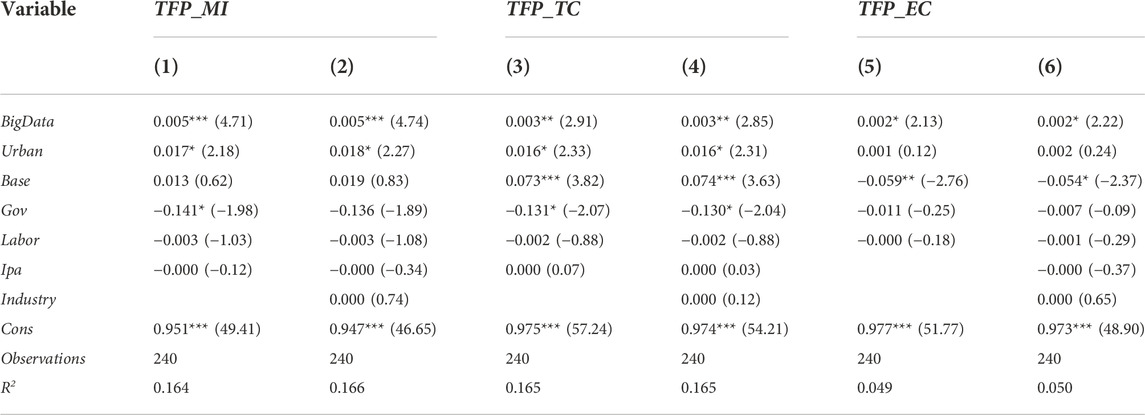
TABLE 11. Robustness test for adding control variable.
6 Conclusions and policy implications
6.1 Conclusions
Several studies have been conducted on big data, with many focusing on the use of big data resources and their impact on various areas of economy and society (Magazzino and Mele, 2020; Bai et al., 2021). However, in the process of economic development, there are factors that affect the utilization of resources and environmental protection, which will have a negative impact on high-quality development. Based on this, our study examines the impact mechanism of big data on green economic development by taking into account environmental factors.
Based on the panel data of 30 provinces in mainland China from 2011 to 2018, this paper uses the MML (meta-Frontier Malmquist-Luenberger) model to measure regional GTFP, as well as green technological progress and green efficiency change. From the multiple perspectives of big data technology, this paper analyzes how big data impacts China’s GTFP and explore its heterogeneities from regional and temporal perspectives. Five main conclusions can be drawn.
First, big data promotes green economic development. Enterprises are able to make innovative developments in production, organization, operation, and management through the use of big data technology. By eliminating backward production capacity and promoting industrial upgrading, it can assist in maximizing resource utilization.
Second, big data significantly promotes green economic development through the channel of technological progress and efficiency improvement. And the positive effect of big data is more obvious in technological progress than efficiency improvement. Enterprises can leverage data resources to perform intelligent transformation and gain a competitive advantage, thus releasing the enormous potential of technological innovation in the era of big data.
Third, big data sub-indicators have varying effects on the development of green economy. Cloud computing, Internet of things, artificial intelligence, and Hadoop significantly contribute to technological progress, while blockchain contributes to efficiency improvement. This is because blockchain can reduce the cost of each process and improve the efficiency of management. Technologies such as artificial intelligence, the Internet of things, cloud computing, and Hadoop can help improve productivity, connect information technology with real-world industries, and agglomerate technological chains.
Fourth, big data plays a greater role in promoting technological growth in the central and eastern regions, regions with better environmental governance and higher level of digital financial inclusion development. This is because the central and eastern regions have a better level of information infrastructure and industrial base, which is conducive to technological innovation and application. Enhancing environmental governance can enable governments to play a greater role in public governance, promote the agglomeration of environmentally friendly companies and advanced industries, and contribute to more green innovation achievements. In regions with better development of digital inclusive finance, big data can better integrate traditional finance to provide services for SMEs, thus encouraging economic growth.
Finally, big data supports green technological progress in the good economic stage and improves green efficiency in the downturn stage. During the economic downturn, China’s economic growth relies on investment in the secondary industry, and technologies such as big data are directly applied to improve production efficiency. When the economy is doing well, the prosperity of consumption helps enterprises conduct customer-centered digital transformations and eco-friendly transformations, which encourage technological innovation and industrial development.
6.2 Policy implications
Several policy implications can be put forward based on our findings.
First of all, big data technology is conducive to the high-quality development of China’s economy. Therefore, the government should vigorously promote data sharing and improve laws and regulations related to the management and application of big data. By establishing standards for the process of data collection and application, modern technologies can be effectively used of and deeply adapted into the industry.
Secondly, big data influences the development level of green economy by promoting technological progress. Therefore, enterprises should increase the management and application of big data and invest more resources to develop emerging technologies, so as to achieve intelligent upgrading and improve productivity. It is also important for the government to encourage enterprises to develop production through technological advancements. Corresponding policies should be implemented for development of new information infrastructure, laying a solid foundation for advanced industries to agglomerate and develop.
Finally, big data has different impacts on green economic development in different regions. In the regions with underdeveloped new infrastructure and fragile ecological environment, the government should support the development of information technology and improve the construction of data factor market. In addition, regions with a high level of environmental governance are conductive to the agglomeration of environmentally friendly enterprises. Environmental policies should be developed by the government to improve resource use efficiency and encourage enterprises to form low-carbon and green production modes.
6.3 Discussion
There are limitations to this study. In particular, due to data limitations, micro enterprise data are not available to verify the relationship between big data and firms’ green economic development. Future research will continue to explore the microscopic mechanism and make breakthroughs. It is possible to explore new methods of constructing big data indicators to better reflect the level of big data application in the enterprises. In addition, to improve the accuracy of the results in relevant research, the index construction system can be improved, especially for the micro-measurement of green development.
There is no denying that the development of human society has exerted a great influence on the natural environment. More deeply from the air environment, Jin et al. (2020) identified whether CO2 emission reduction can inhibit poverty alleviation. It can be seen that the development of human society will affect the evolution of ecological environment, which will further have an uncertain impact on the economy. As an important product of human activities, big data will not only have a positive impact on green development and economic growth, but also may further affect specific economic issues such as poverty alleviation and income structure, which is also an important future research direction.
It is also important to further clarify the relationship between big data technology and green development, and it will help provide feasible policy suggestions for the government. In China, there is a large urban-rural divide, as mentioned by Jin et al. (2020). This structural difference may affect the implementation path of big data technology. To avoid misunderstandings due to the differences between the urban and rural dual structures, targeted research is needed. Considering the unbalanced development in terms of resident income, consumption, employment, public input, etc., it is necessary to strictly identify the changes that these differences may have on the development of green economy caused by big data. In addition, industry factors should also be taken seriously. It is necessary to consider the influencing factors of specific industries in future research. For example, high-polluting industries will be affected by more environmental regulations, and their motives for using big data may be different. Further research will provide more targeted policy reference data for the implementation of digital China and sustainable development strategy.
As China enters a stage of high-quality development, ecological environment construction has gradually become a social consensus and an increasingly important subject for scientific research. Although the academic community has studied the influencing factors of GTFP from multiple perspectives such as technical streams, economic streams, and government streams, there are still mechanisms that have not been elucidated by mainstream studies (Zhang et al., 2021). Therefore, it is necessary to use interdisciplinary methods to comprehensively analyze the spatial distribution characteristics, time evolution process and influence mechanism of big data and green development. For example, Takahashi et al. (2022) used case study methods to explore how to manage and improve ecological benefits. Based on the multidisciplinary knowledge system, future research can provide more scientific basis for the interaction between man and nature, which will help improve the level of ecological civilization construction.
Data availability statement
The original contributions presented in the study are included in the article/Supplementary Material, further inquiries can be directed to the corresponding author.
Author contributions
All authors listed have made a substantial, direct, and intellectural contribution to the work. Conceptualization and writing—original draft preparation: LW and YW. Methodology and supervision: LW. Resources and funding acquisition: LW and YW. Writing—review and editing: YW and ZH. All the authors have read and agreed to the published version of the manuscript.
Funding
This work is supported by Humanities and Social Sciences Project of the Ministry of Education of China (Grant numbers 22YJA790055, Grant numbers 21YJC790107), Guangdong Philosophy and Social Science Planning Project (Grant numbers GD22YYJ06).
Conflict of interest
The authors declare that the research was conducted in the absence of any commercial or financial relationships that could be construed as a potential conflict of interest.
Publisher’s note
All claims expressed in this article are solely those of the authors and do not necessarily represent those of their affiliated organizations, or those of the publisher, the editors and the reviewers. Any product that may be evaluated in this article, or claim that may be made by its manufacturer, is not guaranteed or endorsed by the publisher.
Footnotes
1http://en.wikipedia.org/wild/Bigdata
References
Anser, M. K., Ahmad, M., Khan, M. A., Zaman, K., Nassani, A. A., Askar, S. E., et al. (2021). The role of information and communication technologies in mitigating carbon emissions: Evidence from panel quantile regression. Environ. Sci. Pollut. Res. 28 (17), 21065–21084. doi:10.1007/s11356-020-12114-y
Auty, R. M. (1997). Pollution patterns during the industrial transition. Geogr. J. 163 (2), 206–215. doi:10.2307/3060184
Bai, X., Zhang, F., Li, J., Guo, T., Aziz, A., Jin, A., et al. (2021). Educational big data: Predictions, applications and challenges. Big Data Res. 26 (15), 100270. doi:10.1016/j.bdr.2021.100270
Benhabib, J., and Spiegal, M. M. (1994). The role of human capital in economic development evidence from aggregate cross-country data. J. Monetary Econ. 34 (2), 143–173. doi:10.1016/0304-3932(94)90047-7
Bianchi, M. (2010). Credit constraints, entrepreneurial talent, and economic development,Entrepreneurial Talent,and Economic Development. Small Bus. Econ. 34 (1), 93–104. doi:10.1007/s11187-009-9197-3
Brynjolfsson, E., et al. (2017). Artificial intelligence and the modern productivity paradox: A clash of expectations and statistics, w24001.
Brynjolfsson, E., and Hitt, L. M. (2000). Beyond computation: Information technology, organizational transformation and business performance. J. Econ. Perspect. 14 (4), 23–48. doi:10.1257/jep.14.4.23
Burton, E. (2000). The compact city: Just or just compact? A preliminary analysis. Urban Stud. 37 (11), 1969–2006. doi:10.1080/00420980050162184
Caves, D., Christensen, L. R., and Diewert, W. E. (1982). The economic theory of index numbers and the measurement of input, output, and productivity. Econometrica 50 (6), 1393–1414. doi:10.2307/1913388
Chasemaghaei, M., and Calic, G. (2020). Assessing the impact of big data on firm innovation performance: Big data is not always better data. J. Bus. Res. 108, 147–162. doi:10.1016/j.jbusres.2019.09.062
Cheng, G. (2015). Data envelopment analysis: Methods and MaxDEA software. Beijing: Intellectual Property Publishing House.
Chung, Y. H., Fare, R., and Grosskopf, S. (1997). Productivity and undesirable outputs: A directional distance function approach. J. Environ. Manag. 51 (3), 229–240. doi:10.1006/jema.1997.0146
Cowen, T. (2012). The great stagnation: How America ate all the low-hanging fruit of modern history, got sick, and will (Eventually)Feel better. Survival 53, 190–191.
Crawford, K. (2013). “The hidden biases in big data,” in Harvard business review. Hbr:2013/04/the-hidden-biases-in-big-data#.
Del Giudice, M., Chierici, R., Mazzucchelli, A., and Fiano, F. (2020). Supply chain management in the era of circular economy: The moderating effect of big data. Int. J. Logist. Manag. 32 (2), 337–356. doi:10.1108/IJLM-03-2020-0119
Dinda, S. (2004). Environmental kuznets curve Hypothesis: A survey. Ecol. Econ. 49 (4), 431–455. doi:10.1016/j.ecolecon.2004.02.011
El-Kassar, A. N., and Singh, S. K. (2019). Green innovation and organizational performance: The influence of big data and the moderating role of management commitment and HR practices. Technol. Forecast. Soc. Change 144, 483–498. doi:10.1016/j.techfore.2017.12.016
Fang, N. (2018). Research on humanization design of green building based on big data. E3S Web Conf. 53, 04046. doi:10.1051/E3SCONF/20185304046
Farrell, M. J. (1957). The measurement of productive efficiency. J. R. Stat. Soc. Ser. A 120 (3), 253–328. doi:10.2307/2343100
Graetz, G., and Michaels, G. (2015). Robots at work: The impact on productivity and jobs. CentrePiece-The Magazine for Economic Performance.
Guo, F., Wang, J., Wang, F., Kong, T., and Cheng, Z. (2020). Measuring China’s digital financial inclusion: Index compilation and spatial characteristics. China Econ. Q. 19 (04), 1401–1418. doi:10.3934/QFE.2022017
Guo, Y., Tong, L., and Mei, L. (2020). The effect of industrial agglomeration on green development efficiency in northeast China since the revitalization. J. Clean. Prod. 258 (10), 120584. doi:10.1016/j.jclepro.2020.120584
Hodrick, R. J., and Prescott, E. C. (1997). Postwar US business cycles: An empirical investigation. J. Money, Credit, Bank. 29 (1), 1–16. doi:10.2307/2953682
Hottenrott, H., and Peters, B. (2012). Innovative capability and financing constraints for innovation: More money, more innovation? SSRN J. 94 (4), 1126–1142. doi:10.2139/ssrn.1547083
Ignatyuk, A., Liubkina, O., Murovana, T., and Magomedova, A. (2020). FinTech as an innovation challenge: From big data to sustainable development. E3S Web Conf. 166, 13027. doi:10.1051/e3sconf/202016613027
Intizar Ali, M., Patel, P. G., Breslin, J., Harik, R. F., and Sheth, A. (2021). Cognitive digital twins for smart manufacturing. IEEE Intell. Syst. 36, 96–100. doi:10.1109/MIS.2021.3062437
Jin, F., Qi, Z., and Liang, Y. (2021). Big data, financial industry agglomeration and green technological innovation. Rev. Econ. Manag. 37 (4), 97–112. doi:10.13962/j.cnki.37-1486/f.2021.04.008
Jin, G., Guo, B., and Deng, X. (2020). Is there a decoupling relationship between CO2 emission reduction and poverty alleviation in China? Technol. Forecast. Soc. Change 151, 119856. doi:10.1016/j.techfore.2019.119856
Johnson, M., Jain, R., Brennan-Tonetta, P., Swartz, E., Silver, D., Paolini, J., et al. (2021). Impact of big data and artificial intelligence on industry: Developing a workforce roadmap for a data driven economy. Glob. J. Flex. Syst. Manag. 22 (3), 197–217. doi:10.1007/s40171-021-00272-y
Khan, S. A. R., Yu, Z., and Umar, M. (2021). A road map for environmental sustainability and green economic development: An empirical study. Environ. Sci. Pollut. Res. 29 (2021), 16082–16090. doi:10.1007/s11356-021-16961-1
Li, B., Hou, B. c., Yu, W. t., Lu, X. b., and Yang, C. w. (2017). Applications of artificial intelligence in intelligent manufacturing: A review. Front. Inf. Technol. Electron. Eng. 18 (1), 86–96. doi:10.1631/FITEE.1601885
Li, G., Fang, X., and Liu, M. (2021). Will digital inclusive finance make economic development greener? Evidence from China. Front. Environ. Sci. 9. doi:10.3389/fenvs.2021.762231
Li, J., Sun, Z., and Zhong, S. (2021). Measurement of green total factor productivity on Chinese laying hens: From the perspective of regional differences. PLoS One 16 (8), e0255739. doi:10.1371/journal.pone.0255739
Li, S., and Feng, Y. (2021). How does blockchain promote the high-quality development of manufacturing? A quasi-natural experiment based on key environmental protection cities. China Environ. Sci. 41 (3), 1455–1466. doi:10.19674/j.cnki.issn1000-6923.2021.0159
Li, T., and Li, A. (2019). Enterprise innovation and environmental performance——based on the perspective of external governance environment. J. Industrial Technol. Econ. 38 (10), 92–100.
Li, Y., Cao, H., Dao, N., Luo, Z., Yu, H., Chen, Y., et al. (2011). Impact of financial science and technology investment to economic growth: Empirical analysis based on research and development (R&D) expenditure. Virology 13 (6), 12–19. doi:10.1016/j.virol.2011.03.024
Liu, X., Fan, S., Cao, F., Peng, S., and Huang, H. (2022). Study on the drivers of inclusive green growth in China based on the digital economy represented by the Internet of things (IoT). Comput. Intell. Neurosci. 2022 (9), 1–15. doi:10.1155/2022/8340371
Madden, G. G., and Savage, S. (2000). Telecommunications and economic growth. Int. J. Soc. Econ. 27, 893–906. doi:10.1108/03068290010336397
Magazzino, C., and Mele, M. (2020). On the relationship between transportation infrastructure and economic development in China. Res. Transp. Econ. 88, 100947. doi:10.1016/j.retrec.2020.100947
Malmquist, S. (1953). Index numbers and indifference surfaces. Trab. Estad. 4, 209–242. doi:10.1007/BF03006863
Manyika, J., Chui, M., Brown, B., Bughin, J., Dobbs, R., Roxburgh, C., et al. (2011). Big data: The next frontier for innovation, competition, and productivity. Washington, DC: McKinsey Global Institute.
Meng, X., and Zhu, J. (2013). Social computing in the era of big data: Opportunities and challenges. J. Comput. Res. Dev. 50 (12), 2483–2491.
Menguc, B., Auh, S., and Ozanne, L. (2010). The interactive effect of internal and external factors on a proactive environmental strategy and its influence on a firm’s performance. J. Bus. Ethics 94 (2), 279–298. doi:10.1007/s10551-009-0264-0
Mitroshin, P., Shitova, Y., Shitov, Y., Vlasov, D., and Mitroshin, A. (2022). Big data and data mining technologies application at road transport logistics. Transp. Res. Procedia 61, 462–466. doi:10.1016/j.trpro.2022.01.075
Müller, O., Fay, M., and vom Brocke, J. (2018). The effect of big data and analytics on firm performance: An econometric analysis considering industry characteristics. J. Manag. Inf. Syst. 25 (2), 488–509. doi:10.1080/07421222.2018.1451955
Oh, D., and Lee, J. (2010). A metafrontier approach for measuring malmquist productivity index. Empir. Econ. 38 (1), 47–64. doi:10.1007/s00181-009-0255-0
Pastor, J. T., and Lovell, C. A. K. (2005). A global malmquist productivity index. Econ. Lett. 88 (2), 266–271. doi:10.1016/j.econlet.2005.02.013
Porter, M. E., and Linde, C. V. (1995). Toward a new conception of the environment-competitiveness relationship. J. Econ. Perspect. 9 (4), 97–118. doi:10.1257/jep.9.4.97
Shi, X., and Li, L. (2019). Green total factor productivity and its decomposition of Chinese manufacturing based on the MML index: 2003–2015. J. Clean. Prod. 222, 998–1008. doi:10.1016/j.jclepro.2019.03.080
Solow, R. M. (1957). Technical change and the aggregate production function. Rev. Econ. Stat. 39 (3), 312–320. doi:10.2307/1926047
Takahashi, Y., Park, K. J., Natori, Y., Dublin, D., Dasgupta, R., and Miwa, K. (2022). Enhancing synergies in nature’s contributions to people in socio-ecological production landscapes and seascapes: Lessons learnt from ten site-based projects in biodiversity hotspots. Sustain. Sci. 17, 823–836. doi:10.1007/s11625-021-00927-w
Tao, C., and Qi, Y. (2012). The total factor productivity measurement of China under resource and environmental constraints. J. Quantitative Econ. 3 (1), 58–75. doi:10.16699/b.cnki.jqe.2012.01.001
Taşkın, D., Vardar, G., and Okan, B. (2020). Does renewable energy promote green economic growth in OECD countries? Sustain. Account. Manag. Policy J. 11 (4), 771–798. doi:10.1108/SAMPJ-04-2019-0192
Tulkens, H., and Eeckaut, P. V. (1995). Non-parametric efficiency, progress and regress measures for panel data: Methodological aspects. Eur. J. Operational Res. 80 (3), 474–499. doi:10.1016/0377-2217(94)00132-V
Wang, B., and Huang, R. (2014). Regional green development efficiency and green total productivity growth in China: 2000-2010—base on parametric metafrontier analysis. Ind. Econ. Rev. 5 (1), 16–35.
Wang, Y., and Li, P. (2019). Analysis of information communication infrastructure’s impact on total factor productivity across ASEAN countries. Asia-Pacific Econ. Rev. (2), 23–32. doi:10.16407/j.cnki.1000-6052.2019.02.003
Watanabe, M., and Tanaka, K. (2007). Efficiency analysis of Chinese industry: A directional distance function approach. Energy Policy 35 (12), 6323–6331. doi:10.1016/j.enpol.2007.07.013
Wen, Y. (2022). Analysis of regional economy development on local environmental protection and natural resources utilization from the perspective of big data. J. Environ. Public Health 2022, 1–12. doi:10.1155/2022/9461377
Wu, H., Hao, Y., and Ren, S. (2021). How do environmental regulation and environmental decentralization affect green total factor energy efficiency: Evidence from China. Energy Econ. 91, 104880. doi:10.1016/j.eneco.2020.104880
Wu, X., Zhu, X., Wu, G., and Ding, W. (2014). Data mining with big data. IEEE Trans. Knowl. Data Eng. 26 (1), 97–107. doi:10.1109/TKDE.2013.109
Xu, X., Ren, X., and Chang, Z. (2019). Big data and green development. China Indus. Econ. (4), 5–22. doi:10.19581/j.cnki.ciejournal.2019.04.001
Xu, Y., Li, S., Zhou, X., Shahzad, U., and Zhao, X. (2022). How environmental regulations affect the development of green finance: Recent evidence from polluting firms in China. Renew. Energy 189, 917–926. doi:10.1016/j.renene.2022.03.020
Yue, S., Yang, Y., and Hu, Y. (2016). Does foreign direct investment affect green growth? Evidence from China’s experience. Sustainability 8 (2), 158. doi:10.3390/su8020158
Zhang, J., Lu, G., Skitmore, M., and Ballesteros-Perez, P. (2021). A critical review of the current research mainstreams and the influencing factors of green total factor productivity. Environ. Sci. Pollut. Res. 28, 35392–35405. doi:10.1007/s11356-021-14467-4
Zhang, X., Zhong, S., Yao, F., Li, Y., and Li, J. (2022). Industrial green total factor productivity in China’s Yangtze River Economic Zone: Temporal and spatial difference analysis based on 108 panel data. PLoS One 17 (7), e0259366. doi:10.1371/journal.pone.0259366
Keywords: big data, green economic development, technological progress, efficiency improvement, global MINDW-MML model
Citation: Wang L, Wu Y, Huang Z and Wang Y (2022) How big data drives green economic development: Evidence from China. Front. Environ. Sci. 10:1055162. doi: 10.3389/fenvs.2022.1055162
Received: 27 September 2022; Accepted: 31 October 2022;
Published: 22 November 2022.
Edited by:
Chenchen Shi, Capital University of Economics and Business, ChinaReviewed by:
Anlu Zhang, Huazhong Agricultural University, ChinaGui Jin, China University of Geosciences Wuhan, China
Copyright © 2022 Wang, Wu, Huang and Wang. This is an open-access article distributed under the terms of the Creative Commons Attribution License (CC BY). The use, distribution or reproduction in other forums is permitted, provided the original author(s) and the copyright owner(s) are credited and that the original publication in this journal is cited, in accordance with accepted academic practice. No use, distribution or reproduction is permitted which does not comply with these terms.
*Correspondence: Yanan Wang, wangyn518@sina.com