Assessing Energy Efficiency for Economic and Sustainable Development in the Region of European Union Countries
 Dong Yan1
  Hongda Liu
- 1School of Management, Jiangsu University, Zhenjiang, China
- 2School of Economics and Management, Tongji University, Shanghai, China
- 3School of Management, Shanghai University, Shanghai, China
The objective of this research is to estimate the energy-saving intensities of nations within the European Union, applying varied equations of the DEA analysis, such as the DEA, modified radial equation, Russel dynamic envelope analysis, and the adjusted Russel Dynamic envelope Analysis, throughout the period of 2010–2018. Unlike other studies, this analysis seeks to unravel whether European nations are effective in increasing the EE finance of their respective economies. Because the European Union not only has geographical ties between regions, it is also a collection of interests of various sovereign states, its energy exhibits efficiency changes under the relationship of competition and cooperation under that economic effect. Regarding this circumstance, different dynamic envelope evaluations were formulated. One primary finding is that nations such as Germany, Sweden, or Austria attain robust ecological safeguard performance, seem to be using less energy, and are ecologically efficient relative to other nations such as Denmark, Belgium, Spain, France, or Ireland. Furthermore, a group of Eastern EU nations attained reduced efficiency marks, which could be categorized as anticipated, as a result of reduced technological implementation within the principal manufacturing sectors. The main result of this study is that few nations are performing in terms of efficiency. Additionally, RE (Renewable Energy) power production expands as nations’ dynamic envelope analysis marks and creates inefficient governments nearer to the efficiency frontline. Inversely, the presence of peak-time power consumption reduced the dynamic envelope analysis marks and increased the distance from the Frontier of efficiency (the optimal value of efficiency).
Introduction
The European Union’s economic policy and development strategy aim to create a low carbon economy as well as a resource-efficient economy. To realize this goal, the European Union aims to grow its efficiency in terms of energy consumption by about 20 percent, decrease carbon dioxide emissions to 20 percent of the cumulative energy being consumed, and generate 20 percent of its energy from Renewable Energies (RES). This initiative is called the 20–20-20 plan of action by the EU (Nugent and Rhinard 2019). The primary energy consumption sectors of the European Member states are anticipated to play an important part in the realization of this plan of action. In many instances, agricultural activities tend to focus on ecological destruction, in the form of the misapplication of energy resources, high-level carbon dioxide pollution, and the overutilization of nitrogen fertilizer. (Jungmeier 2017). In order to meet the United Kingdom’s climate change goals of 80 percent household carbon cuts by 2050 from the reference year 1990, the United Kingdom’s housing units need reconstruction or refitting to make them energy saving. During previous years, retrofit policy programs aimed at ensuring these standards were being met in buildings, for example through loft lining. The disparity amongst the energy savings attained as well as the possibility of energy cutbacks led to a significant shortfall in efficiency standards in the United Kingdom’s real estate market (Jurgita Malinauskaite et al., 2020).
Energy Efficiency (EE) has faced a lot of impediments among stakeholders in the form of information asymmetry, as well as technical, financial, institutional, and lifestyle disparity. This information asymmetry presents market distortion and shortfalls that are challenging to overcome (Alemzero et al., 2021), (J. Malinauskaite et al., 2019). Notwithstanding important commitments concerning the advancement of the community in fast-tracking energy efficiency expansion, the findings are very modest. Excluding the agglomeration of bankable projects, service providers and investors seem adamant to venture into the market (Dunlop 2019). The process of ascertaining how varied energy efficiency undertakings are structured, portrayed, funded, and executed in an efficient and cost-effective way is also challenging. Bankable undertakings are, however, cumbersome to pinpoint and formulate as the project is not backed by market players. This means that consumers often buy old appliances, meaning that suppliers presume that consumers are conservative and that they do not want energy-saving appliances. These impediments to project successes are endemic in emerging nations, as discussed by Acquah (2021) and Economidou et al. (2020).
Studies on EE according to dynamic envelope analysis have been published in diverse scholarly journals around the world (König et al., 2020). Relying on data from web science, numerous research has been published using the DEA approach. As such, a full assessment and synopsis of literature on this area is required (Palm and Backman 2020). The key aim of this study is to examine the present condition in addition to emerging indicators of EE centered on the dynamic envelope analysis. This study differs from past research in that it reviews studies on this subject area, whereas past ones studied only limited aspects of this subject (Sueyoshi et al., 2017). Furthermore, different from other research, which depends on the subjective knowledge of the authors, the actual findings are derived from real data evaluation, which is more impartial. (Mardani et al., 2017).
Within the past 20 years, the dynamic envelope analysis approach has attained greater popularity within the fields of energy and ecological efficiency approximation of nations, along with the provincial stages (Sueyoshi and Goto 2017), (Chen and Gong 2017), and (Yu and He 2020). China’s regional pollution and efficiency evaluation has assumed prominence in current years due to its size as the most significant carbon dioxide emitter by volume in the world. There exist several scholarly works on China applying the dynamic envelope analysis, see for example (Mohd Chachuli et al., 2020), (Singpai and Wu 2021) and (Guo et al., 2020). Their works are centered on various time phases, provinces, areas, key-ins, and productivity items, and apply various dynamic envelope analysis equations that result in problems in drawing parallels concerning their findings. (Meng et al., 2019).
Even so, the research (Xu et al., 2020) talks about several hurdles concerning the dynamic envelope analysis for energy as well as ecological examination. Thus, there is no complete overview of the utilization of the dynamic envelope analysis equations to estimate provincial efficiency, taking into account diverse parameters. Hence, this study estimates a methodical overview of the empirical analysis done in recent times on China’s provincial energy and CO2 pollution efficiency evaluation, applying the dynamic envelope analysis (Meng et al., 2019) and (Moon and Min 2020).
The principal findings of the analysis are listed below: 1) The collation of the characteristics of past research that are crucial for scholars to comprehend previous advancement as well the future trajectories within this field of research. 2) Providing a necessary point of reference for dynamic envelope analysis equation choice within the viewpoint of methodological as well as scientific findings. 3) We produce similar findings for various dynamic envelope analysis equations, applying comparisons. 4) The evaluation of differences in the EE of the European Union. The primary reason for the analysis is assessing the features of EE according to research on dynamic envelope analysis and giving a point of reference for further research and study. The above points connote the critical findings of the research to the field of scholarly works on the subject area via providing additional pragmatic findings to draw comparison alongside advancing the course of EE.
The rest of the paper is structured thus: Section two gives the methodological approach and past works applied within the analysis. Section three demonstrates the findings and discusses the results. Section four gives a detailed analysis of the knowledge spillover pathway analysis, andsection five concludes the study.
Literature Review and Background
Current studies have paid major attention to EE estimation approaches and approximates indexes. However, (Ouyang and Yang 2020), applied a qualitative approach to investigate various energy policies and estimates from Brazil, China, India, Mexico, alongside other nations, and discovered that policy can be crafted to spur energy consumption decreases separate from advancing EE. (Amowine et al., 2020), in finding the apparent provincial variations in EE, apply a parametric met Frontier approach to evaluate EE in the commercial sector of China.
More so, there were a few instances where the gross domestic product was applied to be the anticipated productivity, as the ecological emissions productivity was disregarded. The incremental factor EE estimation approaches are nonetheless pretty well known within past research. (Atta Mills et al., 2021) utilized the dynamic envelope analysis equation to estimate the EE of the six sectors with the most effective energy use within the United States, excluding the ecological limitations. The study discovered that the pulp and paper industry attained the biggest EE. Furthermore, there are scholarly works that consider the anticipated productivity when estimating the EE. (M. L. Song M.-L. et al., 2013) put in the ecological restraint to the dynamic envelope analysis equation, estimated to the total factor EE of the Yangtze River Delta metropolitan area, and examined the parameters that influence the EE expansion percentage. (Y. He et al., 2018) included the ecological restraints in their analysis to the equation drawn to compare the EE of energy concentrated companies within China. Integrating past studies synopsizes, our study utilizes the computation approach of the total factor for EE, bearing in mind the unwanted productivity, plus did a relative analysis on whether or not to include the ecological restraints on EE.
Similarly, there are rationally two kinds of dynamic envelope analysis equation. The first one is called CCR-DEA (Charnes et al., 1978) and BCC-DEA (Banker et al., 1984), which could be modified and radially anchored on all key-ins. CCR is applied to estimate the total efficiency according to constant returns to scale, and together with BCC is utilized to estimate pure technology plus the effectiveness centered on variables returns to scale (VRS). Then, the second is the slack-based measure model, which carries non-radial slacks into account and likewise decreases the mistakes in estimation occasioned by choosing radially. Again, we apply the approaches of (Zhang et al., 2021) and (Li et al., 2021) besides integrating the benefits of CCR-DEA and SBM-DEA, formulating an Epsilon-based Measure (EBM-DEA) equation to estimate the EE of the organization of economic cooperation and development between nations, and also excluding the unwanted productivity (Mardani et al., 2017), (K. Wang et al., 2013), (Cui and Li 2015) and (L. W. Wang et al., 2019).
The choice of the key-ins besides the productivity parameters indicates how the dynamic envelope analysis equation is near to actual circumstance and influences the figures of the comparative efficiency of decision-making units. Because the dynamic envelope analysis has a robust correlation alongside production theory, the crude material, and resources applied within the generation procedures are ordinarily categorized as key-ins and increase productivity. Overall, the dynamic envelope analysis increases key-ins plus increases productivity. Nevertheless, when unwanted productivity is added, the dynamic envelope analysis has to increase the desirable productivity and concurrently minimize the unwanted productivity (P. He et al., 2019) of the key-ins together with productivity parameters applied in past research. Regarding the key-ins parameters, the labor force, capital stock, and cumulative energy consumption are the critical parameters applied in past studies. Specifically, the labor force was utilized in over 90 percent of the research. Concerning the productivity parameters, gross domestic product and carbon dioxide are the chosen parameters between the wanted and unwanted productivity, respectively.
Data and Econometric Model
Energy Efficiency Through Radial Model
The dynamic envelope equation is additionally considered as the dynamic envelope analysis type that returns to the scale of the baseline year technology. According to this overview, six kinds of the dynamic envelope analysis equations have been used in China’s provincial energy efficiency and CR estimates; to name a few, the Radial model, Modified-Radial Model (M-Radial), Russell Measure Model (RMM), Tone’s Slack Based Model (SBMT), Range Adjusted Model g (RAM), and the Directional Distance Function Model (DDF). (Iftikhar et al., 2018) depicts the equation in addition to these sources. These equations could be categorized regarding the comparative modification perhaps not Key-ins, as well as productivity, are proportionally modified regarding the radial equation. The remaining equations discussed within are the non-radial equations. Within them, the SBMT and RAM equations are slack-centered estimate approaches due to the fact that they formulate efficiency indicators explicitly within the slacks in the keys-ins as well as productivity. The granularity concerning the properties and the construction of these equations are deliberated in the subsequent section. Here, the dynamic envelope analysis equations explained in (Yang and Wei 2019) are statistically elucidated. Now, take into account the generation process alongside K decision-making units (DMUs) that changes non-energy key-ins plus energy key-ins 5) to generate productivity (y). Microeconomic theory elucidates the generation technology T to be:
where T depicts the elucidated baseline technology that is closed as well as restrictively set. In the baseline technology T, the key-ins plus the productivity are presumed to robustly one i.e. if (x, e, y) ∈ T and (x′, e′) ⩾ (x, e) (or y′ ⩽ y), then (x′, e′, y)∈T (or (x, e, y′) ∈ T). A distribution-free equation is normally applied to illustrate the baseline technology to practice what the concept prescribes. Assume there are N non-energy key-ins, M energy inputs, and I undesirable outputs, then xk = (x1k, x2k, …, xNk), ek = (e1k, e2k, …, eMk), yk = (y1k,y2k, … ,yIk). Hence, the baseline technology T could be reconstructed as a dynamic envelope analysis (Ouyang and Yang 2020). Likewise, the Radial equation, which modifies the key-ins in addition to the productivity equivalently, is perhaps the most widely applied model within this field. The widely acclaimed radial equations are the CCR equation plus the BCC equation. The reference RTS type technology set is their significant difference. The energy efficiency in addition to CE could be explained by applying the input-oriented as well as the unwanted productivity equations, correspondingly.
Energy Efficiency Through Modified Radial Mod
The returns to scale in economics depict the changes in productivity when the key-ins vary in proportion alongside other circumstances holding constant (Liu et al., 2021). Within the dynamic envelope analysis, returns to scale indicate the baseline technology, plus determine the form of the production frontline. Overall, there exist four kinds of returns to scale. Namely, statics returns to scale, non-increasing returns to scale, and changing returns to scale. (Imdadul Haque 2019) depicts the variations between these four kinds of return-to-scale types. Also, returns to scale are considered static when an equivalent expansion in all key-ins leads to the same equivalent expansion in productivity. On the other hand, if that results in a greater than equal, or below the equivalent expansion, in the productivity, the returns to scale are growing or regrowing. Static returns to scale are more widely applied in returns to scale analysis in past research. (Grösche 2009) illustrates that nearly 70 percent of the research is presumed to be constant returns to scale reference technology. Nearly twenty percent of research applied static returns to scale, varying returns scale, plus non-increasing returns to scale reference technologies together. The scale efficiency and the returns to scale properties of various decision-making units could be examined within this scenario.
The M-radial equation tries to estimate the efficiency by formulating an indicator that applies radial indicators plus the slacks together. This is thought to be a modified type of radial equation alongside key-ins plus productivity slacks. Here, the energy efficiency estimated from the M-radial equation is equally called the cumulative factor energy efficiency. The CE for M -radial model did not exist in (Mohsin et al., 2021) due to the fact that according to the ecological dynamic envelope analysis technology where unwanted productivity is 7 days disposable, as well as the slacks for unwanted productivity, are equivalent to zero.
Slack Adjusted Modified Radial Model
Alongside increasing ecological challenges, many studies have coupled ecological pollution as unwanted productivity in the manufacturing process onto the reference technology T. The widely acclaimed means to include wanted and unwanted productivity together is to set dual presumptions. There is weak disposability on productivity, i.e. if (x, e, y, b) ∈ T′ and 0 ⩽ θ ⩽ 1, then (x, e, θy, θb) ∈ T′. That implies that proportional cuts in wanted, as well as unwanted productivity, are probable, whilst it might not be possible to singly cut unwanted productivity. The null-joint output is made up of undesirable and desirable outputs., i.e. if (x,e,y,b) ∈ T′ and b = 0, then y = 0. That means unwanted productivity needs to be generated so as to produce wanted productivity. Equally, the single means to remove the unwanted productivity is to stop the manufacturing process. Here b=(b1, b2, … ,bJ) depicts the vector of undesirable productivity plus a T′ denoting the reference technology adding unwanted productivity. In reference to the aforementioned presumptions, T′ could be categorized as,
The SBMT (Mehmood et al., 2020) equation and the RAM equation are both in the class of slack-based estimation, i.e., they formulate the efficiency indicator alongside the key-ins and productivity. As shown in (M. Song et al., 2013b), because the SBMT equation encompasses all inefficiencies for the inputs and the output, its explanation ability is more significant. The RAM equation could be measured as an additive equation that makes room for parameters to be next to zero.
Energy Efficiency Through Russell Measure Model (RMM)
Bearing in mind the vast presence of probable technical efficiency estimates in the dynamic envelope analysis, meeting particular properties from a statistical and economic viewpoint plays a crucial part in choosing one of them in performance. Regarding this purpose, the approximation efficiency of each decision-making unit, considering all types of technical inefficiency, has gained traction among scholarly works in the dynamic envelope analysis. (Alcaraz et al., 2021).
Energy Efficiency Through Russell Measure Model (RMM)
The DEA is a distribution-free data-driven method to estimate the homogenous performance of enterprises that generates a category of productivity concerning a group of key-ins according to similar technological know-how. The dynamic envelope analysis equations rely on mathematical programming for ascertaining, concurrently, applying a multiple function straight-line equation for approximating the production frontline of the principal technology, the efficiency marks of the assessed components, and ultimately vital benchmarking information. Indeed, dynamic envelope analysis has been widely used in producing enterprises (Esmaeili 2012) and (Salahi et al., 2019).
Alongside increasing ecological challenges, many studies have coupled ecological pollution as unwanted productivity in the manufacturing process onto the reference technology T. The widely acclaimed means to include wanted and unwanted productivity together is to set dual presumptions. There is weak disposability on productivity, i.e. if (x, e, y, b) ∈ T′ and 0 ⩽ θ ⩽ 1, then (x, e, θy, θb) ∈ T′. That implies that proportional cuts in wanted, as well as unwanted productivity, are probable, whilst it might not be possible to singly cut unwanted productivity. The null-joint output is made up of undesirable and desirable outputs., i.e. if (x, e, y, b)∈T′ and b = 0, then y = 0. That means unwanted productivity need to be generated so as to produce wanted productivity. Equally, to single means to remove the unwanted productivity is to stop the manufacturing process. Here b = (b1, b2, … ,bJ) depicts the vector of undesirable productivity plus a T′ denoting the reference technology adding unwanted productivity. In reference to the aforementioned presumptions, T′ could be categorized as,
Data Sources
We ascribe the data types deployed in this research, section 3.1 analyses alongside the sustainability index incorporated in the dynamic envelope analysis and the Effmixf equations, and section 3.2 alongside data needs for the energy system equations. The data was sourced from the following sources: the EU’s Commission report, the IEA, and the WDI.
Results and Discussion
Energy Efficiency
Here, the total of the expansion rate of technology is given as (g), capita; deprecation is rate (δ), and the expansion rate of the inhabited population is (n), denoting capita successful deprecation rate. The capital depreciation rate (δ) is assumed to be similar and static throughout the regions as well as for human and physical capital. It is presumed that to be equal to three percent per annum or fifteen percent in 5 years, according to MRW 1992. The resident population expansion rate is the only unit for the efficient deprecation of capital that changes via regions and within the course of time (n).
Table 1 shows the energy efficiency score. Technical efficiency is far from being attained by the European Union by 2020. It is crucial to stress that when the mean basis considers the efficiencies levels, bearing in mind that this research implements productivity-based dynamic envelope analysis, it means within the last 11 years. For example, productivity can grow to 47.28 percent while keeping similar key-ins. Also, 52.7 percent, 49.55 percent, and 51.15 percent represent the technical levels for the initial 3 years of 2010, 2011, and 2013. Within the same period, the mean marks indicate a trajectory of 57.55 percent, 77.35 percent, 77.16 percent, 83.78 percent, and 88.93 percent around 2013, 2014, 2015, 2016, 2017, and 2018, correspondingly. Additionally, the mean figures of a single nation of the period examined were estimated for the European Union, emphasizing the nations given in the study. Different colors depict the efficiency figures for every nation. The red denotes the minor efficiency marks, and blue depicts the mean scores, and the green shows the maximum efficiency marks derived. That generates a puzzle within the economic system of advanced nations, on the one hand; while on the different hand, it is an elucidation of relative poverty and lack of development. External jobs mean farm laborers earn extra wages, thus reducing poverty levels in rural settings. The other reason being, economic advancement makes urban dwellers earn higher incomes than those who live in rural areas, increasing the urban-rural income divide when economic system activity expands.
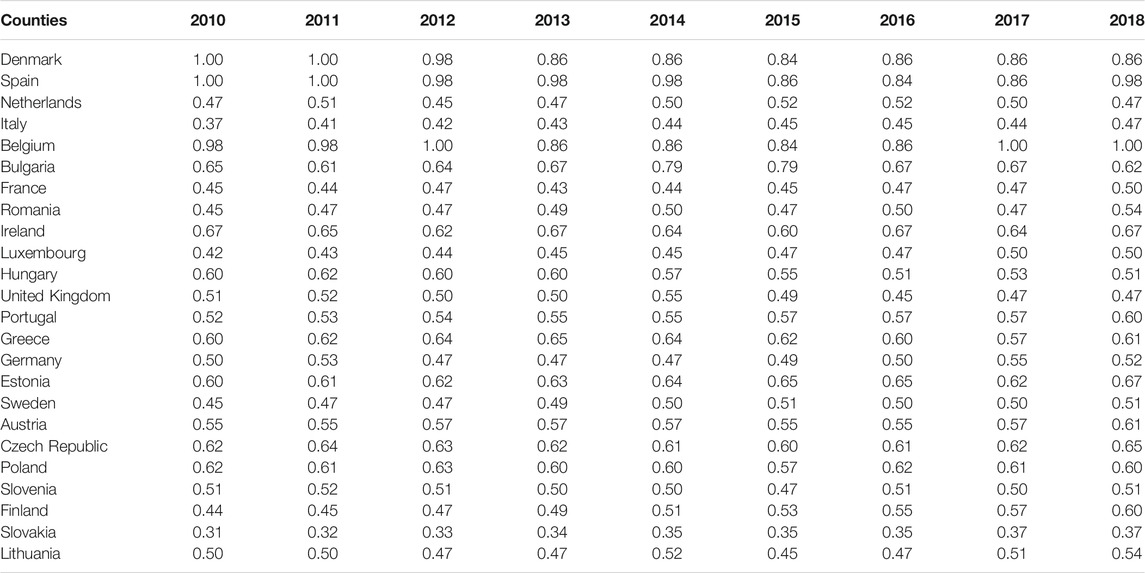
TABLE 1. Energy efficiency from 2010 to 2018.
Table 2 shows the average energy efficiency score. Because a single energy key or unwanted productivity is included in the study, the RMM equation attains the Radial equation. As a result of the lack of space, only China’s provincial energy efficiency and CE figures are anchored on varied equations. The analysis discovered three principal findings: 1) Within the models exists a noticeable disparity in the type of data used, showing each equation possesses an explanatory ability, strongor weak. 2) The models vary according to their efficiency levels. For instance, regarding EE figures changes regarding the equation choice. For instance, the energy efficiency computed by the Radial, M-radial, RMM, and RAM equations is more significant than those estimated by the SBMT equations. Concerning the efficiency of carbon pollution, statistics obtained from the RAM equation are more significant than others. 3) These equations might be grouped into two or three types due to the changing trend of efficiency statistics across the countries. Similarly, expanded earnings signify that the public has extra funding for countryside fiscal expenditure to eradicate or decrease the incidence of poverty. It is not surprising to detect that the European Union economic advancement attains the effect or gains of advancing poverty reduction efficiency. As a result, the effects of the European Union’s economic advancement on reducing the incidence of poverty are still to be corroborated. The gross domestic product, gross domestic products per head, and the real gross domestic per head are generally applied within scholarly works to estimate the amount of economic expansion. Within the scenario, gross domestic product and actual gross domestic product per head are primarily observed in data evolution. Because the research places economic expansion as the control parameter, the gross domestic product is applied to estimate economic expansion.
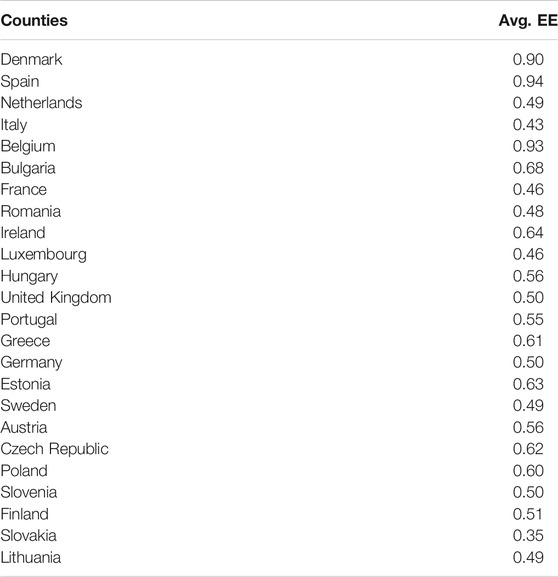
TABLE 2. Average energy efficiency.
Energy Efficiency Through Slack Based DEA Model
Bearing in mind table three, there exist essential clues for significant variations of energy and ecological efficiency execution of energy policy, according to EE. To be able to verify this, the slack-focused dynamic envelope analysis equation was executed. The initial result admits that EE has not been varied substantially after implementing the novel disintegration subsidy program of the EC, plus the following argument consents that there is no critical variation of mean EE amongst the new and the old European Union nation states.
The findings in table three show that Denmark plus Spain obtained the maximum effect marks (Denmark 0.83 to 1 and Spain 0.81–94) whereas Slovakia obtained the lowest EE mark between 0.30–0.36. Ultimately, the findings give the mean efficiencies marks in three varied methods. Within the initial column, the mean efficiency score for the period is between 2010–2018, Table.3. Similarly, the subsequent columns give the mean efficiency marks for two varied phases: the initial one alongside a comprehensive, integrated subsidy and the next after the completion of the disintegrated subsidy program. Owing to lack of data, the number of years concerning the two-time is equivalent.
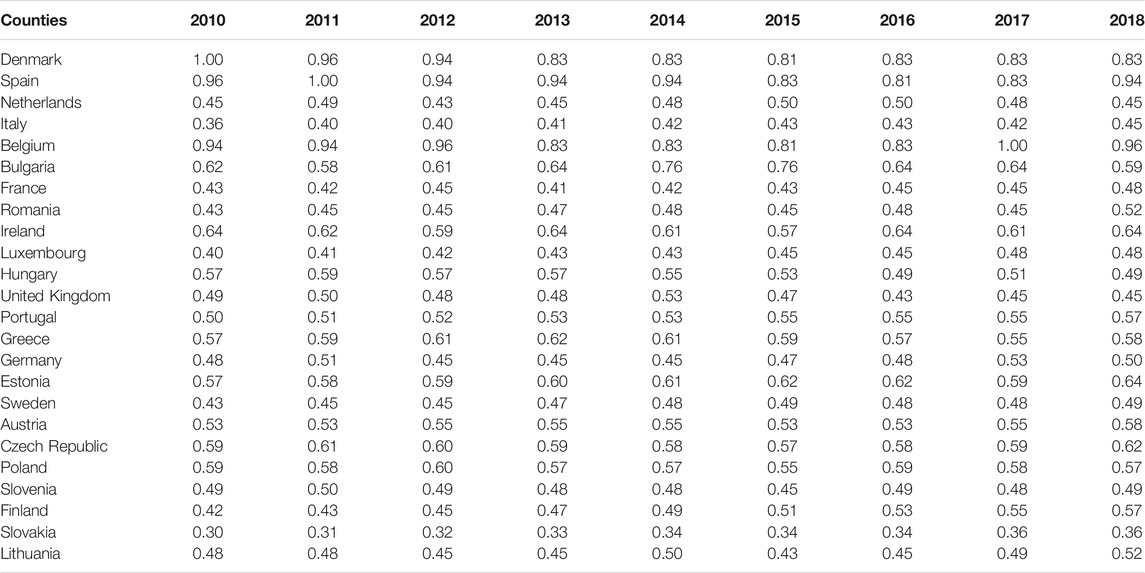
TABLE 3. Energy Efficiency through Slack-based DEA model.
Energy Efficiency by Russell Measure Model
The findings in table four, give the change of EE in the main sectors of member countries, in addition to its fundamental parts, for the time between 2010–2008. It has to be said that even though there are already existing ecological prevailing circumstances in addition to the primary sector falls, particularly after the year 2012, during which the original disintegrated grant program was utilized. On the other hand, EE after 2016, the direct changes of EE in 2010–2018 look to overshadow the fall of ecological efficiency, hence leading to direct variations in EE.
It is observable that the nations depicted as green have the biggest mean statistics evaluated within the timeframe., i.e., Spain at 90.8%, the United Kingdom at 90.71%, and Hungary (87.24%). Inversely, the Czech Republic with 36.68% depicts the lowest mark throughout the evaluated timeframe of Table 4. In order to additionally examine the marks derived using the dynamic envelope analysis approach, the findings show the change concerning the dynamic envelope analysis mark per nation within the time evaluated. It is crucial to emphasize nearly all nations depict an increasing trend for their marks. Principally, the nations that attain the maximum marks demonstrate a direct change in their efficiency scores.
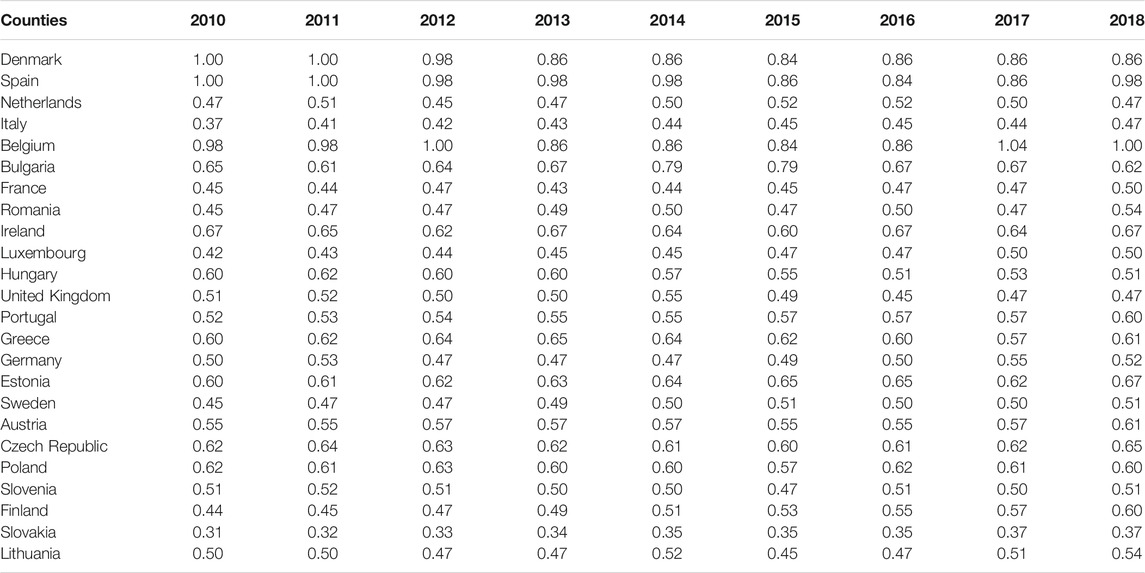
TABLE 4. Energy efficiency through russel measure model.
Sensitivity Analysis
The findings of the robustness results are displayed in Table 5. The results show that electricity supplies originating from RE types are direct and meaningful at a one percent stage and advance the efficiency of the European Union nations concerning electric vehicle embracement. Nonetheless, when the initial units of the two-pronged equation are ascertained it is observable that RE electricity production is not meaningful, statistically elucidating the likelihood of each nation being at the efficiency frontline. The order aspect, say when the efficient nations are without the approximation, depicts that RE generation expands the dynamic envelope analysis mark. Inversely, the presence of peak electricity use phases reduces the efficiency of the nations in terms of electric vehicle embracing within the individual part equation and thus attains an equalizing impact on the dual initial and the next part of the two-pronged equation.

TABLE 5. Sensitivity analysis.
Furthermore, the coefficient of government charging points and population attaining tertiary or further education are direct and meaningful at a one percent level. This conforms with what was theoretically anticipated regarding the dual, one aspect equation and the second number on a two-pronged equation. Besides, grants for B electric vehicles acquiring are meaningful within the approximations showing their focal importance to increase B electric vehicles market proportion, even though alongside reduced points of meaningfulness within the initial part of the two-pronged equations. Additionally, the percentage amongst imports as well as trade from abroad (RMX) contributes to growing the dynamic envelope analysis-static returns to scale mark, within the first equation, and equally to send the inefficient nations closer to the efficiency frontline at one percent meaningful. (Using the second part of the two-pronged equation). The following inline variable used to evaluate the population’s propensity to possess a charging point at home attains a significant coefficient in the dynamic envelope analysis-static returns to scale mark within the estimation.
Ranking of Efficiency
Table six gives EE marks across different means. The initial column gives the EE for the timeframe of 2010–2018. The subsequent dual columns present the EE marks for the two varied timeframes: the initial one alongside a complete integrated grant, and the next for the execution of an integrated grant program. Owing to the lack of data, the number of years concerning the dual sub-phases is not equivalent. There are meaningful suggestions for a significant segment of the nations that the novel grant program did not provoke further advancement of the dual-energy and ecological efficiency, irrespective of the strong commitment about this as an important goal from the European Union members. Table 6 shows the ranking of energy efficiency score.
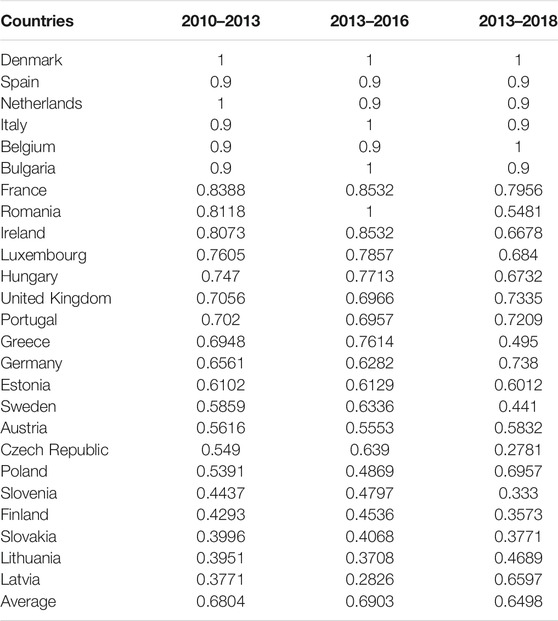
TABLE 6. Ranking of energy efficiency.
Other than the already energy efficiency advanced nations, the ones that have advanced their EE are only those that have advanced their efficiency marks, such as the UK, Portugal, Germany, Austria, Poland, Lithuania, and Latvia. It is clear from those above that many factors underpin the non-conformity of EE amongst nations putting into action a similar agricultural program for an extended timeframe. However, this research could not give a precise basis for this unconventionality due to data paucity. Nonetheless, clues exist concerning joining inefficiency alongside the composition of the primary areas of every single European Union member. The rationale that the European nations are centered on arable crops, as well as concentrated animal husbandry activity, lend credence to the progression of their ecological efficiency after the disintegration of the payments, corroborating the importance of these variations, and ensuring compliance from the primary areas entirely to the European Union’s ecological plan of actions. Now, all these analyses need to be corroborated after finishing the timeframe between 2010–2018, during which the vital data is made accessible. Nonetheless, it is crystal clear that between the European Union nations, irrespective of the reality that there is a unified agricultural policy being executed after the establishment the European Union, there are significant changes concerning significant challenges for the European Union, such as the energy and ecological efficiencies policies.
Conclusion and Policy Implications
In this paper, the energy and environmental efficiency of the European nations are evaluated—the timeframes chosen entail two-pronged phases of the execution of the varied subsidy programs. The dynamic envelope analysis, which was selected for the analysis, showed significant changes in efficiency marks amongst nations for the dual-energy and ecological efficiency. The significant findings, mainly regarding the more established member countries, likely mean that even though for several years now a similar energy policy has been instituted by every European nation, the differences in efficiency marks are profound, implying that different parameters form the requirements for energy as well as the combination of vital key-ins for agricultural production. The change outlines a relatively economics-focused environment because inefficient nations need to promote agricultural products in a harmonized marketplace without trade restrictions. Cleaner production will shape the course of industrial activity within the years ahead due to its economic nature, and hence needs to be encouraged and met with strong commitment from member countries. The suggested approach could be applied as a consistent policy assessment instrument for such evaluations.
Regarding the initial stage, the key findings imply that the European Union, on average, is off track from reaching its efficiency frontline. This implies that key-ins have been inefficiently applied. In reality, nations can expand their B electric vehicles adoption points and execute electric mobility policies to utilize similar key-ins. Furthermore, from the next stage of the analysis, the top results illustrate a direct and statistically meaningful impact of RE electricity production within the dynamic envelope analysis. i.e., static returns to scale marks in the two one aspect evaluation plus the second aspect of the two-pronged assessment equations. This connotes those nations, alongside high intensities of RE electricity production, could be efficient in scaling up B electric vehicles since they can create charge points together with power produced from RETs. Concurrently, peak power consumption reduces the dynamic envelope analysis constant returns to scale.
Equally, Germany is efficient within all the scenarios given regarding the dynamic envelope analysis models. It is one of the nations of the European Union with high-quality incineration, recycling of material, and composting of waste and sends a minute amount of waste to landfill. However, France, Italy, the Netherlands, Spain, and Sweden generally apply all waste argument strategies, and Sweden too sends almost no waste to landfill. Simultaneously, Sweden is efficient in the entire dynamic envelope analysis as well. Also, the out-of-the-blue result pertains g to the United Kingdom that is efficient within the models nonetheless yet depended on the landfill in the year 2008. Nevertheless, this reduces as time goes by. Generally, it is observed that nations that apply all the four management strategies together with additional sustainable ones and reduce the utilization of landfills are efficient based on the dynamic envelope analysis and the circular economy method.
Of course, the article also has insufficient research. We believe that follow-up research can further break through the restrictions and consider the energy efficiency interaction between EU member states based on existing research prospects. Our perspective should be based on the group nature of their organization, using methods such as spatial correlation models and spatial metrology to analyze the results of energy efficiency under the influence of economic channels.
Data Availability Statement
The original contributions presented in the study are included in the article/Supplementary Material, further inquiries can be directed to the corresponding author.
Author Contributions
HL: Conceptualization, Data curation, Methodology, Writing—original draft. PY: Data curation, Visualization.
Funding
This research was funded by the Program of Shanghai Planning Office of Philosophy and Social Science of China (No. 2020BGL023).
Conflict of Interest
The authors declare that the research was conducted in the absence of any commercial or financial relationships that could be construed as a potential conflict of interest.
Publisher’s Note
All claims expressed in this article are solely those of the authors and do not necessarily represent those of their affiliated organizations, or those of the publisher, the editors and the reviewers. Any product that may be evaluated in this article, or claim that may be made by its manufacturer, is not guaranteed or endorsed by the publisher.
References
Acquah, P. M. (2021). Determinants of Energy Efficiency in Sub-saharan Africa. Asia-Pacific J. Business Rev. 5 (February), 19–44. doi:10.20522/APJBR.2021.5.2.19
Alcaraz, J., Anton-Sanchez, L., Aparicio, J., Monge, J. F., and Ramón, N. (2021). Russell Graph Efficiency Measures in Data Envelopment Analysis: The Multiplicative Approach. Eur. J. Oper. Res. 292, 663–674. doi:10.1016/j.ejor.2020.11.001
Alemzero, D., Acheampong, T., and Huaping, S. (2021). Prospects of Wind Energy Deployment in Africa: Technical and Economic Analysis. Renew. Energ. 179, 652–666. doi:10.1016/j.renene.2021.07.021
Amowine, N., Ma, Z., Li, M., Zhou, Z., Yaw Naminse, E., and Amowine, J. (2020). Measuring Dynamic Energy Efficiency in Africa: A Slack‐Based DEA Approach. Energy Sci Eng. 8, 3854–3865. doi:10.1002/ese3.782
Atta Mills, E. F. E., Dong, J., Yiling, L., Baafi, M. A., Li, B., and Zeng, K. (2021). Towards Sustainable Competitiveness: How Does Financial Development Affect Dynamic Energy Efficiency in Belt & Road Economies? Sustainable Prod. Consumption 27, 587–601. doi:10.1016/j.spc.2021.01.027
Banker, R. D., Charnes, A., and Cooper, W. W. (1984). Some Models for Estimating Technical and Scale Inefficiencies in Data Envelopment Analysis. Manage. Sci. 30 (9), 1078–1092. doi:10.1287/mnsc.30.9.1078
Charnes, A., Cooper, W. W., and Rhodes, E. (1978). Measuring the Efficiency of Decision Making Units. Eur. J. Oper. Res. 2 (6), 429–444. doi:10.1016/0377-2217(78)90138-8
Chen, X., and Gong, Z. (2017). DEA Efficiency of Energy Consumption in China's Manufacturing Sectors with Environmental Regulation Policy Constraints. Sustainability 9, 210. doi:10.3390/su9020210
Cui, Q., and Li, Y. (2015). Evaluating Energy Efficiency for Airlines: An Application of VFB-DEA. J. Air Transport Manage. 44-45, 34–41. doi:10.1016/j.jairtraman.2015.02.008
Dunlop, T. (2019). Mind the gap: A Social Sciences Review of Energy Efficiency. Energ. Res. Soc. Sci. 56, 101216. doi:10.1016/j.erss.2019.05.026
Economidou, M., Todeschi, V., Bertoldi, P., D'Agostino, D., Zangheri, P., and Castellazzi, L. (2020). Review of 50 Years of EU Energy Efficiency Policies for Buildings. Energy and Buildings 225, 110322. doi:10.1016/j.enbuild.2020.110322
Esmaeili, M. (2012). An Enhanced Russell Measure in DEA with Interval Data. Appl. Math. Comput. 219, 1589–1593. doi:10.1016/j.amc.2012.07.060
Grösche, P. (2009). Measuring Residential Energy Efficiency Improvements with DEA. J. Prod. Anal. 31, 87–94. doi:10.1007/s11123-008-0121-7
Guo, Y., Yu, Y., Ren, H., and Xu, L. (2020). Scenario-based DEA Assessment of Energy-Saving Technological Combinations in Aluminum Industry. J. Clean. Prod. 260, 121010. doi:10.1016/j.jclepro.2020.121010
He, P., Sun, Y., Shen, H., Jian, J., and Yu, Z. (2019). Does Environmental Tax Affect Energy Efficiency? an Empirical Study of Energy Efficiency in OECD Countries Based on DEA and Logit Model. Sustainability 11, 3792. doi:10.3390/su11143792
He, Y., Liao, N., and Zhou, Y. (2018). Analysis on Provincial Industrial Energy Efficiency and its Influencing Factors in China Based on DEA-RS-FANN. Energy 142, 79–89. doi:10.1016/j.energy.2017.10.011
Iftikhar, Y., Wang, Z., Zhang, B., and Wang, B. (2018). Energy and CO2 Emissions Efficiency of Major Economies: A Network DEA Approach. Energy 147, 197–207. doi:10.1016/j.energy.2018.01.012
Imdadul Haque, M. (2019). The Economic and Energy Efficiencies of GCC States: A DEA Approach. Manage. Sci. Lett. 6, 1–12. doi:10.5267/j.msl.2018.11.005
König, W., Löbbe, S., Büttner, S., and Schneider, C. (2020). Establishing Energy Efficiency-Drivers for Energy Efficiency in German Manufacturing Small- and Medium-Sized Enterprises. Energies 13, 5144. doi:10.3390/en13195144
Li, W., Chien, F., Hsu, C.-C., Zhang, Y., Nawaz, M. A., Iqbal, S., et al. (2021). Nexus between Energy Poverty and Energy Efficiency: Estimating the Long-Run Dynamics. Resour. Pol. 72, 102063. doi:10.1016/j.resourpol.2021.102063
Liu, H., Yao, P., Wang, X., Huang, J., and Yu, L. (2021). Research on the Peer Behavior of Local Government Green Governance Based on SECI Expansion Model. Land 10, 472. doi:10.3390/land10050472
Malinauskaite, J., Jouhara, H., Ahmad, L., Milani, M., Montorsi, L., and Venturelli, M. (2019). Energy Efficiency in Industry: EU and National Policies in Italy and the UK. Energy 172, 255–269. doi:10.1016/j.energy.2019.01.130
Malinauskaite, J., Jouhara, H., Egilegor, B., Al-Mansour, F., Ahmad, L., and Pusnik, M. (2020). Energy Efficiency in the Industrial Sector in the EU, Slovenia, and Spain. Energy 208, 118398. doi:10.1016/j.energy.2020.118398
Mardani, A., Zavadskas, E. K., Streimikiene, D., Jusoh, A., and Khoshnoudi, M. (2017). A Comprehensive Review of Data Envelopment Analysis (DEA) Approach in Energy Efficiency. Renew. Sust. Energ. Rev. 70, 1298–1322. doi:10.1016/j.rser.2016.12.030
Mehmood, K., Iftikhar, Y., Chen, S., Amin, S., Manzoor, A., and Pan, J. (2020). Analysis of Inter-temporal Change in the Energy and CO2 Emissions Efficiency of Economies: A Two Divisional Network DEA Approach. Energies 13, 3300. doi:10.3390/en13133300
Meng, F., Su, B., and Bai, Y. (2019). Rank Reversal Issues in DEA Models for China's Regional Energy Efficiency Assessment. Energy Efficiency 12 (4), 993–1006. doi:10.1007/s12053-018-9737-2
Mohd Chachuli, F. S., Ahmad Ludin, N., Mat, S., and Sopian, K. (2020). Renewable Energy Performance Evaluation Studies Using the Data Envelopment Analysis (DEA): A Systematic Review. J. Renew. Sust. Energ. 12, 062701. doi:10.1063/5.0024750
Mohsin, M., Hanif, I., Taghizadeh-Hesary, F., Abbas, Q., and Iqbal, W. (2021). Nexus between Energy Efficiency and Electricity Reforms: A DEA-Based Way Forward for Clean Power Development. Energy Policy 149, 112052. doi:10.1016/j.enpol.2020.112052
Moon, H., and Min, D. (2020). A DEA Approach for Evaluating the Relationship between Energy Efficiency and Financial Performance for Energy-Intensive Firms in Korea. J. Clean. Prod. 255, 120283. doi:10.1016/j.jclepro.2020.120283
Nugent, N., and Rhinard, M. (2019). The ‘political' Roles of the European Commission. J. Eur. Integration 41, 203–220. doi:10.1080/07036337.2019.1572135
Ouyang, W., and Yang, J.-B. (2020). The Network Energy and Environment Efficiency Analysis of 27 OECD Countries: A Multiplicative Network DEA Model. Energy 197, 117161. doi:10.1016/j.energy.2020.117161
Palm, J., and Backman, F. (2020). Energy Efficiency in SMEs: Overcoming the Communication Barrier. Energy Efficiency 13, 809–821. doi:10.1007/s12053-020-09839-7
Salahi, M., Toloo, M., and Hesabirad, Z. (2019). Robust Russell and Enhanced Russell Measures in DEA. J. Oper. Res. Soc. 70, 1275–1283. doi:10.1080/01605682.2018.1489353
Singpai, B., and Wu, D. D. (2021). An Integrative Approach for Evaluating the Environmental Economic Efficiency. Energy 215, 118940. doi:10.1016/j.energy.2020.118940
Song, M.-L., Zhang, L.-L., Liu, W., and Fisher, R. (2013a). Bootstrap-DEA Analysis of BRICS' Energy Efficiency Based on Small Sample Data. Appl. Energ. 112, 1049–1055. doi:10.1016/j.apenergy.2013.02.064
Song, M., Yang, L., Wu, J., and Lv, W. (2013b). Energy Saving in China: Analysis on the Energy Efficiency via Bootstrap-DEA Approach. Energy Policy 57, 1–6. doi:10.1016/j.enpol.2012.11.001
Sueyoshi, T., and Goto, M. (2017). World Trend in Energy: an Extension to DEA Applied to Energy and environmentJournal of Economic Structures. Econ. Structures 6 (1). doi:10.1186/s40008-017-0073-z
Sueyoshi, T., Yuan, Y., and Goto, M. (2017). A Literature Study for DEA Applied to Energy and Environment. Energ. Econ. 62, 104–124. doi:10.1016/j.eneco.2016.11.006
Wang, K., Yu, S., and Zhang, W. (2013). China's Regional Energy and Environmental Efficiency: A DEA Window Analysis Based Dynamic Evaluation. Math. Comput. Model. 58, 1117–1127. doi:10.1016/j.mcm.2011.11.067
Wang, L.-W., Le, K.-D., and Nguyen, T.-D. (2019). Assessment of the Energy Efficiency Improvement of Twenty-Five Countries: A DEA Approach. Energies 12, 1535. doi:10.3390/en12081535
Xu, T., You, J., Li, H., and Shao, L. (2020). Energy Efficiency Evaluation Based on Data Envelopment Analysis: A Literature Review. Energies 13, 3548. doi:10.3390/en13143548
Yang, Z., and Wei, X. (2019). The Measurement and Influences of China's Urban Total Factor Energy Efficiency under Environmental Pollution: Based on the Game Cross-Efficiency DEA. J. Clean. Prod. 209, 439–450. doi:10.1016/j.jclepro.2018.10.271
Yu, D., and He, X. (2020). A Bibliometric Study for DEA Applied to Energy Efficiency: Trends and Future Challenges. Appl. Energ. 268, 115048. doi:10.1016/j.apenergy.2020.115048
Keywords: financial development, data envelopment analysis, European Union, energy efficiency, assessment
Citation: Yan D, Liu H and Yao P (2021) Assessing Energy Efficiency for Economic and Sustainable Development in the Region of European Union Countries. Front. Environ. Sci. 9:779163. doi: 10.3389/fenvs.2021.779163
Received: 18 September 2021; Accepted: 18 October 2021;
Published: 30 November 2021.
Edited by:
Qaiser Abbas, Ghazi University, PakistanCopyright © 2021 Yan, Liu and Yao. This is an open-access article distributed under the terms of the Creative Commons Attribution License (CC BY). The use, distribution or reproduction in other forums is permitted, provided the original author(s) and the copyright owner(s) are credited and that the original publication in this journal is cited, in accordance with accepted academic practice. No use, distribution or reproduction is permitted which does not comply with these terms.
*Correspondence: Hongda Liu, liuhodao@163.com