SWCC of Calcareous Silty Sand Under Different Fines Contents and dry Densities
 Jian-Hua Shen1
  Ming-Jian Hu
 Xing Wang
 Chen-Yang Zhang
 Dong-Sheng Xu
- 1State Key Laboratory of Geotechnical Mechanics and Engineering, Institute of Rock and Soil Mechanics, Chinese Academy of Sciences, Wuhan, China
- 2School of Civil Engineering and Architecture, Wuhan University of Technology, Wuhan, China
Investigating the soil-water characteristics of calcareous soil has a great significance for preventing geological disasters on island-reefs as well as maintaining the foundation stability of hydraulic-filled island-reefs. In this study, calcareous silty sands with different fines contents and dry densities were studied to reveal their effects on the soil-water characteristics of calcareous soil on hydraulic-filled island-reefs. The soil-water characteristic curve (SWCC) of the calcareous silty sand was measured using a pressure plate apparatus. Taking into account the porous meso-structure, the effects of fines content and dry density on the SWCC of calcareous silty sand were analyzed, and the applicability of existing SWCC models to calcareous silty sand was verified. A SWCC model suitable for assessing soil-water characteristic of calcareous silty sand was proposed. Results of this study provide some reference for quantifying the water-holding capacity of calcareous silty sand.
Highlights
Soil-water characteristic curves of calcareous silty sands under different conditions were measured.
Applicability of the classical models to calcareous silty sand was analyzed.
A model suitable for simulating the SWCC of calcareous silty sand was proposed.
Introduction
When coral polyps die, their organic remains gradually calcify, eventually forming coral reefs that can be partially exposed above sea level. Calcareous sand is a unique geomaterial, formed by the organic remains of hermatypic corals and other marine organisms, such as algae and shells, through physical, chemical, and biological process (Chen and Hu, 2020; Shen J. H. et al., 2020, Shen et al., 2020 J.; Wang et al., 2021; He and Ye, 2021). Generally, the calcium carbonate content in calcareous sand is greater than 50%, and calcareous sand is widely distributed along continental shelves and coastlines within N30°–S30° latitude (Anggraini et al., 2017; Nurul et al., 2019). Calcareous sand has been discovered on coral reefs in the South China Sea (Shen et al., 2017; Ye et al., 2019; Yu et al., 2020). Recently, a large-scale reclamation of island-reefs has been carried out using calcareous sands as the filling material (Wang et al., 2019a; 2019b). Geological disasters such as landslides, rockfalls, rainstorms, and earthquakes frequently occur on and around islands in the South China Sea. These geological hazards are closely related to the energy and quantity of water in calcareous sand (or the water-holding capacity of calcareous sand). The soil-water characteristic curve (SWCC) illustrates the relationship between the energy (i.e., matric suction) and quantity (i.e., water content) of water in geomaterials. Therefore, investigating the SWCC of calcareous sand is of vital importance to understanding and preventing geological disasters as well as maintaining the foundation stability of hydraulic-filled island-reefs.
Thus far, numerous studies have been carried out on the SWCCs of geomaterials. In terms of theoretical research, empirical formulas have been proposed to simulate the SWCCs of geomaterials based on different hypotheses by Gardner (1957), Brooks and Corey (1964), Van Genutchen (1980), Willams et al. (1983), Fredlund and Xing (1994), Houston et al. (1994), Kawai et al. (2000), Pham (2005), Stange and Hom (2005), Zhou et al. (2012), and Zhou et al. (2014). These formulas have been widely applied in engineering projects; however, none of them can be used to predict the SWCCs of different geotechnical materials under any possible conditions. Therefore, in order to establish an empirical formula suitable for simulating the SWCC of calcareous sand, it is necessary to conduct SWCC tests on calcareous sand and theoretically analyze the test data. In addition, predecessors have long realized the importance of studying the SWCCs of geomaterials using experiments. For example, Ng and Pang (2000) used a conventional volumetric pressure-plate extractor to explore the effects of initial dry density and water content, drying and wetting histories, soil structure, and stress state on SWCC properties of volcanic ash and found that under the same initial dry density and water content, the desorption and adsorption rates of natural samples were less than those of recompressed samples. Vanapalli et al. (2001) conducted soil-water characteristic tests on unsaturated soil and considered that the initial water content had a significant influence on the structure of unsaturated soil, and then affected the soil-water characteristics. Gallage and Uchimura (2010) measured the SWCCs of sandy soil with different dry densities and particle size distributions as well as pointed out that samples with higher-compactness commonly have greater air entry values and that the SWCCs of samples with a more uniform particle size distribution tend to have less hysteresis. Song (2014) tested the suction stress in silica sand with different relative densities using an automated SWCC apparatus and determined that the air entry value of silica sand decreases with increasing relative density, which is similar to the findings of Gallage and Uchimura (2010). Zhou et al. (2016) used different software computing methods to determine the volumetric water contents of geomaterials and assessed the accuracy of different empirical models in simulating the SWCCs of geomaterials. Jiang et al. (2020) carried out soil-water characteristic tests on ten groups of unsaturated soil samples with different fines contents using a pressure-membrane apparatus and found that the water-holding capacity of the soil gradually decreased as fines content increased when the fines content was between 10 and 60%; otherwise, the water-holding capacity of the soil increased.
Numerous studies have been conducted on the SWCCs of geomaterials using different testing techniques; however, most studies are focused on terrigenous deposits such as silica sand, silt, and clay. Studies on the SWCC of calcareous sand is rare. Due to its special marine biogenesis, the physical and mechanical properties of calcareous sand are significantly different from those of terrigenous deposits, including high void ratio (Shen J. H. et al., 2020; Wang et al., 2020a), irregular particle shape (Wei et al., 2019; Wang et al., 2020b), susceptibility to particle breakage (Xiao et al., 2017; Wu et al., 2020), and cementation (Xiao et al., 2019; Li et al., 2021). Therefore, the soil-water characteristics of calcareous sand might be distinguishable from those of terrigenous sediments, and an in-depth study is still needed.
During hydraulic reclamation, coarse-grained calcareous soil tends to accumulate in the vicinity of the hydraulic reclamation mouth due to hydraulic screening and particle weight, while fine-grained calcareous soil is carried downstream and deposited by flowing water. Between hydraulic reclamation stages, coarse-grained calcareous soil accumulated in the vicinity of the hydraulic reclamation mouth is pushed downstream, and the next stage of hydraulic reclamation is conducted after site leveling (Wang et al., 2020c). Hence, the particle size distribution of calcareous sand is extremely non-uniform in the reclaimed layers. In addition, due to the complexity of marine depositional environments, the compactness of calcareous sand in superficial layers also varies significantly from one location to another. In view of this, a series of soil-water characteristic tests was conducted to explore the effects of fines content and dry density on the soil-water characteristics of calcareous silty sand. By fitting the SWCC of calcareous silty sand using the Fredlund-Xing model (Fredlund and Xing, 1994), Van Genutchen model (Van Genutchen, 1980), and Zhong Fangjie model (Zhong, 2007), the ability of these models to assess the soil-water characteristics of calcareous silty sand was analyzed. An analytical model suitable for simulating the SWCC of calcareous silty sand was proposed. Results of this study provide some reference for assessing the water-holding capacity of calcareous silty sand on hydraulic-filled island-reefs.
Test Overview
Test Materials
The calcareous sand used in this study was collected from a reclaimed island-reef in the South China Sea (Figure 1). Calcareous coarse particles and fine particles are mixed together at the sampling site, and the particle size distribution is extremely non-uniform (Figure 1C).
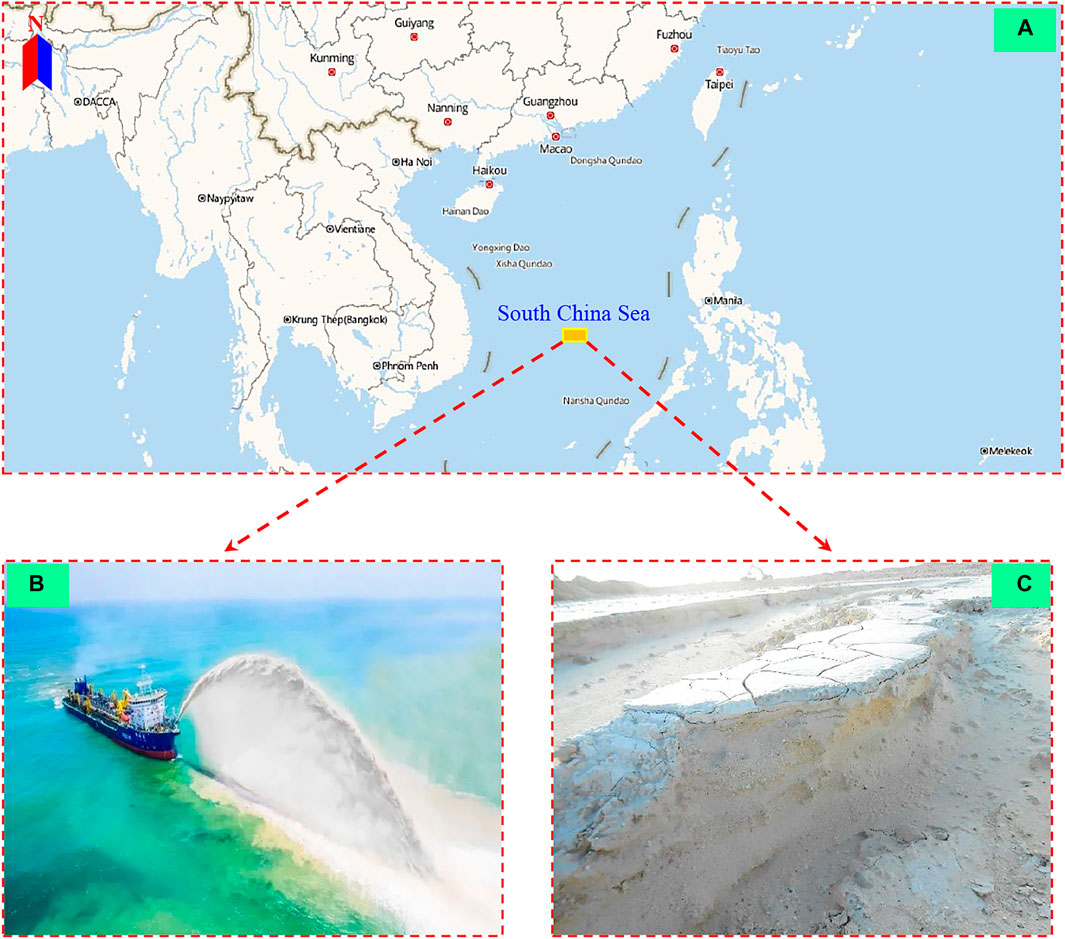
FIGURE 1. Location of the study area (A): location of Nansha Islands; (B): site of hydraulic reclamation; (C): sampling site).
Considering the weak water-holding capacity of coarse-grained calcareous sand (Hu et al., 2019), only calcareous sand with a particle size less than 0.25 mm was used to observe the water desorption phenomenon in this study. The calcareous soil particles in the sample are classified as coarse particles or fine particles. In this paper, particles 0.075–0.25 mm in size served as the skeleton of the sample and are called coarse particles; particle less than 0.075 in size are called fine particles. To study the effect of fines content on the soil-water characteristics of calcareous sand, calcareous sand samples with fines contents (CF) of 0, 10, 20, 30, 40, and 50% were prepared by adjusting the mass percentage of the fines. According to the Chinese National Standard of Soil Test Method (SL237, 2019), samples in which the mass of coarse particles above 0.075 mm in size accounts for no less than 50% of the total sample are defined as silty sand. Therefore, all the samples used in this study, with fines contents of 0, 10, 20, 30, 40, and 50%, were calcareous silty sand. For convenience, calcareous silty sand samples with fines contents of 0, 10, 20, 30, 40, and 50% were named CSS1, CSS2, CSS3, CSS4, CSS5, and CSS6, respectively. According to the Chinese National Standard of Soil Test Method (SL237, 2019), the hydrometer method was used to measure the size distribution of particles less than 0.075 mm in size. The particle size distributions of the samples are shown in Figure 2, and physical parameters of calcareous silty sand with different fines contents are listed in Table 1.
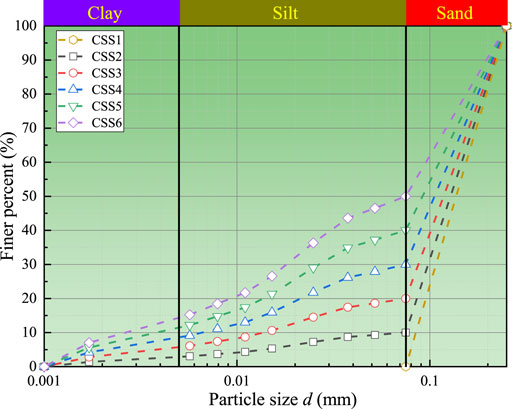
FIGURE 2. Particle size distribution curves of calcareous silty sand.
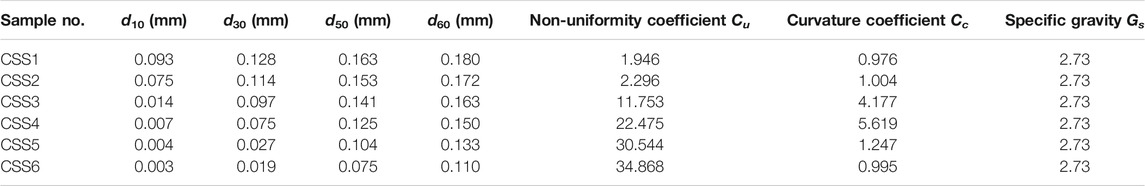
TABLE 1. Physical parameters of calcareous silty sand.
According to Figure 2 and Table 1, it is found that 1) Only the non-uniformity coefficient (Cu) and curvature coefficient (Cc) of CSS5 can simultaneously satisfy Cu > 5.0 and 1.0 < Cc < 3.0; therefore, the particle size distribution of CSS5 is good, while the particle size distributions of the other samples are poor. 2) The specific gravities of calcareous silty sand samples are uniformly 2.73. The samples were collected from the same marine environment with identical mineral compositions and proportions; hence, they have the same specific gravity.
Test Apparatus and Measurement Principle
A 1500F1 15 bar diaphragm pressure plate apparatus, manufactured by Soilmoisture Equipment Corp., was used in this study to measure the change in volumetric water content of a sample with matric suction ranging from 0 to 1,500 kPa (Tao et al., 2018). The pressure plate apparatus is primarily composed of six parts, i.e., nitrogen cylinder, pressure reducing valve, regulating valve, pressure chamber, porous ceramic plate, and water container (Figure 3). The nitrogen cylinder is used to continuously provide air compression stress to the pressure chamber, and the pressure reducing valve and the regulating valve are used to adjust the air compression stress to the designed value. The size of the pressure chamber is 10 cm in internal depth and 30 cm in diameter. Within the pressure chamber is a porous ceramic plate where the sample is placed during the test. Small pores are densely distributed on the ceramic plates. After the ceramic plate is immersed in water and saturated, a layer of shrinking film emerges on the surface of small pores due to surface tension, allowing for the passage of water but preventing air to enter the small pores. A stress difference forms between the inside and outside of the shrink film, and the water in the sample penetrates the pores in the ceramic plate and converges into the water container. When the mass of the water drained from the sample changes at a rate less than 0.1 g/24 h (Pham, 2005), the matric suction in the sample and the air compression stress in the pressure chamber reach an equilibrium state, and the matric suction in the sample is equal to the air compression stress. This means that, under equilibrium conditions, the change in the matric suction of a sample during water desorption can be assessed through the real-time monitoring of the air compression stress in the pressure chamber. In this study, calcareous silty sands with different fines contents took 4–5 days to reach an equilibrium state under different air compression stresses. During the test, the water drained by the sample is completely collected by the water container, and the sample volume is assumed to remain constant during the test. By monitoring the amount of water in the container under each level of air compression stress in a real-time, this study obtained the relationship between volumetric water content and matric suction, i.e., SWCC.
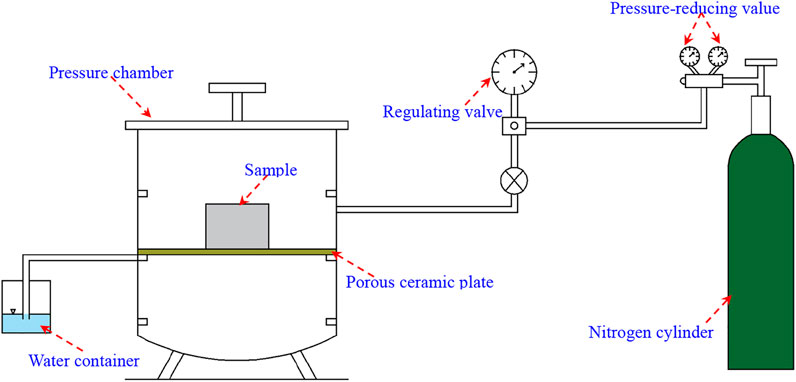
FIGURE 3. Schematic diagram of the pressure plate apparatus.
Test Program
Water desorption tests were carried out on the samples with different fines contents. In general, the interlocking strength of calcareous silty sand is low, and under a low dry density, it is difficult for samples to take shape when saturated. In this study, the samples with different fines contents were tested at a dry density of 1.52 g/cm3 (As shown in the Table 2). To clarify the effect of dry density on the SWCC of calcareous silty sand, calcareous silty sands with dry densities of 1.44 g/cm3, 1.57 g/cm3, and 1.63 g/cm3 were tested with a fines content of 20%, and the samples were named as CSS7, CSS8, and CSS9, respectively (As shown in the Table 2).
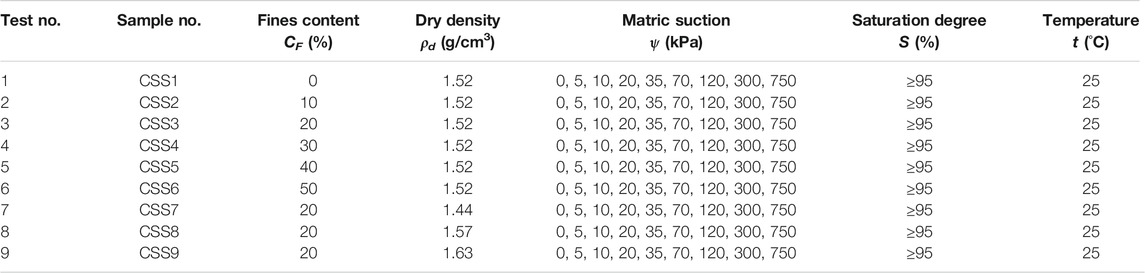
TABLE 2. Experimental design scheme of water desorption tests.
The calcareous sand collected from the sampling site was first dried at 105°C and then cooled to room temperature (i.e., 25°C). Sieving was carried out to obtain the fine particles (d<0.075 mm) and coarse particles (d = 0.075–0.25 mm). The sample mass was determined based on the dry density and size of the sample (i.e., diameter 61.8 mm, height 20 mm). Combined with the sample mass and the fines content (CF), the mass of coarse particles (d = 0.075–0.25 mm) and fine particles (d<0.075 mm) in the sample was determined, respectively. The coarse and fine particles in the sample were evenly mixed, and the sample was formed into cutting ring shape through compression. Samples with different fines contents (CF) and dry densities (ρd) were prepared, and the individual samples were 61.8 mm in diameter by 20 mm in height. Samples were fixed on a saturator and saturated via immersion saturation and vacuum saturation (i.e., saturation degree ≥95%). Each saturated sample was weighed. The mass water content (ω) and volumetric water content (θ) of a saturated sample can be calculated using Eqs 1, 2:
where mω is the mass of water in the saturated sample; md and ms are the mass of the dry and saturated sample, respectively; ρd and ρω are the dry density of the sample and the density of water at 4°C.
The porous ceramic plate was immersed in distilled water and vacuum saturated for at least 3 h. The plate was then horizontally placed in the pressure chamber after the water on the surface was dried and the drainage line was connected. Then, the saturated sample was placed on the porous ceramic plate, and the pressure chamber was sealed after the sample was placed in close contact with the porous ceramic plate.
During testing, the air compression stress in the pressure chamber was regulated to be 0, 5, 10, 20, 35, 70, 120, 300, and 750 kPa using the axial translation technique (Li et al., 2016). Due to the air compression stress, the water in the saturated sample was drained into the water container, and the mass of the water in the water container was measured using a balance with precision of 0.001 g, three to five times a day. When the daily change in the mass of the drained water was less than 0.1 g, the sample was determined to have reached an equilibrium state under the current air compression stress. The air pressure stress was gradually applied to the sample until the sample reached equilibrium under the air pressure stress of 750 kPa.
After testing, the sample was taken out of the pressure chamber, and the water content of the sample was measured to obtain the mass of water in the sample. The mass of water drained from the sample under each air compression stress level is subtracted from the mass of water in the saturated sample before testing (mω). The calculated value for the mass of water in sample after test is obtained and compared with the corresponding measured value, and the correctness of test data is rechecked. The mass of the saturated sample before testing (ms) and the mass of the water drained from the sample under each air compression stress level were used to calculate the total mass of the sample under each air compression stress level (ml). The volumetric water content of the sample under each air compression stress level (θl) can be calculated using Eq. 3:
The Classical Soil-Water Characteristic Curve Models
Many SWCC models have been proposed based on experimental results and various hypotheses. Among them, the Fredlund-Xing model, Van Genutchen model, and Zhong Fangjie model have been widely applied in geotechnical engineering. The Fredlund-Xing model (Fredlund and Xing, 1994) was developed based on the relationship between SWCC, the capillary model, and the pore distribution function, which is expressed as follows:
where θs is the saturated volumetric water content; ψ is the matric suction; exp is a constant with a value of 2.718; a, b, and c, are fitting parameters, where a is related to air entry value, and the greater the a value, the greater the air entry value; b is a parameter related to the slope of SWCC in the transition stage. As b increases, the turning near the point corresponding to the air entry value on SWCC increases as well. c is a parameter related to the matric suction in the residual stage, and the smaller the c value, the gentler the SWCC in the residual stage (Fredlund and Xing, 1994).
The SWCC model proposed by Van Genutchen (1980) based on Mualem’s theory is expressed as:
where θr is the residual volumetric water content; a1, b1, and c1 are fitting parameters.
Zhong (2007) proposed a SWCC model based on the results of soil-water characteristic tests on silica sand, expressed as follows:
where a2, b2, c2, and d are fitting parameters.
In this study, the SWCC of calcareous silty sand was fit using these classical theories to check their applicability for describing the soil-water characteristics of calcareous sand.
Results and Discussion
Effect of Fines Content
As shown in Figure 4, the SWCCs of calcareous silty sands with varying fines content show the same trend as those of SWCCs of terrigenous unsaturated fine-grained soil (Rao and Singh, 2010; Ma et al., 2015; Han et al., 2017). Depending on the air entry value and residual volumetric water content, the SWCC can be divided into three stages, i.e., the boundary effect stage (ψ ≈ 0–5 kPa), transition stage (ψ ≈ 5–10 kPa), and residual stage (ψ ≈ 10–750 kPa) (Figure 5).
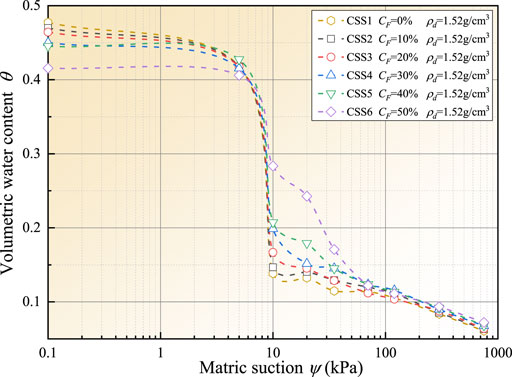
FIGURE 4. Volumetric water content versus matric suction for calcareous silty sands with different fines contents.
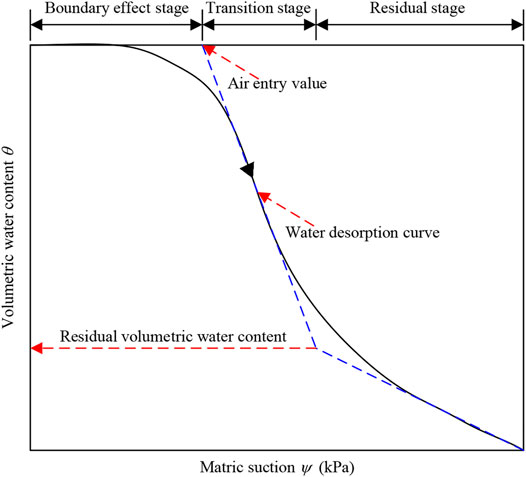
FIGURE 5. Schematic diagram of SWCC.
The SWCCs of calcareous silty sands with different fines contents varied significantly from each other in the boundary effect stage (ψ ≈ 0–5 kPa). A statistical quantity δi-j was defined to characterize the declining amplitude of the volumetric water content of calcareous silty sand during the gradual increase of matric suction from i to j, as expressed below:
where θi and θj are the volumetric water contents corresponding to matric suctions i and j, respectively. It’s worth noting that volumetric water content (θi or θj) and statistical quantity (δi-j) are dimensionless. In order to realize the dimensionless formula, the matric suction (i or j) is divided by standard atmospheric pressure stress. Pa is the standard atmospheric pressure stress, i.e., 101.3 kPa. Through statistical analysis of δ0-5 of the samples with varying fines contents (CSS1, CSS2, CSS3, CSS4, CSS5, and CSS6) in the boundary effect stage, the δ0-5 of the samples were determined to be 122.13, 107.12, 96.33, 71.42, 37.05, and 19.63%, respectively.
In the transition stage (ψ ≈ 5–10 kPa), the volumetric water contents of calcareous silty sands with varying fines contents decreased abruptly with increasing matric suction, showing a high sensitivity. When the SWCC in the transition state was extended upwards to intersect with the horizontal line corresponding to the initial volumetric water content, the abscissa (i.e., matric suction) of the intersection point represents the air entry value of the sample (Figure 5). The air entry values of the samples were obtained in this way, i.e., 7.42, 7.80, 7.74, 7.85, 7.87, and 7.97 kPa, respectively. The air entry value of calcareous silty sand increased with increasing fines content except at certain discrete points. For samples with a fines content not exceeding 50%, the air entry values ranged from 7.42 to 7.97 kPa. Because air entry value characterizes the matric suction taken for the sample transforming from a quasi-saturated state to an unsaturated state (Pasha et al., 2015), a higher air entry value of samples with higher fines content suggests that the water-holding capacity of the samples improved by the increasing fines content, making the transition of the sample from a quasi-saturated state to an unsaturated state more difficult. However, the difference in the air entry values of the samples is limited, and the contribution of a higher fines content to the improvement of water-holding capacity is limited.
In the early residual stage (ψ ≈ 10–70 kPa), the SWCCs of the samples varied significantly from each other, and the higher the fines content, the higher the volumetric water content of the sample. For instance, under a matric suction of 20 kPa, the volumetric water contents of CSS1 and CSS6 were 13.25 and 24.27%, respectively. In the residual stage, the samples have been already transitioned from an unsaturated state to a quasi-dry state, and the water drained by the sample was capillary water and bound water (Wu et al., 2020). The fines particles in the samples improved the water-holding capacity, especially the capacity to adsorb capillary water (or weakly bonded water) within the calcareous silty sand. During the early residual stage, the water drained from the sample was predominantly capillary water; however, the porous structure of the samples could provide sufficient adsorption space for bound water even in the absence of fine particles, such that bound water can be firmly adsorbed onto particle surfaces (Wu et al., 2020). Therefore, the SWCCs of the samples approximately overlapped with each other in the late residual stage (ψ ≈ 70–750 kPa). The residual volumetric water contents of CSS1, CSS2, CSS3, CSS4, CSS5, and CSS6 were 16.80, 17.83, 17.96, 18.19, 18.22, and 16.48%, respectively. Except for some individual scattered points, the residual volumetric water content of calcareous silty sand increased with increasing fines content, indicating that the quantity of small pores containing capillary water and bound water inside the samples increased with increasing fines content and the water-holding capacity of the calcareous silty sand increased. However, for a fines content not exceeding 50%, the differences in residual volumetric water content between the samples were extremely small, and the maximum deviation among them is 1.74%, indicating that increasing fines content could only improve the water-holding capacity of calcareous silty sand to a limited degree, which is consistent with the conclusions of existing studies (Al-Badran and Schanz, 2009; Dolinar, 2015; Jiang et al., 2020). Additionally, the small size deviation between coarse and fine particles may also be the main reason for this phenomenon.
Figure 4 also shows that the initial volume water contents of calcareous silty sands with varying fines content have little difference; however, with the increasing fines content, the initial volume water content of calcareous silty sand presents a downward trend. This experimental phenomenon can be explained by the microscopic structure of calcareous silty sand. Soil is made up of solid, liquid and gas. When calcareous silty sand is in a saturated state, there are only solid and liquid two phase material inside. At this time, pore water exists in the pores of calcareous silty sands in the form of bound water, capillary water and free water. Among them, free water accounts for a large proportion in pore water and mainly exists in large pores; the proportion of bound water and capillary water in pore water is small, which mainly exists in small pores (Wu et al., 2020). With the increasing fines content, the large pores decrease and small pores increase in calcareous silty sand. Accordingly, the free water content decreases, while the combined water and capillary water content increases. With the increasing fines content, the decrease of free water content is greater than the increase of the content of bound water and capillary water, resulting in the volume water content of calcareous silty sand in saturated state (i.e., initial volume water contents) does not increase with the increasing fines content.
Effect of Initial dry Density
Figure 6 shows the SWCCs of calcareous silty sand with a fines content of 20% under different dry densities (CSS3, CSS7, CSS8, and CSS9). The SWCCs of the samples differ from each other primarily in the boundary effect stage (ψ ≈ 0–5 kPa) and the residual stage (ψ ≈ 10–750 kPa). In contrast, in the transition stage (ψ ≈ 5–10 kPa), the SWCCs of the samples approximately overlapped with each other.
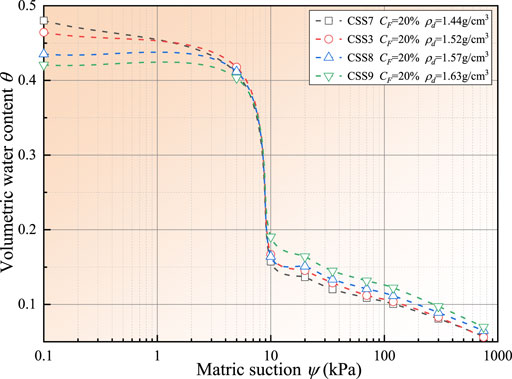
FIGURE 6. Volumetric water content versus matric suction for calcareous silty sands with different dry densities.
In the boundary effect stage (ψ ≈ 0–5 kPa), the δ0-5 of CSS7, CSS3, CSS8, and CSS9 were 145.79%, 96,33, 48.28, and 36.15%, respectively. The δi-j of calcareous silty sand with the same fines content decreased with increasing dry density, suggesting that the declining amplitude of the volumetric water content of calcareous silty sand with increasing matric suction further decreased with increasing dry density due to the amount of large pores containing free water being reduced with increasing dry density.
In the transition stage (ψ ≈ 5–10 kPa), the air entry values of CSS7, CSS3, CSS8, and CSS9, were 7.43, 7.74, 7.86, and 7.92 kPa, respectively. The higher the dry density of calcareous silty sand, the greater the air entry value of the sample. Samples with higher dry density experience more difficulty evolving from a quasi-saturated state to an unsaturated state. The quantity of the larger pores containing free water in the samples with higher dry density is fewer, and the water connectivity is poorer; hence, it is more difficult for water to drain out of the sample. As a result, a larger matric suction would be required for the sample to evolve from a quasi-saturated state to an unsaturated state.
In the residual stage (ψ ≈ 10–750 kPa), the residual volumetric water contents of the samples were 16.19, 17.96, 17.82, and 19.89%, respectively, indicating that the residual volumetric water content of the sample increases with increasing dry density. As discussed above, the water drained by the sample in the residual stage was capillary water and bound water. There are more soil particles in the samples with higher dry density, which could provide more adsorption space (such as pores on the surface of particles and small pores between particles) for capillary water and bound water (Wu et al., 2020).
Applicability of Classical Models
The SWCC of calcareous silty sand under different test conditions was fit using the models described above. It is found that these models are all applicable to describe the SWCC of calcareous silty sand in terms of the general trend. Among them, the fitting result of the Fredlund-Xing model to the SWCC of the samples is the best. When the Zhong Fangjie model was used to fit the experimental results of the samples, the SWCC was approximately horizontal in the residual stage, which is contradictory to the measured result that the volumetric water content of calcareous silty sand presented a decreasing trend with increasing matric suction in the residual stage (Figure 7). The developmental trend of SWCC is related to the size and quantity of pores in the sample (Alves et al., 2020; Daneshian et al., 2021). The Zhong Fangjie model (Zhong, 2007) is proposed based on the measured results of soil-water characteristic of silica sand. There are almost no inner pores in silica sand particles and only a few outer pores on the surface of silica sand particles, so the change in the SWCC of silica sand in the residual stage is subject to the pores between particles. In contrast, for calcareous sand, both the outer pores distributed on the surfaces of the particles and the inner pores inside the particles are abundant, and these pores, in which water could reside, improve the water-holding capacity of calcareous sand. In addition, due to the decomposition of calcium carbonate, calcareous sand also carries a certain quantity of mineral ions, which have a strong ability to adsorb the water within the sample in the residual stage (Wu et al., 2020). Therefore, the soil-water characteristics of calcareous sand differs from that of silica sand in the residual stage, and the fitting result of Zhong Fangjie model (Zhong, 2007) is not satisfactory compared to the other models.
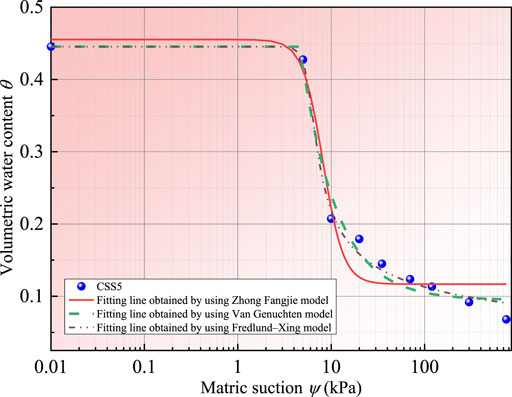
FIGURE 7. Fitting results for SWCC of CSS5 by different models.
Table 3 provides the values of the parameters of the Fredlund-Xing model fitting for the SWCCs of calcareous silty sands with different fines contents. According to Table 3, 1) a increased with increasing fines content, which is consistent with the above measured air entry values of calcareous silty sands with different fines contents. 2) b decreased abruptly with increasing fines content, indicating that with increasing fines content, the slope of the SWCC of calcareous silty sand declined gradually, and the SWCC became gentler in the transition stage. The range of matric suction corresponding to the SWCC of the transition stage widened due to increasing fines content, indicating that the matric suction for the sample transit to the residual stage increased. 3) c increased with increasing fines content, and the SWCCs of the samples in the residual stage became steeper, which conforms to the change of the SWCCs of the samples in the early residual stage (Figure 4). The number of small pores and the water-holding capacity of the sample increases with increasing fines content; hence, making it more difficult for calcareous silty sand to reach an absolutely dry state. 4) In the transition stage and late residual stage, the SWCCs of the samples approximately overlapped with each other, suggesting that the values of b and c were highly sensitive to variations in the SWCC (Figure 4). The variation ranges of the three parameters also indicated that b was more sensitive to the change in fines content.

TABLE 3. Parameters of the Fredlund-Xing model fitting the SWCCs of calcareous silty sands with different fines contents.
Table 4 shows the parameter values of the Fredlund-Xing model when used to fit the SWCCs of calcareous silty sands with different dry densities. It is found that 1) a increased with increasing dry density, which is consistent with the above measured result that the air entry value of calcareous silty sand increased with increasing dry density. 2) b did not show any obvious regularity with increasing dry density. However, among the three parameters, b changed most significantly with increasing dry density. 3) c changed only slightly with the change in dry density, which conforms to the observation that the SWCCs of calcareous silty sands with different dry densities were approximately parallel in the residual stage (Figure 6).

TABLE 4. Parameters of the Fredlund-Xing model fitting the SWCCs of calcareous silty sands with different dry densities.
Soil-Water Characteristic Curve Model of Calcareous Silty Sand
By analyzing the data in Table 3, the relationship between a, b, and c and fines content (CF) is shown in Figure 8 and can be expressed as follows:
where y1, A1, and B1 are fitting parameters.
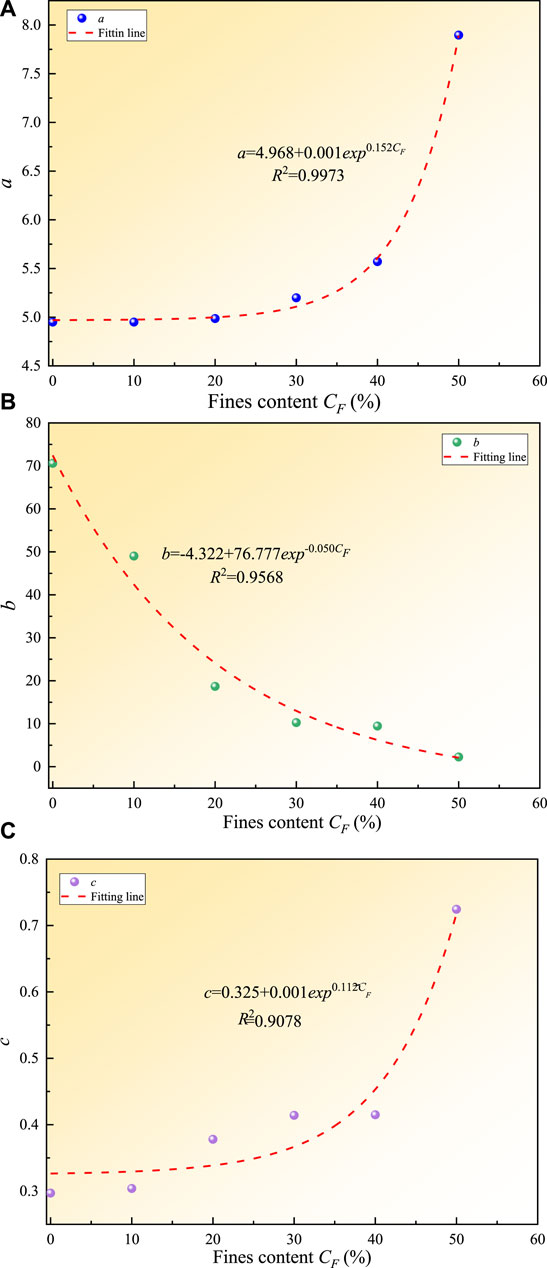
FIGURE 8. Relationship between simulation parameters of SWCC and fines content: (A)a versus CF; (B)b versus CF; (C)c versus CF.
Figure 9 shows the relationship between dry density (ρd) and the parameter a, which is expressed as follows:
where y2, A2, and B2 are fitting parameters.
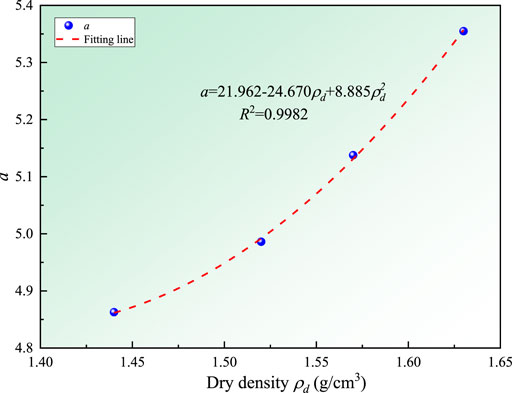
FIGURE 9. Relationship between simulation parameter of SWCC (A) and dry density.
By combining Eqs 8, 9, the following parameter calculation formulas are obtained for the Fredlund-Xing model, which is suitable for assessing the soil-water characteristics of calcareous silty sands with different fines contents and dry densities:
By fitting the saturated volumetric water contents (θs) and fines contents (CF) of calcareous silty sands with different fines contents (Figure 10A), the following equation is acquired to calculate the saturated volumetric water content (θs) of calcareous silty sand based on fines content:
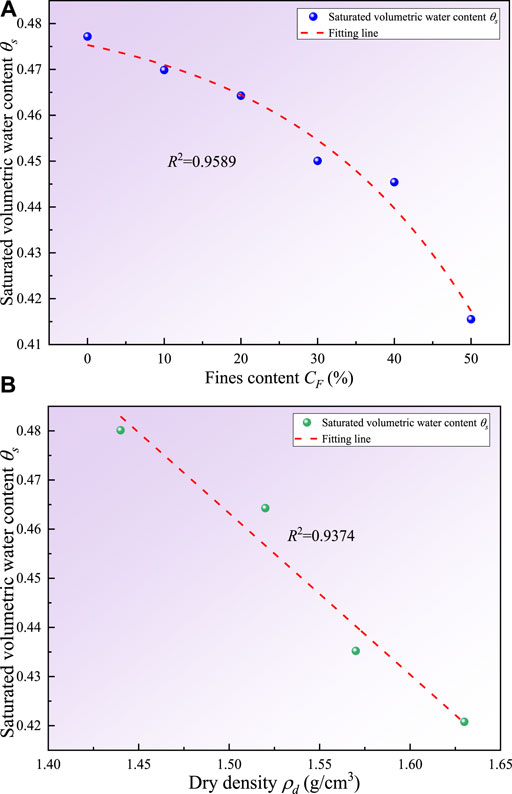
FIGURE 10. The relationship among saturated volumetric water content, fines content and dry density: (A) saturated volumetric water content versus fines content; (B) saturated volumetric water content versus dry density.
Similarly, by fitting the saturated volumetric water contents (θs) and dry densities (ρd) of calcareous silty sands with different dry densities (Figure 10B), the following equation is acquired to calculate the saturated volumetric water content (θs) of calcareous silty sand based on dry density:
Combining Eqs 13, 14 give the relational expression among saturated volumetric water content (θs), fines content (CF), and dry density (ρd):
By substituting Eqs 10–12, 15 into Eq. 5, the following formula is acquired to calculate the volumetric water content (θ) of calcareous silty sands with different matric suctions (ψ) based on fines content and dry density:
where
The proposed SWCC model was used to calculate the volumetric water content of calcareous silty sands with different fines contents and dry densities under different matric suctions, and the applicability of the model to characterize the SWCC of calcareous silty sand was assessed using the ratio between the calculated and measured values (Table 5). The values calculated from Eq. 16 were close to the measured results, and the ratio between the calculated and measured results ranges from 0.43 to 1.22, indicating that proposed model could fit the SWCC of calcareous sand. Particle shape, pressure loading mode, and numerous other factors also affect the soil-water characteristics of calcareous silty sand. Regarding the mathematical basis on which the equations are developed to calculate the volumetric water content of calcareous silty sand, it is also necessary to explore its change laws with various parameters as well as their mathematical correlations. Related research should be carried out to lay a solid theoretical foundation to develop an empirical formula universally applicable to assessing the SWCCs for various types of calcareous sands.
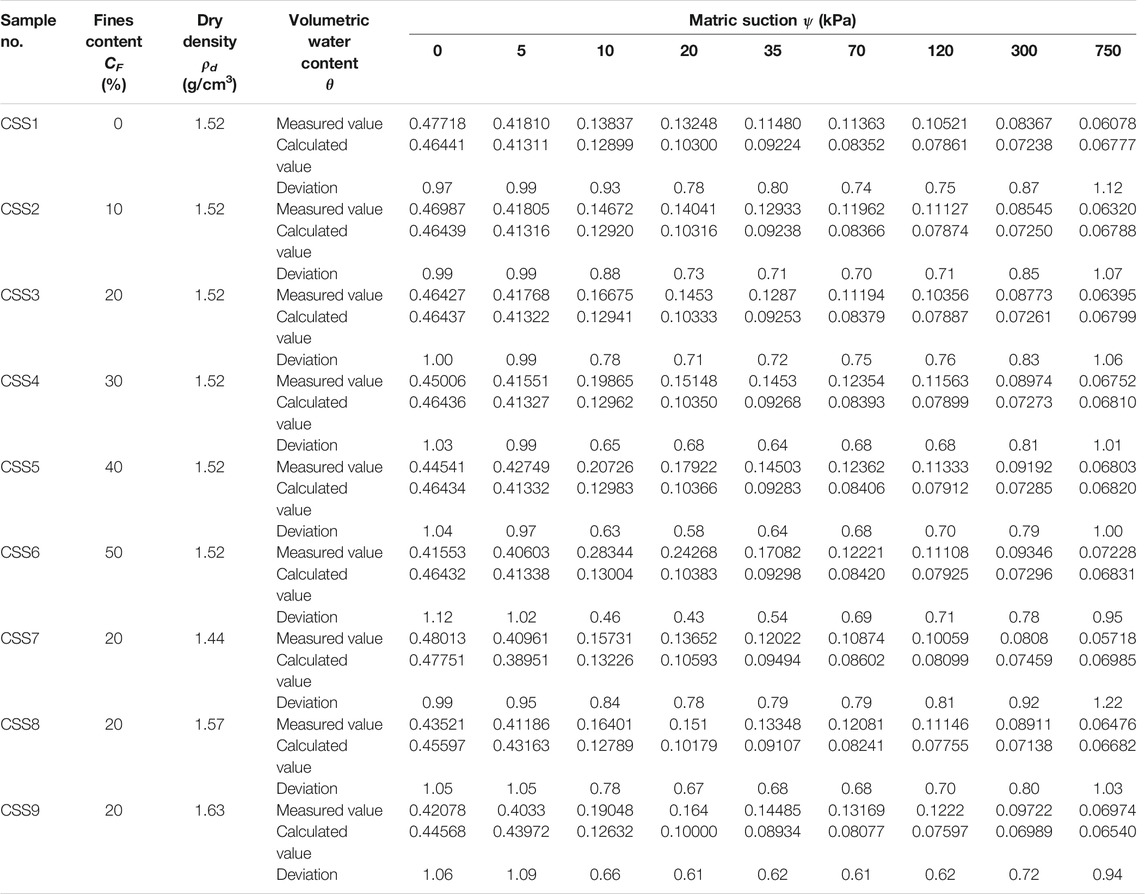
TABLE 5. The comparison between the calculated and measured values for volumetric water content.
Conclusion
A series of soil-water characteristic tests was carried out to explore the effects of fines content and dry density on the soil-water characteristics of calcareous silty sand. The applicability of three SWCC models for calcareous silty sand was verified, and a SWCC model for calcareous silty sand considering fines content and dry density was proposed based on the measured results.
In the boundary effect stage, the quantity of large pores in calcareous silty sand decreases significantly with increasing fines content; therefore, the SWCCs of the samples differ significantly. For samples with a fines content not exceeding 50%, the air entry values ranged from 7.42 to 7.97 kPa. In the early residual stage, the higher the fines content, the larger the volumetric water content of the samples as the quantity of small pores in the calcareous silty sand increased. However, in the late residual stage, the difference in the SWCCs of the samples is insignificant, which might primarily be attributed to the porous meso-structure of calcareous silty sand.
The quantity of large pores in the calcareous silty sand decreased significantly with increasing dry density. Consequently, the declining amplitude of the volumetric water content of high-dry density calcareous silty sand with increasing matric suction dropped in the boundary effect stage. For calcareous silty sand with a dry density of 1.44–1.63 g/cm3, the air entry values increased with increasing dry density and ranged from 7.43 to 7.92 kPa. The adsorption spaces for capillary water and bound water in the sample increased with increasing dry density, causing the water-holding capacity of the sample in the residual stage to improve.
Among the three classical SWCC models, the Fredlund-Xing model best fit the SWCC of calcareous silty sand. In the Fredlund-Xing model, parameter b is most sensitive to changes in fines content and dry density.
Based on the Fredlund-Xing model and the measured results, a SWCC model considering the effect of fines content and dry density was proposed. This new model can be used to describe the soil-water characteristics of calcareous silty sands with different fines contents and dry densities.
Data Availability Statement
The original contribution presented in the study are included in the article/supplementary material, further inquiries can be directed to the corresponding authors.
Author Contributions
All authors listed have made a substantial, direct, and intellectual contribution to the work and approved it for publication.
Funding
This work was funded by the National Natural Science Foundation of China (Nos. 41772336 and 41877271) as well as the Strategic Priority Research Program of the Chinese Academy of Sciences (No. XDA13010301). All their support is gratefully acknowledged.
Conflict of Interest
The authors declare that the research was conducted in the absence of any commercial or financial relationships that could be construed as a potential conflict of interest.
Publisher’s Note
All claims expressed in this article are solely those of the authors and do not necessarily represent those of their affiliated organizations, or those of the publisher, the editors and the reviewers. Any product that may be evaluated in this article, or claim that may be made by its manufacturer, is not guaranteed or endorsed by the publisher.
References
Al-Badran, Y., and Schanz, T. (2009). “Soil Water Characteristic Curve and Consolidation of fine Grained Soils,” in Proceeding of the 4th Asia Pacific Conference on Unsaturated Soils, Newcastle, Australia, November 23–25.
Alves, R. D., Gitirana, G. D. N., and Vanapalli, S. K. (2020). Advances in the Modeling of the Soil-Water Characteristic Curve Using Pore-Scale Analysis. Comput. Geotech. 127, 103788. doi:10.1016/j.compgeo.2020.103766
Anggraini, V., Asadi, A., Syamsir, A., and Huat, B. B. K. (2017). Three point Bending Flexural Strength of Cement Treated Tropical marine Soil Reinforced by Lime Treated Natural Fiber. Measurement 111, 158–166. doi:10.1016/j.measurement.2017.07.045
Brooks, R., and Corey, A. (1964). Hydraulic Properties of Porous media. Hydrol. Pap. No. 3. Hydrol. Pap. 3, 892–898.
Chen, B., and Hu, J.-M. (2020). Fractal Behavior of Coral Sand during Creep. Front. Earth Sci. 8, 134. doi:10.3389/feart.2020.00134
Daneshian, B., Habibagahi, G., and Nikooee, E. (2021). Determination of Unsaturated Hydraulic Conductivity of sandy Soils: a New Pore Network Approach. Acta Geotech. 16, 449–466. doi:10.1007/s11440-020-01088-3
Dolinar, B. (2015). Prediction of the Soil-Water Characteristic Curve Based on the Specific Surface Area of fine-grained Soils. Bull. Eng. Geol. Environ. 74, 697–703. doi:10.1007/s10064-014-0664-y
Fredlund, D. G., and Xing, A. (1994). Equations for the Soil-Water Characteristic Curve. Can. Geotech. J. 31, 521–532. doi:10.1139/t94-061
Gallage, C. P. K., and Uchimura, T. (2010). Effects of Dry Density and Grain Size Distribution on Soil-Water Characteristic Curves of sandy Soils. Soils and Foundations 50, 161–172. doi:10.3208/sandf.50.161
Gardner, W. R. (1957). Some Steady–State Solutions of the Unsaturated Moisture Flow Equation with Application to Evapotranspiration from a Water Table. Soil Sci. 85, 228–232.
Han, Z., Vanapalli, S. K., and Zou, W.-l. (2017). Integrated Approaches for Predicting Soil-Water Characteristic Curve and Resilient Modulus of Compacted fine-grained Subgrade Soils. Can. Geotech. J. 54, 646–663. doi:10.1139/cgj-2016-0349
He, K., and Ye, J. (2021). Physical Modeling of the Dynamics of a Revetment Breakwater Built on Reclaimed Coral Calcareous Sand Foundation in the South China Sea-Tsunami Wave. Bull. Eng. Geol. Environ. 80, 3315–3330. doi:10.1007/s10064-021-02122-8
Houston, S., Houston, W., and Wagner, A. (1994). Laboratory Filter Paper Suction Measurements. Geotech. Test. J. 17, 185–194.
Hu, M. J., Zhang, C. Y., Cui, X., Li, K. Y., and Tang, J. J. (2019). Experimental Study on Capillary Rise and Influencing Factors in Calcareous Sand. Rock Soil Mech. 40, 4157–4164. doi:10.16285/j.rsm.2018.1473
Jiang, X., Wu, L., and Wei, Y. (2020). Influence of Fine Content on the Soil-Water Characteristic Curve of Unsaturated Soils. Geotech. Geol. Eng. 38, 1371–1378. doi:10.1007/s10706-019-01096-5
Kawai, K., Kato, S., and Karube, D. (2000). “The Model of Water Retention Curve Considering Effect of Void Ratio,” in Proceedings of the Asian Conference on Unsaturated Soils, 329–334.
Li, S. Q., Jia, H. J., Wang, X. X., and Cui, C. (2016). Limitation and Error Analysis of axis Translation Technique for Measuring and Controlling Matric Suction. Rock Soil Mech. 37, 3089–3095. doi:10.16285/j.rsm.2016.11.007
Li, Y. J., Guo, Z., Wang, L. Z., Ye, Z., Shen, C. F., and Zhou, W. J. (2021). Interface Shear Behavior between MICP–Treated Calcareous Sand and Steel. J. Mater. Civil Eng. 33, 04020455. doi:10.1061/(asce)mt.1943-5533.0003549
Ma, T. T., Wei, C. F., Chen, P., and Xia, X. L. (2015). An Experimental Study of Effect of NaCl Solution on Soil Water Characteristics. Rock Soil Mech. 36, 2831–2836. doi:10.16285/j.rsm.2015.10.012
Ng, C. W., and Pang, Y. W. (2000). Experimental Investigations of the Soil-Water Characteristics of a Volcanic Soil. Can. Geotech. J. 37, 1252–1264. doi:10.1139/t00-056
Nurul, Z., Mohd, Y. N. Z., Mohammed, A. B. M. A., Aminaton, M., Hamonangan, H. I. S., and Safuan, A. R. A. (2019). Measuring the Engineering Properties of marine clay Treated with Disposed Granite Waste. Measurement 131, 50–60.
Pasha, A. Y., Khoshghalb, A., and Khalili, N. (2015). “Common Mistakes in Determination of Air Entry Value from Gravimetric Water Content Based Soil-Water Characteristic Curve,” in Proceeding of the 6th Asia-Pacific Conference on Unsaturated Soils, Guilin, China, October 23–26.
Pham, Q. H. (2005). A Volume–Mass Constitutive Model for Unsaturated Soils. Phd thesis (Saskatoon:University of Saskatchewan).
Rao, B. H., and Singh, D. N. (2010). Establishing Soil-Water Characteristic Curve of a fine-grained Soil from Electrical Measurements. J. Geotech. Geoenviron. Eng. 136, 751–754. doi:10.1061/(asce)gt.1943-5606.0000267
Shen, J. H., Wang, X., Liu, W. B., Zhang, P. Y., Zhu, C. Q., and Wang, X. Z. (2020a). Experimental Study on Mesoscopic Shear Behavior of Calcareous Sand Material with Digital Imaging Approach. Adv. Civ. Eng. 2020, 8881264. doi:10.1155/2020/8881264
Shen, J., Wu, H., and Zhang, Y. (2017). Subsidence Estimation of Breakwater Built on Loosely Deposited sandy Seabed Foundation: Elastic Model or Elasto-Plastic Model. Int. J. Naval Architecture Ocean Eng. 9, 418–428. doi:10.1016/j.ijnaoe.2016.11.006
Shen, J., Xu, D., Liu, Z., and Wei, H. (2020b). Effect of Particle Characteristics Stress on the Mechanical Properties of Cement Mortar with Coral Sand. Construction Building Mater. 260, 119836. doi:10.1016/j.conbuildmat.2020.119836
SL237–2019 (2019). Specification of Soil Test. National standard of the People’s Republic of China. (in Chinese).
Song, Y.-S. (2014). Suction Stress in Unsaturated Sand at Different Relative Densities. Eng. Geology. 176, 1–10. doi:10.1016/j.enggeo.2014.04.002
Stange, C. F., and Horn, R. (2005). Modeling the Soil Water Retention Curve for Conditions of Variable Porosity. Vadose Zone J. 4, 602–613. doi:10.2136/vzj2004.0150
Tao, G., Chen, Y., Kong, L., Xiao, H., Chen, Q., and Xia, Y. (2018). A Simple Fractal-Based Model for Soil-Water Characteristic Curves Incorporating Effects of Initial Void Ratios. Energies 11, 1419. doi:10.3390/en11061419
Van Genutchen, M. T. (1980). A Close-form Equation for Predicting the Hydraulic Conductivity of Unsaturated Soils. Soil Sci. Soc. Am. J. 44, 892–898.
Vanapalli, S. K., Fredlund, D. G., and Pufahl, D. E. (2001). Influence of Soil Structure and Stress History on the Soil-Water Characteristics of a Compacted till. Géotechnique 51, 573–576. doi:10.1680/geot.51.6.573.40456
Wang, X., Cui, J., Wu, Y., Zhu, C., and Wang, X. (2020c). Mechanical Properties of Calcareous Silts in a Hydraulic Fill Island-Reef. Mar. Georesources Geotechnology 39, 1–14. doi:10.1080/1064119X.2020.1748775
Wang, X., Cui, J., Zhu, C.-Q., Wu, Y., and Wang, X.-Z. (2021). Experimental Study of the Mechanical Behavior of Calcareous Sand under Repeated Loading-Unloading. Bull. Eng. Geol. Environ. 80, 3097–3113. doi:10.1007/s10064-021-02119-3
Wang, X., Wang, X.-Z., Zhu, C.-Q., and Meng, Q.-S. (2019b). Shear Tests of Interfaces between Calcareous Sand and Steel. Mar. Georesources Geotechnology 37, 1095–1104. doi:10.1080/1064119x.2018.1529845
Wang, X., Wu, Y., Cui, J., Zhu, C.-Q., and Wang, X.-Z. (2020b). Shape Characteristics of Coral Sand from the South China Sea. Jmse 8, 803. doi:10.3390/jmse8100803
Wang, X., Zhu, C.-Q., and Wang, X.-Z. (2020a). Experimental Study on the Coefficient of Lateral Pressure at Rest for Calcareous Soils. Mar. Georesources Geotechnology 38, 989–1001. doi:10.1080/1064119x.2019.1646361
Wang, X., Zhu, C.-Q., Wang, X.-Z., and Qin, Y. (2019a). Study of Dilatancy Behaviors of Calcareous Soils in a Triaxial Test. Mar. Georesources Geotechnology 37, 1057–1070. doi:10.1080/1064119x.2018.1526236
Wei, H. Z., Zhao, T., Meng, Q. S., Wang, X. Z., and Zhang, B. (2019). Quantifying the Morphology of Calcareous Sands by Dynamic Image Analysis. Int. J. Geomech. 20, 04020020.
Willams, J., Preeble, R. E., and Williams, W. T. (1983). The Influence of Texture, Structure and clay Mineralogy on the Soil Moisture Characteristics. Aust. J. Soil Res. 21, 15–32.
Wu, Y., Wang, X., Shen, J.-H., Cui, J., Zhu, C.-Q., and Wang, X.-Z. (2020). Experimental Study on the Impact of Water Content on the Strength Parameters of Coral Gravelly Sand. Jmse 8, 634. doi:10.3390/jmse8090634
Xiao, P., Liu, H. L., Xiao, Y., Stuedlein, A. W., and Matthew Evans, T. (2019). Liquefaction Resistance of Bio–Cemented Calcareous Sand. Soil Dyn. Earthq. Eng. 107, 9–19.
Xiao, Y., Liu, H., Chen, Q., Ma, Q., Xiang, Y., and Zheng, Y. (2017). Particle Breakage and Deformation of Carbonate Sands with Wide Range of Densities during Compression Loading Process. Acta Geotech. 12, 1177–1184. doi:10.1007/s11440-017-0580-y
Ye, J., Zhang, Z., and Shan, J. (2019). Statistics-based Method for Determination of Drag Coefficient for Nonlinear Porous Flow in Calcareous Sand Soil. Bull. Eng. Geol. Environ. 78, 3663–3670. doi:10.1007/s10064-018-1330-6
Yu, D., Ye, J., and Yao, L. (2020). Prediction of the Long-Term Settlement of the Structures Built on a Reclaimed Coral Reef Island: an Aircraft Runway. Bull. Eng. Geol. Environ. 79, 4549–4564. doi:10.1007/s10064-020-01866-z
Zhong, F. J. (2007). Research on Pressure Characteristics of Gas Reservoir and Mechanical Effect of Stress Path for Shallow Gassy Sand. Master's thesis (Wuhan: Institute of Rock and Soil Mechanics, Chinese Academy of Sciences, 2007). (in Chinese).
Zhou, A.-N., Sheng, D., and Carter, J. P. (2012). Modelling the Effect of Initial Density on Soil-Water Characteristic Curves. Géotechnique 62, 669–680. doi:10.1680/geot.10.p.120
Zhou, A.-N., Sheng, D., and Li, J. (2014). Modelling Water Retention and Volume Change Behaviours of Unsaturated Soils in Non-isothermal Conditions. Comput. Geotechnics 55, 1–13. doi:10.1016/j.compgeo.2013.07.011
Keywords: coral reef, calcareous silty sand, fines content, dry density, soil-water characteristic curve
Citation: Shen J-H, Hu M-J, Wang X, Zhang C-Y and Xu D-S (2021) SWCC of Calcareous Silty Sand Under Different Fines Contents and dry Densities. Front. Environ. Sci. 9:682907. doi: 10.3389/fenvs.2021.682907
Received: 19 March 2021; Accepted: 16 July 2021;
Published: 26 July 2021.
Edited by:
Yuncong Li, University of Florida, United StatesReviewed by:
Tao Zhao, Brunel University London, United KingdomLi Sa, Tianjin University, China
Pooya Saffari, Qingdao Technological University Qindao College, China
Copyright © 2021 Shen, Hu, Wang, Zhang and Xu. This is an open-access article distributed under the terms of the Creative Commons Attribution License (CC BY). The use, distribution or reproduction in other forums is permitted, provided the original author(s) and the copyright owner(s) are credited and that the original publication in this journal is cited, in accordance with accepted academic practice. No use, distribution or reproduction is permitted which does not comply with these terms.
*Correspondence: Ming-Jian Hu, mjhu@whrsm.ac.cn; Xing Wang, wangxing1213@hotmail.com