Prokaryotic Community Composition and Extracellular Polymeric Substances Affect Soil Microaggregation in Carbonate Containing Semiarid Grasslands
 Jeroen H. T. Zethof1*†
  Antje Bettermann2*†
  Cordula Vogel1
  Doreen Babin2
  Erik L. H. Cammeraat3
  Albert Solé-Benet4
  Roberto Lázaro4 Lourdes Luna4
  Joseph Nesme5
  Susanne K. Woche6
  Søren J. Sørensen5
  Kornelia Smalla2 Karsten Kalbitz1
- 1Institute of Soil Science and Site Ecology, Technische Universität Dresden, Tharandt, Germany
- 2Federal Research Centre for Cultivated Plants, Institute for Epidemiology and Pathogen Diagnostics, Julius Kühn-Institut, Braunschweig, Germany
- 3Institute for Biodiversity and Ecosystem Dynamics, University of Amsterdam, Amsterdam, Netherlands
- 4Estación Experimental de Zonas Áridas (EEZA-CSIC), Almería, Spain
- 5Section of Microbiology, Department of Biology, University of Copenhagen, Copenhagen, Denmark
- 6Institute of Soil Science, Leibniz Universität Hannover, Hanover, Germany
In the barren semiarid landscape individual plant species improve soil structure, reducing the erosion risks, whereby microaggregates form the most fundamental soil structural components. Extracellular polymeric substances (EPS) are considered an important glue determining aggregation in addition to inorganic binding agents such as carbonates. However, the role of the prokaryotic community in EPS formation and consequently for microaggregation in natural environments is not substantially clarified yet. EPS should be particularly important under semiarid conditions as it forms a protection mechanism of the prokaryotes against desiccation. Therefore, we examined the influence of the prokaryotic community on soil EPS content and subsequently on soil microaggregation in semiarid grasslands, depending on the parent material, common plant species and the distance to the plant. Soil samples were taken over a distance gradient from two major semiarid grassland plant species in Southern Spain, the legume shrub Anthyllis cytisoides and the grass tussock Macrochloa tenacissima, to the surrounding bare soil at two sites, rich and poor in carbonates. Total community DNA and EPS were extracted, followed by quantification of EPS-saccharide, bacterial abundance and examination of the prokaryotic community composition. Further, the particle size distribution of the microaggregate fraction was determined as an indication of microaggregation. We found that the overall prokaryotic community composition differed between the two sites, but not between plant species. Nonetheless, a link between the community composition and EPS content was established, whereby soil organic matter (OM) seems to be a regulating factor as increasing soil OM contents resulted in more EPS-saccharide. Furthermore, microaggregation was enhanced by the canopy, especially at the edge of Macrochloa tussocks. Contrary to the expectation that increasing inorganic C contents would diminish importance of EPS, the parent material richest in inorganic C resulted in a significant effect of EPS-saccharide contents on microaggregation according to the structural equation model. For the inorganic C poor site, EPS-saccharide had no observed direct effect on microaggregation. Based on our results we conclude that the availability of decomposable OM influences the prokaryotic community composition and thereby triggers EPS production whereas large contents of polyvalent cations promote the stabilizing effect of EPS on microaggregates.
Introduction
Under semiarid climates, increasing aridity results in a lower vegetation cover, while seasonal precipitation still provides a large potential for soil erosion, culminating in very vulnerable soil systems (Morgan, 2005; Peña-Angulo et al., 2019). For soil erosion, induced by raindrop impact and overland flow, soil structural strength in the upper cm of the soil profile plays a major role (Boix-Fayos et al., 2001; Cantón et al., 2009). Plant roots and aboveground biomass have previously been described to improve overall soil structural strength by e.g., adding organic substances to the soil and providing additional surface roughness (Gyssels et al., 2005). As organic inputs and vegetation cover are limited under semiarid climate conditions, the relevance of soil microorganisms for soil structure becomes more important. Several soil prokaryotic strains, both bacterial and archaeal, are known to produce and live in biofilms, consisting of extracellular polymeric substances (EPS) (Flemming and Wuertz, 2019). EPS produced by prokaryotes are primarily composed of polysaccharides, structural proteins, enzymes and other biopolymers like nucleic acids (Flemming et al., 2016). Although EPS are known to adsorb to mineral surfaces and create bridges between mineral surfaces, the potential role in soil structure formation in natural systems has received only little attention (Chenu and Cosentino, 2011; Blankinship et al., 2016; Lehmann et al., 2017; Costa et al., 2018).
In southeast Spain, the most arid part of Europe, vegetation is dominated by a patterned or two-phase mosaic vegetation distribution as a result of limited water availability to the plant, leading to a heterogeneous soil formation (Cammeraat and Imeson, 1999; Puigdefábregas et al., 1999). The vegetation is dominated by perennial grass species and woody shrub species (Valentin et al., 1999). Especially the grass species Macrochloa tenacissima (L) Kunth, also known under its basionym Stipa tenacissima L, is widely distributed in the western Mediterranean basin. The stem of Macrochloa grows in compact cluster structures (i.e., tussocks) with a dense shallow root matrix (∼20 cm deep) able to capture overland flow, which increases the total water and nutrient availability per tussock (Bochet et al., 1999, 2000; Maestre et al., 2002; Rodríguez-Caballero et al., 2018). Especially at the canopy edge, highest potential infiltration rates have been observed (Maestre et al., 2002; Cammeraat et al., 2010). In the dryland ecosystem of this region, woody shrub species grow I or Y shaped. This growth form gives soils only limited mechanical protection against overland flow (Bochet et al., 1998, 2000), but these plants still stabilize their surrounding soil via root/litter input and thereby increase the soil infiltrability (Bochet et al., 1999). In addition, legume shrubs, like Anthyllis cytisoides L, can form an important source of nutrients in these dryland ecosystems by their symbiosis with N-fixing bacteria (Requena et al., 2001). The root system of Anthyllis cytisoides consists of a deep tap root and superficial lateral roots spreading under the shrub canopy (Bochet et al., 1999). The spatial differentiation in nutrient availability for microorganisms, induced by the sparse vegetation cover, together with microclimatic conditions under the plant canopies shape the composition of microbial communities in soils (Goberna et al., 2007; Fierer, 2017; Tecon and Or, 2017).
Soil structural strength is widely studied by addressing the stability of soil aggregates. According to the hierarchical aggregate model, first postulated by Tisdall and Oades (1982), binding agents vary with the size of aggregates (Six et al., 2004). Thereby it is often stated that the smaller the aggregates, the larger becomes the importance of inorganic binding agents and coatings from organic residues (Tisdall, 1996; Six et al., 2004; Totsche et al., 2018). Macroaggregates (>250 μm) are mainly held together by organic matter (OM), originating from plants, and fungal hyphae. This relatively fresh OM is decomposed and processed by microbes, until, triggered by external forces, the macroaggregates disrupt and release microaggregates (<250 μm) and primary particles (Six et al., 2000). Microaggregates consist on the one hand of microbial products and remnants of OM, and on the other hand of inorganic binding agents, like carbonates or clay minerals. Thus the soil microbiome is important for soil aggregation on different scales: fungi are more involved in macroaggregate formation by enmeshing particles in their hyphae, while prokaryotes are more important for microaggregate formation via the release of EPS for biofilm formation (Chenu and Cosentino, 2011). Flemming and Wuertz (2019) estimated that about 80% of soil prokaryotes live in biofilms. Furthermore, the nature of the binding factors plays an important role in the overall aggregate stability strength, since hydrophobic rather than hydrophilic components of OM improve aggregate stability (Piccolo and Mbagwu, 1999; Chenu and Cosentino, 2011; Kraemer et al., 2019). By the properties of the bonds between the units of an aggregate, it can be assumed that with decreasing diameter of the aggregates, the stability increases. Therefore, microaggregates tend to be more stable than macroaggregates (Tisdall, 1996; Six et al., 2000). Consequently, the microaggregates form a fundamental part of the overall soil structure and therefore are an important component to assess vulnerability for erosion. However, what determines their stability is much less studied and understood in comparison to macroaggregates (Totsche et al., 2018).
Mineral composition of the soil controlled by the parent material, has an important impact on soil aggregation and the microbial community assemblage, and how it responds to OM inputs by e.g., promoting or inhibiting growth of particular microbial taxa (Babin et al., 2014). For instance, carbonates affect soil pH and have therefore distinct effects on the soil microbiome (Fierer, 2017). From a microbial perspective the soil forms a highly diverse habitat with different pore sizes, determining the distribution of water, nutrient availability and oxygenic conditions (Ebrahimi and Or, 2015). Especially under arid climates, microbial processes appear to be limited by diffusion and a limited supply of resources, as prevailing low water potentials disconnect microbes from nutrient sources (Schimel, 2018). To increase endurance, it is assumed that prokaryotes produce EPS to build themselves a robust microenvironment (Schimel, 2018; Nunan et al., 2020). EPS can adsorb to mineral surfaces and form bridges between them. Saccharides, as an important component of EPS, are widely hypothesized to increase soil aggregate formation and stability (Chenu and Cosentino, 2011; Sandhya and Ali, 2015; Costa et al., 2018). Additionally, several prokaryotic taxa have previously been associated with stable microaggregates, hinting on a direct influence of certain prokaryotic strains on microaggregation (Caesar-TonThat et al., 2007; Davinic et al., 2012). Nevertheless, most evidence on the influence of EPS on soil aggregation is based on inoculating EPS producing microorganisms under natural or greenhouse conditions (Costa et al., 2018), while a direct link between prokaryotic EPS-producers, EPS content and soil aggregation has hardly been made in natural terrestrial ecosystem.
In this study, we examined the spatial influence of Anthyllis cytisoides and Macrochloa tenacissima on the prokaryotic community composition, EPS content and microaggregate stability. Soil samples were taken over a distance gradient from the plants on two sites that had contrasting parent materials, i.e. rich and poor in carbonates. We hypothesized that (1) the prokaryotic community composition will be shaped by plant species and the parent material, with a larger plant influence closer to the stem, where canopy and root density as well as exudation is highest; (2) the prokaryotic community drives EPS-saccharide contents depending on parent material and plant species and (3) EPS-saccharide increases the stability of microaggregates. We expect that the relative contribution of EPS on microaggregation will be less important at the site with high concentration of carbonates due to their binding agent capacities.
Materials and Methods
Site Description
In the Almería province, southeastern Spain, two sites were selected based on their exposition, steepness, vegetation cover and the dominance of both Macrochloa tenacissima and Anthyllis cytisoides plant species. The Alboloduy site (37°4′9″ N, 2°36′43″ W, Figure 1), further on referred to as AB, is located west of the Tabernas basin, at the eastern end of the Sierra Nevada. The site has a southeast to south exposition and an overall slope gradient of 10–17°. The soil is developed on mica-schist, dominated by feldspar and chlorites, which contains carbonates from weathering and dust deposition. It is classified as Skeletic Leptosol according to the World Reference Base for Soil Resources [WRB] (2014). The Rambla Honda site (37°7′45″ N, 2°22′30″ W, Figure 1), further on referred to as RH, is located north of the Tabernas basin, on the Southern slope of the Sierra de los Filabres mountain range, developed on mica-schist with graphite and garnets crossed by many quartz veins (Puigdefábregas et al., 1996). The site has an east to southeast exposition and an overall slope gradient of 19–24°. The carbonate content of the site is low and originates mainly from dust deposition (IC, Table 1). According to the IUSS Working Group World Reference Base for Soil Resources [WRB] (2014), the soil in the RH study site can be classified as Skeletic Leptosol (colluvic). Both sites are influenced by dust deposition originating from local sources, i.e., marly Miocene sediments, but also from North Africa as showed qualitatively by Queralt-Mitjans et al. (1993). The climate in the area is semiarid Mediterranean with a dry period from May until September and an average annual temperature of 17.8°C in Tabernas. The annual precipitation of almost 300 mm falls mainly in autumn and winter and high intensity storms are less frequent than in other Mediterranean more mesic areas (Lazaro et al., 2001). However, during the first three months of the year 2017, about 72.8 mm of precipitation was measured at the Fiñana weather station and 71.2 mm at the Tabernas weather station, of which 60%, respectively 74%, fell during a two-day event, two weeks prior to the sampling campaign. Daily weather records are freely available from the regional government of Andalucía (last accessed March 1st, 2020)1.
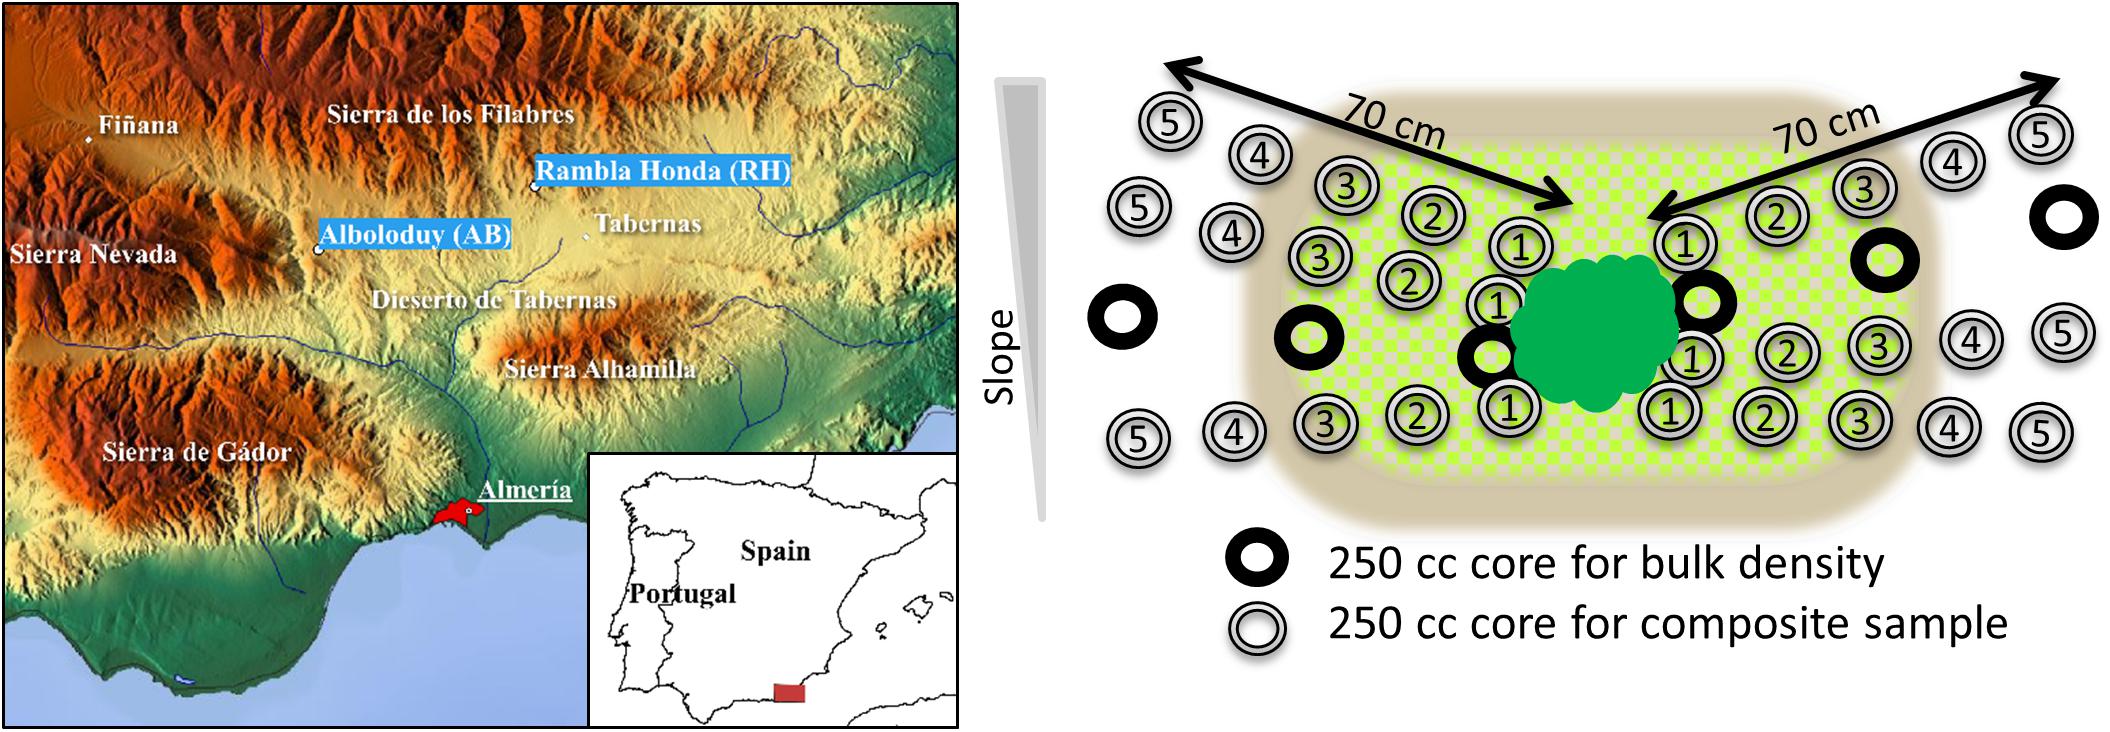
Figure 1. Location of the study area, sample sites Alboloduy and Rambla Honda and the weather stations Finana and Tabernas (left). Sampling design, i.e., butterfly approach, whereby 250 cm3 cores were placed as close as possible to the stem (dark green) and cores with the same numbers were combined in a composite sample. Numbers stand for the distance from the center of the core to the stem, i.e., 4 (1), 19.5 (2), 35 (3), 50.5 (4), and 66 (5) cm. Average canopy diameter is indicated with light green (blocked pattern) for Anthyllis and brown for Macrochloa.
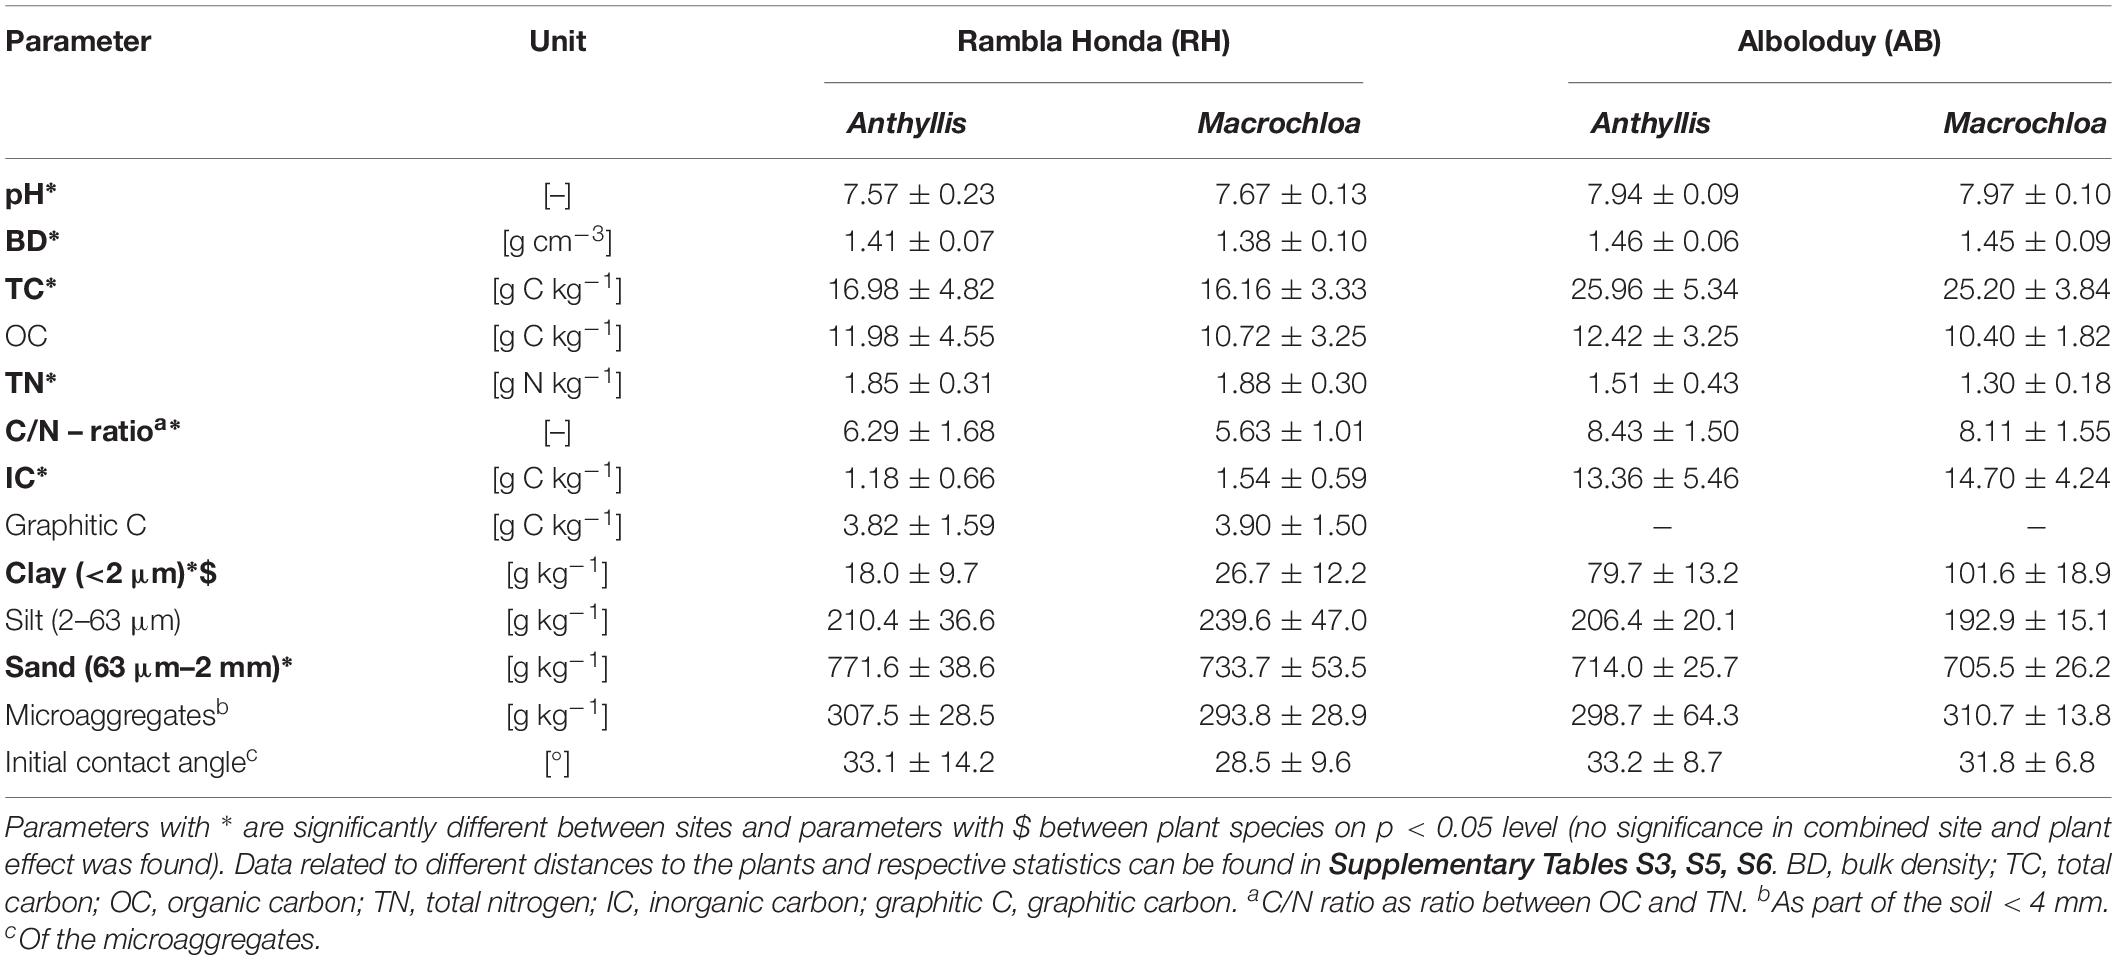
Table 1. Mean and standard deviation of the soil properties of the two studied sites (n = 5).
Sampling
During the sampling campaign in April 2017, five mid-slope plots at each site were set out, which were hydrologically disconnected from each other. At each plot, one mature Macrochloa tussock and one Anthyllis shrub were selected independently from each other (i.e., subplots), based on similar size (for each species) and an inter canopy space of at least 1 m from neighboring perennials. As the gradient in soil properties from the plant into the bare soil is assumed to be strongest perpendicular to the slope for both species (Bochet et al., 1999), samples were taken according to a so-called “Butterfly scheme” (Figure 1). Plants and undergrowth were first clipped to make sampling under the canopy possible. Six 250 cm3 cores, height 5 cm and diameter 8 cm, were placed directly at the stem (sampling point 4 cm), after removing loose (organic) material from the soil surface. The six core samples from the same distance to the stem were gently mixed to create a composite sample. This was repeated at 19.5, 35, 50.5, and 66 cm distance from the stem, resulting in five sampled distances. After analysis of carbon, nitrogen, pH and EPS-saccharide content, no distinct plant effect was found over the 5 distances (see for instance Figure 2). Hence, focus was put on three distances, namely 4, 35, and 66 cm (see section “Effects of Parent Material, Plant Species and Distance to the Plant on General Soil Properties”). These three distances can be described as: at the plant stem, canopy edge and bare inter canopy space, respectively. Two additional cores at 4, 35, and 66 cm were sampled for bulk density determination. As from every plot one specimen per plant species was sampled, five independent field replicates of each composite sample were available. Parts of the composite soil sample were stored in plastic boxes, whereby coarse gravel (>4 mm) and stones were removed to protect the fragile soil aggregates against mechanical disturbance. Another part was sieved to <2 mm in the field, which was partly first stored at 4°C for practical reasons of transportation and later frozen to -20°C until DNA and EPS extraction. The remaining part of the sieved soil samples (<2 mm), dedicated to measure texture, carbon and pH, was air-dried at 40°C for 5 days and stored at ambient temperatures.
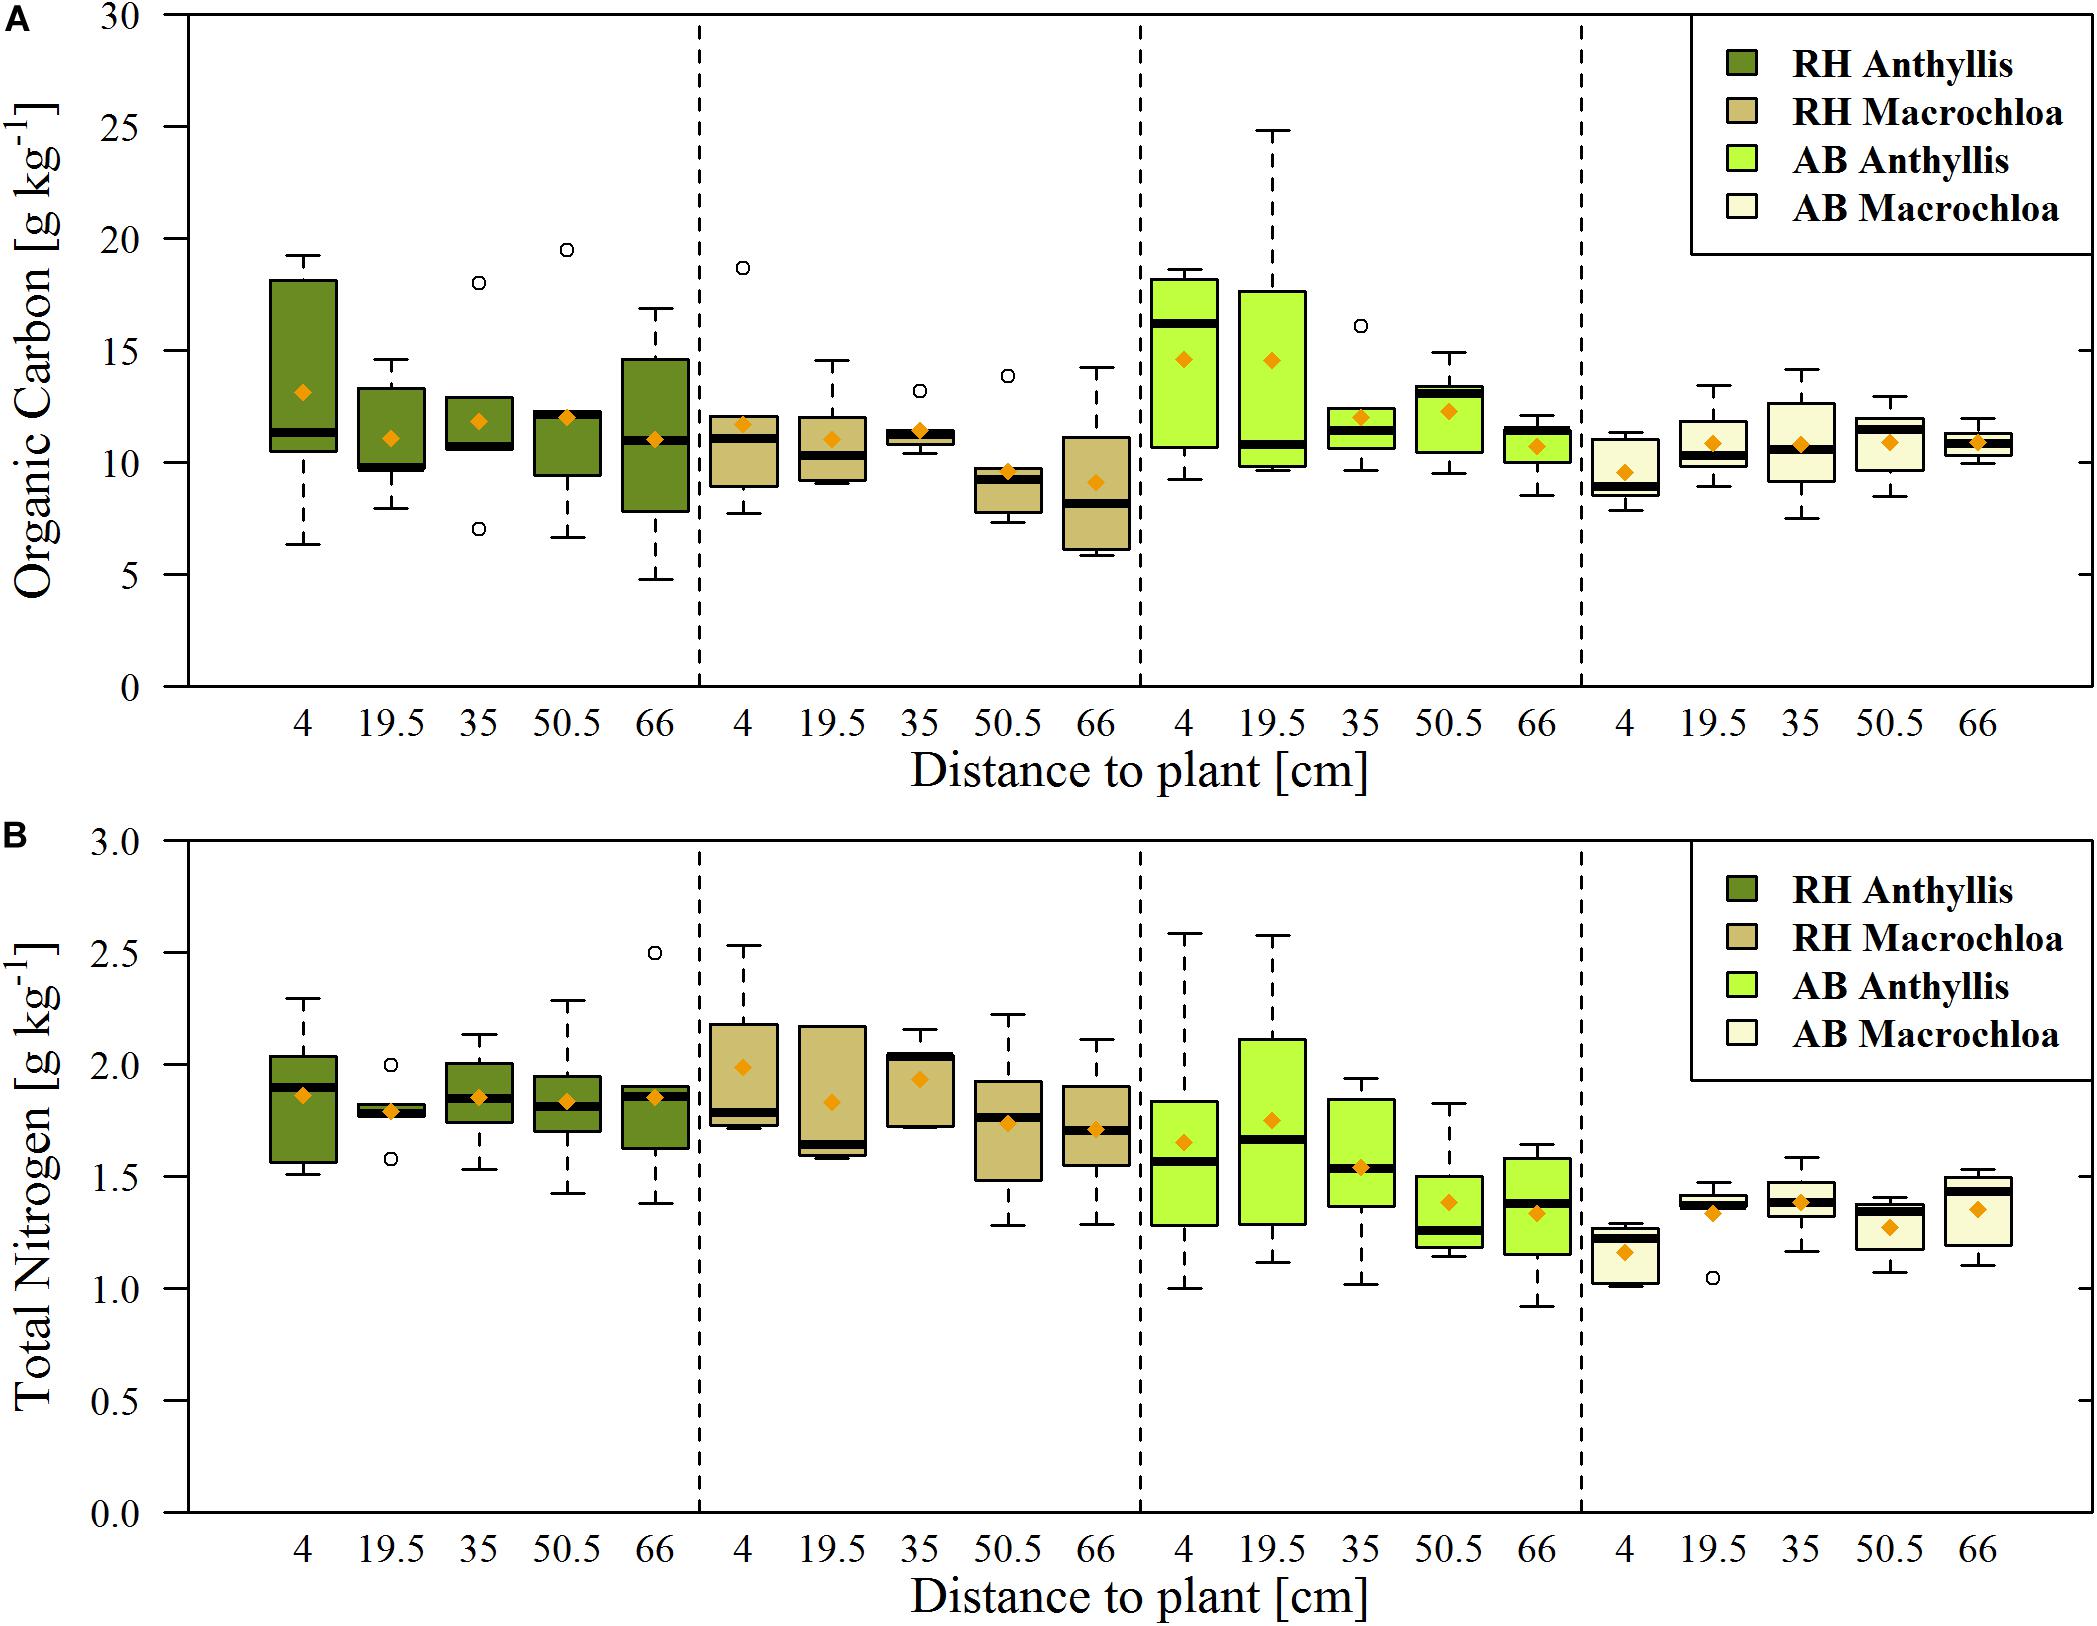
Figure 2. Organic carbon (A) and total nitrogen (B) content of the soil samples from Alboloduy (AB) and Rambla Honda (RH). Box-and-whisker diagrams showing the median (black line), 25th/75th percentile (resp. upper/lower part box), min./max. (whiskers) and mean values (orange dot), with 5 replicates per box.
Analysis
The pH and electrical conductivity (EC) were determined in 1:2.5 soil-to-water ratio extract, which was shaken for 2 h, left overnight in air-closed tubes and centrifuged prior to measurement. Inorganic carbon was determined by measuring total carbon (TC) before and after acid treatment with excess of HCl, i.e., inorganic C = TCbefore – TCafter, using an elemental CN analyzer (Vario EL, Elementar, Langenselbold, Germany). The same device was used to measure total N. The samples from the RH site contained graphitic C, which was measured by smart combustion method (Zethof et al., 2019) using the soli-TOC cube (Elementar, Langenselbold, Germany). Graphitic C was used to estimate the non-geogenic organic C. In summary: organic C = (TC-inorganic C) – graphitic C. Texture was determined after oxidizing the organic material with H2O2 and removal of carbonates using HCl, after which samples were wet sieved <63 μm and the silt/clay fraction further quantified by a Sedimat 4-12 (UGT, Müncheberg, Germany).
Extraction and Purification of Total Community DNA
Total community DNA extraction from 0.5 g (wet weight) of every soil sample was done using the FastDNA®SPIN Kit for Soil (MP Biomedicals, Santa Ana, CA, United States) followed by purification with the GENECLEAN®SPIN Kit (MP Biomedicals, Santa Ana, CA, United States) according to the instructions of the manufacturers. For cell lysis, a FastPrepTM FP120 (Qbiogene, Inc., Carlsbad, CA, United States) bead-beating system was used, performing two cycles of bead-beating (30 s at 5.5 m s–1). Quality of total community DNA was assessed by gel electrophoresis (0.8% agarose), stained afterward with ethidium bromide (0.005%) and photographed under UV-light (Intas Gel Jet Imager 2004, Intas, Göttingen, Germany).
Quantification of Bacterial 16S rRNA Gene Fragments by Quantitative Real-Time PCR (qPCR)
16S rRNA gene copy numbers were determined by qPCR with primers and TaqMan probe specific for the domain Bacteria as described by Suzuki et al. (2000). The qPCR was performed in a CFX96 Real-Time System (Biorad, München, Germany) with a reaction volume of 50 μl. PCR conditions were described by Vogel et al. (2014). Log10 rrn gene copy numbers were calculated per soil dry weight.
Illumina Sequencing of Bacterial and Archaeal 16S rRNA Gene Amplicons
Sequencing libraries were prepared using a dual-PCR setup, targeting variable regions V3 and V4 of the 16S rRNA gene, ∼460 bp. In the first step, primers Uni341F (5′-CCTAYGGGRBGCASCAG-3′) and Uni806R (5′-GGACTACHVGGGTWTCTAAT-3′) for amplification of both archaeal and bacterial 16S rRNA genes, originally published by Yu et al. (2005) and modified as described in Caporaso et al. (2011) and Sundberg et al. (2013), were used. In a second PCR reaction step, the primers additionally included Illumina specific sequencing adapters and a unique combination of index for each sample (Nunes et al., 2016). PCR reactions were performed in a 25 μl volume using NEB HotStart Taq polymerase (New England Biolabs, Frankfurt, Germany) and 2 μl template DNA, following manufacturer’s instructions and the following program: 95°C for 1 min followed by 30 or 15 cycles (for, respectively, PCR1 or PCR2) of 95°C for 15 s; 56°C for 15 s and 72°C for 30 s. After both PCR reactions, amplicon products were purified using HighPrepTM PCR Clean Up System (AC-60500, MagBio Genomics Inc., Gaithersburg, MD, United States) using a 0.65:1 (beads per PCR reaction) volumetric ratio to remove DNA fragments below 100 bp in size. Samples were normalized using SequalPrep Normalization Plate (96) Kit (Invitrogen, MD, United States) and pooled using 5 μl volume of each. The pooled sample libraries were concentrated using DNA Clean and ConcentratorTM-5 kit (Zymo Research, Irvine, CA, United States). The pooled library concentration was determined using the Quant-iTTM High-Sensitivity DNA Assay Kit (Life Technologies). Before library denaturation and sequencing, the final pool concentration was adjusted to 4 nM. Amplicon sequencing was performed on an Illumina MiSeq platform using Reagent Kit v2 [2 × 250 cycles] (Illumina Inc., CA, United States).
Raw sequence reads were trimmed of primer sequences used in the first PCR, discarding read pairs of which none of the two primer sequences could be detected using Cutadapt version 2.3 (Martin, 2011). Primer-trimmed sequence reads were error-corrected, merged and amplicon sequence variants (ASVs) were identified using DADA2 version 1.10.0 (Callahan et al., 2016) within QIIME2 (Bolyen et al., 2019) with the following parameters and otherwise default values: –p-trim-left-f 5 –p-trim-left-r 5 –p-trunc-len-f 0 –p-trunc-len-r 0. Each ASV sequence was given a taxonomic annotation using q2-feature-classifier classify-sklearn module trained with SILVA SSU NR99 rel. 132 database (Quast et al., 2013). Prior to the training of the classifier, the V3-V4 regions of the SILVA database sequences were extracted at the same primer position. Raw amplicon data were deposited at NCBI Sequence Read Archive (SRA)2 under accession number PRJNA588145.
SILVArel132 database was used for classification of representative ASVs. Sequences that were affiliated to Cyanobacteria/chloroplasts or mitochondria or were unclassified at domain level were removed from the data set, resulting in a total of 8,582 ASVs. On average, 11,043 quality-filtered sequences were obtained per sample.
EPS Extraction and Quantification
EPS were extracted following the protocol of Redmile-Gordon et al. (2014), using 1 g cation-exchange resin (Sigma-Aldrich/DOWEX, PN 91973) per 2.5 g soil material (dry weight equivalent). Moisture content, for reference to dry weight equivalent, was determined by drying part of the soil sample at 105°C for 24 h. Total saccharide content (EPS-saccharide) from extracted EPS was quantified after Dubois et al. (1956) using D(+)-Glucose (Roth, PN X997) as a standard. Furthermore, total dissolved carbon (TDC) and nitrogen (TDN) was determined after filtration through a 0.45 μm syringe filter (PET-45/25 Chromafil, Macherey-Nagel, Düren, Germany) using a Vario TOC cube (Elementar, Langenselbold, Germany).
Soil Aggregation
The dried samples for soil aggregation analysis were sieved on a sieve shaker (Retsch AS 200, Haan, Germany) to obtain the microaggregate fraction (<0.25 mm). The particle size distribution of the microaggregate fraction was obtained by a laser diffraction particle size scanner (Beckmann Coulter LS 200, Brea, United States) and used to calculate the Mean Weight Diameter (MWD). By directly adding deionized water to the soil in a soil-to-water mixture of 1:20, an adaptation of the fast-wetting method from Le Bissonnais (1996) was applied. The fast-wetting method was chosen as it represents the disruptive effect of heavy rainstorms on soils. Additional disruptive forces (e.g., from particle size scanner) were accounted for and kept the same between measurements. The soil-water suspension was pipetted into the device until the right obscuration (∼10%) was reached. As an additional measure for aggregate stability, a fresh soil-to-water mixture of 1:20 was treated with 200 J ml–1 using an ultrasonic homogenizer fitted with a KE76 tip for 110 s (UW3200 Sonoplus, Bandelin, Berlin, Germany). As the tip of the ultrasonic homogenizer was inserted 15 mm into the liquid, calibrated output was 37.1 W, while the device was set to 70 W. The applied energy level was chosen based on pretests revealing that minimum MWDs were reached after 200 J ml–1 (Supplementary Figure S1). Additionally, the contact angle as a measure for particle wetting properties was determined for the microaggregate fraction with the sessile drop method of Bachmann et al. (2013) using a charge-coupled device (CCD)-equipped contact angle microscope (OCA 15, DataPhysics, Filderstadt, Germany). After ending of mechanical perturbances, the contact angle was evaluated by drop shape analysis (ellipsoidal fit) and fitting of tangents on both sides of the drop with the software SCA 20 (DataPhysics, Filderstadt, Germany). Contact angle is given as the mean of the left and right side. Per sample, six drops were set (12 readings, n = 6). The drop volume was 1 μl.
Data Analysis and Statistics
Due to the hierarchical sampling design, i.e., distant samples are nested in subplot, the assumptions of independency and homogeneity of variance are violated, impeding parametric statistical significance tests. To account for this, we used linear mixed effect modeling, whereby effects of sites, plants, distance to the plants and their interactions on the individual soil parameters were analyzed following the protocol of Zuur et al. (2009). The software R (R Core Team, 2018) and nlme package of Pinheiro et al. (2018) were used for this purpose. The two sites, plant species and distances to the plants were taken as fixed effects. As data are nested over the sampling subplots, a random intercept for subplots was included. Using the likelihood ratio test, it was tested if including random slopes or multiple residual variances for sites, plant species and/or distances improved the linear mixed effect modeling significantly. Additionally, residual plots were visually inspected for any (obvious) deviations from homoscedasticity or normality to ensure that the best model, according to the likelihood ratio test, did not violate these assumptions. In the case of violation, a linear mixed effect model with lower quality indexes was taken that showed no deviations from homoscedasticity or normality. Final models were fitted using a restricted maximum-likelihood estimator and the fixed effects tested using an ANOVA. When combined fixed effects or the “distance to the plant” fixed effect showed significant differences, the different combinations were tested with lsmeans (Russell, 2016) to check which combination/distances were significantly different. Initial and final model statistics were added in Supplementary Tables S1, S2. General trends and correlations in the data were additionally checked and tested using the Linear fit function of the software OriginPro 2019 (OriginLab Corporation).
Alpha-diversity indices (Shannon, Pielou, Chao-1, richness) of the ASVs data set were calculated based on a 100 times randomly subsampled data set (n = 3933, representing the sample with the lowest reads) by use of packages in R described below. To detect genera with a significantly different relative abundance (responders), data was normalized according to edgeR developer recommendations (Robinson et al., 2010) and likelihood ratio tests under negative binominal distribution and generalized linear models were used.
To evaluate differences in the prokaryotic community composition, a Principal Coordinate Analysis (PCoA) of the ASV count data based on Bray-Curtis dissimilarity was used. Environmental parameters were added as vectors to the PCoA plot using the envfit function of vegan package in R (Oksanen et al., 2019). PERMANOVA (also based on Bray-Curtis dissimilarity, 999 permutations) was conducted to determine how changes can be explained by the respective environmental factor.
All mentioned analyses of the ASV data were carried out using R version 3.5.3 with packages vegan (Oksanen et al., 2019), multcomp (Hothorn et al., 2008), questionr (Barnier et al., 2018), agricolae (De Mendiburu, 2019), permute (Simpson, 2019), edgeR (Robinson et al., 2010), phyloseq (McMurdie and Holmes, 2013), gplots (Warnes et al., 2019), RColorBrewer (Neuwirth, 2014), and rioja (Juggins, 2017).
Structural equation modeling (SEM) was used to bring together the general soil properties, prokaryotic community composition, content of EPS-saccharide and microaggregation in a hypothetical model, to gain more insight into the complex interdependencies in soil systems (Eisenhauer et al., 2015). As the parent material proved to be the main influencing factor on the studied parameters (see section “Effects of Parent Material, Plant Species, and Distance to the Plant on General Soil Properties” and “Soil Prokaryotic Community Compositions Shaped by Parent Material, Plant Species, and Distance to the Plant”), SEM was performed on site level and plants were taken as part of the (spatial) variation. Further separation on plant species reduced the number of samples to the point that SEM outcomes were no longer reliable. For the hypothetical model, it was assumed that the prokaryotic community is mainly driven by the soil pH, carbon and total N contents. As pH was well explained by the inorganic C content on site level and as the exclusion of pH improved the models, pH was omitted from the SEM by including a direct relation between inorganic C and prokaryotic community. To create a link between the prokaryotic community composition and the environmental parameters per site, the scorings for the first PCoA axis were taken as a prokaryotic community index. Furthermore, the bacterial 16S rRNA gene copy number, as determined by qPCR, was used as a proxy for bacterial abundance. EPS-saccharide contents were assumed to be driven by the bacterial abundance, prokaryotic community composition, total N and organic C contents. The microaggregate hydrophobicity was assumed to be a result of partly organic C and partly EPS-saccharide contents. Lastly, the MWD of the microaggregate fraction was assumed to be explained by the EPS-saccharide content, its wettability, organic and inorganic C contents and by clay contents, as they are all well-known properties that induce soil aggregation. The MWD derived from the soil texture analysis was included to test and exclude a potential influence by variabilities in soil texture on the MWD of the microaggregate fraction. The hypothetical model did not fit the RH site well, as a consequence the model for the RH site had been adapted. As the parent material from the RH site provides an additional N source (see section “Effects of Parent Material, Plant Species, and Distance to the Plant on General Soil Properties”), total N was removed, which improved the model substantially (p = 0.035). Together with the inclusion of the graphitic C (important part of the bedrock in RH) in the SEM resulted in a significant model for the RH site, too. All data were standardized by calculating Z-scores with the scale function for each site. The Lavaan package was used to perform the final SEM analysis, whereby clustering per subplot was taken into account (Rosseel, 2012). The model was evaluated by several widely used measures of model fit, namely the chi-square test with a perfect model fit, the comparative fit index (CFI), the akaike information criterion (AIC) and the root mean square error of approximation (RMSEA).
In all tests we assumed a significant difference if the p-value is below the 0.05 level, with exception of SEM as here a higher p-value indicates a better model fit.
Results
Effects of Parent Material, Plant Species and Distance to the Plant on General Soil Properties
The general soil properties were significantly different between the sites, except for the organic C content (Table 1, more detailed info in Supplementary Tables S3, S4). Especially inorganic C content was significantly higher at the AB site, with 14 vs. 1.4 g C kg–1, while total N was significantly higher at the RH site, with 1.9 vs. 1.4 g N kg–1 on average. Examination of an unweathered rock sample revealed that parent material forms a source of additional N in the RH site with 0.8 g N kg–1 rock. Together with a high total N content, this resulted in a relatively low C/N ratio at the RH site (6.0 vs. 8.4 at AB). Organic C content differed more over distance to the plant than between the plant species or sites, except for Macrochloa at the AB site, whereby largest contents could be found close to the stem (Figure 2A).
The spatial variability of our data at the sampled plots was mostly larger than the influence of individual plants (Figure 2 and Supplementary Figure S2). This observation underlines the need for taking the hierarchical structure of the data into account. Therefore, we introduced a random intercept for subplots in the linear mixed effect modeling.
Overall, the clay content was low, with an average of 22 g kg–1 at RH and 91 g kg–1 at the AB site. Nevertheless, it was significantly influenced by the parent material, plant species and distance to the plant. More clay particles were found under the Macrochloa canopy closer to the plant stem (Supplementary Figure S3), indicating active movement of soil particles at both sites.
Soil Prokaryotic Community Compositions Shaped by Parent Material, Plant Species and Distance to the Plant
Bacterial 16S rRNA Gene Copy Number
The mean values of bacterial 16S rRNA gene copy numbers ranged from 8.9 to 9.4 (log10) per g dry soil (Supplementary Figure S4A). Although no significant differences between sites, sampling distances and/or plant species were found, bacterial 16S rRNA gene copy numbers tended to be lowest at the outermost sampling distance in the AB site (66 cm). Highest values were found at a distance of 35 cm from Anthyllis at RH and 35 cm from Macrochloa at AB (Supplementary Figure S4A).
Composition of Soil Prokaryotic Communities
Principal Coordinates Analysis (PCoA) of the prokaryotic community composition in relation to sampling site, plant species and distance to the plant and general soil properties revealed a clear separation according to the sampling site (Figure 3). Specifically, a significant relation between prokaryotic community (dis)similarities and pH, inorganic C, total N, clay, silt and sand content was found. Except for silt content, all these parameters were significantly different between the two sites (Supplementary Table S3), explaining the observed differentiation on site level in the PCoA.
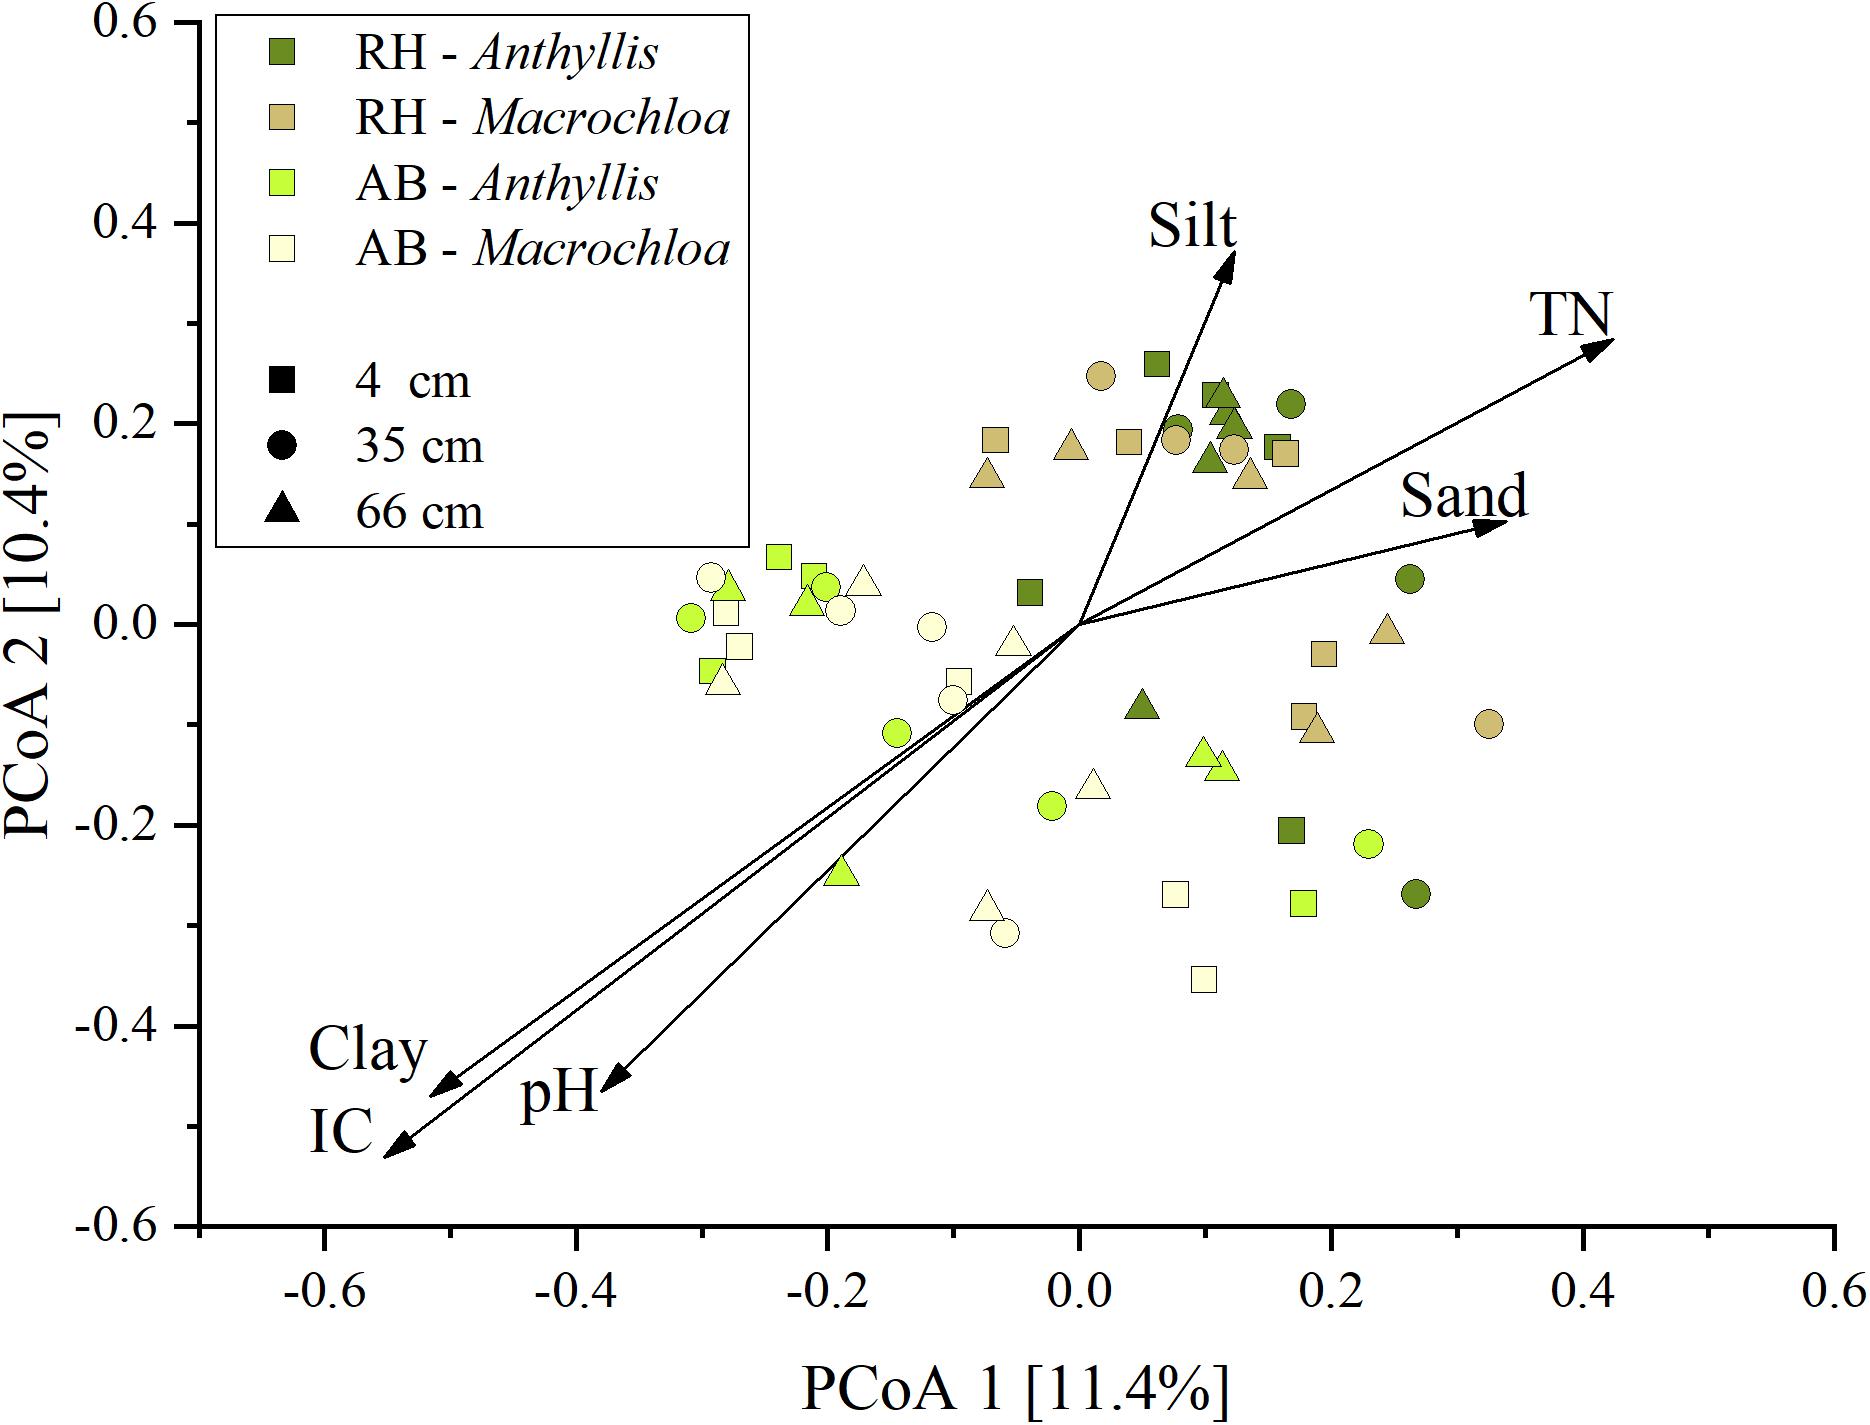
Figure 3. Principal Coordinates Analysis (PCoA) of the prokaryotic community composition based on 16S rRNA gene amplicon sequence variants (ASVs), plotted with the environmental variables that significantly (p < 0.05) influenced the community composition. Length of the arrow displays the extent of influence of the abiotic parameter on the community composition.
Alpha diversity indices (i.e., species richness, Shannon, Chao-1) were similar among all samples despite the different sampling sites, plant species or distances to the plant (Supplementary Table S5). Species evenness expressed by Pielou’s index, was the only index that was significantly higher at the inorganic C poor RH site (Supplementary Table S6).
The relative abundances of Acidobacteria, Actinobacteria, Entotheonellaeota, Alphaproteobacteria, Thaumarchaeota, and Verrucomicrobia were significantly different between RH and AB sites (Figure 4). Relative abundances of major phyla or proteobacterial classes are displayed in Supplementary Table S7. Besides Alphaproteobacteria, which was almost significantly different (p = 0.058, Supplementary Table S5), no differences in relative abundances of phyla were found between the studied plant species.
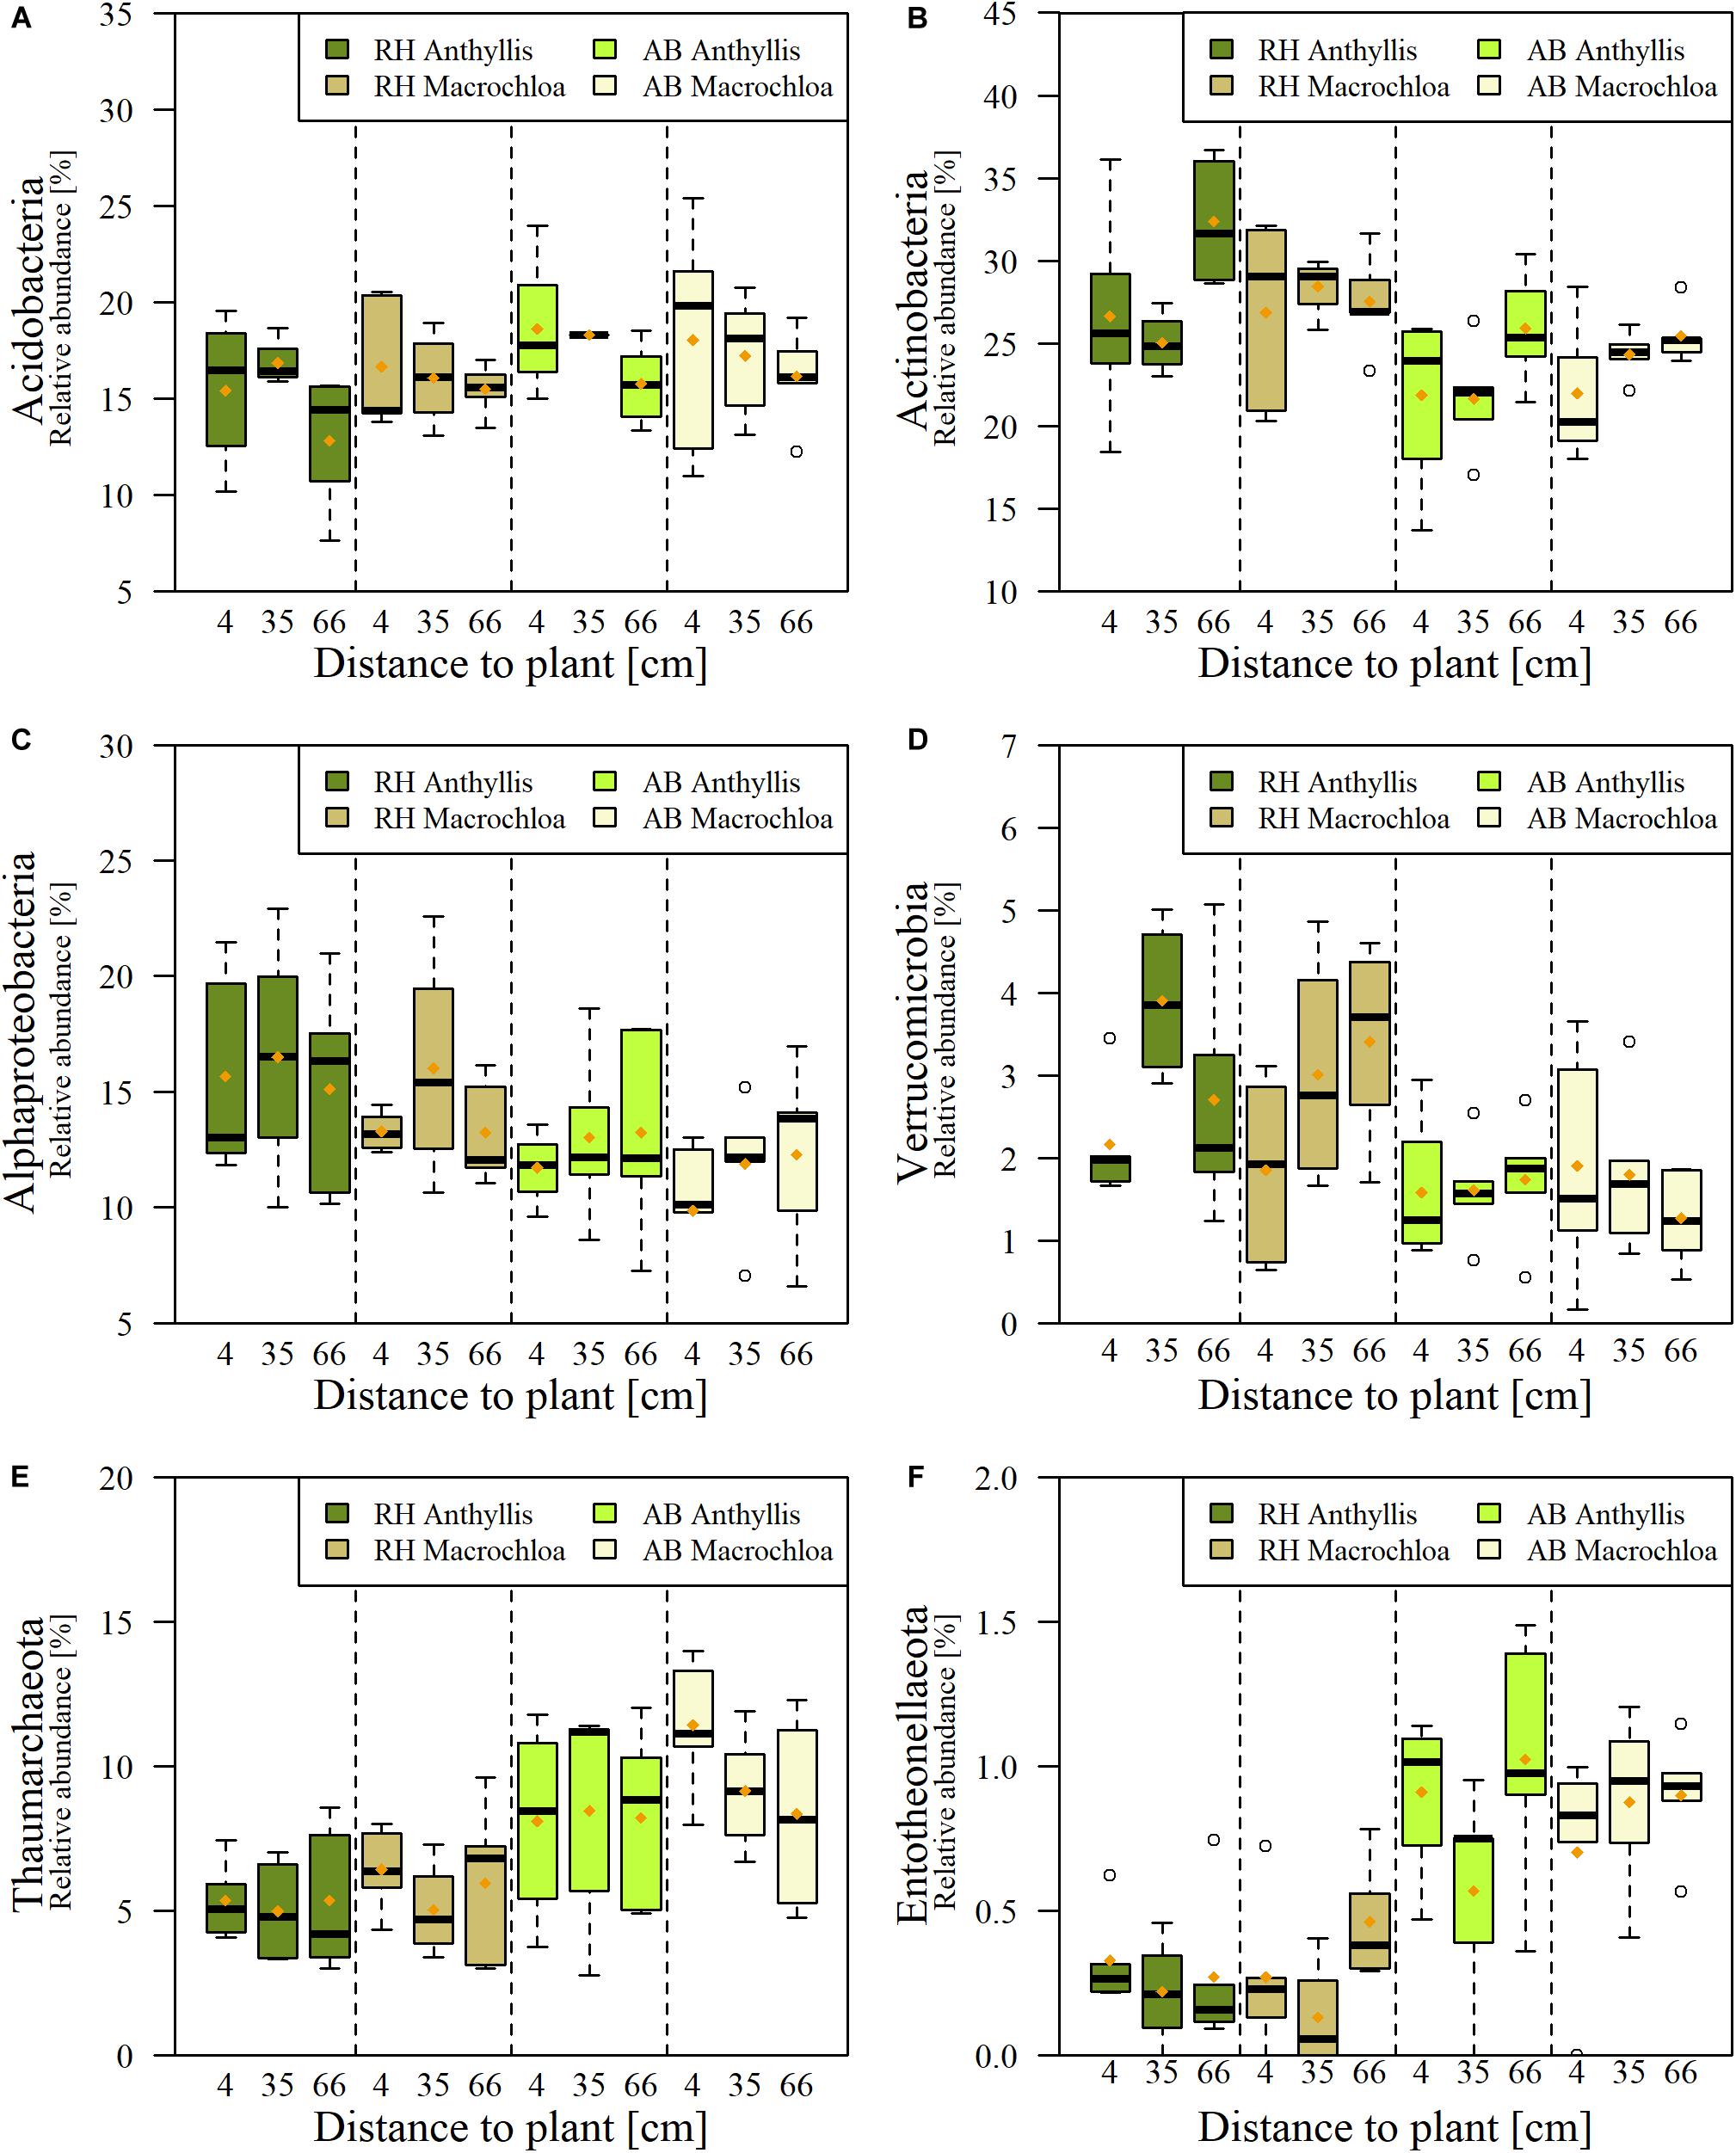
Figure 4. Relative abundance (%) of phyla showing significant differences between Rambla Honda (RH) and Alboloduy (AB) site for Anthyllis cytisoides or Macrochloa tenacissima: Acidobacteria (A), Actinobacteria (B), Alphaproteobacteria (C), Verrucomicrobia (D), Thaumarchaeota (E), and Entotheonellaeota (F).
Independent from site or plant species, the distance to the plant turned out to have an effect for most of the phyla (Supplementary Table S5). For instance, the relative abundance of Acidobacteria was significantly higher at the canopy edge (35 cm) of Macrochloa at RH and AB compared to the furthest distance (66 cm, Figure 4A). A plant species dependent effect of sampling distance could be observed for Actinobacteria, where under Anthyllis the abundance significantly differed between the canopy edge (35 cm) and largest distance (66 cm) from plant stem (Figure 4B). In contrast, for Deltaproteobacteria a significant higher relative abundance was found at the furthest distance compared to the Anthyllis stem (Supplementary Table S7). Entotheonellaeota showed a higher relative abundance at AB (Figure 4F) and tend to be highest at furthest distance to the plant, except under Anthyllis at RH. An effect of sampling distance independent from site and plant species was present on the relative abundance of Gemmatimonadetes, too, whereby in general highest relative abundances were found at the plant stem (Supplementary Table S7).
At a lower taxonomic level several genera were significantly enriched (positive responders) by one of the sampling sites (RH vs. AB) or plant species (Anthyllis vs. Macrochloa). However, the differences were relatively low in many cases (Table 2) and could mainly be observed between the two sites. For Anthyllis, a remarkable difference in relative abundance was detected for an unclassified genus affiliated to “Order SAR202 clade” (phylum Chloroflexi), showing a 6.57-fold higher relative abundance at the inorganic C rich AB site compared to RH (Table 2A). A Gemmatimonadaceae genus (phylum Gemmatimonadetes) was significantly enriched under these conditions (around Anthyllis at AB) as well. In contrast, a genus belonging to Beijerinckiaceae (phylum Proteobacteria, class Alphaproteobacteria) was significantly increased in relative abundance at the RH site independent of the plant species, accounting for ∼6% of all sequences in these samples (Tables 2A,B). Sequences belonging to a genus with closest identification on family level as Nitrososphaeraceae (phylum Thaumarchaeota) were significantly enriched at AB compared to RH site around Macrochloa. Furthermore, it accounted for almost 10% of the total sequences in these samples (Tables 2A,B), which confirms the results for Thaumarchaeota shown in Supplementary Table S7. Another positive responder to AB site under Macrochloa, summing up to around 4% of the sequences, was affiliated to the family Rubrobacteriaceae (phylum Actinobacteria).
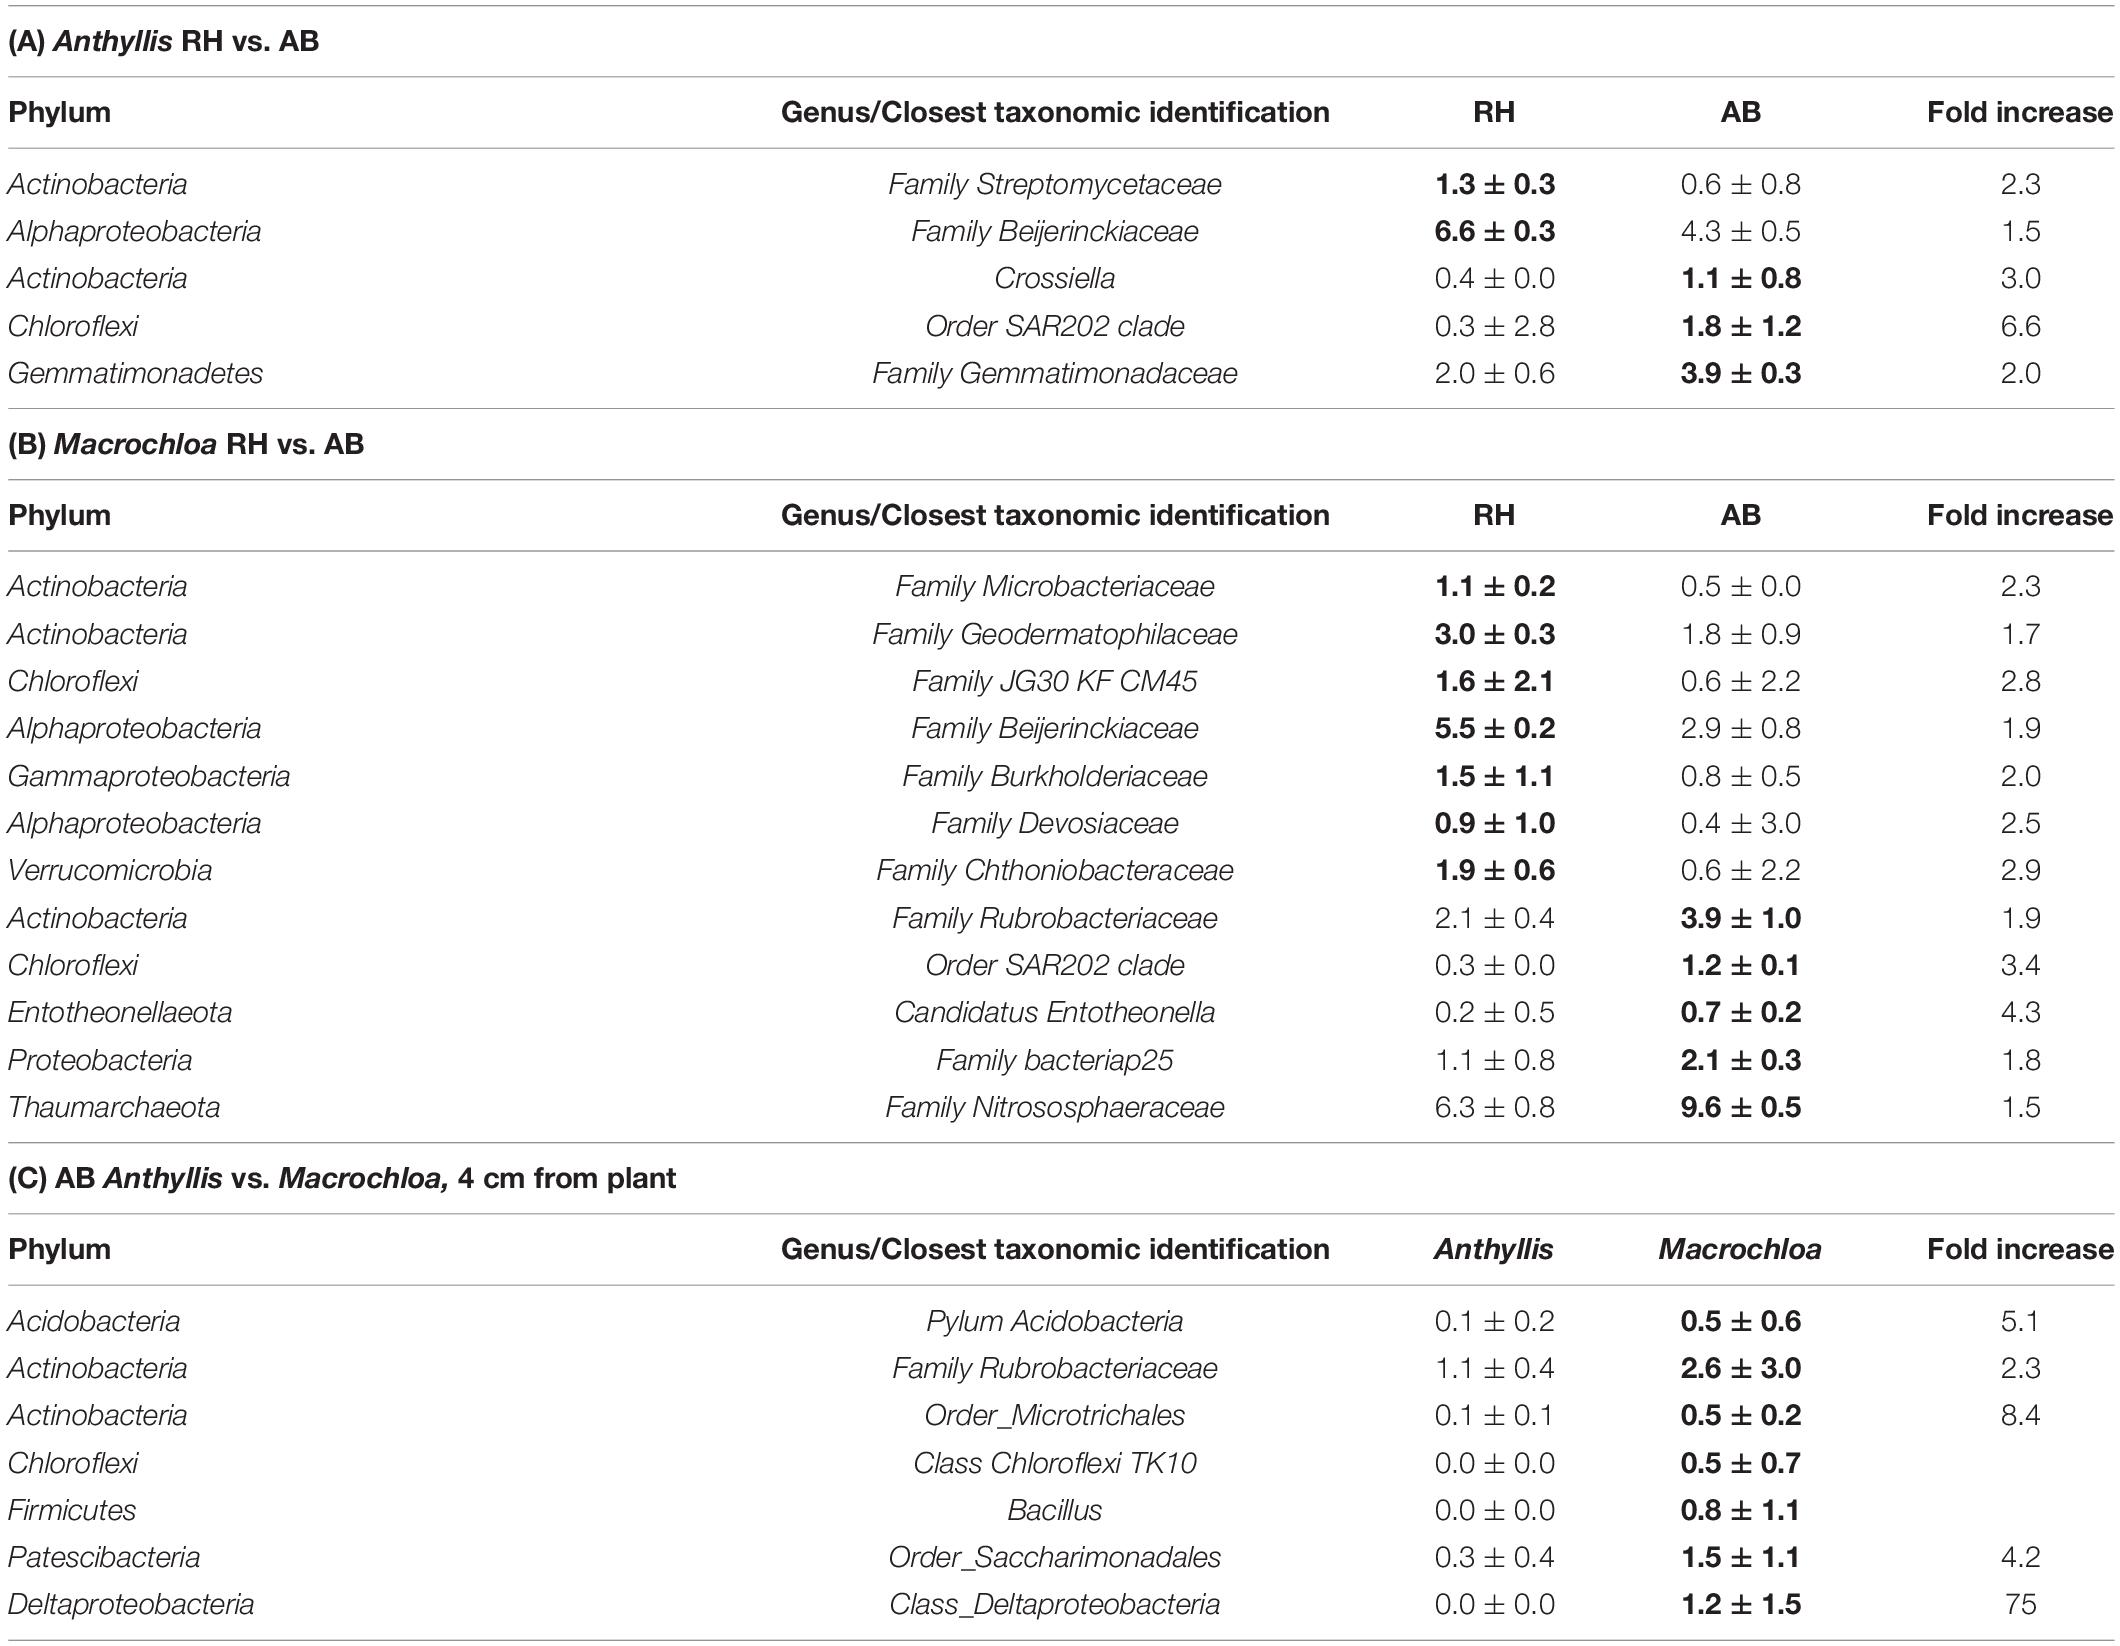
Table 2. Relative abundances (%) ± standard deviation of prokaryotic genera (>0.5%) that significantly differed between the Rambla Honda (RH) and Alboloduy (AB) sites for Anthyllis cytisoides (A) and Macrochloa tenacissima (B), and between Anthyllis and Macrochloa at Alboloduy (C) site at a distance of 4 cm from plant (p < 0.05, higher relative abundances shown by bold numbers).
Comparing the two plant species on site level revealed only a difference between the Anthyllis and Macrochloa at 4 cm from the stem at the AB site. The responder analysis revealed that the relative abundance of this Rubrobacteriaceae genus (2.65%) was more than twice as high under Macrochloa as under Anthyllis at AB at a distance of 4 cm from plant (Table 2C).
EPS-Saccharide Content as Explained by Prokaryotic Community Composition and General Soil Properties
The EPS-saccharide content was not significantly influenced by plant species, sites and/or distance to the plant (Supplementary Table S3), although they were slightly higher at the canopy edges (35 cm from the plant stem) compared to other distances from the plants at RH (Figure 5A). Furthermore, higher EPS-saccharide contents were measured under some of the Anthyllis plants, although the variability between individual specimens was high. The contents of EPS-saccharide correlated significantly with total C (overall R2 = 0.65, RH: 0.80, AB: 0.78) and total N contents (overall R2 = 0.78, RH: 0.85, AB: 0.74) of the EPS extracts (Supplementary Figure S5).
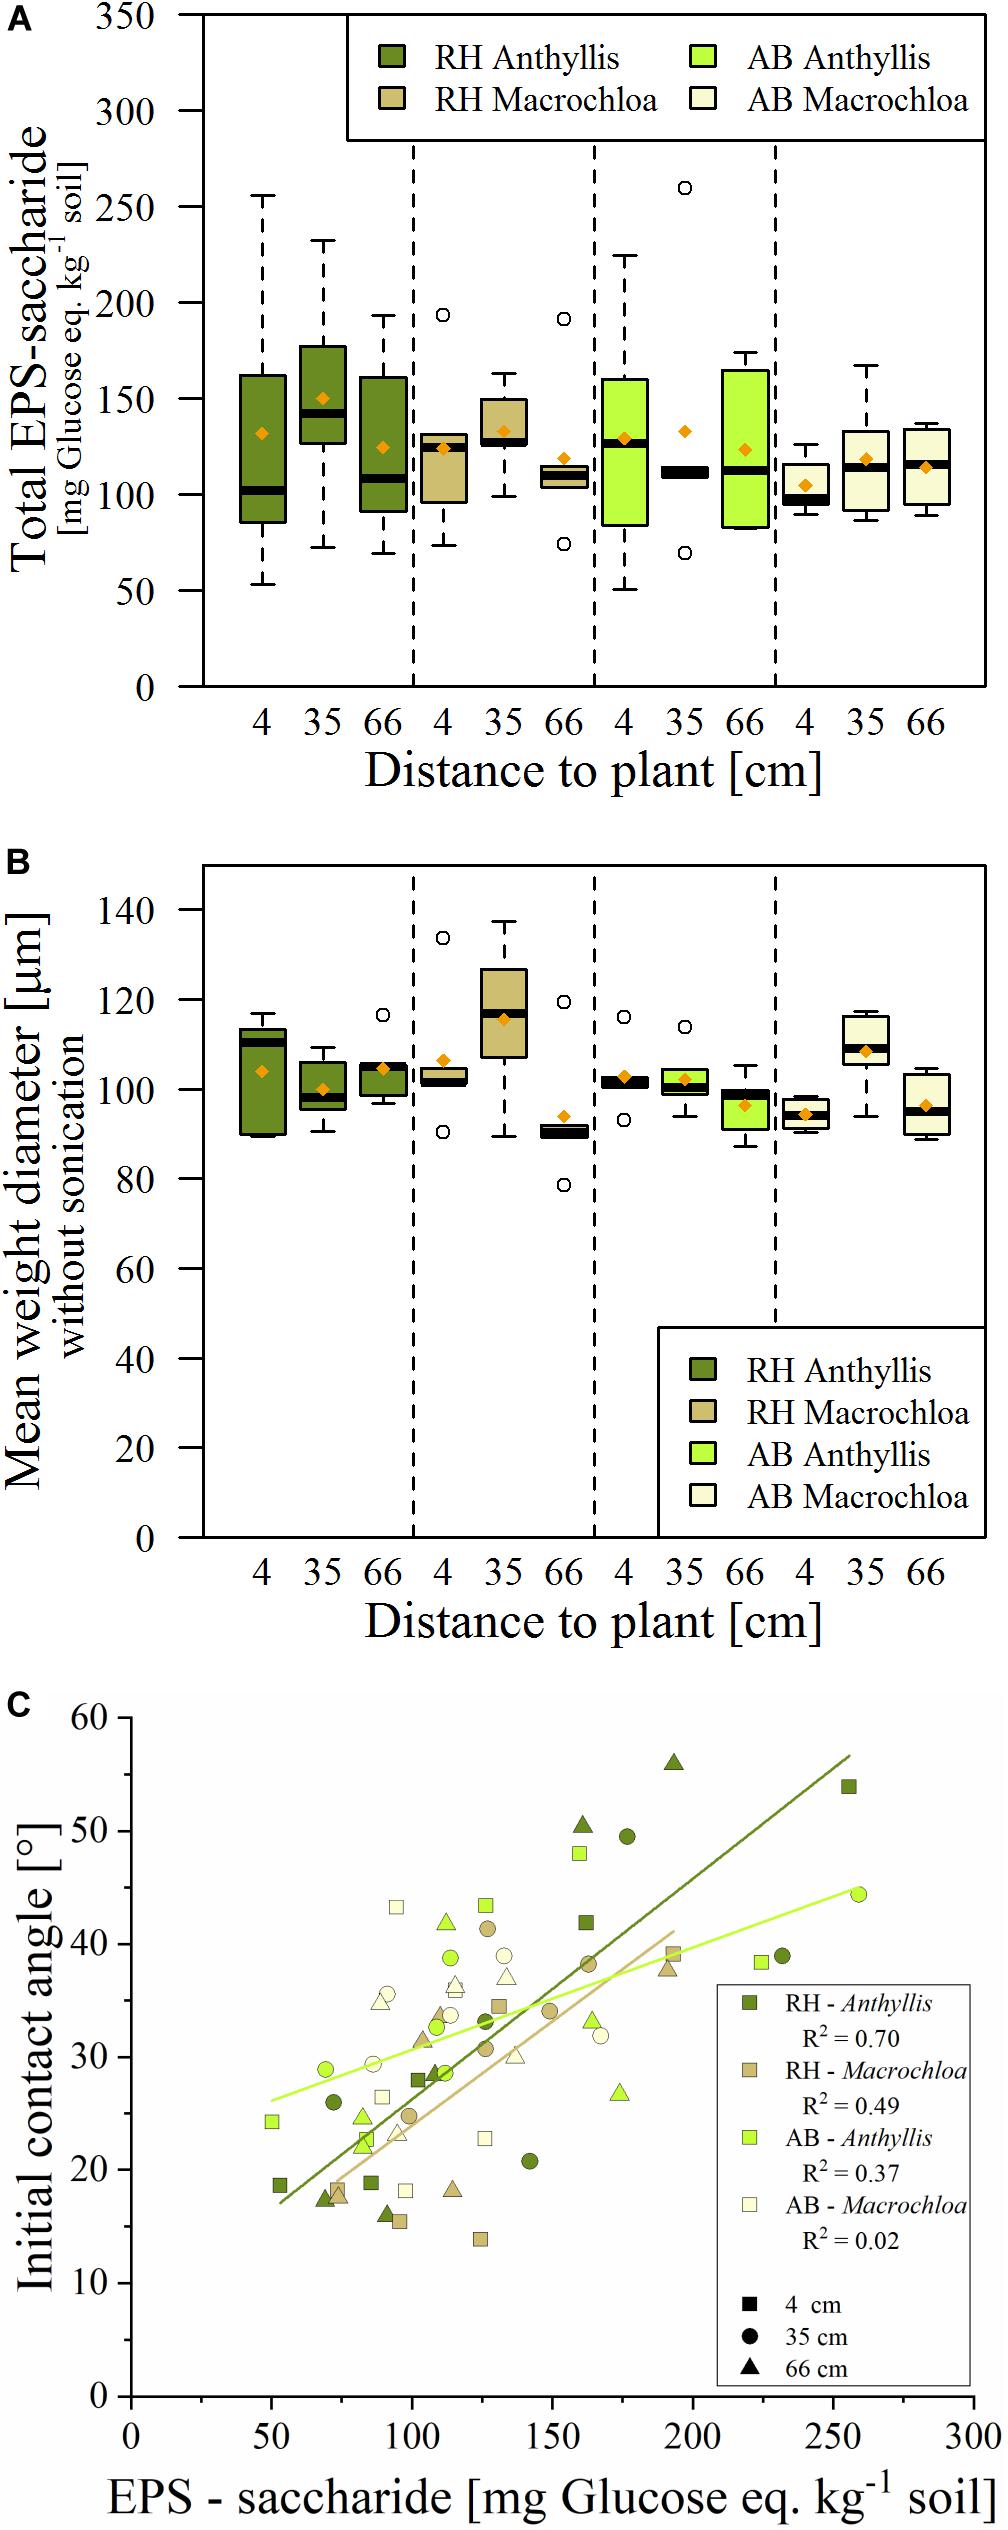
Figure 5. EPS-saccharide content, expressed as glucose equivalent (A) and Mean Weight Diameter (MWD) of the microaggregate fraction (<0.25 mm) (B) derived of the soil samples from Alboloduy (AB) and Rambla Honda (RH). Box-and-whisker diagrams showing the median (black line), 25th/75th percentile (resp. upper/lower part box), min./max. (whiskers) and mean values (orange dot), with 5 replicates per box. In subfigure (C) linear regression correlations between EPS-saccharide content and initial contact angle of the microaggregate fraction for the plant/site combinations are displayed.
The SEM revealed that the organic C content of the soil is the main driver for the contents of EPS-saccharide and for the bacterial abundance in the RH soil. Differences in prokaryotic community composition (ProkCom) of the RH soil were explained by the graphitic C content (Figure 6A), but the community composition had no significant direct effect on the EPS-saccharide contents. The model explained 64% of the variance in EPS-saccharide contents.
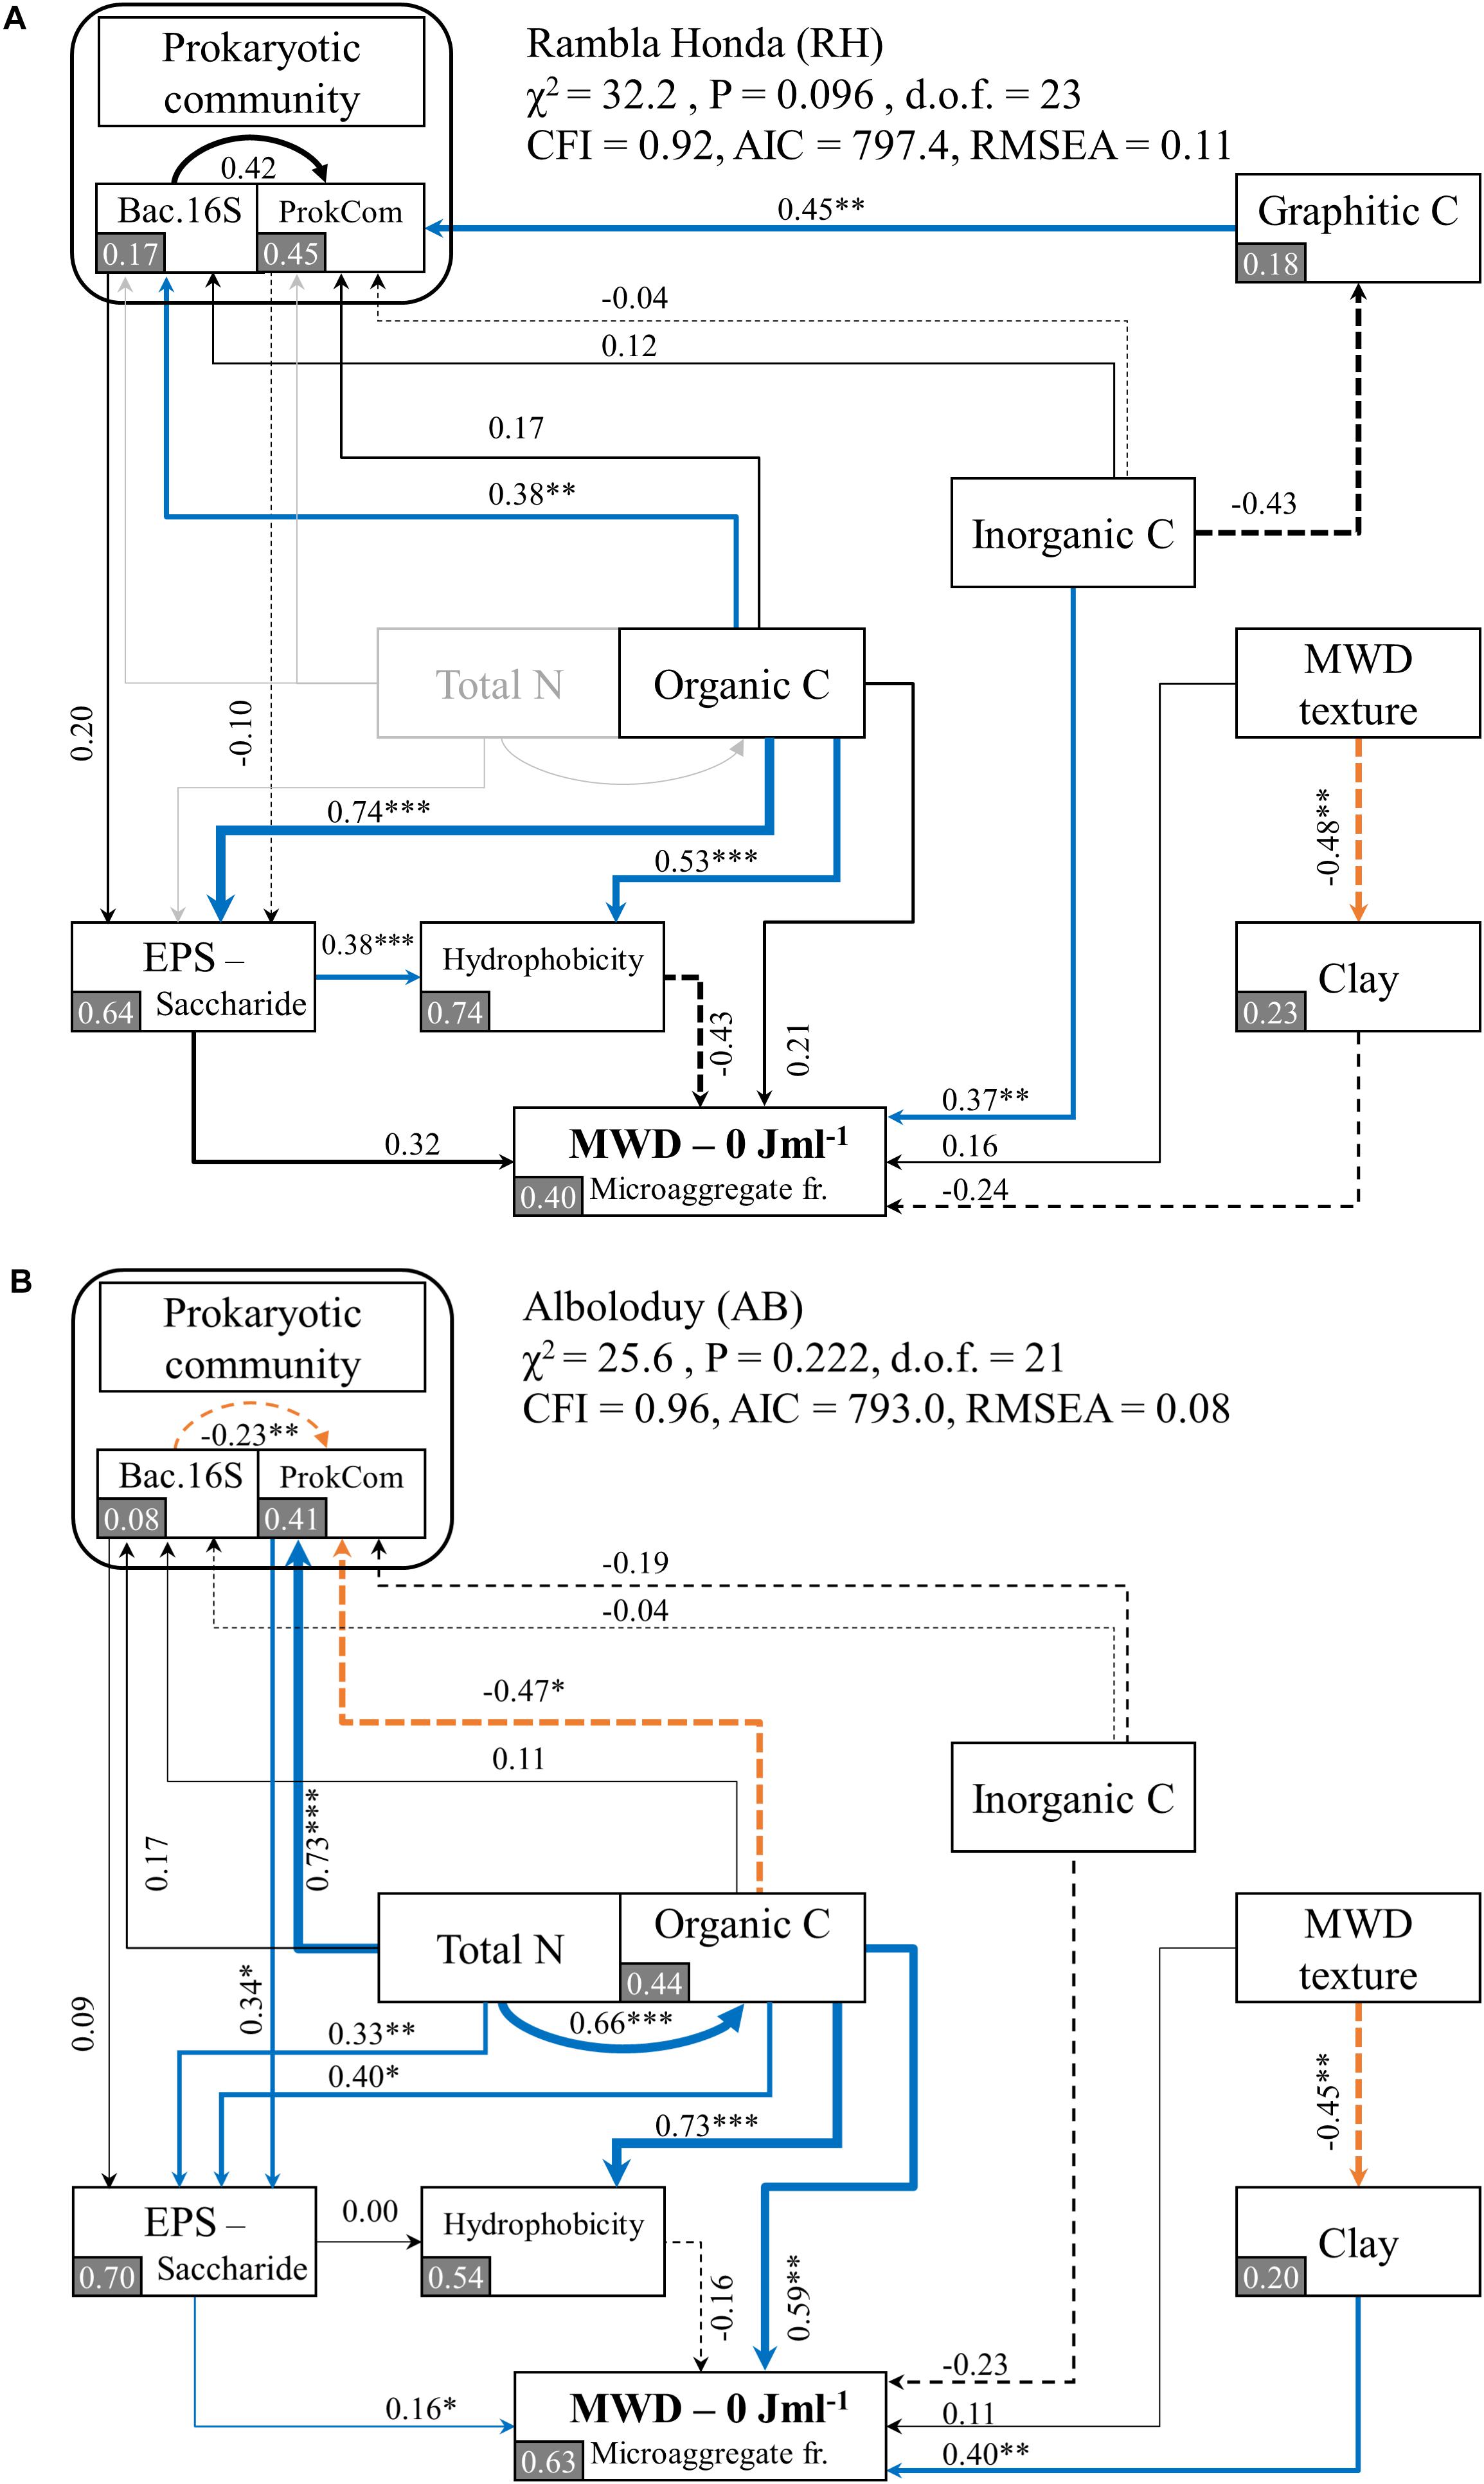
Figure 6. Results from structural equation modeling (SEM), showing the direct and indirect effects of the prokaryotic community and environmental parameters on microaggregation, expressed as the mean weight diameter (MWD) without sonication, for Rambla Honda (A) and Alboloduy (B) sites. As explained in section “Data Analysis and Statistics,” the SEM for Rambla Honda (A) had to be modified to obtain a significant result, whereby the total N was excluded (indicated in light gray). Note that Bac16S stands for the bacterial abundance as measured by bacterial 16S rRNA gene copy numbers (Supplementary Figure S4A) and ProkCom stands for the prokaryotic community composition similarity as derived from the first PCoA axis (Supplementary Figure S7). The width of the arrows is proportional to the strength of path coefficients. An orange dashed arrow indicates a negative significant effect, blue arrows a positive significant effect and a solid or dashed black arrow indicate a non-significant positive or negative effect, respectively. Additionally, the numbers indicate the standardized path coefficients, analogous to relative regression weights, and indicative of the effect size of the relationship. Significance levels for the effects are as follows: *p < 0.05, **p < 0.01, and ***p < 0.001. In gray squares, the proportion of variance (R2) of the variable as explained by the model, is displayed. Model statistics are given in the figure with degrees of freedom (d.o.f.), comparative fit index (CFI), akaike information criterion (AIC) and root mean square error of approximation (RMSEA).
At the inorganic C rich AB site, organic C also showed a large and significant effect on the EPS-saccharide content, but the prokaryotic community composition (ProkCom) and total N revealed a similarly strong influence (Figure 6B). Total N contents of the soil proved to be the most important driver for the EPS-saccharide content at the N poor AB site. Total N had namely both a large direct (0.33) and indirect (0.73∗0.34) effect, via the relation between total N content and differences in the prokaryotic community composition (Figure 6B). Overall, the models explained 64 and 70% of the variance in EPS-saccharide content for the RH and AB site, respectively (Figure 6).
Microaggregation and Microaggregate Stability as Explained by General Soil Properties, EPS-Saccharide Content and Wetting Properties
The amount of microaggregate fraction (<0.25 mm) of the soil (<4 mm) tended to be larger at the middle distance (35 cm from the stem), except for Macrochloa at AB site (Supplementary Table S4). This partly coincides with a larger mean weight diameter (MWD) of the microaggregate fraction at the canopy edge, especially for the Macrochloa subplots (Figure 5B), which was even significantly different from the largest distance (66 cm) with 200 J ml−1 of energy treatment (Supplementary Table 4). As the initial contact angle was <90° in all samples, the microaggregate fraction had a reduced wettability rather than being really hydrophobic (Supplementary Table S4). Initial contact angle was largest at the Anthyllis plants, meaning that the microaggregate fraction had the largest reduced wettability at the Anthyllis plants, independent of the parent material.
The SEM of both sites revealed that the reduced wettability (i.e., hydrophobicity) of the microaggregate fraction was significantly affected by the organic C content, whereby higher organic C contents decreased wettability independent of parent material (Figure 6). This effect was largest at the AB site, while at the RH site the EPS-saccharide content had a large and significant effect on the microaggregate wettability as well (Figure 6A). The relation between EPS-saccharide contents and initial contact angles was strongest at the Anthyllis plots for both sites (Figure 5C).
Although not significant, the wettability had a larger effect on the MWD of the microaggregate fraction at the RH site than either organic C or EPS-saccharide contents. Furthermore, inorganic C had a significant effect on the MWD without energy treatment at the inorganic C poor RH site. Overall, the SEM model explained 40% of the variance found in the microaggregate MWD of the RH site (Figure 6A).
At the inorganic C rich AB site, the MWD of the microaggregate fraction was mainly affected by the organic C content, both directly and indirectly via the EPS-saccharide content (Figure 6B). It is notable that the contents of EPS-saccharide had a significant effect on the MWD of the microaggregate fraction (Figure 6B). Additionally, the clay content at AB site affected the MWD of the microaggregate fraction positively, which means that the MWD increased with increasing clay content. Overall, the hypothetical model explained 63% of the variance found in the MWD of the microaggregate fraction.
Discussion
Is the Prokaryotic Community Shaped by (A)biotic Influences – Plant vs. Parent Material Effects?
The ASVs data analysis revealed that the composition of the prokaryotic communities differed mainly between the two sampling sites (Supplementary Table S5). Further, PCoA analysis showed differences in pH, inorganic C, soil texture and total N, which were mainly site-dependent factors that contributed to differentiation in the prokaryotic communities (Figure 3).
Despite the fact that the plant species did not significantly influence the total composition of the prokaryotic communities, it should be noted that minor differences induced by plant species on soil parameters were observed. For instance at the N poor AB site, the Anthyllis samples showed clearly higher total N contents than Macrochloa samples (Figure 2B). Furthermore, the prokaryotic community index was strongly affected by total N content (Figure 6B). This indicates a propagation of N fixing bacteria associated to the Anthyllis roots, as for example the relative abundance of Alphaproteobacteria tended to be slightly higher under Anthyllis at the AB site as compared to Macrochloa. Rhizobiales and Sphingomonadales include many N fixing families (Tsoy et al., 2016) and most of the alphaproteobacterial sequences belonged to these orders (Rhizobiales ca. 56–70%, Sphingomonadales ca. 15–18% of Alphaproteobacteria at AB, data not shown). At the N rich RH site, it might be that the effect of total N is offset by the inherent high total N content at RH. According to Sprent (2005), symbiotic nitrogen fixing bacteria will use the present N rather than fixing N2 from the atmosphere and thus a symbiosis might not develop. Additionally, a strong effect of the graphitic C content on the prokaryotic community composition was found, indicating a potential interaction between the prokaryotes and the graphite. Only recently it has been recognized that graphite might be utilized by soil microbes (Liu et al., 2015; Hemingway et al., 2018), but little is known about the exact role of graphite on overall soil microbial life. As stated in previous publications (e.g., Ding et al., 2013; Babin et al., 2014; Fierer, 2017), factors affecting prokaryotic community composition in soil can be manifold. For now, we can therefore not exclude an effect of other parameters on the prokaryotic community that were not taken into account in this study.
Among the eleven most abundant prokaryotic phyla, the phylum Entotheonellaeota was remarkable as its relative abundance was significantly higher at the AB site, independent from the present plant species. Entotheonellaeota, a recently described phylum without available culturable representatives, has been so far only linked with the microbiome of the marine sponge Theonella (Wilson et al., 2014). This phylum seems to be specific for the AB site. The presence of Entotheonellaeota as well as the higher clay and inorganic C content might indicate a strong influence of Upper Miocene sea sediments, which covered the area nearby the AB site. Aeolian deposits from this area most likely influenced the AB site, which might have led to a favorable nutrient/mineral composition for Entotheonellaeota (Queralt-Mitjans et al., 1993; Braga et al., 2003).
Most of the enriched ASVs could not be affiliated to a distinct genus and were classified only down to family or order level (Table 2). Therefore, information that can be taken from the responder analysis is limited (Table 2). Remarkably, a relative abundance of about 10% could be observed for an archaeal genus of Nitrososphaeraceae at the N poor AB site under Macrochloa grass tussocks. Members of Nitrososphaeraceae are ammonia oxidizers and thus are important for soil nitrogen cycling (Stieglmeier et al., 2014; Pelissari et al., 2017). Interestingly, a genus belonging to the family Rubrobacteriaceae, which has previously been reported to be highly abundant inside of microaggregates and assumed to play a crucial role in microaggregate formation (Mummey et al., 2006; Davinic et al., 2012), was enriched under Macrochloa (4 cm from the plant) at AB (Table 2C). However, this sampling point had the lowest MWD, indicating less microaggregation (Figure 5B). What seems contradictory at first glance suggests strain-specific differences in functionality and points toward the complex role of the diverse soil prokaryotic community composition on soil aggregation.
Differences in the composition of prokaryotic communities, depending on the distance to the plant, could only be observed for the relative abundances of Acidobacteria, Actinobacteria, Entotheonelleaota, Gemmatimonadetes, Deltaproteobacteria, Gammaproteobacteria, and Verrucomicrobia, especially under Anthyllis (Figure 4). The bacterial abundance (as expressed by bacterial 16S rRNA gene copy number) was not significantly affected by sampling distance but tended to be highest at a distance of 35 cm from Anthyllis at RH and 35 cm from Macrochloa at AB (Supplementary Figure S4A). These findings do not fully support our hypothesis of an overall effect of sampling distance driven by canopy coverage and plant litter input (Goberna et al., 2007; Fierer, 2017; Tecon and Or, 2017; Veen et al., 2019). Nevertheless, a minor effect of plants on the soil prokaryotic community was found and further studies might reveal larger differences between plant species when considering the rhizosphere. In the rhizosphere, which is defined as the soil compartment directly influenced by the plant roots (Hiltner, 1904), plant (species) effects should be larger than in the soil samples taken at greater distances from the plant (Berg and Smalla, 2009; Philippot et al., 2013).
In summary, the sampling sites shaped their respective prokaryotic communities by differences in pH, inorganic C, clay and total N content. Within sites, differences in the composition of the prokaryotic community could be related to either graphitic C (at RH) or total N (at AB). Neither plant species nor sampling distance had a significant influence on the overall composition of the prokaryotic communities, although for some phyla and genera significant differences in relative abundance were found to be specific for plant species and/or sampling distance as described section “Soil Prokaryotic Community Compositions Shaped by Parent Material, Plant Species and Distance to the Plant.”
Is Soil EPS Content Linked to Prokaryotic Community Composition and/or Abiotic Factors?
In our study we extracted between 50 and 250 mg glucose eq. kg–1 soil of EPS-saccharide, indicating that the EPS-saccharide content was at the lower end, as could be expected for a dryland ecosystem. However, in a similar ecosystem on more acidic soils between 375 and 875 mg glucose equivalent kg–1, depending on the moisture conditions, was extracted using a hot-water extraction method (Marchus et al., 2018). Chenu (1995) estimated in a review that soils contain on average between 20 and 1500 mg (dry-weight) EPS-saccharide per kg soil. By extraction with the cation exchange resin method, Redmile-Gordon et al. (2014) reported EPS-saccharide contents of 160 and 470 mg glucose eq. kg–1 soil for a temperate bare- and grassland soil, respectively. Using the same methodology, Wang et al. (2019) extracted about 600 and 800 mg glucose eq. kg–1 soil from Ultisols in a subtropical climate. It should be noted that a lack of standardization in EPS extraction methods obviates a proper comparison between different studies, especially as we applied a methodology in which easily extractable substances were removed before the actual EPS extraction, reducing the overall EPS extracting yields (More et al., 2014). At the same time, we hypothesized that the extracted EPS in the present study represent the proportion of EPS forming bonds with particles. Namely, without the first water extraction step, the EPS-extract would have contained water extractable substances that would have been dissolved upon measuring microaggregation.
The contents of EPS-saccharide were not significantly influenced by the parent material or plant species, but these contents were higher around the canopy edges, especially at the RH site (Figure 5A). Under the canopy, highest litter input takes place, but the canopy of Macrochloa is much denser than of Anthyllis hampering light and moisture input (Bochet et al., 1998). Despite the large spatial heterogeneity, the content of EPS-saccharides could be (in)directly linked to the bacterial 16S rRNA gene copy number and differences in prokaryotic community composition (Bac.16S/ProkCom, Figure 6). Especially at the inorganic C rich AB site, EPS-saccharide content was significantly linked to the prokaryotic community composition (Figure 6B). The community composition index, derived from the PCoA, was used to describe the difference within the prokaryotic community. This index was linked to the bacterial 16S rRNA copy number and the total N content of the AB site. As previously discussed, available N is a well-known factor influencing the bacterial community composition, especially in OM poor soils like those in our study (Fierer, 2017). At the N rich RH site, a strong correlation between EPS-saccharide contents and 16S rRNA gene copy numbers was only found at Anthyllis shrubs (Supplementary Figure S4B). This explains the non-significant link between bacterial 16S rRNA gene copies and EPS-saccharide contents as both plant species were taken in the SEM analysis (Figure 6). Anthyllis forms an important source of nutrients for microorganisms in the semiarid landscape (Requena et al., 2001), thus likely promoting the growth of copiotrophs, which again may lead to higher EPS contents. However, it should be noted that the bacterial 16S rRNA gene copy number serves only as a rough estimate for bacterial abundance since different bacterial taxa can harbor different amounts of 16S rRNA gene operons depending on their life style (Klappenbach et al., 2000; Lee et al., 2008). In short, it can be hypothesized that EPS-saccharide content is (indirectly) driven by the amount and quality of OM, whereby OM affects the prokaryotic community composition as indicated by interlinks with (organic) C and total N contents of the soil. At the same time, increasing EPS contents will lead to higher organic C contents in the soil, which is presumably stabilized organic C as bound to mineral surfaces.
In summary, the content of extracted EPS-saccharide was mainly linked to the organic C and total N content of the soils. Additionally, at the inorganic C rich and N poor AB site, EPS-saccharide content was linked to differences in the prokaryotic community composition. These differences in the community composition were driven by total N content.
Do EPS-Saccharide Contents Influence Soil Microaggregation – EPS vs. Other Controlling Factors?
First of all, we observed that the MWD of the microaggregate fraction (<250 μm) is enhanced at the Macrochloa canopy edge (Figure 5B). At the canopy edge, highest infiltration has been observed in comparison to the stem or in the bare inter-patch area (Maestre et al., 2002; Cammeraat et al., 2010). The higher infiltration rates indicate better soil structure, i.e., better soil aggregation. This results in higher soil moisture availability and thereby better micro-climatic conditions for microbial growth, especially when nutrient carrying overland flow infiltrates (Bochet et al., 1999; Tecon and Or, 2017). The previously discussed observations of improved conditions by the canopies and subsequent higher EPS-saccharide contents seem to be associated with an improved microaggregation at the Macrochloa canopy edge (35 cm) and under the Anthyllis canopy (4 and 35 cm).
At the inorganic C poor RH site, EPS-saccharide content had a non-significant, but relatively large effect on the MWD of the microaggregate fraction (Figure 6A). This means that a trend between the two parameters could be observed, but the variability of the data was too large to assume a direct effect (Supplementary Figure S6A). Exchanging the EPS-saccharide content for the total C content of the EPS extracts in the SEM analysis resulted in a stronger relation to microaggregation, which was still not significant at the 0.05 level (not shown). This positive change could hint on other EPS constituents playing an important role in microaggregation. EPS-proteinaceous components are known to enhance soil aggregation as well by providing adhesion of bacterial cells to, e.g., iron oxide surfaces (Omoike and Chorover, 2006). However, in the present study colorimetric protein quantification failed by the interference of high amounts of polyphenolic components in the extract. Although the microaggregate-associated Rubrobacteriaceae (Davinic et al., 2012) were found to be significantly more abundant at the AB site, these samples showed the lowest microaggregation (Figure 5B). However, directly linking individual genera or families to EPS contents in vivo is challenging, as we analyzed total community DNA (genetic potential). Furthermore, the heterogeneous character of the soil environment induces a highly diverse bacterial community, in which different consortia are likely responsible for EPS formation (Nadell et al., 2016; Tecon and Or, 2017; Flemming and Wuertz, 2019).
So far, not many studies have examined EPS production and its effect on aggregation in slightly alkaline soils. Main evidence is reported from biocrust formation and its subsequent positive effect on soil aggregate stability (Chamizo et al., 2018). We hypothesized that in the inorganic C rich soil of the AB site, EPS-saccharide would be a less important binding agent for microaggregates. However, the opposite was found: EPS-saccharide contents were significantly linked to microaggregation only at the AB site, while inorganic C had no significant effect. CaCO3 and other carbonates as the main components of the inorganic C fraction are considered as one of the most important abiotic factors for microaggregate formation and stability (Six et al., 2004; Totsche et al., 2018). We think that the inorganic C content at the AB site excels the range in which an effect of inorganic C on microaggregate stability becomes evident. Especially the relative large and significant effect of inorganic C on microaggregation at the RH site indicates that these differences seem to have a more pronounced effect on microaggregation at lower inorganic C contents.
In a lab study, Brax et al. (2019b) recently showed that the addition of Ca2+ ions has an important effect on the structure of soil polysaccharides. This alteration in molecular structure eventually leads to an increase in microaggregate stability, independent from origin of the soil polysaccharides (Brax et al., 2019a). This observation is in line with an earlier study of Muneer and Oades (1989), who observed that the addition of glucose with CaCO3 or CaSO4 resulted in much higher contents of water-stable microaggregates compared to the single addition of either glucose or CaCO3/CaSO4. Translated to our soils, this suggests that in a calcium carbonate-enriched soil (our AB site) the EPS-saccharide bonds between particles might be more rigid compared to the less alkaline soil of the RH site. Along these lines, it can be hypothesized that Ca2+ bridging might be even crucial to form stable soil aggregates by EPS.
Traditionally, soil wetting properties are linked to OM content, whereby waxes and oils from the leaf litter are the main drivers. In line with Verheijen and Cammeraat (2007), we also observed a lower wettability near the Anthyllis plant in comparison to Macrochloa, likely induced by differences in litter composition. Additionally, EPS covering mineral surfaces also tend to be hydrophobic (Chenu and Cosentino, 2011; Werb et al., 2017). For example, Bacillus subtilis, widely found in the upper soil layers, produces hydrophobin proteins creating a hydrophobic layer on the biofilm surface (Arnaouteli et al., 2016). The strong correlation between EPS-saccharide contents and contact angles supports this theory (Figure 5C). Furthermore, the nutrient availability has a strong influence on the biofilm composition, whereby decreasing C/N ratios were linked to higher protein and relatively lower saccharide contents (Durmaz and Sanin, 2001). This could explain why the link between EPS-saccharide contents and water repellency was strongest and significant at the N rich RH site as the biofilm might contain more (hydrophobicity-inducing) proteins.
In general, hydrophobic rather than hydrophilic components of OM are assumed to improve aggregate stability (Piccolo and Mbagwu, 1999; Chenu and Cosentino, 2011; Kraemer et al., 2019). Especially in the case of water-stable microaggregates (as in our study), a relation between the wettability and microaggregation could be expected. The SEM did not reveal a significant relation between the reduced wettability and microaggregation at 0 J ml–1 (without sonication). However, a closer look to the data reveals that the scattering induced by Macrochloa samples might have caused the failing of the significance test (Supplementary Figure S6B). In other words, only at Anthyllis plots a correlation between particle wettability and microaggregation was found. At the same time, we also found the strongest relations between increasing EPS-saccharide contents and increasing initial contact angle in Anthyllis plots (Figure 5C). Furthermore, we assume that EPS-saccharide contents at the inorganic C rich AB site were linked to the prokaryotic community composition via the N content of the soil. Therefore, it can be hypothesized that the legume shrub Anthyllis harbors or promotes EPS-producing prokaryotes, which in turn increases the soil hydrophobicity. Further study into the detailed prokaryotic community of the Anthyllis cytisoides plants at the RH site might illuminate this mechanism.
To summarize, EPS-saccharide content had a direct significant effect on microaggregation at the inorganic C rich AB site, suggesting an important role of cations in the formation of rigid bonds between mineral particles by EPS. Although at the RH site no direct effect was found, contents of EPS-saccharide were linked to microaggregate wettability. Especially in the Anthyllis plots of the RH site, a link between wettability and microaggregation could be assumed hinting on a potential indirect effect of EPS-saccharide on microaggregation.
Conclusion
In this study, parent material had the largest influence on overall prokaryotic community composition compared to plant species. On site level, a strong link between organic C (and total N in case of AB site) and EPS-saccharide content was found. Therefore, it can be hypothesized that EPS-saccharide production is mainly driven by (easily decomposable) OM that serves as a nutrient source and affects the prokaryotic community composition.
Despite homogenization of 6 subsamples into one composite sample, variability between plots was very large. This spatial variation between plots turned out to be of greater importance than the plant influence on the studied soil characteristics. Therefore, further studies on plant influence in the semiarid sloping grasslands should focus more on the rooting zone, where a larger influence from the root environment on the prokaryotic community, subsequently on the EPS production and soil aggregation, can be expected. Isolation of individual, or consortia of, prokaryotic species might provide a possible link to EPS contents and subsequently to soil aggregation.
Contradicting our hypothesis, only a direct effect of EPS-saccharide content on microaggregation was found in the inorganic C rich AB site, which has been attributed to the potentially enhancing effect of CaCO3 by changing the EPS-saccharide structure and potentially increasing the overall production of EPS.
Overall, it seems that OM drives soil EPS-saccharide content by shaping the soil prokaryotic community. Large contents of polyvalent cations, as found in carbonat- enriched soils, promote the stabilizing effect of EPS on soil microaggregation.
Data Availability Statement
The underlying dataset with the individual soil properties is available, via http://dx.doi.org/10.25532/OPARA-51, including the R script and dataset used for the structural equation modeling (http://dx.doi.org/10.25532/OPARA-73). Raw amplicon data were deposited at NCBI Sequence Read Archive (SRA, https://www.ncbi.nlm.nih.gov/) under accession number PRJNA588145.
Author Contributions
AB processed, analyzed, and wrote the prokaryotic part. JZ processed, analyzed, and wrote the EPS and microaggregation part. CV, DB, KS, and KK developed the study. CV advised on the EPS and microaggregation part. DB gave advice on ASV data processing and interpretation. EC assisted on sampling design and with data interpretation. AS-B, RL, and LL provided advice for choosing the field sites, provided information on the sites and ecosystems, and helped interpreting the results. JN and SS provided the Illumina sequencing and primary data processing, as well as advice for further data analysis. SW provided the contact angle measurements and interpretation of the data. KS and KK supported with data interpretation and linking the work. All co-authors critically reviewed the manuscript and gave advice for improvements.
Funding
This study was financially supported by the Deutsche Forschungsgemeinschaft (DFG), Bonn, Germany, under grants KA1737/13-1 and SM 59/18-1 “Extracellular polymeric substances and aggregate stability – how microorganisms affect soil erosion by water.” AS-B, RL, and LL were supported thanks to the Research Project “Biocrust Dynamics” (DINCOS, CGL2016-78075-P), funded by the Spanish State Plan for Scientific and Technical Research and Innovation. This publication was funded by the Open Access Funding of the TU Dresden Publication Fund.
Conflict of Interest
The authors declare that the research was conducted in the absence of any commercial or financial relationships that could be construed as a potential conflict of interest.
Acknowledgments
We thank Stephan Krüger for his mental support and assistance during the sampling campaign, Manuela Unger and Gisela Ciesielski for the laboratory assistance, Tim Schacherl for establishing the microaggregation method and Ilse-Marie Jungkurth for checking the language of the manuscript. Further, we want to thank the Max Planck Institute for Biogeochemistry (Department Biogeochemical Processes, Jena) for the graphitic C measurements.
Supplementary Material
The Supplementary Material for this article can be found online at: https://www.frontiersin.org/articles/10.3389/fenvs.2020.00051/full#supplementary-material
Footnotes
- ^ https://www.juntadeandalucia.es/agriculturaypesca/ifapa/ria/servlet/FrontController
- ^ https://www.ncbi.nlm.nih.gov/
References
Arnaouteli, S., MacPhee, C. E., and Stanley-Wall, N. R. (2016). Just in case it rains: building a hydrophobic biofilm the Bacillus subtilis way. Curr. Opin. Microbiol. 34, 7–12. doi: 10.1016/j.mib.2016.07.012
Babin, D., Vogel, C., Zühlke, S., Schloter, M., Pronk, G. J., Heister, K., et al. (2014). Soil mineral composition matters: response of microbial communities to phenanthrene and plant litter addition in long-term matured artificial soils. PLoS One 9:e106865. doi: 10.1371/journal.pone.0106865
Bachmann, J., Goebel, M. O., and Woche, S. K. (2013). Small-scale contact angle mapping on undisturbed soil surfaces. J. Hydrol. Hydromech. 61, 3–8. doi: 10.2478/johh-2013-0002
Barnier, J., Briatte, F., and Larmarange, J. : Functions to Make Surveys Processing Easier. R Package Version 0.7.0 (2018). questionr. Available online at: https://CRAN.R-project.org/package=questionr (accessed November 1, 2019).
Berg, G., and Smalla, K. (2009). Plant species and soil type cooperatively shape the structure and function of microbial communities in the rhizosphere. FEMS Microbiol. Ecol. 68, 1–13. doi: 10.1111/j.1574-6941.2009.00654.x
Blankinship, J. C., Fonte, S. J., Six, J., and Schimel, J. P. (2016). Plant versus microbial controls on soil aggregate stability in a seasonally dry ecosystem. Geoderma 272, 39–50. doi: 10.1016/j.geoderma.2016.03.008
Bochet, E., Poesen, J., and Rubio, J. L. (2000). Mound development as an interaction of individual plants with soil, water erosion and sedimentation processes on slopes. Earth Surf. Process. Landforms 25, 847–867. doi: 10.1002/1096-9837(200008)25:8<847:AID-ESP103<3.0.CO;2-Q
Bochet, E., Rubio, J. L., and Poesen, J. (1998). Relative efficiency of three representative matorral species in reducing water erosion at the microscale in a semi-arid climate (Valencia, Spain). Geomorphology 23, 139–150. doi: 10.1016/S0169-555X(97)00109-8
Bochet, E., Rubio, J. L., and Poesen, J. (1999). Modified topsoil islands within patchy Mediterranean vegetation in SE Spain. Catena 38, 23–44. doi: 10.1016/S0341-8162(99)00056-9
Boix-Fayos, C., Calvo-Cases, A., Imeson, A. C., and Soriano-Soto, M. D. (2001). Influence of soil properties on the aggregation of some Mediterranean soils and the use of aggregate size and stability as land degradation indicators. Catena 44, 47–67. doi: 10.1016/S0341-8162(00)00176-4
Bolyen, E., Rideout, J. R., Dillon, M. R., et al. (2019). Reproducible, interactive, scalable and extensible microbiome data science using QIIME 2. Nat. Biotechnol. 37, 852–857. doi: 10.1038/s41587-019-0209-9
Braga, J. C., Martín, J. M., and Quesada, C. (2003). Patterns and average rates of late Neogene–Recent uplift of the Betic Cordillera, SE Spain. Geomorphology 50, 3–26. doi: 10.1016/S0169-555X(02)00205-2
Brax, M., Buchmann, C., Kenngott, K., Schaumann, G. E., and Diehl, D. (2019a). Influence of the physico-chemical properties of root mucilage and model substances on the microstructural stability of sand. Biogeochemistry 147, 35–52. doi: 10.1007/s10533-019-00626-w
Brax, M., Schaumann, G. E., and Diehl, D. (2019b). Gel formation mechanism and gel properties controlled by Ca2+ in chia seed mucilage and model substances. J. Plant Nutr. Soil Sci. 182, 92–103. doi: 10.1002/jpln.201800430
Caesar-TonThat, T. C., Caesar, A. J., Gaskin, J. F., Sainju, U. M., and Busscher, W. J. (2007). Taxonomic diversity of predominant culturable bacteria associated with microaggregates from two different agroecosystems and their ability to aggregate soil in vitro. Appl. Soil Ecol. 36, 10–21. doi: 10.1016/j.apsoil.2006.11.007
Callahan, B. J., McMurdie, P. J., Rosen, M. J., Han, A. W., Johnson, A. J. A., and Holmes, S. P. (2016). DADA2: high-resolution sample inference from Illumina amplicon data. Nat. Methods 13:581. doi: 10.1038/nmeth.3869
Cammeraat, E. L., Cerdà, A., and Imeson, A. C. (2010). Ecohydrological adaptation of soils following land abandonment in a semi-arid environment. Ecohydrology 3, 421–430. doi: 10.1002/eco.161
Cammeraat, L. H., and Imeson, A. C. (1999). The evolution and significance of soil–vegetation patterns following land abandonment and fire in Spain. Catena 37, 107–127. doi: 10.1016/S0341-8162(98)00072-1
Cantón, Y., Solé-Benet, A., Asensio, C., Chamizo, S., and Puigdefábregas, J. (2009). Aggregate stability in range sandy loam soils relationships with runoff and erosion. Catena 77, 192–199. doi: 10.1016/j.catena.2008.12.011
Caporaso, J. G., Lauber, C. L., Walters, W. A., Berg-Lyons, D., Lozupone, C. A., Turnbaugh, P. J., et al. (2011). Global patterns of 16S rRNA diversity at a depth of millions of sequences per sample. Proc. Natl. Acad. Sci. U.S.A. 108, (Suppl. 1), 4516–4522. doi: 10.1073/pnas.1000080107
Chamizo, S., Mugnai, G., Rossi, F., Certini, G., and De Philippis, R. (2018). Cyanobacteria inoculation improves soil stability and fertility on different textured soils: gaining insights for applicability in soil restoration. Front. Environ. Sci. 6:49. doi: 10.3389/fenvs.2018.00049
Chenu, C. (1995). Extracellular polysaccharides: an interface between microorganisms and soil constituents. Environ. Impact Soil Component Interact. 1, 217–233.
Chenu, C., and Cosentino, D. (2011). “Microbial regulation of soil structural dynamics,” in The Architecture and Biology of Soils: Life in Inner Space, eds K. Ritz and I. Young (Wallingford: CABI), 37–70. doi: 10.1079/9781845935320.0037
Costa, O. Y., Raaijmakers, J. M., and Kuramae, E. E. (2018). Microbial extracellular polymeric substances: ecological function and impact on soil aggregation. Front. Microbiol. 9:1636. doi: 10.3389/fmicb.2018.01636
Davinic, M., Fultz, L. M., Acosta-Martinez, V., Calderón, F. J., Cox, S. B., Dowd, S. E., et al. (2012). Pyrosequencing and mid-infrared spectroscopy reveal distinct aggregate stratification of soil bacterial communities and organic matter composition. Soil Biol. Biochem. 46, 63–72. doi: 10.1016/j.soilbio.2011.11.012
De Mendiburu, F. (2019). agricolae: Statistical Procedures for Agricultural Research. R Package Version 1.3-1. Available online at: https://CRAN.R-project.org/package=agricolae (accessed November 1, 2019).
Ding, G. C., Pronk, G. J., Babin, D., Heuer, H., Heister, K., Kögel-Knabner, I., et al. (2013). Mineral composition and charcoal determine the bacterial community structure in artificial soils. FEMS Microbiol. Ecol. 86, 15–25. doi: 10.1111/1574-6941.12070
Dubois, M., Gilles, K. A., Hamilton, J. K., Rebers, P. T., and Smith, F. (1956). Colorimetric method for determination of sugars and related substances. Anal. Chem. 28, 350–356. doi: 10.1021/ac60111a017
Durmaz, B., and Sanin, F. D. (2001). Effect of carbon to nitrogen ratio on the composition of microbial extracellular polymers in activated sludge. Water Sci. Technol. 44, 221–229. doi: 10.2166/wst.2001.0626
Ebrahimi, A., and Or, D. (2015). Hydration and diffusion processes shape microbial community organization and function in model soil aggregates. Water Resour. Res. 51, 9804–9827. doi: 10.1002/2015WR017565
Eisenhauer, N., Bowker, M. A., Grace, J. B., and Powell, J. R. (2015). From patterns to causal understanding: structural equation modeling (SEM) in soil ecology. Pedobiologia 58, 65–72. doi: 10.1016/j.pedobi.2015.03.002
Fierer, N. (2017). Embracing the unknown: disentangling the complexities of the soil microbiome. Nat. Rev. Microbiol. 15:579. doi: 10.1038/nrmicro.2017.87
Flemming, H. C., and Wuertz, S. (2019). Bacteria and archaea on Earth and their abundance in biofilms. Nat. Rev. Microbiol. 17:247. doi: 10.1038/s41579-019-0158-9
Flemming, H. C., Neu, T. R., and Wingender, J. (eds) (2016). The perfect Slime: Microbial Extracellular Polymeric Substances (EPS). London: IWA publishing.
Goberna, M., Pascual, J. A., Garcia, C., and Sánchez, J. (2007). Do plant clumps constitute microbial hotspots in semiarid Mediterranean patchy landscapes? Soil Biol. Biochem. 39, 1047–1054. doi: 10.1016/j.soilbio.2006.11.015
Gyssels, G., Poesen, J., Bochet, E., and Li, Y. (2005). Impact of plant roots on the resistance of soils to erosion by water: a review. Progr. Phys. Geogr. 29, 189–217. doi: 10.1191/0309133305pp443ra
Hemingway, J. D., Hilton, R. G., Hovius, N., Eglinton, T. I., Haghipour, N., Wacker, L., et al. (2018). Microbial oxidation of lithospheric organic carbon in rapidly eroding tropical mountain soils. Science 360, 209–212. doi: 10.1126/science.aao6463
Hiltner, L. (1904). Über neuere Erfahrungen und Probleme auf dem Gebiete der Bodenbakteriologie unter besonderer Berücksichtigung der Gründüngung und Brache. Arb. DLG 98, 59–78.
Hothorn, T., Bretz, F., and Westfall, P. (2008). Simultaneous inference in general parametric models. Biometr. J. 50, 346–363. doi: 10.1002/bimj.200810425
Juggins, S. (2017). rioja: Analysis of Quaternary Science Data, R package version (0.9-21). Available online at: http://cran.r-project.org/package=rioja (accessed November 1, 2019).
Klappenbach, J. A., Dunbar, J. M., and Schmidt, T. M. (2000). rRNA operon copy number reflects ecological strategies of bacteria. Appl. Environ. Microbiol. 66, 1328–1333. doi: 10.1128/AEM.66.4.1328-1333.2000
Kraemer, F. B., Hallett, P. D., Morrás, H., Garibaldi, L., Cosentino, D., Duval, M., et al. (2019). Soil stabilisation by water repellency under no-till management for soils with contrasting mineralogy and carbon quality. Geoderma 355:113902. doi: 10.1016/j.geoderma.2019.113902
Lazaro, R., Rodrigo, F. S., Gutiérrez, L., Domingo, F., and Puigdefábregas, J. (2001). Analysis of a 30-year rainfall record (1967–1997) in semi–arid SE Spain for implications on vegetation. J. Arid Environ. 48, 373–395. doi: 10.1006/jare.2000.0755
Le Bissonnais, Y. L. (1996). Aggregate stability and assessment of soil crustability and erodibility: I. Theory and methodology. Eur. J. Soil Sci. 47, 425–437. doi: 10.1111/j.1365-2389.1996.tb01843.x
Lee, Z. M. P., Bussema, C. III, and Schmidt, T. M. (2008). rrn DB: documenting the number of rRNA and tRNA genes in bacteria and archaea. Nucleic Acids Res. 37, (Suppl. 1), D489–D493. doi: 10.1093/nar/gkn689
Lehmann, A., Zheng, W., and Rillig, M. C. (2017). Soil biota contributions to soil aggregation. Nat. Ecol. Evol. 1:1828. doi: 10.1038/s41559-017-0344-y
Liu, L., Zhu, C., Fan, M., Chen, C., Huang, Y., Hao, Q., et al. (2015). Oxidation and degradation of graphitic materials by naphthalene-degrading bacteria. Nanoscale 7, 13619–13628. doi: 10.1039/c5nr02502h
Maestre, F. T., Huesca, M., Zaady, E., Bautista, S., and Cortina, J. (2002). Infiltration, penetration resistance and microphytic crust composition in contrasted microsites within a Mediterranean semi-arid steppe. Soil Biol. Biochem. 34, 895–898. doi: 10.1016/S0038-0717(02)00021-4
Marchus, K. A., Blankinship, J. C., and Schimel, J. P. (2018). Environmental controls on extracellular polysaccharide accumulation in a California grassland soil. Soil Biol. Biochem. 125, 86–92. doi: 10.1016/j.soilbio.2018.07.009
Martin, M. (2011). Cutadapt removes adapter sequences from high-throughput sequencing reads. EMBnet J 17:10. doi: 10.14806/ej.17.1.200
McMurdie, P. J., and Holmes, S. (2013). phyloseq: An R package for reproducible interactive analysis and graphics of microbiome census data. PLoS One 8:e61217. doi: 10.1371/journal.pone.0061217
More, T. T., Yadav, J. S. S., Yan, S., Tyagi, R. D., and Surampalli, R. Y. (2014). Extracellular polymeric substances of bacteria and their potential environmental applications. J. Environ. Manag. 144, 1–25. doi: 10.1016/j.jenvman.2014.05.010
Mummey, D., Holben, W., Six, J., and Stahl, P. (2006). Spatial stratification of soil bacterial populations in aggregates of diverse soils. Microb. Ecol. 51, 404–411. doi: 10.1007/s00248-006-9020-5
Muneer, M., and Oades, J. M. (1989). The role of Ca-organic interactions in soil aggregate stability. III. Mechanisms and models. Soil Res. 27, 411–423.
Nadell, C. D., Drescher, K., and Foster, K. R. (2016). Spatial structure, cooperation and competition in biofilms. Nat. Rev. Microbiol. 14:589. doi: 10.1038/nrmicro.2016.84
Neuwirth, E. (2014). RColorBrewer: ColorBrewer Palettes. R package version 1.1-2. Available online at: https://CRAN.R-project.org/package=RColorBrewer (accessed November 1, 2019).
Nunan, N., Schmidt, H., and Raynaud, X. (2020). The ecology of heterogeneity: soil bacterial communities and C dynamics. Philos. Trans. R. Soc. B 375:20190249. doi: 10.1098/rstb.2019.0249
Nunes, I., Jacquiod, S., Brejnrod, A., Holm, P. E., Johansen, A., Brandt, K. K., et al. (2016). Coping with copper: legacy effect of copper on potential activity of soil bacteria following a century of exposure. FEMS Microbiol. Ecol. 92:fiw175. doi: 10.1093/femsec/fiw175
Oksanen, J., Guillaume, A., Blanchet, F., Friendly, M., Kindt, R., Legendre, P., et al. (2019). vegan: Community Ecology Package. R package version 2.5-5. Available online at: https://CRAN.R-project.org/package=vegan (accessed November 1, 2019).
Omoike, A., and Chorover, J. (2006). Adsorption to goethite of extracellular polymeric substances from Bacillus subtilis. Geochim. Cosmochim. Acta 70, 827–838. doi: 10.1016/j.gca.2005.10.012
Pelissari, C., Guivernau, M., Viñas, M., Souza, S. S., de García, J., Sezerino, P. H., et al. (2017). Unraveling the active microbial populations involved in nitrogen utilization in a vertical subsurface flow constructed wetland treating urban wastewater. Sci. Total Environ. 584-585, 642–650. doi: 10.1016/j.scitotenv.2017.01.091
Peña-Angulo, D., Nadal-Romero, E., González-Hidalgo, J. C., Albaladejo, J., Andreu, V., Bagarello, V., et al. (2019). Spatial variability of the relationships of runoff and sediment yield with weather types throughout the Mediterranean basin. J. Hydrol. 571, 390–405. doi: 10.1016/j.jhydrol.2019.01.059
Philippot, L., Raaijmakers, J. M., Lemanceau, P., and Van Der Putten, W. H. (2013). Going back to the roots: the microbial ecology of the rhizosphere. Nat. Rev. Microbiol. 11:789. doi: 10.1038/nrmicro3109
Piccolo, A., and Mbagwu, J. S. (1999). Role of hydrophobic components of soil organic matter in soil aggregate stability. Soil Sci. Soc. Am. J. 63, 1801–1810. doi: 10.2136/sssaj1999.6361801x
Pinheiro, J., Bates, D., DebRoy, S., and Sarkar, D. (2018). nlme: Linear and Nonlinear Mixed Effects Models. R package version 3.1-137. Available online at: https://CRAN.R-project.org/package=nlme (accessed November 1, 2019).
Puigdefábregas, J., Alonso, J. M., Delgado, L., Domingo, F., Cueto, M., Gutiérrez, L., et al. (1996). “The Rambla Honda field site: interactions of soil and vegetation along a catena in semi-arid southeast Spain,” in Mediterrean Desertification and Land Use, eds C. J. Brand and J. B. Thornes (Chichester: John Wiley & Sons, Ltd).
Puigdefábregas, J., Sole, A., Gutierrez, L., Del Barrio, G., and Boer, M. (1999). Scales and processes of water and sediment redistribution in drylands: results from the Rambla Honda field site in Southeast Spain. Earth Sci. Rev. 48, 39–70. doi: 10.1016/S0012-8252(99)00046-X
Quast, C., Pruesse, E., Yilmaz, P., Gerken, J., Schweer, T., Yarza, P., et al. (2013). The SILVA ribosomal RNA gene database project: improved data processing and web-based tools. Nucleic Acids Res. 41, D590–D596. doi: 10.1093/nar/gks1219
Queralt-Mitjans, I., Domingo, F., and Sole-Benet, A. (1993). The influence of local sources on the mineral content of bulk deposition over an altitudinal gradient in the Filabres Range (SE Spain). J. Geophys. Res. 98, 16761–16768. doi: 10.1029/93JD01281
R Core Team (2018). R: A Language and Environment for Statistical Computing. Vienna: R Foundation for Statistical Computing.
Redmile-Gordon, M. A., Brookes, P. C., Evershed, R. P., Goulding, K. W. T., and Hirsch, P. R. (2014). Measuring the soil-microbial interface: extraction of extracellular polymeric substances (EPS) from soil biofilms. Soil Biol. Biochem. 72, 163–171. doi: 10.1016/j.soilbio.2014.01.025
Requena, N., Perez-Solis, E., Azcón-Aguilar, C., Jeffries, P., and Barea, J. M. (2001). Management of indigenous plant-microbe symbioses aids restoration of desertified ecosystems. Appl. Environ. Microbiol. 67, 495–498. doi: 10.1128/AEM.67.2.495-498.2001
Robinson, M. D., McCarthy, D. J., and Smyth, G. K. (2010). edgeR: a Bioconductor package for differential expression analysis of digital gene expression data. Bioinformatics 26, 139–140. doi: 10.1093/bioinformatics/btp616
Rodríguez-Caballero, E., Chamizo, S., Roncero-Ramos, B., Román, R., and Cantón, Y. (2018). Runoff from biocrust: a vital resource for vegetation performance on Mediterranean steppes. Ecohydrology 11:e1977. doi: 10.1002/eco.1977
Rosseel, Y. (2012). lavaan: an R package for structural equation modeling. J. Stat. Softw. 48, 1–36.
Russell, V. L. (2016). Least-squares means: the R package lsmeans. J. Stat. Softw. 69, 1–33. doi: 10.18637/jss.v069.i01
Sandhya, V., and Ali, S. Z. (2015). The production of exopolysaccharide by Pseudomonas putida GAP-P45 under various abiotic stress conditions and its role in soil aggregation. Microbiology 84, 512–519. doi: 10.1134/S0026261715040153
Schimel, J. P. (2018). Life in dry soils: effects of drought on soil microbial communities and processes. Ann. Rev. Ecol. Evol. Syst. 49, 409–432. doi: 10.1146/annurev-ecolsys-110617-062614
Simpson, G. L. (2019). permute: Functions for Generating Restricted Permutations of Data. R package version 0.9-5. Available online at: https://CRAN.R-project.org/package=permute (accessed November 1, 2019).
Six, J. AET, Elliott, E. T., and Paustian, K. (2000). Soil macroaggregate turnover and microaggregate formation: a mechanism for C sequestration under no-tillage agriculture. Soil Biol. Biochem. 32, 2099–2103. doi: 10.1016/S0038-0717(00)00179-6
Six, J., Bossuyt, H., Degryze, S., and Denef, K. (2004). A history of research on the link between (micro) aggregates, soil biota, and soil organic matter dynamics. Soil Tillage Res. 79, 7–31. doi: 10.1016/j.still.2004.03.008
Sprent, J. I. (2005). “Nitrogen in soils symbiotic fixation,” in Encyclopedia of Soils in the Environment, ed. D. Hillel (Amsterdam: Elsevier), 46–56.
Stieglmeier, M., Klingl, A., Alves, R. J. E., Rittmann, S. K.-M. R., Melcher, M., Leisch, N., et al. (2014). Nitrososphaera viennensis gen. nov., sp. nov., an aerobic and mesophilic, ammonia-oxidizing archaeon from soil and a member of the archaeal phylum Thaumarchaeota. Int. J. Syst. Evol. Microbiol. 64(Pt 8), 2738–2752. doi: 10.1099/ijs.0.063172-0
Sundberg, C., Al-Soud, W. A., Larsson, M., Alm, E., Yekta, S. S., Svensson, B. H., et al. (2013). 454 pyrosequencing analyses of bacterial and archaeal richness in 21 full-scale biogas digesters. FEMS Microbiol. Ecol. 85, 612–626. doi: 10.1111/1574-6941.12148
Suzuki, M. T., Taylor, L. T., and DeLong, E. F. (2000). Quantitative analysis of small-subunit rRNA genes in mixed microbial populations via 5’-nuclease assays. Appl. Environ. Microbiol. 66, 4605–4614. doi: 10.1128/aem.66.11.4605-4614.2000
Tecon, R., and Or, D. (2017). Biophysical processes supporting the diversity of microbial life in soil. FEMS Microbiol. Rev. 41, 599–623. doi: 10.1093/femsre/fux039
Tisdall, J. M. (1996). “Formation of soil aggregates and accumulation of soil organic matter,” in Structure and Organic Matter Storage in Agricultural Soils, eds M. R. Carter and B. A. Stewart (Boca Raton, FL: Lewis), 57–96.
Tisdall, J. M., and Oades, J. (1982). Organic matter and water-stable aggregates in soils. J. Soil Sci. 33, 141–163. doi: 10.1111/j.1365-2389.1982.tb01755.x
Totsche, K. U., Amelung, W., Gerzabek, M. H., Guggenberger, G., Klumpp, E., Knief, C., et al. (2018). Microaggregates in soils. J. Plant Nutr. Soil Sci. 181, 104–136. doi: 10.1002/jpln.201600451
Tsoy, O. V., Ravcheev, D. A., Èuklina, J., and Gelfand, M. S. (2016). Nitrogen fixation and molecular oxygen: comparative genomic reconstruction of transcription regulation in Alphaproteobacteria. Front. Microbiol. 7:1343. doi: 10.3389/fmicb.2016.01343
Valentin, C., d’Herbès, J. M., and Poesen, J. (1999). Soil and water components of banded vegetation patterns. Catena 37, 1–24. doi: 10.1016/S0341-8162(99)00053-3
Veen, C., Fry, E., ten Hooven, F., Kardol, P., Morrien, E., and De Long, J. R. (2019). The role of plant litter in driving plant-soil feedbacks. Front. Environ. Sci. 7:168. doi: 10.3389/fenvs.2019.00168
Verheijen, F. G. A., and Cammeraat, L. H. (2007). The association between three dominant shrub species and water repellent soils along a range of soil moisture contents in semi-arid Spain. Hydrol. Process. 21, 2310–2316. doi: 10.1002/hyp.6760
Vogel, C., Babin, D., Pronk, G. J., Heister, K., Smalla, K., and Kögel-Knabner, I. (2014). Establishment of macro-aggregates and organic matter turnover by microbial communities in long-term incubated artificial soils. Soil Biol. Biochem. 79, 57–67. doi: 10.1016/j.soilbio.2014.07.012
Wang, S., Redmile-Gordon, M., Mortimer, M., Cai, P., Wu, Y., Peacock, C. L., et al. (2019). Extraction of extracellular polymeric substances (EPS) from red soils (Ultisols). Soil Biol. Biochem. 135, 283–285. doi: 10.1016/j.soilbio.2019.05.014
Warnes, G. R., Bolker, B., Bonebakker, L., Gentleman, R., Huber, W., Liaw, A., et al. (2019). gplots: Various R Programming Tools for Plotting Data. R package version 3.0.1.1. Available online at: https://CRAN.R-project.org/package=gplots (accessed November 1, 2019).
Werb, M., García, C. F., Bach, N. C., Grumbein, S., Sieber, S. A., Opitz, M., et al. (2017). Surface topology affects wetting behavior of Bacillus subtilis biofilms. NPJ Biofilms Microb. 3:11. doi: 10.1038/s41522-017-0018-1
Wilson, M. C., Mori, T., Rückert, C., Uria, A. R., Helf, M. J., Takada, K., et al. (2014). An environmental bacterial taxon with a large and distinct metabolic repertoire. Nature 506, 58–62. doi: 10.1038/nature12959
World Reference Base for Soil Resources [WRB] (2014). IUSS Working Group WRB. 2014. International Soil Classification System for Naming Soils and Creating Legends for Soil Maps. World Soil Resources Reports No. 106. Rome: FAO.
Yu, Y., Lee, C., Kim, J., and Hwang, S. (2005). Group-specific primer and probe sets to detect methanogenic communities using quantitative real-time polymerase chain reaction. Biotechnol. Bioeng. 89, 670–678.
Zethof, J. H. T., Leue, M., Vogel, C., Stoner, S. W., and Kalbitz, K. (2019). Identifying and quantifying geogenic organic carbon in soils – the case of graphite. Soil 5, 383–398. doi: 10.5194/soil-5-383-2019
Keywords: EPS, Illumina amplicon sequencing, 16S rRNA gene, Macrochloa tenacissima, Anthyllis cytisoides, slightly alkaline soils
Citation: Zethof JHT, Bettermann A, Vogel C, Babin D, Cammeraat ELH, Solé-Benet A, Lázaro R, Luna L, Nesme J, Woche SK, Sørensen SJ, Smalla K and Kalbitz K (2020) Prokaryotic Community Composition and Extracellular Polymeric Substances Affect Soil Microaggregation in Carbonate Containing Semiarid Grasslands. Front. Environ. Sci. 8:51. doi: 10.3389/fenvs.2020.00051
Received: 12 January 2020; Accepted: 14 April 2020;
Published: 11 June 2020.
Edited by:
Maria Luz Cayuela, Spanish National Research Council, SpainReviewed by:
Alix Vidal, Technical University of Munich, GermanyAlessandro Florio, Institut National de Recherche pour l’Agriculture, l’Alimentation et l’Environnement (INRAE), France
Copyright © 2020 Zethof, Bettermann, Vogel, Babin, Cammeraat, Solé-Benet, Lázaro, Luna, Nesme, Woche, Sørensen, Smalla and Kalbitz. This is an open-access article distributed under the terms of the Creative Commons Attribution License (CC BY). The use, distribution or reproduction in other forums is permitted, provided the original author(s) and the copyright owner(s) are credited and that the original publication in this journal is cited, in accordance with accepted academic practice. No use, distribution or reproduction is permitted which does not comply with these terms.
*Correspondence: Jeroen H. T. Zethof, jeroen.zethof@tu-dresden.de; Antje Bettermann, antje.bettermann@julius-kuehn.de
†These authors have contributed equally to this work and share first authorship