An Optimal Scheduling Strategy for Integrated Energy Systems Using Demand Response
 Shunfu Lin
 Mengchen Lin
 Yunwei Shen
 Dongdong Li
- School of Electrical Engineering, Shanghai University of Electric Power, Shanghai, China
With the development of power-to-gas (P2G) technology and demand-response (DR) technology, new ideas have been proposed for research into the scheduling strategy for integrated energy systems (IER). Focusing on wind power consumption, this paper proposes a day-ahead scheduling strategy for IER with P2G equipment, taking into consideration DR. On the energy consumption side, a demand elasticity matrix is introduced to describe the user’s participation in DR. On the energy supply side, P2G equipment is introduced to improve the coupling of electricity and natural gas, and scenario generation and reduction techniques are introduced to describe the uncertainty of renewable energy output. The maximum net income of the IER is set as the objective function. The optimal scheduling scheme of the system was obtained by solving the scheduling model. The results indicate that the proposed strategy outperforms the traditional operation and can achieve peak cutting and valley filling, maximize the net income of the IER operators, promote the consumption of renewable energy and improve the energy utilization rate of the system.
1 Introduction
According to the latest report of the National Energy Administration, the proportion of renewable energy in China has increased significantly, but the accompanying problem of renewable energy consumption has not been solved. The main goal of the new integrated energy system (IES) is to improve energy utilization (Yang et al., 2019). At present, it is important to achieve multi-energy complementarity and improve system flexibility and energy utilization. Determining the optimal scheduling strategy of the IES has become crucial. The IES involves many devices, and the operation of different subsystems varies greatly. The high penetration of renewable energy increases the difficulty of optimizing system scheduling. Taking into account as many factors as possible to develop an economic, efficient and environmentally friendly scheduling scheme has been a popular line of research in recent years. Power-to-gas (P2G) and demand-response (DR) technology is becoming increasingly mature, which brings new ideas for the research into scheduling strategies for the IES.
At present, most of the research on the optimal scheduling of the IES assumes an economic perspective. The system scheduling strategy model is established with the goal of minimum cost or maximum benefit, and the output of each unit under this goal is obtained by solving the model. A large number of achievements have been made in the research into optimal dispatching of the IES (Gu et al., 2017a; Ran et al., 2017). The researchers in (Hongjie et al., 2015) describe the effect of peak cutting and valley filling by the square of the net load change rate in adjacent periods. The economic conversion coefficient is introduced into the economic objective function of comprehensive cost. This strategy was shown to be effective in stabilizing net load fluctuation and improving consumption capacity. Studies (Zhinong et al., 2017; Lin et al., 2019; Khani and Farag, 2018), respectively, introduce the penalty mechanism into the objective function and constraint condition to coordinate the maximum wind power consumption and the minimum low-carbon economic cost. In (Zhinong et al., 2017), an improved successive linearization method is proposed, which speeds up the convergence effect and improves the solution efficiency. In (Khani and Farag, 2018), the utilization rate of energy is improved. Studies (Liu et al., 2020; Ran et al., 2017) introduce the concept of an energy hub and establish an optimization model taking into account the characteristics of the conversion between electricity, gas and thermal energy. In (Liu et al., 2020), a day-to-day optimal economic dispatching model is established to minimize the operation cost of the micro-energy network. In (Ran et al., 2017) a two-tier optimization model is established that not only considers the comprehensive energy cost, but also takes into account the energy efficiency, which plays a positive role in the economic operation and renewable energy consumption.
The studies mentioned above, however, do not consider the impact of DR on the scheduling. In the scheduling of the IES, DR technology has been vigorously promoted (Gu et al., 2017b; Nolan and Malley, 2015). Many scholars have taken into account DR in their research into the scheduling strategy of the IES (Wang et al., 2018; YangBotterud et al., 2020; Zhang et al., 2021). The scheduling model in (Wang et al., 2018; Huang et al., 2022) takes into account the dynamic characteristics of the water temperature of the heating pipeline, transmission delay and loss, and the conversion characteristics of electric heating demand, which can achieve the time translation of the power and heat supply-and-demand curve and the optimal substitution between power and heat energy. In (Cui et al., 2020) a ground-source heat pump is introduced and a double-layer optimization model of source-load coordination is proposed. The upper model adopts price-based DR to adjust electricity load, and introduces user satisfaction factor. The lower model adopts incentive DR to adjust heat load. The researchers in (HongZhong et al., 2019) proposed the concept of generalized energy storage resources in the system, making full use of energy coupling and complementarity. By integrating and using generalized energy storage resources, the operation cost can be reduced and the consumption level can be improved while ensuring the safe operation of the system. Studies (Ding et al., 2021; Zhang et al., 2021) propose a comprehensive DR model for electricity, gas and heat loads to strengthen the coupling relationship between the three, and realize the horizontal time transfer and vertical substitution of the three loads. The studies described here, however, do not take into account the impact of the uncertainty of renewable energy output on dispatching.
To overcome these problems, this paper proposes a day-ahead scheduling strategy for IES that takes into account DR. Based on the traditional scheduling model, it makes the following additions:
(1) On the energy consumption side, a demand elasticity matrix is introduced to describe the user’s participation in the DR;
(2) On the energy supply side, P2G equipment is introduced to improve the electrical pneumatic coupling of the IES;
(3) Scenario generation and reduction techniques are introduced to describe the uncertainty of renewable energy output.
The maximum net income of the IES operators is set as the objective function. The optimal scheduling scheme of the system is obtained by solving the scheduling model. The results indicate that the proposed strategy outperforms the traditional operation and can achieve peak cutting and valley filling, maximize the net income of the system operators, promote the consumption of renewable energy and improve the energy utilization rate of the system.
2 Integrated Energy System Architecture
In this paper, the IES includes the following units: wind turbine (WT), photovoltaic (PV) unit, micro-turbine (MT), heat recovery unit (REC), gas boiler (GB), electric refrigeration (EC) unit, electrical boiler (EH), absorption refrigerator (AC), P2G equipment, heat exchanger (HX), battery (BT), natural gas storage tank (NGS), cold storage tank (CS) and heat storage tank (HS).
The IES framework is shown in Figure 1. The green line represents the flow direction of electric energy; the red lines represent the direction of natural gas transmission; and the blue and yellow lines represent the direction of cold and heat transfer, respectively. The left virtual box represents the energy source of the system, including distributed renewable energy, an external power grid and a natural gas network. The right virtual box represents the user’s load, including electricity load, natural gas load, cold load and heat load. Electricity can be converted into natural gas through P2G equipment. The electric refrigeration unit and electrical boiler convert electric energy into cold energy and heat energy, respectively. The micro-turbine consumes natural gas to generate electricity. Heat energy produced in the process is recovered by the heat recovery unit and part of the heat is supplied to the heat exchanger. The remaining heat is supplied to the absorption refrigerator to convert into cold energy. The gas boiler consumes natural gas to produce heat. When energy is abundant, energy storage devices are used to store energy for occasional needs.
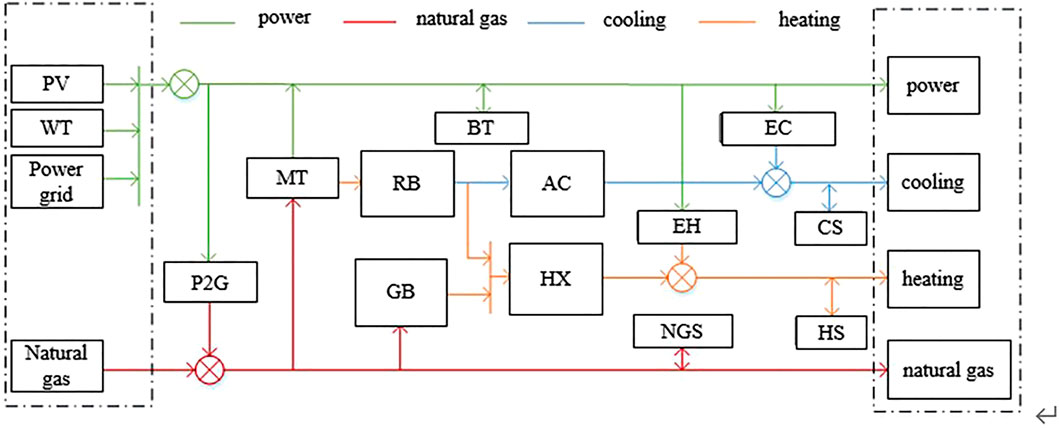
FIGURE 1. The integrated energy system framework.
3 Scheduling Model of the Integrated Energy System
3.1 Demand Response
The price-based DR uses time-of-use electricity price to guide users to adjust load demand to achieve peak cutting and valley filling, thereby improving the electricity load characteristic. In the case of time-of-use electricity price, the change of load is expressed by the price elasticity matrix, which is based on the price elasticity coefficient of electricity. The elasticity coefficient is the ratio of the rate of change in demand to the rate of price change:
where Qj and ΔQj represent electricity demand and its adjustment, respectively; and Pj and ΔPj represent electricity price and its adjustment, respectively. If i = j, εij denotes the coefficient of self-elasticity, otherwise the cross-elastic coefficient.
According to the price elasticity coefficient, the change of electricity load expressed by the price elasticity matrix can be obtained as follows:
3.2 Uncertainty of Renewable Energy Output
Renewable energy output is affected by many factors and presents uncertainty. To reduce the impact of uncertainty on the scheduling of the IES, this paper uses an autoregressive moving average model to generate scenarios of renewable energy output. The autoregressive moving average model is as follows:
where ai and bi represent the autoregressive coefficient and moving average coefficient, respectively; R and M represent the autoregressive order and moving average order, respectively; and ei represents independent white noise and follows the normal distribution.
The steps of scenario reduction are as follows:
Step 1: Calculate the geometric distance between each pair of scenes in the scene set S1; Step 2: Calculate the sum of the distances between each scene and other scenes, find the scene with the smallest value and record it as C1; Step 3: Merge the scenes C1 and C2, which is closest to C1 by geometric distance, into a new scene and record it as scene C3. The probability of scene C3 is the sum of the probabilities of scenes C1 and C2; Step 4: Delete scenes C1 and C2, then add scene C3 to the scene set S1 to generate a new scene set and record it as S2.
The new scene set S2 has one fewer scene than S1. The operations above are repeated until the number of scenes meets the requirement, and then the scene reduction can be realized.
3.3 Objective Function
The net income of the operator of the IES includes the revenue from the sale of energy, the cost of purchasing energy and the operation cost of the equipment. The formula is as follows:
where RE represents the revenue from the sale of energy to users; CBUY represents the cost to the operator of purchasing energy; and COP represents the operation cost of the equipment. Eqs 5–7 provide more details:
where RDL and RGL represent the coefficients of return on electricity and gas sales, respectively; PtDL and QtGL represent the amount of electricity and gas purchased by consumers at time t, respectively; Rp2g represents the coefficients of P2G equipment; and QtP2G represents the amount of gas converted by the P2G equipment.
where ctbuy,dl and ctbuy,gl represent the unit price of electricity and gas purchased by the system operator at time t, respectively; and PtPBUY and QtNGBUY represent the amount of electricity and gas purchased by system operators at time t, respectively.
where cpv/wt/mt/bt/ng/cs/hs represent the coefficients of the operating costs of the equipment corresponding to the subscript; PtMT represents the micro-turbine output at time t; PtPV and PtWT represent the photovoltaic and wind turbine output at time t, respectively; and PtBT/NG/CS/HS_C represent the charging power of energy storage equipment corresponding to the subscript; and PtBT/NG/CS/HS_D represent the discharging power of energy storage equipment corresponding to the subscript.
3.4 Constraint Conditions
3.4.1 Constraints on Energy Supply Equipment
The energy supply equipment includes a gas boiler and cogeneration device. The operation of the energy supply equipment must meet certain equation constraints and inequality constraints:
where COPGB represents the conversion efficiency of the gas boiler;
3.4.2 Constraints on Energy Conversion Equipment
The energy conversion equipment includes an electrical chiller, an absorption chiller, an electrical heater and a P2G device. The operation of the energy conversion equipment must meet certain equation constraints and inequality constraints.
where COPEC/EH/AC/P2G represents the conversion efficiency of the equipment corresponding to the subscript. As shown in Eq. 11, the output power of the electrical chiller, electrical heater, absorption chiller and P2G device meet the upper and lower limit constraints.
3.4.3 Constraints on the Battery
The operating condition of battery can be expressed by the stored energy state. The mathematical model of the battery is as follows:
where
To avoid overcharging and discharging and thus shortening the service life of the battery, the following constraints are met during operation:
where Xbt,c and Xbt,c are binary variables representing states of charge and discharge, respectively. The output power and the stored energy state of the battery meet the upper and lower limit constraints, respectively. N represents the maximum number of times the battery can be charged and discharged.
3.4.4 Constraints on the Heat Storage Tank
The mathematical model of the heat storage equipment is as follows:
where
To avoid excessive absorbing and releasing and thus shortening the service life of the heat storage equipment, the following constraints are met during operation:
where Xhs,c and Xhs,c are binary variables representing the endothermic and exothermic state of the heat storage equipment, respectively. The output power and the stored energy state of the heat storage equipment meet the upper and lower limit constraints, respectively.
Since the mathematical model and the constraints of the natural gas storage tank and cold storage tank in this paper are the same as those of the equipment heat storage tank, the explanation and description are not repeated here.
3.4.5 Power Balance Constraint Conditions
Power balance of four kinds of energy should always be satisfied during equipment operation. As shown in the following formula:
where PP2G/EC/EH represents the power consumption of the equipment corresponding to the subscript; QMT/GB_EN represents the natural gas consumption of the equipment corresponding to the subscript; QP2G_EX represents the natural gas supply of the P2G equipment; HREC/EH/GB_EX represents the heating power of the equipment corresponding to the subscript; HEC/AC_EX represents the refrigeration power of the equipment corresponding to the subscript; and HCL/HL represents the cooling and heating load.
4 Case Study
For this study, a park-level IES as an example, four cases were set up, as shown in Table 1. Case 1 does not take into account any factors. Case 2 takes into account the introduction of P2G equipment. In Case 3, the influence of DR is considered as well as the P2G equipment. Based on Case 3, Case 4 introduces scenario generation and reduction to describe the uncertainty of renewable energy output.
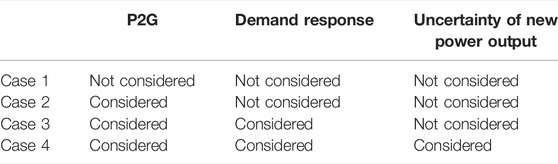
TABLE 1. Description of the four cases.
4.1 Basic Data
The economic parameters of the IER and power grid involved in this study are shown in Table 2, and the operating parameters of the equipment in the IER are shown in Table 3 (Gu et al., 2020).
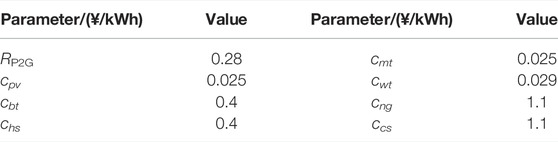
TABLE 2. The economic parameters of the IER and power grid.
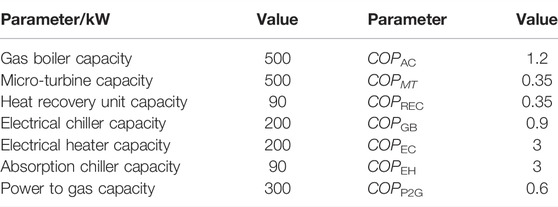
TABLE 3. The operating parameters of the equipment in the IER.
The electricity, natural gas, cooling and heating load curves are shown on the left of Figure 2, and the wind turbine and photovoltaic outputs are shown on the right.
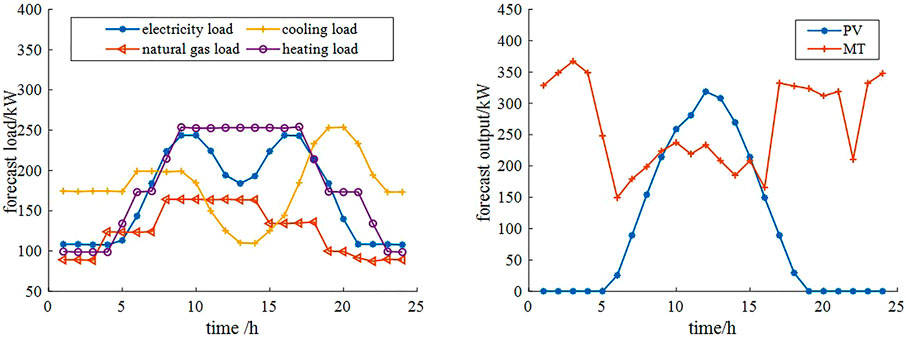
FIGURE 2. The load curves (left) and the wind turbine and photovoltaic output curves (right).
4.2 Economic Analysis
The CPLEX solver in GAMS is used to solve the optimal scheduling model. Figure 3 shows the income and cost details of the IER operators in the four cases.
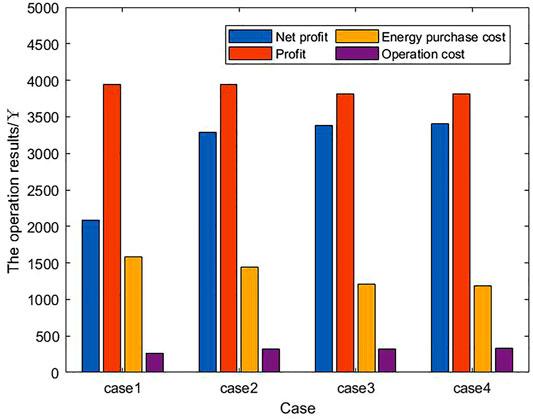
FIGURE 3. Operation results of the four cases.
After the introduction of the P2G equipment (Case 2), the operation cost increased by ¥50.40, the energy purchase cost of the system decreased by ¥139.57 and the net income increased by ¥1,197.13. These changes occurred because the surplus wind turbine and photovoltaic output can be converted into natural gas through the P2G equipment. It can not only solve the problem of renewable energy consumption, but also reduce the cost of natural gas purchased by the system from the natural gas network and increase the net income of the system.
Compared with Case 2, the system revenue of Case 3 decreased by ¥129.72, because the user transferred the load during the period of high electricity price to the period of low electricity price after participating in the DR. The energy purchase cost was reduced by ¥235.58, because after the user participated in the DR, the system achieved peak cutting and valley filling, and the energy supply pressure was reduced. The cost of purchasing electricity and natural gas from the external power grid and the natural gas network was therefore reduced. The operating cost increased by ¥7.56, and the net income increased by ¥89.26. Compared with Case 1, the net income of Case 3 increased by ¥1,286.39.
Compared with Case 3, the energy purchase cost of Case 4 decreased by ¥26.37, the operating cost increased by ¥2 and the net income increased by ¥24.39. These changes occurred because Case 4 takes into consideration the uncertainty of renewable energy output. It can further improve the utilization of renewable energy and reduce the purchase cost of external energy. Compared with Case 1, the net income of case 4 increased by ¥1,310.78.
The results presented above show that Case 4 (i.e., the proposed strategy), which introduces P2G equipment and takes into account the user’s participation in the DR and the uncertainty of wind turbine and photovoltaic output, is economical and greatly improves the net income of the system.
4.3 Scheduling Plan Analysis
Figure 4 shows the load curves after users participate in the DR in Case 4. Affected by the energy price, users transfer part of the load during the period of high electricity prices to the period of electricity prices, which has a positive effect on peak cutting and valley filling.
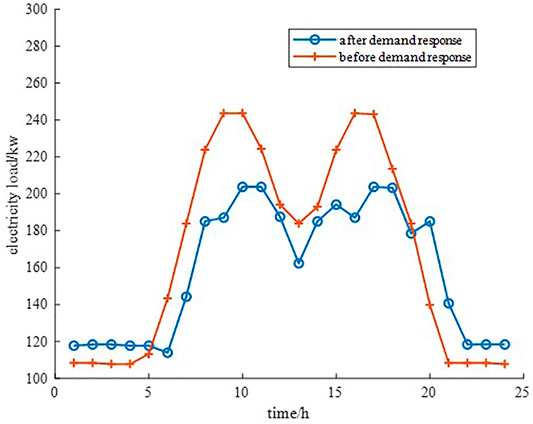
FIGURE 4. Load curves after the demand response in Case 4.
Figure 5 shows 200 output curves of the wind turbine, five output curves after scenario reduction, and the corresponding probability of five scenes. Figure 6 shows 200 output curves of the photovoltaic units, five output curves after scenario reduction, and the corresponding probability of the five scenes. The output of the five scenes after scenario reduction is multiplied by their corresponding probabilities, and the equivalent output curve can be obtained by summing the five products. Figure 7 shows the equivalent wind turbine output curve and the equivalent photovoltaic unit output curve.
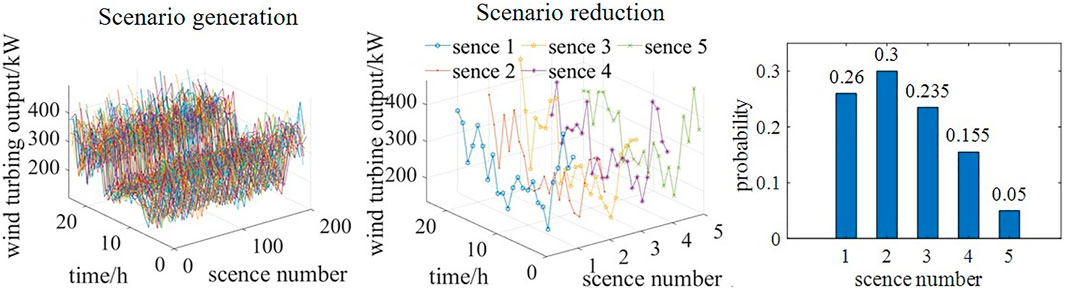
FIGURE 5. Scenario generation and reduction of the wind turbine output curve in Case 4.
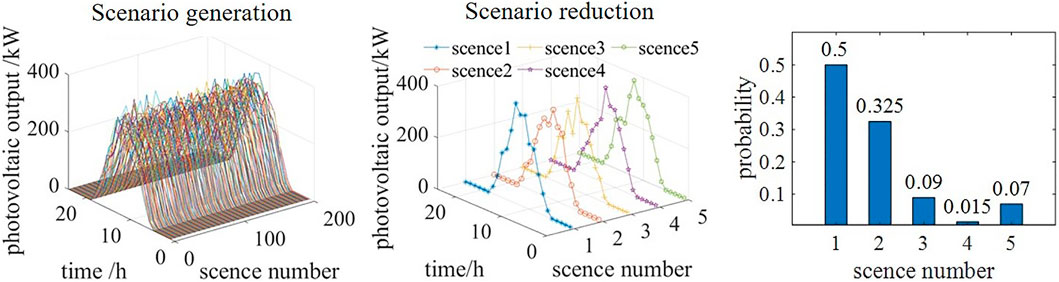
FIGURE 6. Scenario generation and reduction of the photovoltaic unit output curve in Case 4.
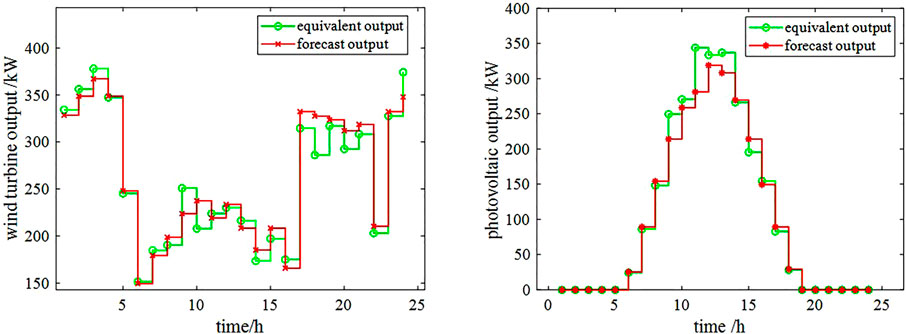
FIGURE 7. Equivalent wind turbine (left) and photovoltaic unit (right) output curves in Case 4.
By comparing the equivalent output curves with the originally predicted output curves, one can see that there is a certain gap in the output. If the dispatching is carried out according to the original data, there will be an imbalance between supply and demand.
Figure 8 shows the balance of electric power, natural gas power, cold power and thermal power in Case 1, and Figure 9 shows the same balance in Case 4. By comparing Figures 8, 9, one can see that, in Case 4 (P2G equipment added), the amount of power purchased from the power grid increases during the period of low electricity prices. The electric energy is converted into natural gas to supply gas load through the P2G equipment, and the rest is stored by energy storage equipment for standby. The amount of natural gas purchased from the natural gas network is reduced, and the natural gas load changes from relying only on the natural gas network to mainly on the P2G equipment. Since the natural gas supply is sufficient, the output of the gas boiler and micro-turbine increases. Accordingly, the output of the absorption refrigerator and heat exchanger is also increased.
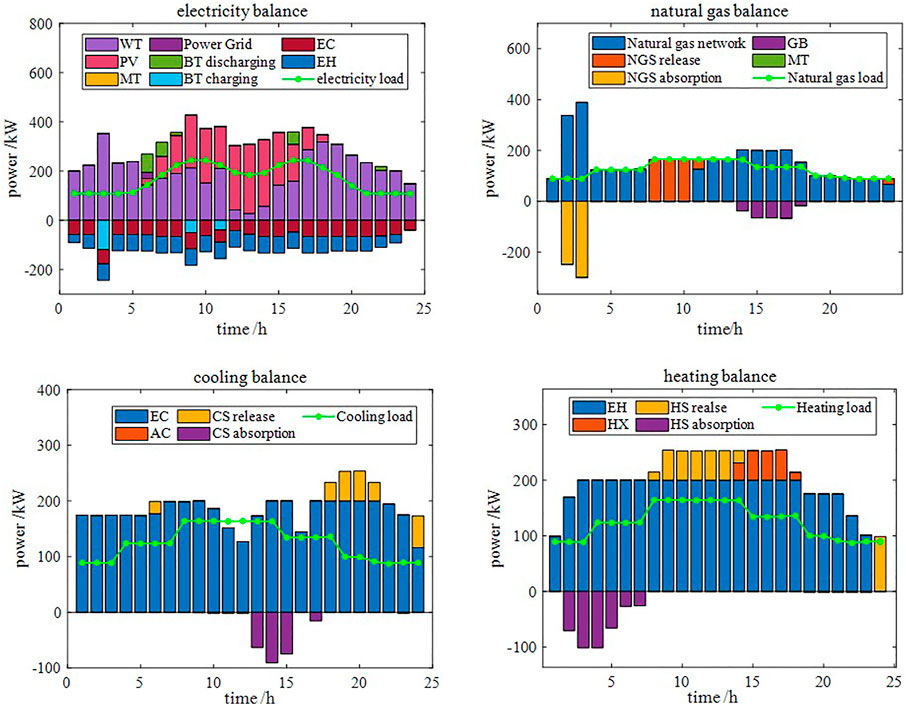
FIGURE 8. Power balance in Case 1.
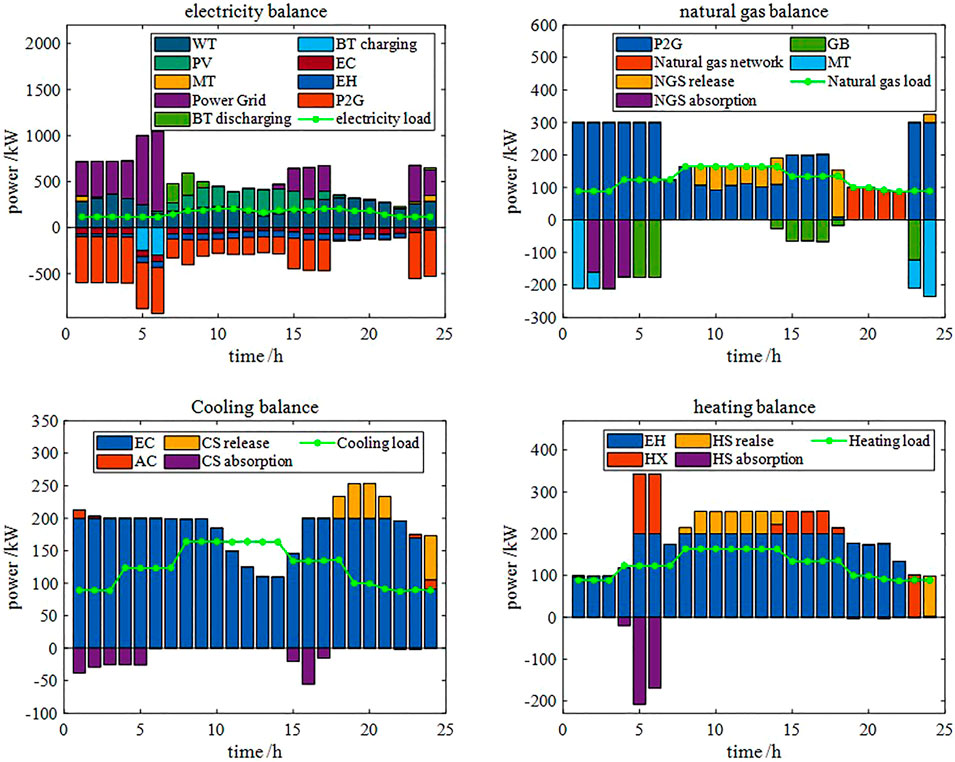
FIGURE 9. Power balance in Case 4.
As the cost coefficient of the photovoltaic unit in this study is lower than that of the wind turbine, all the output of the photovoltaic unit has been preferentially consumed, and only the wind energy is wasted. Figure 10 shows the waste rate of wind turbine output in the four cases. From Case 1 to Case 4 (i.e., with the introduction of the P2G equipment, DR technology and scenario generation and reduction technology), the waste rate gradually decreases. Case 4, the proposed strategy, has the optimal consumption ability.
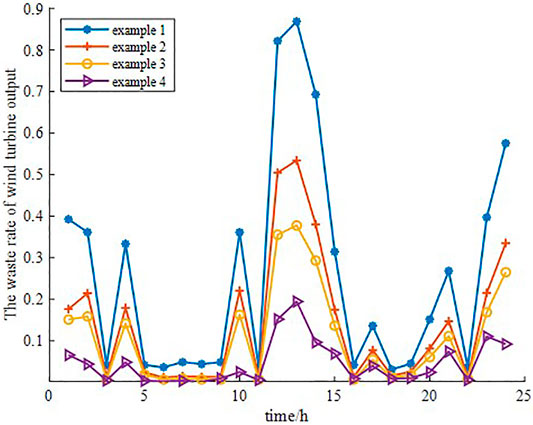
FIGURE 10. Waste rate of wind turbine output in the four cases.
5 Conclusion
Based on economic principles, this paper introduces a demand elasticity matrix in the price-based DR. According to the predicted wind turbine and photovoltaic unit outputs in the next 24 h, the scenario generation and reduction technology are used to obtain the equivalent wind turbine and photovoltaic unit output curves. P2G equipment is introduced to enhance the electro-pneumatic coupling of the system. The GAMS solver is used to solve the model and obtain the optimal energy purchase plan and scheduling scheme of the energy equipment, the energy conversion equipment and the energy storage equipment. Taking a park-level IES as an example, four cases were set up. Analysis and comparison of the results show that the proposed strategy performs well in achieving peak cutting and valley filling, maximizing the net income of the system operators, promoting the consumption of renewable energy and improving the energy utilization rate of the system.
Data Availability Statement
The original contributions presented in the study are included in the article/Supplementary Material, further inquiries can be directed to the corresponding author.
Author Contributions
SL, ML, YS, and DL contributed to conception and design of the study. SL and YS organized the database. ML performed the statistical analysis and wrote the first draft of the manuscript. All authors contributed to manuscript revision, read, and approved the submitted version.
Funding
This work was supported in part by the National Natural Science Foundation of China (51977127), in part by the project supported by the Science and Technology Commission of Shanghai Municipality (19020500800), “Shuguang Program” (20SG52) supported by Shanghai Education Development Foundation and Shanghai Municipal Education Commission, “Chen Guang” project supported by Shanghai Municipal Education Commission and Shanghai Education Development Foundation (21CGA64) and Shanghai Sailing Program (No. 21YF1414700) supported by Shanghai Municipal Science and Technology Commission.
Conflict of Interest
The authors declare that the research was conducted in the absence of any commercial or financial relationships that could be construed as a potential conflict of interest.
Publisher’s Note
All claims expressed in this article are solely those of the authors and do not necessarily represent those of their affiliated organizations, or those of the publisher, the editors and the reviewers. Any product that may be evaluated in this article, or claim that may be made by its manufacturer, is not guaranteed or endorsed by the publisher.
References
Cui, Y., Jiang, T., and Wuzhi, Z. (2020). Source Load Coordinated Economic Dispatch of Regional Integrated Energy System Considering Wind Power Consumption[J]. Power Syst. Technol. 44 (07), 2474–2483.
Ding, Y., Chen, H., and Wu, J. (2021). Multi Objective Optimal Scheduling of Electricity Gas Heat Integrated Energy System Considering Comprehensive Energy Efficiency [J]. Automation Electr. Power Syst. 45 (02), 64–73.
Gu, H., Li, Y., and Yu, J. (2020). Bi-level Optimal Low-Carbon Economic Dispatch for an Industrial Park with Consideration of Multi-Energy Price Incentives[J]. Appl. Energy 262, 11427. doi:10.1016/j.apenergy.2019.114276
Gu, W., Lu, S., Wu, Z., Zhang, X., Zhou, J., Zhao, B., et al. (2017). Residential CCHP Microgrid with Load Aggregator: Operation Mode, Pricing Strategy and Optimal Dispatch[J]. Appl. Energy 205, 173–186. doi:10.1016/j.apenergy.2017.07.045
Gu, W., Wang, J., Lu, S., Loo, Z., and Wu, C. (2017). Optimal Operation for Integrated Energy System Considering Thermal Inertia of District Heating Network and Buildings[J]. Appl. Energy 199, 234–246. doi:10.1016/j.apenergy.2017.05.004
Hongjie, J., Wang, D., and Xu, X. (2015). Study on Some Problems of Regional Integrated Energy System [J]. Automation Electr. Power Syst. 39 (07), 198–207. doi:10.7500/AEPS20141009011
HongZhong, L., Yujiao, F., and Xiao, B. (2019). Study on Optimal Operation of Regional Integrated Energy System Considering Generalized Energy Storage [J]. Power Syst. Technol. 43 (09), 3130–3138.
Huang, Y., Dan, L., and Yan, G. (2022). Day Ahead Optimal Scheduling Strategy of Electric Thermal Integrated Energy System Considering Heat Network Transmission Delay and Heat Storage [J/OL]. Electr. Meas. Instrum. 1, 1–9.
Khani, H., and Farag, H. E. Z. (2018). Optimal Day-Ahead Scheduling of Power-To-Gas Energy Storage and Gas Load Management in Wholesale Electricity and Gas Markets. IEEE Trans. Sustain. Energy 9 (2), 940–951. doi:10.1109/tste.2017.2767064
Lin, K., Chen, Z., and Zhang, Y. (2019). Wind Power Consumption and Successive Linear Low-Carbon Economic Dispatching of Power Gas Interconnection Network with Power-Gas [J]. Automation Electr. Power Syst. 43 (21), 23–33.
Liu, Z., Liu, R., and Ning, L. (2020). Day Ahead Economic Optimal Dispatching Strategy of Micro Energy Network from Power to Gas [J]. Trans. China Electrotech. Soc. 35 (S2), 535–543.
Nolan, S., and Malley, M. (2015). Challenges and Barriers to Demand Response Deployment and Evaluation[J]. Appl. Energy 152, 1–10. doi:10.1016/j.apenergy.2015.04.083
Ran, H., Qian, A., and Zhu, Y. (2017). Hierarchical Optimal Scheduling of Regional Integrated Energy System Based on Energy Hub [J]. Electr. Power Autom. Equip. 37 (06), 171–178.
Wang, W., Yang, L., and Wang, L. (2018). Optimal Dispatching of Electric Thermal Integrated Energy System Considering the Heat Storage Characteristics of Heating Network [J]. Automation Electr. Power Syst. 42 (21), 45–52.
Yang, N., Huang, Y., and Dong, B. (2019). Research on Joint Planning Method of Power Natural Gas Integrated Energy System Based on Multi-Agent Game[J]. Proc. CSEE 39 (22), 6521–6533.
YangBotterud, J., Zhang, N., Botterud, A., and Kang, C. (2020). On an Equivalent Representation of the Dynamics in District Heating Networks for Combined Electricity-Heat Operation. IEEE Trans. Power Syst. 35 (1), 560–570. doi:10.1109/tpwrs.2019.2935748
Zhang, T., Guo, Y., and Li, Y. (2021). Optimal Dispatching of Regional Integrated Energy System Considering the Response of Electrical and Thermal Comprehensive Demand [J]. Power Syst. Prot. Control 49 (01), 52–61.
Keywords: integrated energy system, optimal scheduling strategy, demand response, wind power consumption, scenario generation and reduction
Citation: Lin S, Lin M, Shen Y and Li D (2022) An Optimal Scheduling Strategy for Integrated Energy Systems Using Demand Response. Front. Energy Res. 10:920441. doi: 10.3389/fenrg.2022.920441
Received: 14 April 2022; Accepted: 29 April 2022;
Published: 19 May 2022.
Edited by:
Qingxin Shi, North China Electric Power University, ChinaReviewed by:
Buxin She, The University of Tennessee, United StatesXiaofei Wang, The University of Tennessee, United States
Copyright © 2022 Lin, Lin, Shen and Li. This is an open-access article distributed under the terms of the Creative Commons Attribution License (CC BY). The use, distribution or reproduction in other forums is permitted, provided the original author(s) and the copyright owner(s) are credited and that the original publication in this journal is cited, in accordance with accepted academic practice. No use, distribution or reproduction is permitted which does not comply with these terms.
*Correspondence: Yunwei Shen, ywshen@shiep.edu.cn