Benchmarking Marine Energy Technologies Through LCA: Offshore Floating Wind Farms in the Mediterranean
 Riccardo Maria Pulselli1,2
  Matteo Maccanti3*
  Morena Bruno3
  Alessio Sabbetta2
  Elena Neri2
  Nicoletta Patrizi3
  Simone Bastianoni3
- 1Department of Architecture, University of Florence, Florence, Italy
- 2INDACO2 srl, Colle di Val d’Elsa, Italy
- 3Ecodynamics Group, Department of Physical, Earth and Environmental Science, University of Siena, Siena, Italy
Floating wind turbines are a valid option for offshore wind farms in the Mediterranean, where the sea-floor falls off rapidly with distance from the coastline. The present study concerns a Life Cycle Assessment of the environmental performance of two types of floating wind turbine. Greenhouse gas emissions of two standard models (raft-buoy and spar-buoy, 154 m rotor diameter, 6 MW installed power) were estimated in terms of Global Warming Potential (t CO2eq) with the aim of determining a benchmark for evaluating the performance of similar offshore wind farms. Thus, the aim of the paper was to create a benchmark for the design of innovative technologies, such as those developed by specialist companies, and to verify the validity of new designs and technologies in terms of avoided greenhouse gas emissions. The results show that the Carbon Intensity of Electricity of a single floating wind turbine varies in the range 26–79 g CO2eq·kWh−1, averaging 49 g CO2eq·kWh−1, in line with other studies of offshore wind turbines and other renewable energy sources (such as onshore wind and photovoltaic). Extension of our study to the whole life cycle, including manufacturing, assembly and installation, maintenance and material replacement and a hypothetical decommissioning and end-of-life, showed that wind farms are among the most promising marine renewable energy technologies for the Mediterranean.
Introduction
The European Union attributes strategic value to the development of offshore wind farms (European Commission, 2019; European Commission, 2020a; European Commission, 2020b; European Commission, 2021). The installed power of offshore wind turbines in Europe is 25 GW, 14.6 GW in EU-27 countries and 10.4 GW in extra-EU countries, principally the United Kingdom (Wind Europe, 2021) which has 45 MW of floating turbines which account for 70% of the world fleet (EC, 2020a). In 2020, the production of offshore wind energy in Europe was 83 TWh, 3% of the energy requirements of the continent (Wind Europe, 2021); this percentage could hopefully exceed 30% in 2050 (Ghigo et al., 2020).
European seas are estimated to have high potential for floating turbines: 4540 GW, of which at least 3000 GW could come from seas with depths in the range 100–1,000 m. The greatest wind potential is encountered in the North Sea and the Baltic Sea, but the Atlantic Ocean and Mediterranean Sea also offer opportunities for profitably exploiting wind energy (EC, 2020b). The aims of the EU are ambitious, with a goal of 450 GW installed offshore wind power by 2050, of which at least 48 GW is planned for the Mediterranean (Wind Europe, 2019). The webgis portal of the Interreg-MED MAESTRALE project indicates values of wind speeds which lie in the range 3–7 m/s in the Mediterranean (Maestrale, 2022). Among the advantages are the lower frequency and intensity of extreme weather events in this sea with respect to the Atlantic and the North Sea, which means that wind farms are less likely to be damaged. This carries over to greater security and lower investment risk. In more exposed contexts, the increase in extreme events linked to climate change may damage offshore wind farms (Diamond, 2012; Wang Q. et al., 2019; Kettle, 2020).
The predominant type of offshore wind farm at global level is the bottom-fixed wind turbine in shallow water (Pantusa et al., 2020). However, floating wind turbines are a more promising solution for offshore situations, since they can be installed with sea depths ranging from 50 to 500 m (Pantusa and Tomasicchio, 2019; Poujol et al., 2020). This aspect makes the Mediterranean context technically suitable for the exploitation of wind energy despite it has steep bathymetric slopes and deep waters near the coast (Chipindula et al., 2018; EC, 2020b; Staschus et al., 2020).
In February 2022 the first offshore wind turbine in the Mediterranean was completed in the waters of Taranto (Italy); this is the first of the ten 3 MW turbines that will make up the plant called “Beleolico”. There are many other projects underway in the Mediterranean waters for both bottom-fixed and floating wind turbine plants (Palmiotti, 2022). In the Gulf of Lion (France), four floating wind turbines of 6 MW will be installed in the coming months (Poujol et al., 2020). The authorization process has begun for the construction of an energy hub in Ravenna (Italy) which will see 65 monopile wind turbines of 8 MW each and 100 MW floating photovoltaic panels for a total installed capacity of 620 MW (Dominelli, 2021). In Sardinia (Italy), a floating wind farm for a total power of around 450 MW is being planned (Palmiotti, 2022), while in Marsala (Italy), the construction of a floating wind farm 35 km from the coast, with 25 turbines of 10 MW is planned (Comelli, 2020). Moreover, an expression of interest in floating offshore wind farm with a configuration consisting of 27 turbines with a nominal power of 10 MW each, off the coast of Civitavecchia, was presented by the Lazio Region (Regione Lazio, 2021).
Floating offshore wind is considered to be among the main research and innovation priorities for opening the European market in new marine contexts (EC, 2020b). This paper is the result of a study that evaluates the use of offshore floating wind farms in the Mediterranean Sea, in the framework of the Interreg MED BLUE DEAL Project. In particular, the study estimates the Carbon Footprint (CF) of two types of floating wind turbine, having installed powers of 6 MW (EC, 2020b), by means of Life Cycle Assessment (LCA). In this regard, Pantusa and Tomasicchio (2019) conducted a study on the Mediterranean, assuming turbine between 3 and 6 MW. In addition, the study by Poujol et al. (2020), which carried out the first LCA analysis of a Mediterranean floating plant to be completed in the coming months, refers to a plant consisting of four 6 MW turbines. Although most of the literature for the Mediterranean assumes turbines with lower installed capacity, the current trend is to build turbines of increasing size; 10 MW turbines are available on the market and 20 MW units are forecasted by 2030 (International Renewable Energy Agency, 2019). Most of the floating plants planned in the Mediterranean area show values of 8–10 MW per unit.
The LCA methodology has already been used for the environmental assessment of floating offshore wind turbines in some specific applications, documented in the literature. Weinzettel et al. (2009) reported the first LCA of a spar-buoy wind turbine, a concept developed by Norwegian Sway Company. Its nominal power is 5 MW and installation was planned to be at a distance of 50 km from the coast. At the time of publication, it was not yet operating. The results obtained for the various impact categories of a floating wind farm proved to be in line with those of traditional monopile offshore turbines. Clearly, also, the use of recycled materials could further significantly reduce impacts.
Raadal et al. (2014) conducted LCA of greenhouse gas emissions of six different concepts of offshore turbine, using the same 5 MW model but considering different structures to support the tower. They evaluated five floating structures (tension-leg-spar, semi-submersible, spar-buoy, tension-leg-platform, tension-leg-buoy) and a bottom-fixed structure, type OC4 jacket. For each type they postulated a wind farm composed of 100 turbines (10 × 10 square layout) to install on the Doggerbank, 200 km off the coast of Britain in the North Sea. The study showed that the environmental performance of offshore wind turbines (both floating and bottom-fixed) can vary widely. The factors that most affect performance are: turbine lifetime, wind conditions, turbine size, the weight of steel in the platforms/foundations, distance from the coast, installation and decommissioning.
Tsai et al. (2016) reported a detailed LCA study of 20 scenarios for 3 MW floating offshore wind turbines (based on the Vestas V112-3.0 MW®) on the Great Lakes in the state of Michigan (United States). The scenarios reflect different spatial characteristics in relation to wind speed, water depth and distance from the electricity grid. Four different sites were considered with five different distances from the coast (5, 10, 15, 20, 30 km) and different types of foundation (floating and bottom-fixed: gravity-based foundation, tripod and monopile), depending on the type of bottom. The study showed that turbines closer to the coast have better environmental performance, because although turbines further offshore produce more (the theoretical productivity for 20 years of operation of a turbine was in the range 14.8–18.5 TWh, without significant differences between sites closer or more distant from the coast), the environmental load/burden associated with manufacturing, operating, maintaining and decommissioning is greater. It was also found that for all types of foundation, the weight of steel is relevant, making it crucial to reduce this parameter, decommission correctly and increase the amount of recycled steel.
Chipindula et al. (2018) conducted LCA of hypothetical wind farms with wind turbines of different nominal power, onshore (1, 2 and 2.3 MW turbines) and offshore, in the latter case considering shallow-water (bottom-fixed 2 and 2.3 MW turbines) and deep-water (floating 2.3 and 5 MW turbines). Installation was contemplated in Texas (United States) and in the Gulf of Mexico. The study found that turbine size was crucial. Environmental performance improved with increasing turbine size. In general, turbines with lower environmental impact were onshore due to the smaller quantity of materials necessary, but in an offshore environment, floating turbines had much better performance than monopiles, and among floating turbines, 5 MW had better performance than 2.3 MW. The phase of extraction and processing of materials emerged as a critical factor and in the offshore environment accounted for up to 82% of total impact. Besides materials, the installation phase plays a primary role in the offshore environment: for floating turbines it accounts for 2% of total impact, against 30% for the classical monopile turbine, due to long processing requiring much machinery.
Wang S. et al., 2019 published an assessment of greenhouse gas emissions of a 2 MW turbine based on LCA, envisaging installation onshore and offshore (spar-buoy-type platform). The results are much higher than the unit and mean values of the rest of the literature. According to the report, the phase that weighs most on total emissions is transport and installation (>90% of total emissions), contrary to the rest of the literature. The authors show that the emissions of floating turbines are greater than those of onshore turbines due to a greater quantity of materials necessary for the foundations. It also emerges that turbine lifetime and productivity are among the factors that most influence environmental performance.
Poujol et al. (2020) reported a detailed study that included LCA of a real wind farm, installation of which should be complete in the coming months in the Gulf of Lion, south of France. The farm will consist of four turbines each with a nominal power of 6 MW, mounted on raft-buoy platforms, Heliande model 150. The farm will be installed 16 km off Leucate and productivity is estimated at 72 GWh/y and 1.45 TWh during the farm’s estimated 20 years of life. The results show that materials (especially the floater) are responsible for the largest fraction of the impact. The other phases have a more marginal role, and for end-of-life the main contribution comes from fuel for transport in the decommissioning phase. Installation is envisaged in two coastal sites in Normandy and Brittany, where 14% and 25% reductions in impact per kWh seem possible, respectively. This underlines the importance of having site-specific estimates of energy productivity. It also emerged that structures with longer lifetimes have better environmental performance; the better productivity obtained makes up for the greater maintenance requirements of longer life. It is also demonstrated that the quantities of materials, especially steel, have a non-negligible impact on the final results and it is therefore important to have reliable background data.
Table 1 shows the Carbon Intensity of Electricity (CIE) values expressed in g CO2eq·kWh−1, obtained from the literature, of various types of onshore and offshore wind turbines, bottom-fixed and floating, with installed powers ranging from 1 to 6 MW. The table also gives information about the nominal power (in MW) of single turbines, the LCA phases and sensitivity analysis.
TABLE 1. Carbon Intensity of Electricity (g CO2eq kWh−1) of onshore, offshore floating and bottom-fixed wind farms—literature review.
Although the case studies are highly varied in terms of subject and approach, results can be compared by considering relevant variables and indicators. For example, mean values of CIE by technology can be deduced: 6.8 g CO2eq·kWh−1 for onshore wind turbines, 31.5 g CO2eq·kWh−1 for bottom-fixed offshore wind turbines (including monopiles, OC4 jacket, tripod and gravity-based foundations) and 25.9 g CO2eq·kWh−1 for offshore floating wind turbines (including spar-buoy, semi-submersible, tension-leg-spar, tension-leg-platform, tension-leg-buoy and Dutch tri-floater). The values of Wang S. et al., 2019 were not used to obtain these mean values because they were not coherent with the values published in the literature.
The aim of this paper is to evaluate the performance of two technological solutions of offshore floating wind turbines compared with studies from the literature. The generalisation in terms of type, size or installed power through a benchmark specifically designed, avoids reference to devices tested in a specific study or products of a specific company. It will help overcome differences between studies published in the literature and to interpret their results. The data complies with the 3D digital models of Figure 1 which shows the main components and materials used. As a standard for widespread use, the models were constructed using realistic thicknesses and volumes, in line with the literature, ignoring technological details that show a variety of possible solutions but that do not significantly affect overall impact. Making reference to two simplified digital models instead of specific technologies with many variables, the two floating wind turbines offer a benchmark, namely two generic types, representative of a large range of specific technological solutions.
FIGURE 1. Type and size of offshore floating wind turbines: raft-buoy (A) and spar-buoy (B). Each one is composed by three main parts: rotor, tower, and buoy.
Once the models were created, inventory data were used for the analysis of environmental performance using the LCA methodology. The potential environmental impacts in terms of CF (t CO2eq) were then quantified by the application of the Global Warming Potential (GWP 100a) characterization method. Thereafter, the analysis postulated the used of floating wind turbines to build wind farms in the Mediterranean by assuming the production potentials obtained in three sites: Crete (Greece), Split (Croatia) and Larnaca (Cyprus). In particular, values of energy production (MWh·yr−1) refer to hypothetical offshore wind farms per each of the 6 MW units as documented by Pulselli et al. (2022). Using the results of GWP and electricity production per one turbine, we estimated the value of CIE in g CO2eq·kWh−1 (Moro and Lonza, 2017). This indicator allowed for comparing values measured in the three sites examined with those of different wind farms reported in the literature, but also with values of other technologies exploiting renewable resources. Furthermore, the emission values of the electricity grid mix of different countries were compared with those emerging from the present analysis.
Materials and Methods
The study analyses the components and processes of the life cycle of two types of floating wind turbine, raft-buoy and spar-buoy, both with 6 MW nominal power. The raft-buoy (Figure 1A) consists of a large, partly submerged triangular floating platform. Three columns at the apices of the platform contain ballast and horizontal anti-capsize plates. The tower of the turbine is mounted on one apex of the platform. The structure is anchored to the bottom with steel cables and specially designed and calibrated drag anchors (Robertson and Jonkman, 2011; Raadal et al., 2014). The spar-buoy (Figure 1B) consists of a long hollow vertical steel cylinder, ballasted in its lower part with water and cement conglomerate. The floating cylinder is half submerged and gives the system dynamic stability, maintaining a centre of gravity below the waterline (Tomasicchio et al., 2018; Ghigo et al., 2020). The size and characteristics of the rotor (fibreglass blades) and generator are the same for both devices. For an installed power of 6 MW and a rotor diameter of 154 m, the minimum requirements for installation indicate a minimum wind speed threshold of about 3 m/s (Pantusa and Tomasicchio, 2019).
The LCA was conducted in compliance with ISO 14040 (International Standard Organization, 2006) and 14044 (International Standard Organization, 2020). Four main phases were postulated: 1) manufacturing 2) assembly and installation 3) maintenance and material replacement 4) end of life (Figure 2). The system boundaries include the main processes of the life cycle from cradle to grave. The analysis considers the impacts of the life cycle of the main energy inputs and materials making up the technological components, starting with the weight of the material used and therefore ignoring the impact of the specific industrial processes used to produce each technological component in its final form (e.g., the impact of steel sheet is considered but not the process of creating the cylinder).
FIGURE 2. Flow chart including the main life cycle phases of offshore floating wind turbines (raft-buoy model taken as example).
The functional unit (FU) is one year of operation of a 6 MW offshore floating wind turbine, assuming a lifetime of 20 years (Weinzettel et al., 2009; Huang et al., 2017; Chipindula et al., 2018; Wang S. et al., 2019). This made it possible to bring the impacts of the phases of manufacture, assembly-installation and end-of-life into line with the maintenance phase, e.g., regarding periodic replacement of parts subject to wear (i.e. for all elements having a lifetime of less than 20 years).
The inventory data was collected by combining 3D digital models and data from the literature, as reported in detail in Table 2. First of all, specific data on materials and energy necessary for Phase 1, manufacture of structural components, was estimated on a quantitative basis and considering the main components of each device.
TABLE 2. Life Cycle Inventory of a 6 MW raft-buoy wind turbine and a 6 MW spar buoy wind turbine.
For Phase 2, assembly-installation, the consumption of materials and energy (diesel for the crane, forklifts, generators, ships etc.), required for assembly on land or on site, is estimated (Chipindula et al., 2018). Emissions for transporting materials and construction components by truck for an assumed distance of 500 km are considered. This value is a precaution to consider the different realities of the Mediterranean basin. Not in all the possible locations for the implementation of the Turbines, in fact, there is the same level of development of the port, maritime, road and industrial infrastructures.
For Phase 3, maintenance, energy consumption of two boats (i.e., six trips per year of the transfer boat for small maintenance operations and one trip per year of the fast supply vessel with replacement components) and of a helicopter (one trip per year) for monitoring the farms, are considered in line with Weinzettel et al. (2009), Tsai et al. (2016) and Wang S. et al., 2019. Replacement of worn parts mostly concern factory pre-assembled technological components, such as the gearbox, which are transported to the site (in line with Bhattacharya et al., 2018; Chipindula et al., 2018; Wang S. et al., 2019).
For Phase 4, decommissioning and end-of-life, we postulated recycling and landfill disposal or waste-to-energy scenarios. Along the lines outlined in Chipindula et al. (2018), Raadal et al. (2014) and Tsai et al. (2016), we assumed the following destinations of the various materials: 90% recycling e 10% landfill for steel, aluminium and iron; 90% recycling and 10% waste-to-energy for copper, lead and zinc; 100% landfill for cement and 100% waste-to-energy for plastic polymers (PE, PP and other plastics), rubber, fibreglass, wood, alkyd paint and epoxy resin. Regarding recyclable metal components, we only counted emissions for their transport to a hypothetical waste management centre (300 km by boat and 200 km by truck). The impacts of subsequent management and recycling of metals to produce secondary raw material were assigned to the future process that would use those materials.
The exploded 3D models in Figures 3, 4 show the characteristics and dimensions of the devices. Based on the purpose to set the benchmark, the weights of steel and ballast materials were estimated entering realistic volumes and thicknesses in these models. Data on other materials used in specific components, such as the materials of the rotor blades or the internal parts of the nacelle, was obtained from the literature (Wang S. et al., 2019; Poujol et al., 2020). The composition of the 33 kV submarine cables was obtained from Birkeland (2011) and Tsai et al. (2016) (Table 2) postulating a wind farm with four turbines in 1 km2 of sea and including the cables connecting the turbines to an underwater substation (750 m per turbine) and a cable connecting them to the coast (hypothetical distance of 12 nautical miles, i.e., 22.2 km). Figure 5 shows the wind farms layout for both models.
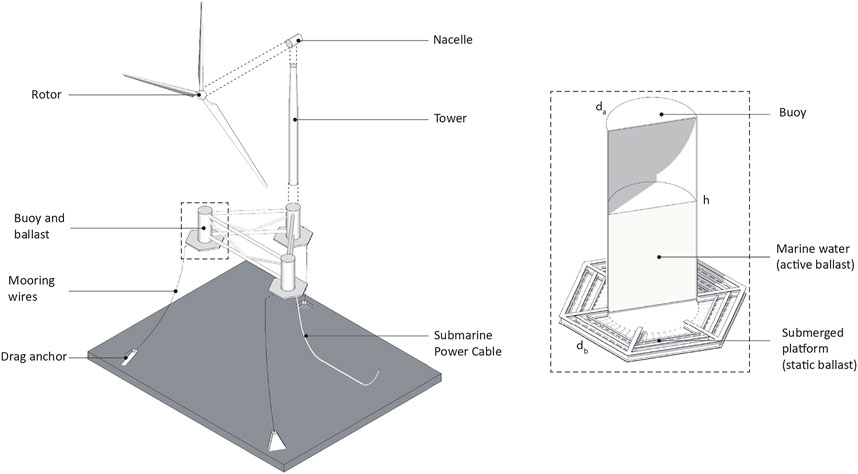
FIGURE 3. Main construction elements of offshore raft-buoy wind turbine. Legend and values: da: 10 m, db: 21 m, h: 25 m.
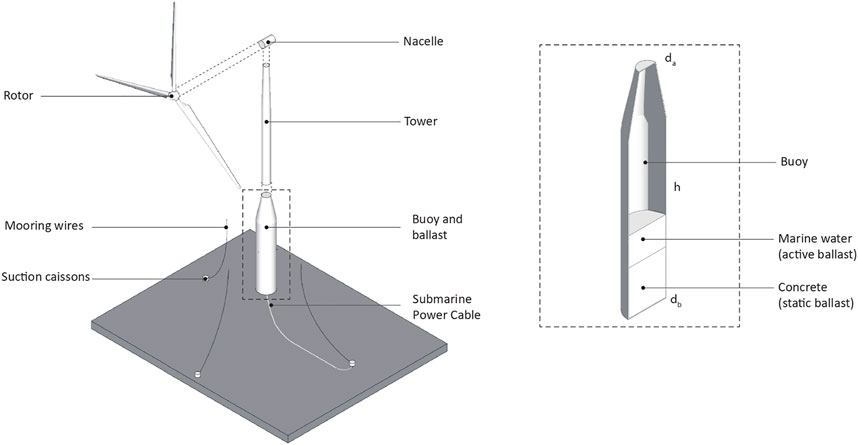
FIGURE 4. Main construction elements of offshore spar-buoy wind turbine. Legend and values: da: 10 m, db: 14.5 m, h: 78 m.
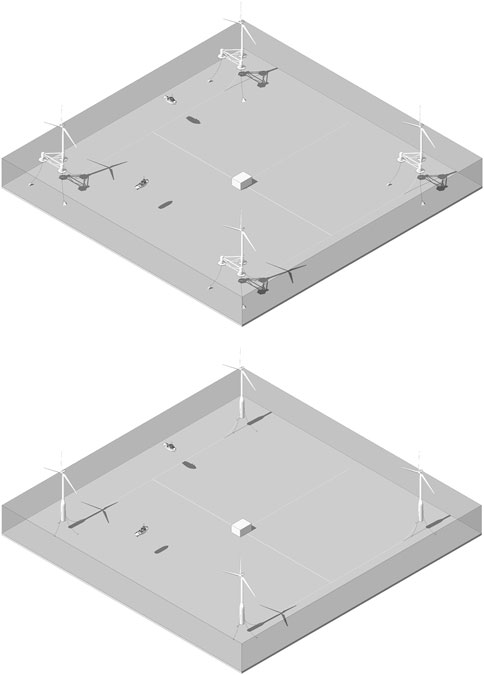
FIGURE 5. The windfarm layout with four turbines in 1 km2 (distance between turbines: 750 m) for raft-buoy (above) and spar-buoy (below) model.
Table 2 shows the inventory data for the components and processes of the life cycle of raft-buoy and spar-buoy turbines. The table is a scheme of reference for the life cycle inventory of wind turbines, for replicating LCA or for showing differences in the calculation model. Lifetimes were differentiated to account for maintenance and replacement of certain construction elements. On the basis of the estimated lifetime of the structure (20 years) and the differentiated lifetimes, the table gives the values per FU, i.e., for one year of operation. The estimated lifetime of the electrical cables to the coast is 40 years, which is longer than the life of the wind farm, as suggested by Huang et al. (2017).
SimaPro 9.1.1 software (PRé Consultants, 2020) was used to model the inventory and do Life Cycle Impact Assessment. Ecoinvent v3.6 (Ecoinvent, 2022) is the database used as source of secondary data. We used the IPCC 2013 method of characterisation and the impact category Global Warming Potential—GWP100a with a time horizon of 100 years (IPCC, 2013) to calculate greenhouse gas emissions via the Carbon Footprint indicator.
On the basis of the LCA results, we calculated the CIE per kWh generated by each turbine, assuming a reference energy production in three areas of the Mediterranean Sea with different energy potentials: a 300 MW wind farm installed in Crete (Greece) (50 × 6 MW wind turbines) is expected to generate 1.17 TWh‧yr−1 (Stančin et al., 2022) or 23.4 GWh‧yr−1 per turbine. Likewise, those in Split (Croatia) and Larnaca (Cyprus) are expected to generate 14.5 GWh‧yr−1 and 9.6 GWh‧yr−1 per turbine, respectively (Pulselli et al., 2022). Since this is an analysis aimed at creating a benchmark applicable in different contexts, the average value of the distance between the farm and the coast is the same for each area (22 km). This assumption makes the three systems comparable from the point of view of LCA; since, for example, the variation in the length of the connection cable to the electricity grid can significantly affect the result. Furthermore, for the purposes of the study, the distance between the farm and a hypothetical port for the logistical management of the plant both during construction and maintenance, was assumed to coincide with that mentioned above. The three areas are shown in Figure 6. To estimate the productivity of the three areas, we considered wind energy potentials measured locally on yearly averaged values; the productivity values are site-specific since they also consider feasibility on the basis of the current energy balance of the national grids in the three sites (Pulselli et al., 2022). Table 4 shows the productivity of a single wind turbine in the three sites.
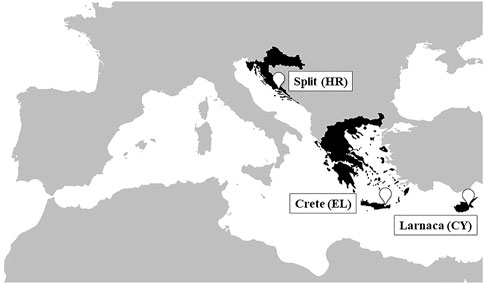
FIGURE 6. Map of the Mediterranean Sea showing the three sites proposed for installation of wind farms: Crete (Greece), Split (Croatia) and Larnaca (Cyprus)—Map created with mapchart.net.
Results and Discussion
Table 3 shows the GWP (t CO2eq) values of individual components and the total for the two devices. The life cycle of the two types of floating wind turbine (including the cables connecting them to the mainland) generates emissions of 12,242 t CO2eq (i.e., 612 t CO2eq per year of operation) in the case of the raft-buoy and 15,118 t CO2eq (i.e., 756 t CO2eq per year) in the case of the spar-buoy.
TABLE 3. Life Cycle Analysis of a 6 MW raft-buoy wind turbine and a 6 MW spar buoy wind turbine.
Figure 7 shows the main greenhouse gas emission sources by life cycle phase and process. The manufacturing phase that includes the materials constituting the turbines, the anchoring systems and the electric cables is the main source of emissions: over 75% for the raft-buoy (49% steel and 15.6% fiberglass); almost 70% for the spar-buoy (42.1% steel; 12.7% fiberglass); this is consistent with the results obtained in literature for other renewable energy sources, in which the manufacturing and installation phases dominate the impacts (Sacchi et al., 2019). According to Chipindula et al. (2018) for deep-water turbines, the manufacturing stage accounts for 81.5% of the total impact. Poujol et al. (2020) highlighted that around 80% of the climate change impact category are mainly due to the raw material extraction and manufacturing. Results obtained also agree with Raadaal et al. (2014), which showed that the turbine and foundation/platform materials (i.e., production, processing, transport and disposal of all the infrastructure material related to these elements production) contribute most to the overall GHG emissions (around 60%–80%). The difference between the two models is deduced principally from the mass balance: 4,547 t for the raft-buoy, of which 3,805 t (83.7%) steel; 10,278 t for the spar-buoy of which 4,036 t (39.3%) steel and 5,500 t (53.5%) cement. In alternative to cement, materials such as rubble could reduce emissions from cement production. The maintenance emissions can principally be attributed to the fuel used by motor vessels or craft (9.7% raft-buoy and 7.8% spar-buoy) necessary to replace gearbox components. Fuel for transport and assembly of components amounts to 7.5% and 17.7%, respectively.
FIGURE 7. Carbon Footprint (t CO2eq) results for the two floating turbine models (raft-buoy and spar-buoy), in relation to different LCA phases.
The GWPs estimated for the two solutions were compared to the electrical productivity (MWh‧yr−1) in the three sites, giving the CIE, expressed in g CO2eq·kWh−1 (Table 4). The CIE values for production of electricity by the offshore floating wind farms fall in the range 26.1–78.7 g CO2eq·kWh−1. These results depend on the impacts measured for the two types of turbine, and are naturally influenced by the site-specific productivity of the marine areas selected: the intervals by type of turbine (raft-buoy and spar-buoy) are 26.1–32.2 g CO2eq·kWh−1, respectively, for Crete (EL), 42.1–52 g CO2eq·kWh−1 for Split (HR) and 63.8–78.7 g CO2eq·kWh−1 for Larnaca (CY). Mean values of 44 g CO2eq·kWh−1 and 54.3 g CO2eq·kWh−1 were recorded for raft-buoy and spar-buoy, respectively, in the eastern Mediterranean. The overall mean is 49.2 g CO2eq·kWh−1 for a generic floating wind turbine installed in the eastern Mediterranean. The values obtained are in line with previous studies, as shown in Table 1. Particularly, in the case of Crete, the results obtained are consistent with the average values found in the literature for floating turbines (around 26 g CO2eq·kWh−1 considering Weinzettel et al., 2009; Raadal et al., 2014; Tsai et al., 2016; Chipindula et al., 2018; Poujol et al., 2020).
TABLE 4. Electricity production yields and CIE of 6 MW wind turbines (raft-buoy and spar-buoy) and 24 MW wind farms in three Mediterranean marine areas, based on site-specific wind energy potentials.
In general, the CIE results indicate good environmental performance of floating wind turbines. They are in line with those of other renewable energy sources of electricity, such as onshore wind (10 g CO2eq·kWh−1) and photovoltaic (32 g CO2eq·kWh−1) (Pulselli et al., 2019) and are well below current CIE values of national electricity grids (Greece: 479 g CO2eq·kWh−1; Croatia: 134 g CO2eq·kWh−1; Cyprus: 621 g CO2eq·kWh−1; data of 2020, source EEA, 2022). If the most suitable marine areas with good wind potential are chosen (e.g., Crete), the study shows that floating wind turbines in the Mediterranean are competitive in terms of environmental performance, with CIE values similar to those recorded in ocean contexts.
LCA is not the last word in evaluation of offshore technologies. Marine spatial planning should also consider other aspects, such as direct and indirect impact on flora and fauna, landscape compatibility, and interference with other marine activities like navigation, tourism and fisheries. The LCA method is useful to orientate decisions and to pinpoint solutions towards carbon neutrality. Although wind farms can have impacts on ecosystems and these need to be appropriately evaluated, several studies are showing that offshore wind farms can protect and even favour the proliferation of a wide range of marine species, such as fish, molluscs, crustaceans, seals and porpoises, that forage in these seas (Russell et al., 2014; Vattenfall, 2018).
With a view to future integration of renewable energy sources, floating systems offer a valid opportunity to integrate offshore wind with other renewable energies, such as floating photovoltaic, wave energy converters, aquaculture and hydrogen production (Buck et al., 2017; Lee et al., 2018; Roy et al., 2018; Fenu et al., 2020; SINN Power GmbH, 2022). LCA can be an auxiliary methodology for developing integrated systems, provided the results of different studies can be compared.
Sensitivity Analysis
To assess variations in terms of CF and consequently CIE, we conducted sensitivity analysis, postulating changes in a parameter that most influences the results of the study, namely the quantity of steel necessary to build the two types of turbine (46% CF for raft-buoy and 36% CF for spar-buoy). As indicated by the literature, steel is the predominant structural component of turbines (Poujol et al., 2020) and platforms/foundations (Raadal et al., 2014), besides being the greatest contributor to impacts in terms of emissions of greenhouse gases in the manufacturing phase (Phase 1). This applies to both systems, as seen above. Besides reducing the quantity of steel used, it turned out to be crucial to use recycled materials, which can significantly improve performance in terms of CF, as shown by Tsai et al. (2016) and Weinzettel et al. (2009).
We therefore considered three scenarios (S1, S2, S3) in which the quantity of steel used in the floating structure was reduced, and two scenarios in which recycled steel was used (S4 and S5). In the first three scenarios, steel was reduced by 5%, 10% and 15%, respectively. In S4 and S5, 30% and 50% of recycled metal was postulated for the turbine and the floating structure. The anchoring structure and the electric cables were not included in the evaluation.
The sensitivity analysis showed that for both models, scenarios S1 and S2 (with 5% and 10% reductions in the quantity of steel used) did not significantly improve impact (−0.3% and −0.5%, respectively), whereas scenario S3 (15% less steel) was associated with a 1% reduction in CF for both models. The CF of the raft-buoy model fell from 612 to 585 t CO2eq, whereas the CF of the spar-buoy model dropped from 756 to 730 t CO2eq. The mean CIE for the three sites declined from 44 to 42.1 g CO2eq·kWh−1 for the raft-buoy and from 54.3 to 52.4 g CO2eq·kWh−1 for the spar-buoy model.
These are only models. A reduction in the quantity of steel exceeding 15% would require further upstream engineering assessments. It is therefore reasonable to assume a life cycle perspective and to propose the use of recycled steel. On this question, the results for S4 and S5 showed that for both models, the scenario envisaging 50% recycled steel for the turbine is a critical variable (-1.3%). In particular, the CF of the raft-buoy drops from 612 to 566 t CO2eq, whereas that of the spar-buoy goes from 756 to 710 t CO2eq. Likewise for the CIE, the mean for the raft-buoy goes from 44 to 40.7 g CO2eq·kWh−1 while that of the spar-buoy falls from 54.3 to 51 g CO2eq·kWh−1.
Sensitivity analysis showed minimal changes in the result obtained for GHG emissions and CIE with variations in the quantity and composition of the steel components. No significant change in the results were obtained by varying these parameters. This observation lends reliability to the conclusions in relation to some of the assumptions made during the data inventory.
Conclusions
The marine renewable energy sector in Europe is growing and indicates offshore wind technologies to be among the most promising. The development of offshore floating wind farms is therefore strategic for the Mediterranean, where sea depth increases sharply with distance from the coast and does not permit the installation of bottom-fixed turbines. The present study documents the use of LCA to evaluate the environmental performance of two types of floating wind turbines, postulating their installation in three sites in the Mediterranean with different wind energy potentials. LCA has been used for similar studies, which have been used for comparison, highlighting different methodological assumptions (e.g., regarding life cycle processes or estimated electricity production) and the variety of technologies analysed and documented in the literature. Starting from theoretical 3D models for raft-buoy and spar-buoy models, we defined a benchmark, a generalisation useful for comparing the results obtained by more specific technologies, following homogeneous evaluation criteria. Any technology alternative to those presented, and presumably designed to improve performance, can be compared with the two basic solutions by a similar calculation procedure. Theoretically, a new offshore floating wind turbine technology, subject to LCA, should give better results than the two standard models in order to demonstrate its efficacy or should publish the factors that lead to different results (which could depend on more accurate inventory data or additional technological components).
The results show an interval of CIE values (range 26.1–78.7 g CO2eq·kWh−1), variations which depend largely on mass balance (materials used in the manufacturing and maintenance phases) and of course selection of marine areas with different wind energy potentials. The mean value of CIE recorded (49.2 g CO2eq·kWh−1 for a generic floating wind turbine installed in the eastern Mediterranean) is in line with that of other renewable energy sources. Thus, the results show the competitivity of floating wind turbines in the Mediterranean and are useful to orientate the design of more efficient technologies. Sensitivity analysis reinforces the reliability of the evaluations and the assumptions made in the inventory phase. In line with other studies in the literature, it also showed that further research is necessary to conceive ways of reducing the quantity of steel needed to build floating wind turbines. It also shows that the use of recycled steel can improve the environmental performance of these devices.
Data Availability Statement
The original contributions presented in the study are included in the article/Supplementary Material, further inquiries can be directed to the corresponding author.
Author Contributions
RP, MM, MB, EN, and NP conceived the paper and processed and discussed data. AS elaborated the 3D models and extracted inventory data. RP and SB supervised writing of the paper. All authors discussed reviewer feedback and contributed to the final manuscript.
Funding
This study was conducted in the framework of the Interreg Med BLUE-DEAL (2019–2022) project, co-financed by the European Regional Development Fund. Website: https://blue-deal.interreg-med.eu.
Conflict of Interest
Authors AS and EN was employed by INDACO2 srl and author RP was employed by INDACO2 srl.
The remaining authors declare that the research was conducted in the absence of any commercial or financial relationships that could be construed as a potential conflict of interest.
Publisher’s Note
All claims expressed in this article are solely those of the authors and do not necessarily represent those of their affiliated organizations, or those of the publisher, the editors and the reviewers. Any product that may be evaluated in this article, or claim that may be made by its manufacturer, is not guaranteed or endorsed by the publisher.
References
Antonutti, R., Peyrard, C., Johanning, L., Incecik, A., and Ingram, D. (2016). The Effects of Wind-Induced Inclination on the Dynamics of Semi-submersible Floating Wind Turbines in the Time Domain. Renew. Energy 88, 83–94. doi:10.1016/j.renene.2015.11.020
Bhattacharya, S., Nikitas, G., and Jalbi, S. (2018). “On the Use of Scaled Model Tests for Analysis and Design of Offshore Wind Turbines,” in Geotechnics for Natural and Engineered Sustainable Technologies (Singapore: Springer), 107–129. doi:10.1007/978-981-10-7721-0_6
Birkeland, C. (2011). Assessing the Life Cycle Environmental Impacts of Offshore Wind Power Generation and Power Transmission in the North Sea. dissertation/master’s thesis. Trondheim: Norwegian University of Science and Technology.
Buck, B. H., Krause, G., Pogoda, B., Grote, B., Wever, L., Goseberg, N., et al. (2017). “The German Case Study: Pioneer Projects of Aquaculture-Wind Farm Multi-Uses,” in Aquaculture Perspective of Multi-Use Sites in the Open Ocean (Cham: Springer), 253–354. doi:10.1007/978-3-319-51159-7_11
Chipindula, J., Botlaguduru, V., Du, H., Kommalapati, R., and Huque, Z. (2018). Life Cycle Environmental Impact of Onshore and Offshore Wind Farms in Texas. Sustainability 10, 2022. doi:10.3390/su10062022
Comelli, E. (2020). Nascerà in Sicilia il primo parco eolico galleggiante del Mediterraneo. Investimento da 740 milioni di euro della danese Cph. Offshore Partners al largo di Marsala tecnologia espansione.
Diamond, K. E. (2012). Extreme Weather Impacts on Offshore Wind Turbines: Lessons Learned. Nat. Resour. Environ. 27 (2), 37–41.
Dominelli, C. (2021). Saipem: dalle turbine eoliche all’idrogeno, ecco l’hub energetico al largo delle coste di Ravenna. Avviato il percorso Aut. il progetto oltre U. N. miliardo euro che Consent. il rilancio del distretto Ind. della città emiliana.
Ecoinvent (2022). Ecoinvent. Available at: https://ecoinvent.org/(Accessed April 13, 2022).
Equinor (2021). How Hywind Works. Available at: https://www.equinor.com/en/what-we-do/floating-wind/how-hywind-works.html (Accessed April 13, 2022).
European Commission (2020a). Communication from the Commission to the European Parliament, the Council, the European Economic and Social Committee and the Committee of the Regions - an EU Strategy to Harness the Potential of Offshore Renewable Energy for a Climate Neutral Future. Brussels: European Commission.
European Commission (2021). Communication from the Commission to the European Parliament, the Council, the European Economic and Social Committee and the Committee of the Regions - on a New Approach for a Sustainable Blue Economy in the EU Transforming the EU's Blue Economy for a Sustainable Future. Brussels: European Commission.
European Commission (2019). Communication from the Commission to the European Parliament, the Council, the European Economic and Social Committee, and the Committee of the Regions. Brussels: The European Green Deal.
European Commission (2020b). The EU Blue Economy Report. Available at: https://op.europa.eu/it/publication-detail/-/publication/83843365-c18d-11ea-b3a4-01aa75ed71a1 (Accessed April 13, 2022).
European Environment Agency (EEA) (2022). Greenhouse Gas Emission Intensity of Electricity Generation in Europe. Available at: https://www.eea.europa.eu/ims/greenhouse-gas-emission-intensity-of-1 (Accessed April 13, 2022).
Fenu, B., Attanasio, V., Casalone, P., Novo, R., Cervelli, G., Bonfanti, M., et al. (2020). Analysis of a Gyroscopic-Stabilized Floating Offshore Hybrid Wind-Wave Platform. Jmse 8, 439. doi:10.3390/jmse8060439
Ghigo, A., Cottura, L., Caradonna, R., Bracco, G., and Mattiazzo, G. (2020). Platform Optimization and Cost Analysis in a Floating Offshore Wind Farm. Jmse 8, 835. doi:10.3390/jmse8110835
Golightly, C. R. (2017). GO-ELS Ltd. – Anchoring for Floating Wind Turbines Future Offshore Foundations. Available at: https://www.researchgate.net/publication/321011241 (Accessed April 13, 2022).
Huang, Y.-F., Gan, X.-J., and Chiueh, P.-T. (2017). Life Cycle Assessment and Net Energy Analysis of Offshore Wind Power Systems. Renew. Energy 102, 98–106. doi:10.1016/j.renene.2016.10.050
Intergovernmental Panel on Climate Change (IPCC) (2013). Fifth Assessment Report. The Physical Science Basis. Available at: https://www.ipcc.ch/report/ar5/wg1/(Accessed April 13, 2022).
International Renewable Energy Agency (IRENA) (2019). Future of Wind. Deployment, Investment, Technology, Grid Integration and Socio-Economic Aspects. Available at: https://www.irena.org/-/media/Files/IRENA/Agency/Publication/2019/Oct/IRENA_Future_of_wind_2019.pdf (Accessed April 13, 2022).
International Standard Organization (ISO) (2006). Environmental Management and Life Cycle Assessment e principles and Framework, Goal and Scope Definition and Life Cycle Inventory Analysis, Life Cycle Impact Assessment and Life Cycle Interpretation. Geneva: International Organization for Standardization.
International Standard Organization (ISO) (2020). Environmental Management and Life Cycle Assessment e requirements and Guidelines. Geneva: International Organization for Standardization.
Jonkman, J. M., Butterfield, S., Musial, W., and Scott, G. (2009). Definition of a 5-MW Reference Wind Turbine for Offshore System Development. Technical Report NREL/TP-500-38060. Golden, CO: National Renewable Energy Lab. (NREL). doi:10.2172/947422
Kettle, A. J. (2020). Storm Xaver over Europe in December 2013: Overview of Energy Impacts and North Sea Events. Adv. Geosciences 54, 137–147. doi:10.5194/adgeo-54-137-2020
Lee, H., Poguluri, S., and Bae, Y. (2018). Performance Analysis of Multiple Wave Energy Converters Placed on a Floating Platform in the Frequency Domain. Energies 11, 406. doi:10.3390/en11020406
Les Eoliennes Flottantes du Golfe du Lion (EFGL) (2018). Qu’est-ce que l’éolien flottant? Pourquoi au large de leucate et du barcarès? Available at: https://info-efgl.fr/wp-content/uploads/2021/05/EFGL_fiche_Eolien_flottant.pdf (Accessed April 13, 2022).
Maestrale (2022). Maestrale. Available at: https://maestrale.interreg-med.eu/(Accessed April 13, 2022).
Moro, A., and Lonza, L. (2017). Electricity Carbon Intensity in European Member States: Impacts on GHG Emissions of Electric Vehicles. Transp. Res. D. Transp. Environ. 64, 5–14. doi:10.1016/j.trd.2017.07.012
Nguyen-Thanh, N., Zhou, K., Zhuang, X., Areias, P., Nguyen-Xuan, H., Bazilevs, Y., et al. (2016). Isogeometric Analysis of Large-Deformation Thin Shells Using RHT-Splines for Multiple-Patch Coupling. Comput. Methods Appl. Mech. Eng. 316, 1157–1178. doi:10.1016/j.cma.2016.12.002
Palmiotti, D. (2022). Taranto, il primo parco eolico offshore d’Italia va verso il completamento - Completata l'installazione della prima delle 10 turbe di Beleolico. Nel Salento arrivo U. N. parco “galleggiante”.
Pantusa, D., Francone, A., and Tomasicchio, G. R. (2020). Floating Offshore Renewable Energy Farms. A Life-Cycle Cost Analysis at Brindisi, Italy. Energies 13, 6150. doi:10.3390/en13226150
Pantusa, D., and Tomasicchio, G. R. (2019). Large-scale Offshore Wind Production in the Mediterranean Sea. Cogent Eng. 6, 1661112. doi:10.1080/23311916.2019.1661112
Poujol, B., Prieur‐Vernat, A., Dubranna, J., Besseau, R., Blanc, I., and Pérez‐López, P. (2020). Site‐specific Life Cycle Assessment of a Pilot Floating Offshore Wind Farm Based on Suppliers' Data and Geo‐located Wind Data. J. Industrial Ecol. 24, 248–262. doi:10.1111/jiec.12989
PRé Consultants (2020). SimaPro 9.1.1. Available at: https://simapro.com/(Accessed April 13, 2022).
Principle Power INC (2022). Principle Power. Available at: https://www.principlepowerinc.com/en/home/interactive-windfloat (Accessed April 13, 2022).
Pulselli, R. M., Marchi, M., Neri, E., Marchettini, N., and Bastianoni, S. (2019). Carbon Accounting Framework for Decarbonisation of European City Neighbourhoods. J. Clean. Prod. 208, 850–868. doi:10.1016/j.jclepro.2018.10.102
Pulselli, R. M., Struglia, M. V., Maccanti, M., Bruno, M., Patrizi, N., Neri, E., et al. (2022). Integrated Blue Energy Planning Framework in the Mediterranean: Three Case Studies from the Interreg Med BLUE DEAL Project. Front. Energy Res. - Sustain. Energy Syst. Policies.
Raadal, H. L., and Vold, B. I. (2012). GHG Emissions and Energy Performance of Wind Power - LCA of Two Existing Onshore Wind Farms and Six Offshore Wind Power Conceptual Designs. Available at: https://norsus.no/wp-content/uploads/2412.pdf (Accessed April 13, 2022).
Raadal, H. L., Vold, B. I., Myhr, A., and Nygaard, T. A. (2014). GHG Emissions and Energy Performance of Offshore Wind Power. Renew. Energy 66, 314–324. doi:10.1016/j.renene.2013.11.075
Regione Lazio (2021). Eolico offshore per la transizione ecologica di Civitavecchia: sfide e opportunità. Position paper. Available at: https://www.lazioinnova.it/app/uploads/2022/02/Position-paper-Eolico-offshore-Civitavecchia.pdf (Accessed May 25, 2022).
Robertson, A. N., and Jonkman, J. M. (2011). Loads Analysis of Several Offshore Floating Wind Turbine Concepts. Available at: https://www.nrel.gov/docs/fy12osti/50539.pdf (Accessed April 13, 2022).
Roddier, D., Cermelli, C., Alexia Aubault, A., and Weinstein, A. (2010). WindFloat: A Floating Foundation for Offshore Wind Turbines. J. Renew. Sustain. Energy 2, 033104. doi:10.1063/1.3435339
Roy, A., Auger, F., Dupriez-Robin, F., Bourguet, S., and Tran, Q. T. (2018). Electrical Power Supply of Remote Maritime Areas: A Review of Hybrid Systems Based on Marine Renewable Energies. Energies 11, 1904. doi:10.3390/en11071904
Russell, D. J. F., Brasseur, S. M. J. M., Thompson, D., Hastie, G. D., Janik, V. M., Aarts, G., et al. (2014). Marine Mammals Trace Anthropogenic Structures at Sea. Curr. Biol. 24, R638. doi:10.1016/j.cub.2014.06.033
Sacchi, R., Besseau, R., Pérez-López, P., and Blanc, I. (2019). Exploring Technologically, Temporally and Geographically-Sensitive Life Cycle Inventories for Wind Turbines: A Parameterized Model for Denmark. Renew. Energy 132, 1238–1250. doi:10.1016/j.renene.2018.09.020
SINN Power GmbH. (2022). SINN Power. Available at: https://www.sinnpower.com/(Accessed April 13, 2022).
Stančin, H., Pfeifer, A., Perakis, C., Stefanatos, N., Damasiotis, M., Magaudda, S., et al. (2022). Blue Energy Spearheading the Energy Transition: The Case of Crete. Front. Energy Res. - Sustain. Energy Syst. Policies 10, 868334. doi:10.3389/fenrg.2022.868334
Staschus, K., Kielichowska, I., Ramaekers, L., Wouters, C., Vree, B., and Lejarreta, A. V. (2020). Study on the Offshore Grid Potential in the Mediterranean Region. Publications Office of the European Union. Available at: https://data.europa.eu/doi/10.2833/742284.
Supachawarote, C. (2006). Inclined Load Capacity of Suction Caisson in Clay. dissertation/Ph.D. thesis. Perth: University of Western Australia. https://research-repository.uwa.edu.au/files/3226499/Supachawarote_Chairat_2006.pdf.
Swiss helicopter (2022). Swiss Helicopter. Available at: https://www.swisshelicopter.ch/it/su-di-noi/flotta/agusta-a109e (Accessed April 13, 2022).
Tomasicchio, G. R., D'Alessandro, F., Avossa, A. M., Riefolo, L., Musci, E., Ricciardelli, F., et al. (2018). Experimental Modelling of the Dynamic Behaviour of a Spar Buoy Wind Turbine. Renew. Energy 127, 412–432. doi:10.1016/j.renene.2018.04.061
Tsai, L., Kelly, J. C., Simon, B. S., Chalat, R. M., and Keoleian, G. A. (2016). Life Cycle Assessment of Offshore Wind Farm Siting: Effects of Locational Factors, Lake Depth, and Distance from Shore. J. Industrial Ecol. 20 (6), 1370–1383. doi:10.1111/jiec.12400
Vattenfall (2018). Offshore-Windpark – Ein Paradies für Muscheln. Available at: https://group.vattenfall.com/de/newsroom/blog/2018/01/offshore-windpark–-ein-paradies-fur-muscheln (Accessed April 13, 2022).
Vestas (2021). 2 MW Platform. Available at: https://nozebra.ipapercms.dk/Vestas/Communication/Productbrochure/2MWTurbineBrochure/2mw-platform-brochure/?page=2 (Accessed April 13, 2022).
Vestas (2011). Life Cycle Assessment of Electricity Production from a V90-2.0 MW Gridstreamer Wind Plant. Available at: https://www.vestas.com/content/dam/vestas-com/global/en/sustainability/reports-and-ratings/lcas/LCA_V902MW_version1.pdf.coredownload.inline.pdf (Accessed April 13, 2022).
Vestas (2015). Life Cycle Assessment of Electricity Production from an Onshore V110-2.0 MW Wind Plant. Available at: https://www.vestas.com/content/dam/vestas-com/global/en/sustainability/reports-and-ratings/lcas/LCAV11020MW181215.pdf.coredownload.inline.pdf (Accessed April 13, 2022).
Vestas (2017). Life Cycle Assessment of Electricity Production from an Onshore V112-3.45 MW Wind Plant. Available at: https://www.vestas.com/content/dam/vestas-com/global/en/sustainability/reports-and-ratings/lcas/V1123%2045MW_Mk3a_ISO_LCA_Final_31072017.pdf.coredownload.inline.pdf (Accessed April 13, 2022).
Vryhof (2018). Vryhof Manual – the Guide to Anchoring. Available at: http://insights.vryhof.com/download-the-vryhof-manual (Accessed April 13, 2022).
Wang, Q., Yu, Z., Ye, R., Lin, Z., and Tang, Y. (2019). An Ordered Curtailment Strategy for Offshore Wind Power under Extreme Weather Conditions Considering the Resilience of the Grid. IEEE Access 7, 54824–54833. doi:10.1109/access.2019.2911702
Wang, S., Wang, S., and Liu, J. (2019). Life-cycle Green-House Gas Emissions of Onshore and Offshore Wind Turbines. J. Clean. Prod. 210, 804–810. doi:10.1016/j.jclepro.2018.11.031
Weinzettel, J., Reenaas, M., Solli, C., and Hertwich, E. G. (2009). Life Cycle Assessment of a Floating Offshore Wind Turbine. Renew. Energy 34, 742–747. doi:10.1016/j.renene.2008.04.004
Wikantyoso, F., Oktavitasari, D., Tjahjana, D. D. D. P., Hadi, S., and Pramujati, B. (2019). ““The Effect of Blade Thickness and Number of Blade to Crossflow Wind Turbine Performance Using 2D CFD Simulation”,” in International Journal of Innovative Technology and Exploring Engineering (IJITEE) (Bhopal, INDIA: Blue Eyes Intelligence Engineering & Sciences Publication), 17–21.
Wind Europe (2019). Our Energy, Our Future: How Offshore Wind Will Help Europe Go Carbon-Neutral. Available at: https://windeurope.org/wp-content/uploads/files/about-wind/reports/WindEurope-Our-Energy-Our-Future.pdf (Accessed April 13, 2022).
Wind Europe (2021). Wind Energy in Europe in 2020-2020 Statistics and the Outlook for 2021-2025. Available at: https://windeurope.org/wp-content/uploads/files/about-wind/reports/WindEurope-Our-Energy-Our-Future.pdf (Accessed April 13, 2022).
Keywords: raft-buoy wind turbine, spar-buoy wind turbine, carbon footprint, life cycle assessment, carbon intensity of electricity
Citation: Pulselli RM, Maccanti M, Bruno M, Sabbetta A, Neri E, Patrizi N and Bastianoni S (2022) Benchmarking Marine Energy Technologies Through LCA: Offshore Floating Wind Farms in the Mediterranean. Front. Energy Res. 10:902021. doi: 10.3389/fenrg.2022.902021
Received: 22 March 2022; Accepted: 09 June 2022;
Published: 30 June 2022.
Edited by:
Muyiwa S. Adaramola, Norwegian University of Life Sciences, NorwayReviewed by:
Carlos Pérez-Collazo, University of Vigo, SpainDavide Magagna, European Commission, Netherlands
Copyright © 2022 Pulselli, Maccanti, Bruno, Sabbetta, Neri, Patrizi and Bastianoni. This is an open-access article distributed under the terms of the Creative Commons Attribution License (CC BY). The use, distribution or reproduction in other forums is permitted, provided the original author(s) and the copyright owner(s) are credited and that the original publication in this journal is cited, in accordance with accepted academic practice. No use, distribution or reproduction is permitted which does not comply with these terms.
*Correspondence: Matteo Maccanti, matteo.maccanti@unisi.it