PSO Supported Ensemble Algorithm for Bad Data Detection Against Intelligent Hacking Algorithm
 Levent Yavuz1
  Ahmet Soran
 Ahmet Onen
 SM Muyeen
- 1Electrical and Electronics Engineering Department in Abdullah Gul University, Kayseri, Turkey
- 2Computer Engineering Department in Abdullah Gul University, Kayseri, Turkey
- 3Electrical and Computer Engineering Department in College of Engineering, Sultan Qaboos University, Al-Khoud, Oman
- 4Department of Electrical and Computer Engineering, Curtin University, Perth, WA, Australia
Power system cybersecurity has recently become important due to cyber-attacks. Due to advanced computer science and machine learning (ML) applications being used by malicious attackers, cybersecurity is becoming crucial to creating sustainable, reliable, efficient, and well-protected cyber-systems. Power system operators are needed to develop sophisticated detection mechanisms. In this study, a novel machine-learning-based detection algorithm that combines the five most popular ML algorithms with Particle Swarm Optimizer (PSO) is developed and tested by using an intelligent hacking algorithm that is specially developed to measure the effectiveness of this study. The hacking algorithm provides three different types of injections: random, continuous random, and slow injections by adaptive manner. This would make detection harder. Results shows that recall values with the proposed algorithm for each different type of attack have been increased.
Introduction
Power systems have been evolved and exposed to significant changes due to integrating sophisticated wide-area communication systems and having control infrastructures in the grids. With the high usage of internet-based technology, cyber-attacks are becoming more critical and dangerous since most devices are connected to the grid or communicate with each other through a network. Partial outages or widespread blackouts can occur if the system cannot correctly detect the harmful intrusions in time.
One of the ways to get rid of these attacks is to monitor the power systems more frequently, mainly with the Supervisory Control and Data Acquisition System (SCADA). SCADA systems are composed of hardware devices that help in collecting and monitoring data. Advanced Metering Infrastructure (AMI) (Kabalci 2016) and Phasor Measurement Unit (PMU) devices are used for the same purposes. PMU is typically faster and more accurate than SCADA. However, collecting data is not enough to analyze the system while identifying whether bad data is being injected. It is still required to have smart software tools to build safe, robust, and reliable grid systems against cyber-attacks.
The Energy Management System (EMS) provides more secure grid control mechanisms, and it protects the system from hacking attacks since they are fully equipped with many sensors and detection devices that need to be communicated online for the safe operations of the power grid (Musleh et al., 2019). Hacking attacks generally occur by injecting bad data into controller units to get control of the system with operations such as causing cracking/authentication failure, worm attack, hybrid attack, etc., (Ahn and Kim 2020). These false data may negatively affect the system through things such as false billing, energy theft, data manipulation attack, and false dispatch, which causes generation and demand mismatch (Xie, Mo, and Sinopoli 2010). Inaccurate energy monitoring could change the relay position, and as a result, blackouts may happen (Tyuryukanov et al., 2016). Blackouts/power outages are having adverse effects on the power market. Hackers have attacked two power grids in Ukraine, which caused 200 MW energy loss in the country (J. Condliffe 2016). However, having bad data does not always mean that the system is under attack. Hardware malfunctions or communication noise can also produce some unusual data that might be mistakenly classified as an intrusion attempt. So, it is vital to detect the bad-data injection and distinguish them from the system noise to avoid the harm of these attacks.
A plethora of new techniques for intrusion detection have been developed and tested recently (Huang et al., 2014; Lee and Moon 2018; Chen et al., 2019; Esmalifalak, 2017, Liu, et al., 2017; D. Wang et al., 2013). These techniques are mainly focusing on software-based detection methods. Researchers (Pal, Sikdar, and Chow 2018) have developed a Gaussian mixture model-based statistical anomaly detection model that does not require any iterative computations, but it is not adaptive. That model measures attacked vectors and then features are reduced by Principal Component Analysis (PCA), which is used to calculate the proper threshold to detect the attacks. However, this model might not be able to provide a decent and full-secure system since trial-and-error type hacking attacks can discover the threshold and open the door to enter the system. These attacks are referred to as slow injection models and are attacks that protection systems cannot easily handle. The Distributed Kalman Filter approach is also applied for wide-area control of the smart grid (Musleh et al., 2019). In this article, threshold dependency is ignored, as threshold-dependent behavior is not well-adaptive, and the model cannot change protection schemes according to attack type. The Linear Weighted Least Square model-based algorithms (Yang et al., 2014; Wu et al., 2018) are developed to deal with hacking attacks. However, this model ignores the cybersecurity perspective, and the computational processing time is at an unsatisfactory level. Also, a game-theory based model that provides a practical and sophisticated understanding of the gaming process between attackers and defenders is proposed to solve network monitoring problems (Q. Wang et al., 2019). A hybrid model, including Gaussian distribution, statistical tools, and forecasting approaches, is another solution for bad data detection (Zhao et al., 2017). Still, the processing time window is not fast enough, so the Principal Component Analysis (PCA) method is applied to raw data before coming up with a decision. This method decreases the number of features to obtain the most significant dataset, but there are still pitfalls with this solution. Because attackers can inject every kind of data into the power system, this method may cause some crucial data to be missed during the feature decreasing process.
Many other machine-learning-based methods have been developed for detecting bad data. Most of the time, monitoring devices and firewalls cannot cope with unintended data, therefore, prediction algorithms become a good alternative as a solution. Several methods are proposed in the literature, including, but not limited to, Support Vector Machine (SVM), combined SVM with PCA, Partitioning Method, Partitioning combined K-means, Neural Networks, and Convolutional Neural Network (CNN) with Long Short-term Memory (LSTM) (Izakian and Pedrycz 2014; Esmalifalak, 2017; Liu, et al., 2017; Niu and Sun 2018; Wei et al., 2018; Young et al., 2018). These algorithms have some superiority over others, depending on the type and nature of badly injected data. In many cases, one individual weak-learner algorithm cannot achieve sufficient accuracy results to detect the bad data, even after improving the performance by employing various boosting approaches. Therefore, in this presented work, five well-known and most commonly used weak-learner machine learning algorithms are combined to develop a powerful decision mechanism that allows them to decide together and compensate for the uncorrected prediction of each other with the help of Particle Swarm Optimizer (PSO). The PSO optimizes the algorithm weights based on their individual prediction success during the bagging process. Another contribution in this work is to create different hacking algorithm schemes to test the proposed detection model. The expected data and the intrusions are generated with PSCAD IEEE 14 bus system. One of the strengths of the proposed ensemble method is to have a self-healing ability in case of any dataset or topological changes. PSO will find the optimal subset of the weak learners with the most suitable weights.
Hacking Algorithm and Bad Data Injection explains the proposed bad data injection model for the hacking algorithms. The ensemble algorithms and weak learners are discussed in Proposed Bad Data Detection. In Simulation Model and Case Study, the proposed algorithm architecture is presented. The effectiveness and success of the proposed algorithm is represented in Result and Discussion by comparing the results with individual ML algorithms and other ensemble methods. Finally, the findings of the proposed work are summarized in the conclusion section.
Hacking Algorithm and Bad Data Injection
Bad data injection attacks can be seen in any kind of network. However, it becomes more problematic when many devices are communicating with each other over the network, such as in Power Systems. In that case, regular firewalls and traditional security kits are not enough for dealing with bad data injection attacks.
There are many varieties of hacking attacks that are known and reported in the literature. The attack types are explained in the following list:
• Device Malfunction Attack: The communication devices can become unavailable due to a DoS (Denial of Service)/DDoS (Distributed Denial of Service) attack. Some system failures and delays can be seen in smart meters as well. IP addresses or MAC protocols send some unintended data packages to exceed the maximum connection (Tuan et al., 2019).
• Password-Cracking attack: There are always password requirements in smart grid communications. However, smart meters use digits as a password, and that can be cracked easily. And user information stealth or unwanted data packages can be sent to the network operator as a result of system failures, and blackouts can be seen (Hatzivasilis 2017).
• Authentication-Identifying Attack: Although some power systems have truly complex communications protocols (Modbus/TCP or 3.0/TCP), the receive/transmit type packages might be cleartext. Therefore, external attackers can easily monitor or manipulate it (Moosavi et al., 2015; Moreira et al., 2015).
• Worm Attack: Attackers directly target grid communication with worms, which are injected into the communication packages (voltage, current, phase angle, etc.) to manipulate the system. This type of attack can be considered as the most dangerous one since it can cover itself instead of harming the system immediately. There are several types of worm attacks in power systems that need protection. Otherwise, the results of this attack can be critical and dangerous. In previous research (Ma et al., 2015; Moreira et al., 2015), manipulation with unintended injections are created as the same as worm attacks.
In this work, the IEEE-14 bus PSCAD model is simulated to generate voltage, current, and frequency signals. These signals are manipulated by a hacking mechanism that provides three different injection types for three different signals. Figure 1 represents the flowchart of hacking algorithms and their relations with the proposed method. Hacking algorithm’s working principle is also explained in Figure 1. There are three different injection types that have been simulated by python; on the flowchart each process is shown together, but during the experiment each hacking process is tested individually. Each hacking process is applied five times, so 15 different datasets are obtained. Each individual ML algorithm and proposed method are tested with all datasets and all recall values are averaged.
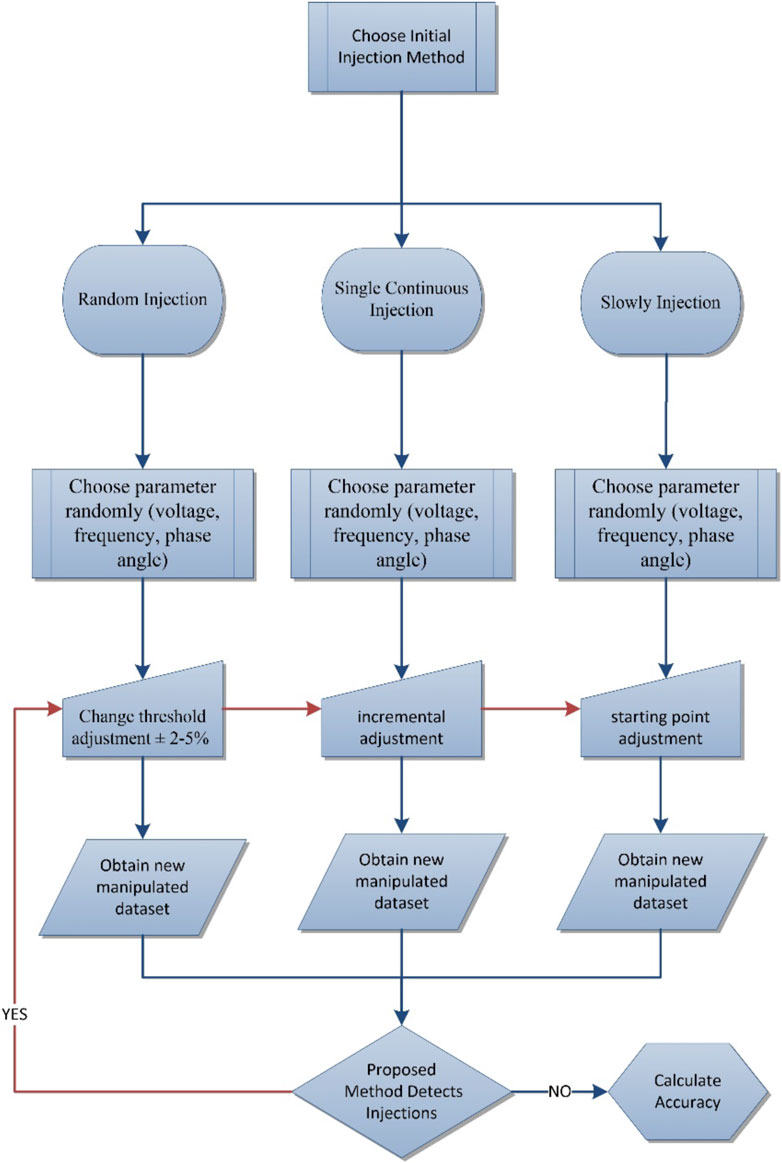
FIGURE 1. Hacking algorithms flowchart.
The algorithms must be checked under random states, so in the python library, the NumPy generator uses a pseudo number generator. The linear congruential generator is one of the most common methods to generate random numbers. The method can be defined as:
In Eq. 2.1 the generated sequential integer number chooses the column and rows which are targeted for injections, where x is a pseudo-random value, m is a module that is smaller than x, c is increment, and x0 is the starting value. After selecting columns and rows, the injection process has been started. So, the manipulated dataset has been obtained, and the training process has been started. In that step, each ML algorithm tries to detect the injections individually.
Random Points Injection Attack
In the power system, network communication signals include voltage, current, power, and phase angle. Most of the time, PMU-and SCADA-based devices monitor these signals, and system operators can control and manage the entire network by considering the collected data. At that point, somehow, attackers inject random points and try to manipulate the system. Security systems must detect these random bad-data packages, but most of the time, security systems cannot handle it since it is tough to distinguish healthy packages from the worm-injected data with conventional techniques. Thus, advanced machine learning algorithms must be specified for this purpose and examined with these data packages.
For that purpose, random points are generated considering the original data which is obtained by PSCAD simulation. Figure 2 represents original (blue points), and random (orange points) injected data. These random points are developed and injected to train and test the proposed method. The hacking algorithm undertakes the injection process.
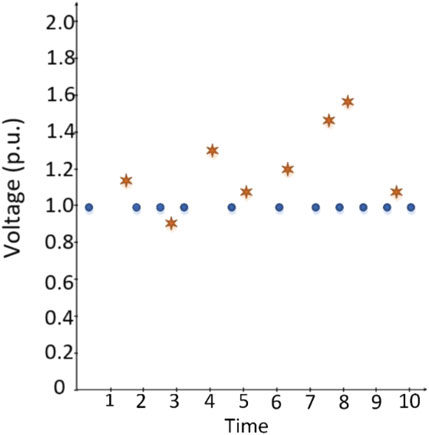
FIGURE 2. Random injection.
Single Continuous Attack
Random points injection attack is not always the scenario for the intrusions. An attacker can continuously implement the intervention in some cases, and the firewall systems must detect that attack type as well. Thus, a single continuous data injection model has been created to train the proposed method and strengthen the security wall.
To obtain this manipulation in the PSCAD simulations, 10% of the original data is used and a threshold is chosen between ± 2–5% with respect to original data. For example, in PSCAD the normal value of phase angle is 60.00, so manipulated data will be between +60.02 and 60.05 or −59.92 and 59.95 continuously, as shown in Figure 3.
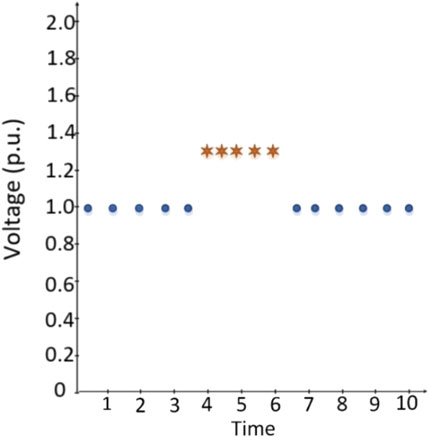
FIGURE 3. Continuous random injection.
Slow Injection Attack
Slow injection is another attack type that can be seen in the power networks. The attackers prefer to use it since it is very hard to detect, and it can defeat the system very quickly. When the system cannot prevent the attack, very critical problems such as the operating system collapsing, breakage of communication, wrong authentications, and data modification might occur. So, the proposed method is exposed to slow injection attack during the training session to learn this model. The attacker injects manipulated data into the power system slowly in order to create undetectable signals. The representation of the slow injection model are represented in Figure 4.
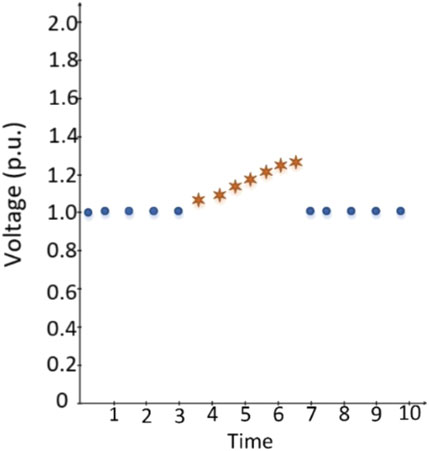
FIGURE 4. Slow injection.
Proposed Bad Data Detection
General ML algorithms learn from past data and predict the future by using all labeled information, referred to as supervised learning. The proposed method works as a supervised learning model. Initially, the proposed model learns from data with some injected points and it is tested with other labeled data. After that the performance of the model is measured by checking the algorithm’s predictions.
At the beginning of the process, PSCAD and Python linkage obtain the simulation data (clean data) from each bus at the same time. After this simulation generates the regular data, the developed hacking algorithm starts to inject bad data and the created dataset is given to ML algorithms. Standard weak learners work in parallel and the proposed bagging method finds the proper weights to combine all of them together. Throughout, another PSO module will calculate the optimized weights, which are used for the bagging process. Thus, weak learners settle their own decisions separately in parallel and finally the proposed method will combine all of them together with the trained weights to decide whether there is an injection. After this training session, each weak learner will find their ways to come up with a decision for upcoming requests as a prediction.
A good prediction algorithm can classify an upcoming packet correctly as bad data or not. However, sometimes, packets can be incorrectly identified by the detection system. Accuracy is one of the well-known measuring metrics to benchmark the performance of the model against other algorithms. It gets a set of input data, checks the correctness of the predictions, and scores accurate decisions. In some scenarios, wrong predictions can be tolerable since they are not vital for the system’s robustness. For example, capturing a bad packet might be more crucial than wrongly labeling regular packets. When the system drops one secure packet, it does not affect the system at a critical level. Contrary, if the security module allows any intrusion, it might fail the whole network. The main target in this scenario is to identify harmful packets. The system can label a packet as a hacking attempt when it carries harmful data (TP), or when it is a regular packet (FP). Also, the system might decide a packet as a regular one when it is an ordinary packet (TN), or when it is an intrusion attempt (FN). The critical values here are TP and FN decisions since FP and TN predictions do not seriously affect the system. Recall metric measures how the prediction model identifies the packets accurately when it is a hacking attempt. Thus, in this work, the recall performance metric is used to measure the proposed model’s achievement since the accuracy metric can mislead the decision. Figure 5 represents all prediction metrics and formulizes the calculations (Precision, Recall, Accuracy, and F1). In Figure 6, there are some unintended data represented and ML algorithms (individually) try to detect them. However, as it can be clearly seen, some of them can fail in different cases. While Logistic Regression (LogReg), LDA, and NB cannot define the injected data, k-Nearest Neighbor (kNN) and Support Vector Machine (SVM) can detect the point. That means none of the individual algorithms can reach 100% accuracy unless there is overfitting. Each ML algorithm has their own mathematical background and different injection models could generate distinct data patterns. So, one weak learner could detect one type of attack very well, while it might not perform adequately in another case or dataset. On the other hand, improving the ML algorithms can require some additional complex calculations and that can be very costly. In the proposed method each algorithm’s parameters have been tuned automatically at first by considering the injected data and their individual success. This tuning process is applied only once and after that, according to the algorithms’ own success criteria, PSO gives different weights to them by using 10 iterations with 100 swarms for each data. When all iterations are completed, then the optimizer decides the weights for reaching the most accurate results.
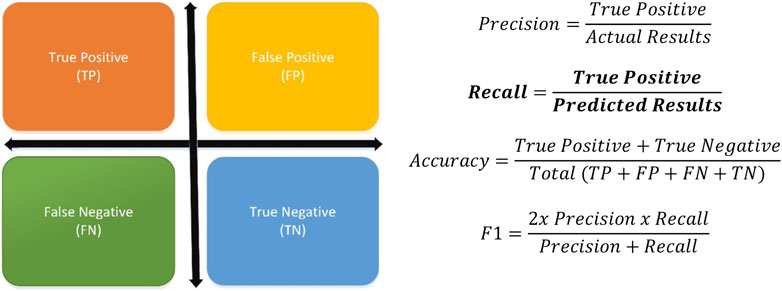
FIGURE 5. Algorithm’s prediction classes.
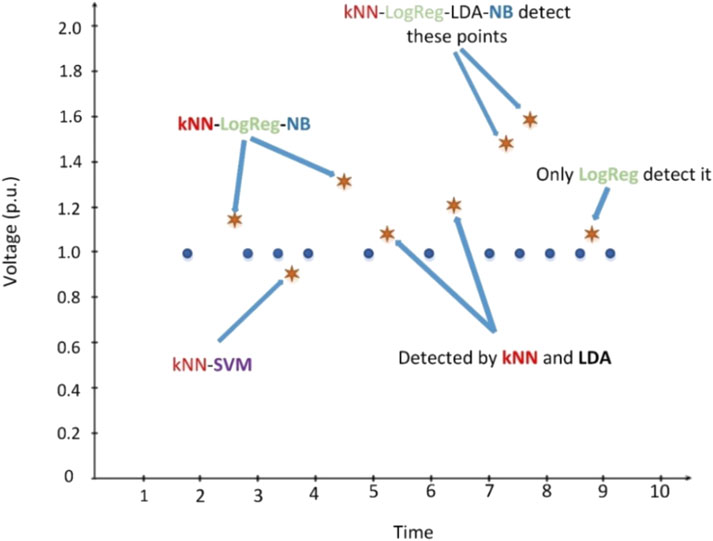
FIGURE 6. Comparison and evaluation results show that there is no single algorithm can detect all injections.
Table 1 shows the performances of each individual algorithm for a given attack scenario. Although the topology (IEEE-14 bus) and other network schemes are the same for each simulation, the same algorithms cannot achieve similar results in different cases. For example, in the random point injection case, kNN accuracy is 93% and LogReg accuracy is 83%, however, in the single continuous injection case kNN accuracy drops to 81% and LogReg accuracy goes up to 95%.
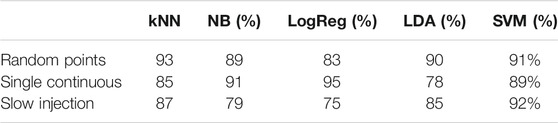
TABLE 1. Algorithms individual success (after parameter tuning).
Results show that different data patterns need to be handled individually since each ML algorithm has different mathematical backgrounds. Therefore, it is difficult to suppose that any weak learners can perform well under all three scenarios. The proposed method aims to build a new intrusion detection mechanism that is not affected when the attack strategy is changed. The main idea is to obtain the best recall results by closing the gaps among weak learners with the help of a PSO-supported bagging process.
In this part, the mathematical model of the generalized version of all five weak learners is given separately. Please assume that the dataset has n rows with m attributes and ML algorithms aim to classify a newcomer row as an injection (Class I) or not (Class II). Please note that, even though this example is considering the problem as a binary classification, k represents the number of classes in general format.
K-Nearest Neighbors (kNN) is one of the cluster-based weak learners in machine learning. Each data is represented in a vector space, and a number of attributes (m) gives the vector size. When a new row is given to the system as test data, kNN calculates the distances to each of the trained data to find k-nearest neighbors. If most k-neighbors are in Class I then the value is predicted as in Class I, or vs. Eq. 3.1 shows the general distance calculation formula, where d is a distance x, y values are coordinates of vectors, and m is the size of space.
Naïve Bayes (NB) is a probabilistic-based approach that relies on the frequency table of each attribute given in training data. Assume there are three different values (x, y, z) given as an attribute
There are also some statistical models used for the predictions, such as regression models. It approximates the probability of the class for a given specific predictor. Logistic regression (LogReg) is one of the regression fitting models that rely on a logarithmic function, also called sigmoid function. Since the output of this function has to be between 0 and 1, logistic regression is one of the most frequently used weak learners for binary classification. Eq. 3.3 shows the likelihood function
Richey, 2010 is another cluster-based technique mostly used as a weak learner in machine learning. It is a variance-based method that tries to maximize the differences between in-class variance and overall variance. Eq. 3.4 shows the probability density function where
Support Vector Machine (SVM) is another well-known technique in machine learning. SVM tries to find an optimal hyperplane that properly distinguishes the class area in vector space. Please remember that each row in the data can be represented as an m-dimension vector since m attributes are given. Eq. 3.5 shows the objective function of SVM. w is the m-dimension vector that shows the coefficient parameters, x is the data vector, and b is a bias value. The function g() is used here because different algorithms can be used to find the optimal hyperplane.
In the following equations, the mathematical explanation of the combination process and closing the gaps among weak learners are explained. The objective functions are dependent on x, which can be defined as F(x|k), and the optimization method is trying to maximize or minimize the recall rate. There are five weak learners (kNN, NB, LogReg, LDA, and SVM) used in this article; thus, the probability sequence would be (P1, P2,. . ., P5) for each class, respectively. Here, the particle swarm optimizer can find the best weights based on these
Combination Process
The proposed method’s key point is a combination of different ML algorithms. So, five of the well-known ML algorithms (kNN-NB-LogReg-LDA-SVM) are ensembled with the help of PSO. Algorithms decide together whether there is an injection or not. Each ML algorithm is tuned with the best parameters, given in Table 2.

TABLE 2. Tuned parameter of ML algorithms.
PSO gives algorithms different weights considering their success with 10 iterations and 100 swarms. Even the system faces different types of injection attacks or some topological changes, the proposed method can deal with them. The following equations explain the algorithm’s decision mechanism. M represents ML algorithms, W is weight of each algorithm which calculated by PSO, θ is multiplication of probability and weight, argmax is a function of python which gives the highest result of the function, and H represents both clean and infected data.
Where M is the set of individual machine learning algorithms, each one is represented as mla, the class labels are represented as H/U (which is “healthy” or “unhealthy”), and W shows the weights of the algorithms (M) is the function
The proposed method has been shown in Figure 7 and the following steps explain the workflow:
1. Collect the data from the PSCAD.
2. Three different manipulated datasets are obtained by python.
3. Infected datasets are injected into normal data.
4. Each ML algorithm’s parameters are tuned with respect to individual success.
5. After the parameter tuning, PSO-based combination begins. In that part, PSO finds the best weights for each ML algorithm according to their individual success, and lets algorithms decide together as one algorithm.
6. Combined algorithm has been developed, which has self-healing and adaptive features.
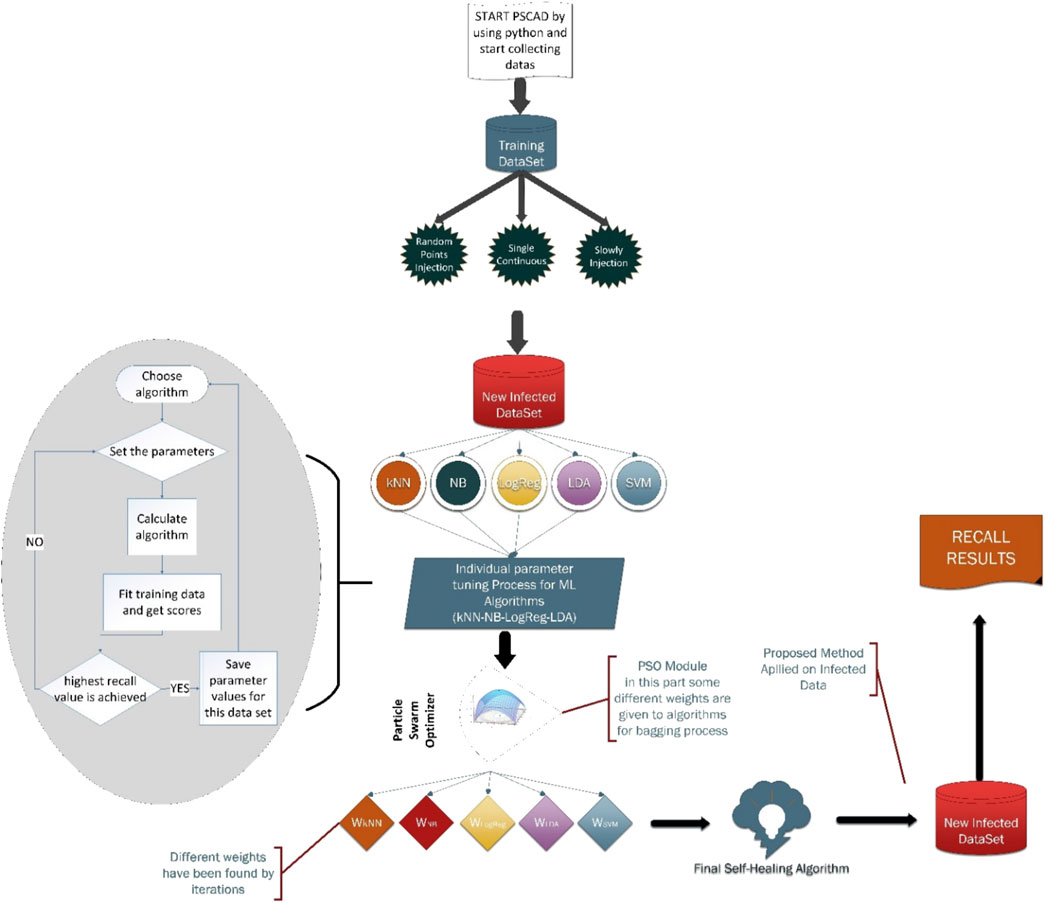
FIGURE 7. General workflow of the proposed method.
Simulation Model and Case Study
The proposed method has been evaluated in two different topologies and for each topology three injection cases are applied. In addition to the IEEE 14 bus system running on PSCAD simulation, three PV generators were injected into different busses. Three different cases are explained below:
Case 1: Random Data Injection (Standard Model/PV Added Model): Due to PMU malfunction, bad data is injected into our dataset as voltage, frequency, and phase angle. In that case, random points are created with the following equations: P: phase angle, V: Voltage, f: Frequency, D: Data, inf D: infected data, µr: Random Row, and µc: Random Column.
These points are represented with Equations with Eqs. 4.1, 4.2, 4.3. and iterations are reproduced five different times and then the proposed method is tested with injected datasets to have a tolerable confidence interval. 80% of infected data has been used for the training and the rest of the data is used to test the method. The recall results of the proposed method and single machine learning algorithms are represented in Table 2. Cross-validation (k = 5 iteration) method has been used in every scenario to avoid over/under fitting problems.
Case 2: Continuous Injection (Standard Model/PV added Model): As mentioned before, there are too many attack types that currently exist. Power system protection units must be powerful, sufficient, adaptive, and sustainable against these attacks even though attacks are continuous. The idea is that, instead of adding one single failure point, the continuous data manipulation has been injected into the main dataset. The continuous type attack’s mathematical expressions are described as below:
inf_Dp,f,v→ c_inf_Dp,f,v (Continue for 10 points).
c_inf_Dp,f,v → Dp,f,v (random data injected).
Case 3: Slow Injection (Standard Model/PV added Model): Slow injection type is one of the most challenging, because protection systems cannot easily distinguish injected data from the original ones. In Figure 4, slow injection starts from 3.5 s and goes until 6.5 s. This type of attack can easily crack firewalls and are hard to detect even with sophisticated intelligent tools. Thus, this case study is beneficial to test the proposed method due to its difficulty. Eqs. 4.5, 4.6, 4.7 describe this attack type:
µr µc [Dp,f,v]2% ∗ %10 = inf_Dp,f,v
µr µc [Dp,f,v]4% ∗ %10 = inf_Dp,f,v
µr µc [Dp,f,v]6% ∗ %10 = inf_Dp,f,v.
Result and Discussion
Hacking attacks on power systems can occur in many different ways and must be detected accurately as soon as possible. Conventional protection systems generally use thresholds to detect fault and they do not use self-healing/adaptive mechanisms, so they may end up with low accuracy (in this work recall) rates on hacking attacks. In this work, there are three different types of attacks that have been developed by hacking algorithms and applied into datasets which have been obtained by PSCAD and Python linkage. After that, each ML algorithm (weak learners) was trained and tested individually; results show that each ML algorithm reached different recall success. However, comparison results show that boosting algorithms results are very high. In that case the proposed method is trained and tested with these same infected datasets. Though, the boosting method has superiority on the bagging method, in the proposed method weak learners are combined with the bagging method. As a result, comparison tables show that the proposed method reaches a higher recall value.
In Tables 3–5, ML algorithms’ individual recall results are not satisfied even though their parameters have been tuned automatically. While one of them can detect the injection, the other can fail in different conditions or attack types. Thus, the results show that the proposed method has superiority over each individual algorithm.
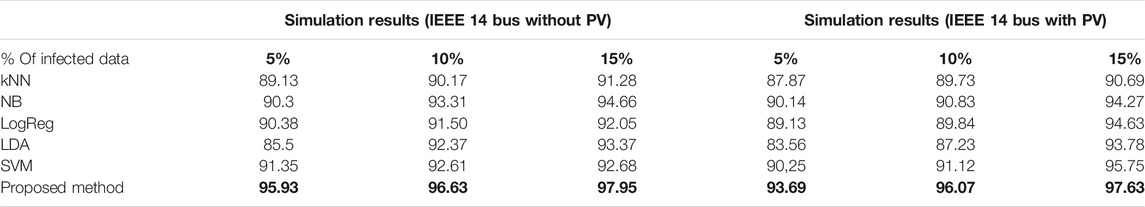
TABLE 3. Case 1: Comparison of algorithm’s average (five times run) recall values for random data injection.
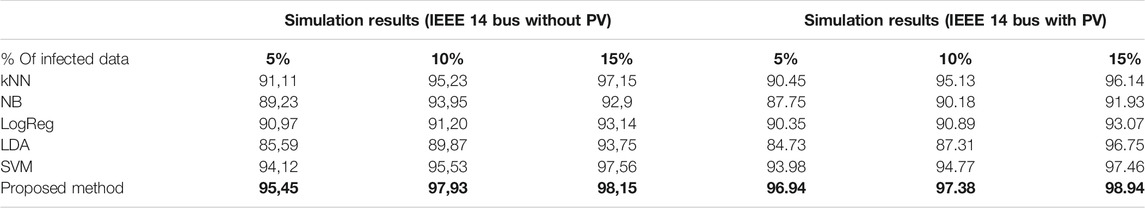
TABLE 4. Case 2: Comparison of algorithm’s average (five times run) recall values for single continuous injection.
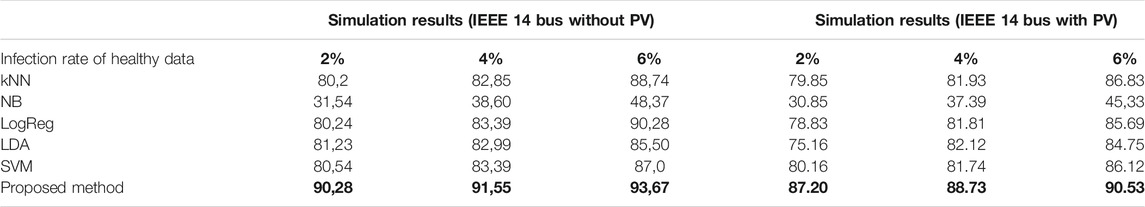
TABLE 5. Case 3: Comparison of algorithm’s average (five times run) recall values.
Case 1: Random Data Injection
Random data injection scenario is one of the most common methods used in power system attacks. In that case, attackers generate random points and inject them into PMU or SCADA systems, so as to cause blackout or steal some important data. In Table 3, the most popular detection algorithms and the proposed method results have been compared. The simulations are also tested for both conditions (the case with PV and without PV). Recall results drop a little bit in PV test system as expected, because the collected data points are not stable due to intermittent behavior of Sun. In addition to the fluctuations in PV added scenarios, the hacking algorithm is also applied to test the robustness and sustainability features of the proposed method.
Case 2: Single Continuous Injection
In that case, single continuous data points are injected into the power system. The prediction results are represented in Table 4. For each % of infected data case, the proposed method has superiority over others for several infected data percentages: 5%, 10%, and 15%
Case 3: Slow Injection
In case 3, data is slowly injected and results are represented in Table 5. Average results have been obtained after running it five times, and in total 10% of normal data has been manipulated and manipulation rate increased slowly from 2% up to 6%. There are also boosting algorithms available in literature and these algorithms work as an ensemble method. In case 3, boosting algorithms are also tested and compared with the proposed method. These algorithms are applied on the same datasets and comparison results are represented in Table 6. As the power system data starts to get noisier, boosting algorithms start to fail in that case. A drawback of boosting algorithms is that they may not work well with weather-dependent data. To test the proposed algorithm’s success and comparisons needed for noisy signals, three different PV generators have been added to IEEE 14 bus system. The results show that the proposed algorithm is also better than boosting algorithms.
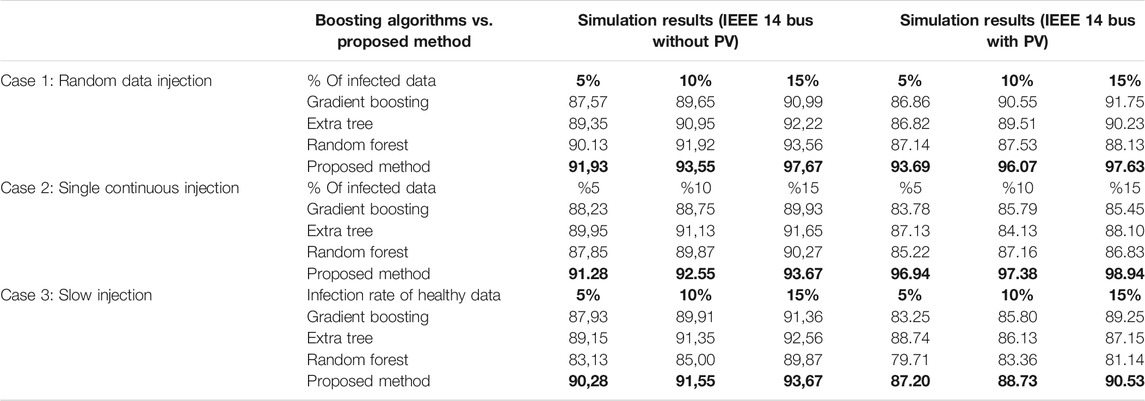
TABLE 6. Boosting algorithms and Proposed Method Comparison of Recall Success Percentages.
Conclusion
Power systems must be reliable and uninterruptable against the hacking attacks. The injection and data manipulation may cause damages and even blackouts. Thus, power systems should be capable of avoiding these dynamic and unpredictable attacks. For that reason, a combination of five different ML algorithms with PSO has been developed in this work. These combinations increase detection rate by changing each algorithm’s weight by using PSO. One of the benefits of the proposed method is adopting mechanics that can be used in different attacking actions and topological changes in systems. Another advantage of the proposed method is the use of only raw data which means that feature selections and data preparation processes are not needed. The proposed method is tested with random data injections, single continuous injection, and slow injection cases and the proposed methods’ recall value results are obtained as 95–98%, compromising for any kind of hacking attack.
Data Availability Statement
The raw data supporting the conclusion of this article will be made available by the authors, without undue reservation.
Author Contributions
All authors listed have made a substantial, direct, and intellectual contribution to the work and approved it for publication.
Conflict of Interest
The authors declare that the research was conducted in the absence of any commercial or financial relationships that could be construed as a potential conflict of interest.
Publisher’s Note
All claims expressed in this article are solely those of the authors and do not necessarily represent those of their affiliated organizations, or those of the publisher, the editors and the reviewers. Any product that may be evaluated in this article, or claim that may be made by its manufacturer, is not guaranteed or endorsed by the publisher.
References
Ahn, M. K., and Kim, Y. H. (2020). “Applied Sciences Hierarchical Multi-Stage Cyber Attack Scenario Modeling Based on G & E Model for Cyber Risk Simulation Analysis.” Appl. Sci. 10(4):1426.
Chen, R., Li, X., Zhong, H., and Fei, M. (2019). A Novel Online Detection Method of Data Injection Attack against Dynamic State Estimation in Smart Grid. Neurocomputing 344, 73–81. doi:10.1016/j.neucom.2018.09.094
Condliffe, J. (2016). Ukraines Power Grid Gets Hacked Again, a Worrying Sign for Infrastructure Attacks. Cambridge, Massachusetts: MIT Technology Rev. 2016.
Esmalifalak, M., Liu, L., Nguyen, N., Zheng, R., and Han, Z. (2017). Detecting Stealthy False Data Injection Using Machine Learning in Smart Grid. IEEE Syst. J. 11 (3), 1644–1652. doi:10.1109/JSYST.2014.2341597
Esmalifalak, M., Liu, L., Nguyen, N., Zheng, R., and Han, Z. (2017). Detecting Stealthy False Data Injection Using Machine Learning in Smart Grid. IEEE Syst. J. 11 (3), 1644–1652. doi:10.1109/jsyst.2014.2341597
Hatzivasilis, G. (2017). Password-Hashing Status. Cryptography 1, 10. doi:10.3390/cryptography1020010
Huang, Y., Esmalifalak, M., Esmalifalak, Mohammad., Cheng, Yu., Li, Husheng., Campbell, Kristy. A, and Han, Zhu. (2014). Adaptive Quickest Estimation Algorithm for Smart Grid Network Topology Error. IEEE Syst. J. 8 (2), 430–440. doi:10.1109/JSYST.2013.2260678
Izakian, H., and Pedrycz, W. (2014). Anomaly Detection and Characterization in Spatial Time Series Data: A Cluster-Centric Approach. IEEE Trans. Fuzzy Syst. 22 (6), 1612–1624. doi:10.1109/TFUZZ.2014.2302456
Kabalci, Y. (2016). A Survey on Smart Metering and Smart Grid Communication. Renew. Sust. Energ. Rev. 57, 302–318. doi:10.1016/j.rser.2015.12.114
Lee, C., and Moon, J.-H. (2018). Robust Lane Detection and Tracking for Real-Time Applications. IEEE Trans. Intell. Transport. Syst. 19 (12), 4043–4048. doi:10.1109/TITS.2018.2791572
Ma, J., Chen, Z., Liu, J., and Zheng, R. (2015). Analysis of Two-Worm Interaction Model in Heterogeneous M2M Network. Information 6, 613–632. “Analysis of Two-Worm Interaction Model in Heterogeneous M2M Network. doi:10.3390/info6040613
Moosavi, S. R., Gia, T. N., Rahmani, A.-M., Nigussie, E., Virtanen, S., Isoaho, J., et al. (2015). Amir-Mohammad Rahmani, SEA: A Secure and Efficient Authentication and Authorization Architecture for IoT-Based Healthcare Using Smart Gateways. Proced. Comp. Sci. 52, 452–459. doi:10.1016/j.procs.2015.05.013
Moreira, N., Molina, E., Lázaro, J., Jacob, E., and Astarloa, A. (2016). Cyber-Security in Substation Automation Systems. Renew. Sust. Energ. Rev. 54, 1552–1562. doi:10.1016/j.rser.2015.10.124
Musleh, A. S., Khalid, H. M., Muyeen, S. M., and Al-Durra, A. (2019). A Prediction Algorithm to Enhance Grid Resilience toward Cyber Attacks in WAMCS Applications. IEEE Syst. J. 13 (1), 710–719. doi:10.1109/JSYST.2017.2741483
Niu, X., and Sun, J. (2018). Dynamic Detection of False Data Injection Attack in Smart Grid Using Deep Learning, New Jersey, United States: IEEE.
Richey, M. (2010). The Evolution of Markov Chain Monte Carlo Methods Am. Mathematical Monthly, 117 (5), 383–413. doi:10.4169/000298910X485923
Pal, S., Sikdar, B., and Chow, J. H. (2018). Classification and Detection of PMU Data Manipulation Attacks Using Transmission Line Parameters. IEEE Trans. Smart Grid 9 (5), 5057–5066. doi:10.1109/TSG.2017.2679122
Tuan, N. N., Hung, P. H., Nghia, N. D., Tho, N. V., Phan, T. V., and Thanh, N. H. (2019). A DDoS Attack Mitigation Scheme in ISP Networks Using Machine Learning Based on SDN. Electronics 9, 1–19. doi:10.3390/electronics9030413
Tyuryukanov, I., Quirós-Tortós, J., Naglic, M., Popov, M., van der Meijden, M. A. M. M., and Terzija, V. (2016). Controlled islanding of power networks based on graph reduction and spectral clustering. Transm. Distribution Energ. Convers. (MedPower 2016) 112 (6). doi:10.1049/cp.2016.1101
Wang, D., Guan, X., Liu, T., Gu, Y., Sun, Y., and Liu, Y. (2013). A survey on bad Data injection attack in smart grid. Asia-Pacific Power and Energy Engineering Conference. Trivandrum, kerala: APPEEC. doi:10.1109/APPEEC.2013.6837157
Wang, Q., Tai, W., Tang, Y., Ni, M., and You, S. (2019). A Two-Layer Game Theoretical Attack-Defense Model for a False Data Injection Attack against Power Systems. Int. J. Electr. Power Energ. Syst. 104 (January), 169–177. doi:10.1016/j.ijepes.2018.07.007
Wei, Y., Zhang, X., Shi, Y., Xia, L., Pan, S., Wu, J., et al. (2018). A Review of Data-Driven Approaches for Prediction and Classification of Building Energy Consumption. Renew. Sust. Energ. Rev. 82 (February), 1027–1047. doi:10.1016/J.RSER.2017.09.108
Wu, Y., Xiao, Y., Hohn, F., Nordstrom, L., Wang, J., and Zhao, W. (2018). Bad Data Detection Using Linear WLS and Sampled Values in Digital Substations. IEEE Trans. Power Deliv. 33 (1), 150–157. doi:10.1109/TPWRD.2017.2669110
Xie, L., Mo, Y., and Sinopoli, B. (2010). False Data Injection Attacks in Electricity Markets. False Data Injection Attacks in Electricity Markets, 226–231. doi:10.1109/smartgrid.2010.5622048
Yang, H., Yi, D., Yi, D., Zhao, J., Luo, F., and Dong, Z. (2014). Distributed Optimal Dispatch of Virtual Power Plant Based on ELM Transformation. J. Ind. Manag. Optimization 10 (4), 1297–1318. doi:10.3934/jimo.2014.10.1297
Young, S., Abdou, T., and Bener, A. (2018). Deep Super Learner: A Deep Ensemble for Classification Problems Toronto, ON: Ryerson University.
Keywords: bad data detection, hacking mechanism, k-nearest neighbor, linear discriminant analysis, logistic regression, machine learning, particle swarm optimizer, support vector machine
Citation: Yavuz L, Soran A, Onen A and Muyeen S (2021) PSO Supported Ensemble Algorithm for Bad Data Detection Against Intelligent Hacking Algorithm. Front. Energy Res. 9:649460. doi: 10.3389/fenrg.2021.649460
Received: 04 January 2021; Accepted: 18 May 2021;
Published: 23 July 2021.
Edited by:
Fei Gao, University of Technology of Belfort-Montbéliard, FranceReviewed by:
Zhiguang Hua, Northwestern Polytechnical University, ChinaRui Ma, Northwestern Polytechnical University, China
Copyright © 2021 Yavuz, Soran, Onen and Muyeen. This is an open-access article distributed under the terms of the Creative Commons Attribution License (CC BY). The use, distribution or reproduction in other forums is permitted, provided the original author(s) and the copyright owner(s) are credited and that the original publication in this journal is cited, in accordance with accepted academic practice. No use, distribution or reproduction is permitted which does not comply with these terms.
*Correspondence: SM Muyeen, sm.muyeen@curtin.edu.au