 Qiuyu Xu1,2†
 Xiaohong Fan1†
 Gang Chen1*
 Jie Ma1Wenling Ye1
 Sanxi Ai1
 Li Wang3
 Ke Zheng1
 Yan Qin1
 Limeng Chen1
 Mingxi Li1Xuemei Li1*
- 1Department of Nephrology, Peking Union Medical College Hospital, Chinese Academy of Medical Sciences, Beijing, China
- 24 + 4 Medical Doctor Program, Chinese Academy of Medical Sciences & Peking Union Medical College, Beijing, China
- 3Department of Epidemiology and Biostatistics, Institute of Basic Medical Sciences Chinese Academy of Medical Sciences, School of Basic Medicine Peking Union Medical College, Beijing, China
Background: The burden of metabolic syndrome (MetS) continues to rise globally and is associated with complications of multiple organ systems. We aimed to identify the association between changes in MetS status and accelerated renal function progression through a regional epidemiological survey in China, thus discovering influence factors with treatable potential.
Methods: This study was a population-based survey conducted in 2008 and 2014, assessing a representative sample of 5,225 individuals from rural areas of China. They were divided into four subgroups according to their MetS status in 2008 and 2014 (Never, Previously abnormal, New-onset, and Consistent). Multivariate logistic regression and stratification analysis evaluated the relationship between clinical factors and renal function decline under different MetS statuses. Smooth curve fitting further addressed the role of serum uric acid, illustrating the vital turning point of uric acid levels in the background of renal function deterioration.
Results: Of all groups of MetS states, the new-onset MetS showed the most significant eGFR decline, with a 6.66 ± 8.21 mL/min/1.73 m2 decrease over 6 years. The population with newly-onset MetS showed a considerable risk increase in delta eGFR with a beta coefficient of 1.66 (95%CI=1.09-2.23) after necessary correction. In searching for the drivers, the strength of the association was significantly reduced after additional adjustment for uric acid levels (β=0.91, 95%CI=0.35-1.45). Regarding the turning point, uric acid levels exceeding 426 μmol/L were more significantly associated with the stepped-up deterioration of kidney function for those with new-onset MetS.
Conclusion: Metabolic syndrome demonstrated a solid correlation with the progression of renal function, particularly in those with newly-onset MetS status. In addition to the diagnostic components of MetS, hyperuricemia could be used as a marker to identify the high risk of accelerating eGFR decline early. Furthermore, we suggested a potential renal benefit for the newly-onset MetS population when maintaining their serum uric acid level below the criteria for asymptomatic hyperuricemia.
1 Introduction
Metabolic syndrome (MetS), with globally increasing prevalence (1), is characterized by cardiovascular risk factors, such as abdominal obesity, insulin resistance, hypertension, impaired glucose metabolism, and dyslipidemia. MetS is known to be with increased cardiovascular disease (CVD) risk in the general population (2), along with incident overt type 2 diabetes (3), non-alcoholic fatty liver disease (4), and hyperuricemia (5). The kidney is one of the established target organs damaged by metabolic factors. MetS is essential in new-onset chronic kidney disease (CKD) and CKD progression (6, 7). Although many studies associate MetS with CKD, causality remains unproven (8).
Previous observational studies have reported an independent association between MetS and proteinuria and renal function decline (9–11). However, the risk estimates for developing clinical outcomes with MetS and its components differed among these studies, some reporting statistically insignificant associations, especially when the sample was predominantly Asian (10, 12, 13). Diabetes and hypertension are the worldwide leading causes of development of both CKD and end-stage renal disease (ESRD), as well as in contemporary China (14). Since both impaired fasting glucose and elevated blood pressure (BP) are included in the definition of MetS, it would be essential to explore the impact of the other three MetS components or other metabolic factors outside the diagnostic criteria that could be intervened at an early stage in the context of slowing renal function decline.
Hyperuricemia is significantly associated with the development and severity of metabolic syndrome (15), while it is not currently included in the diagnostic criteria for MetS. Epidemiological studies showed that hyperuricemia independently predicts the development of CKD in individuals with normal kidney function (16, 17). However, not all studies have demonstrated a significant association between elevated serum uric acid levels and the incidence of CKD risk (18). The role of uric acid may be more challenging to identify in the context of multiple risk factors and pathogenetic mechanisms typical of overt CKD, such as proteinuria and high blood pressure. The discrepancy in clinical results raised whether urate-lowering treatment could provide a constant benefit in all patients with hyperuricemia and CKD (19, 20). This put forward the need to screen out particular populations more likely to benefit from intervention and determine the threshold values of serum uric acid above which intervention could be suggested.
Even though collectively, there is ample observational data to support an association between the MetS and CKD independent of hypertension or diabetes, limited attention has been directed towards understanding the impact of altered metabolic status on kidney function. Moreover, the earlier stages of CKD are typically missed because of their asymptomatic nature. To further the potential association of the MetS with CKD, we conducted an epidemiological investigation in rural China, an area known to have a high incidence of metabolic disease (21), to search for intervenable drivers behind the association between metabolic syndrome status change and decreased kidney function.
2 Materials and methods
2.1 Study population
The study population consisted of 6,925 adults recruited during two different periods from the Pinggu District, a suburban community in Beijing, PR. China. The target population was residents aged 30–75 years in 2008. Multistage clustered sampling was used to recruit study participants, with the probability proportional to population size in each stage. Details of multistage clustered sampling with the probability proportional to population size have been previously described (21, 22).
In the Cohort, 6,925 participants from 20 villages were enrolled and underwent a first study examination between April 2008 and March 2009. 5,364 (77.5%) of the participants returned for a second examination in 2014, and 5,273 had complete demographic data and history inquiries. 48 participants were excluded due to incomplete serum creatinine to calculate the estimated glomerular filtration rate (eGFR). Considering that the relevant indicators of participants with advanced CKD and those who had started dialysis might deviate significantly from the population average and cause significant interference to the study analysis, 4 participants with eGFR less than 30 mL/min/1.73 m2 in 2008 were excluded from the study. We finally included 5,225 subjects as a cohort in the current study (Figure 1).
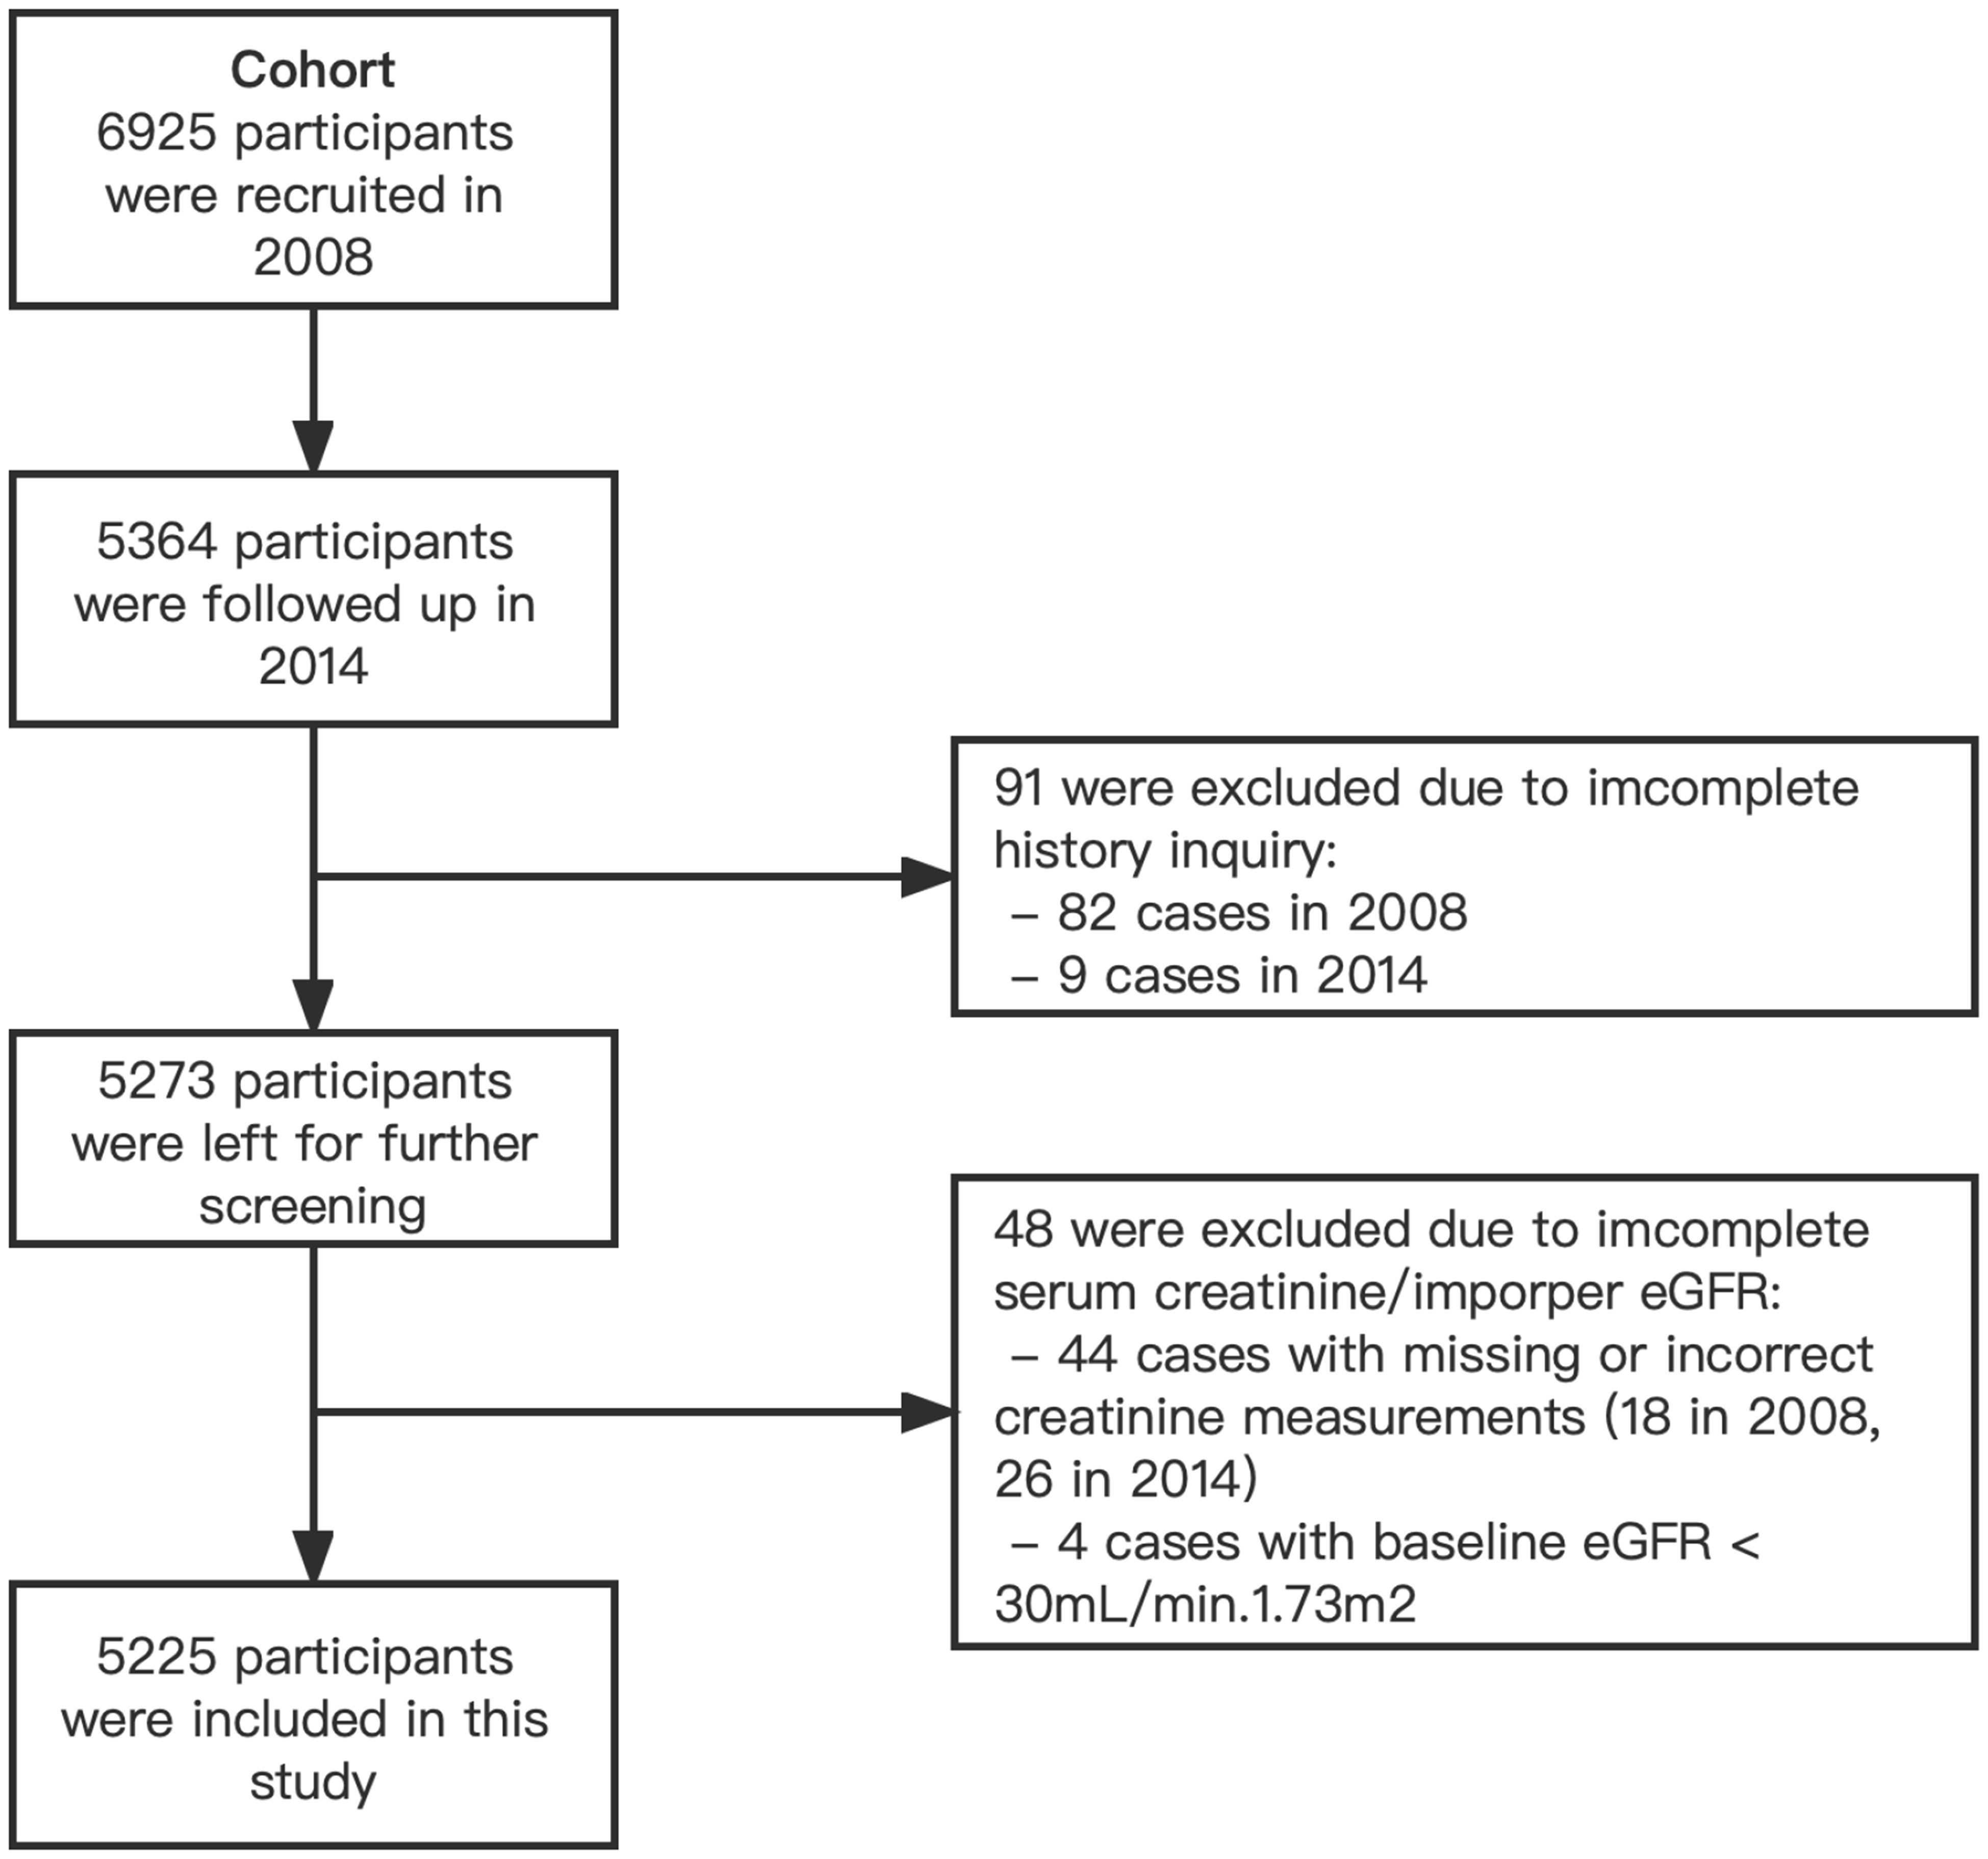
Figure 1 Flowchart of study population recruitment.
The Peking Union Medical College Hospital (PUMCH) Ethics Committee approved the study. Written informed consent was obtained from each participant before data collection.
2.2 Definitions
2.2.1 Metabolic syndrome
The definition of metabolic syndrome is based on criteria recommended in the National Cholesterol Education Program Adult Treatment Panel III (NCEP ATP III) guidelines with a modification (23, 24), which is widely used in China and other East Asian countries (25, 26). Metabolic syndrome was identified by the presence of three or more of the following components: abdominal obesity, hypertriglyceridemia (serum triglyceride level≥1.69 mmol/L), low HDL cholesterol level (HDL<1.29 mmol/L in women and <1.03 mmol/L in men), elevated blood pressure (average BP≥130/85 mmHg or on antihypertensive medications), and impaired glucose metabolism (presence of diabetes, use of oral hypoglycemics, or fasting blood glucose level ≥5.6 mmol/L). Specifically, abdominal obesity is defined as a waist circumference greater than 90 cm in men and greater than 80 cm in women, according to the International Obesity Task Force central obesity criteria for Asians (27).
2.2.2 Metabolic syndrome status
The participants were divided into four subgroups according to their disease status in 2008 and 2014. The ‘Never’ group was defined as those who did not meet the diagnostic criteria for MetS in either 2008 or 2014. Participants diagnosed with MetS in 2008 but did not meet the diagnosis in 2014 after lifestyle or pharmacological interventions were classified as the ‘Previously abnormal’ group. The ‘New-onset’ group referred to the population who did not meet a MetS diagnosis in 2008 and were newly diagnosed with MetS in 2014. Finally, those with persistent MetS status in 2008 and 2014 were labeled as the ‘Consistent’ group.
2.2.3 CKD and delta eGFR
GFR was estimated using the simplified prediction equation derived from the Chronic Kidney Disease Epidemiology Collaboration (CKD-EPI) (28). CKD is defined as an eGFR less than 60 mL/min/1.73 m2 (<1.00 mL/s/1.73 m2) according to the Kidney Disease: Improving Global Outcomes (KDIGO) 2012 Clinical Practice Guideline (29). The delta eGFR was calculated by estimating the difference in eGFR between 2008 and 2014 based on serum creatinine levels.
2.3 Measurements
All participants completed a questionnaire to document demographic information and self-reported living style status, previous medical history, family history, and medication history. Staff was trained to measure height, body weight, and circumference by a standardized method. BP was measured twice after at least 5 minutes of rest using a mercury sphygmomanometer. If the difference between the two measurements was >10 mmHg, a third measurement was obtained, and the mean value of the BPs was calculated using the two closest values.
Venous blood samples were collected after overnight fasting of 8 to 12 hours. The concentration of fasting blood glucose, serum creatinine, serum inorganic ions, uric acid, total cholesterol, low-density lipoprotein cholesterol, high-density lipoprotein cholesterol, and triglyceride were measured using a Beckman Coulter AU5800 (Brea, CA), and serum creatinine was determined and calibrated by an enzymatic method. Hemoglobin was measured using the SYSMEX-500 (Kobe, Japan). Plasma glycosylated hemoglobin (HbA1c) was detected by VARIANT II Turbo (Hercules, CA).
First void morning urine was collected to detect the albumin-to-creatinine ratio (ACR) using a Beckman Coulter AU270. Urine albumin was measured with the immunoturbidimetric method, and urine creatinine (UCr) was measured with an enzymatic method. Calibrated UCr was used for ACR; 200 urine samples were retested by Jaffe’s kinetic method, and the following calibration equation was approved (R2 = 0.997): calibrated UCr (mmol/l) = 0.884 UCr (mmol/l) + 0.3355.
All blood and urine samples were transferred at 4°C in iceboxes and tested at the PUMCH laboratory.
2.4 Statistical analyses
According to metabolic syndrome status, demographic data and laboratory measurements from two cross-sections were divided into four groups (Never, Previously abnormal, New-onset, and Consistent). The summarized statistical results were expressed as counts and percentages for the categorical data, and means with standard deviation were determined for continuous variables with approximately normal distributions. Differences between the four groups were compared using chi-square and one-way analysis of variance (ANOVA) for categorical and continuous variables, respectively. We performed univariate analysis to determine the effect of related factors on the prognosis of renal function. The criteria for variable inclusion in the following regression analysis were based on both statistical significance in univariate analysis and clinical relevance. To ensure the clinical relevance of the selected variables, we conducted a comprehensive evaluation through collaborative discussions involving experienced clinicians and statistical experts. We further remove the variables with strong multicollinearity in the multiple regression analysis.
Multivariate logistic regression and stratification analysis were conducted to investigate the relationship between clinical factors and renal function decline under different MetS statuses. Subgroup analysis was performed by stratified multiple regression analysis. Finally, we used smooth curve fitting and generalized additive models to address the nonlinear relationship between serum uric acid and renal function decline in different MetS status subgroups. For non-linearity in the model, a recursive algorithm was used to calculate the inflection point when non-linearity was detected, with a two-segmented linear regression model on either side of the inflection point. All data analyses and graphs were performed using R 4.2.0 (http://www.r-project.org) and EmpowerStats 4.1 epidemiology program (www.empowerstats.com).
3 Results
A total of 5,225 participants were included in our analysis. The weighted characteristics of the participants were subdivided according to their MetS status in 2008 and 2014, and their baseline characteristics are described in Tables 1, 2. Compared with other participants, the Consistent group was more likely to be female, self-reporting more cardiovascular diseases, and having a family history of obesity, hypertension, and diabetes (Table 1). Notably, the number of participants reporting prior gout in the overall population was quite limited. As for the laboratory tests, the Consistent group was more inclined to have higher uric acid levels, fasting glucose, hemoglobin A1c, total cholesterol (TC), triglyceride (TG), and urine ACR. It was worth mentioning that the New-onset group had the highest eGFR decline from 2008 to 2014, even exceeding the Consistent group (Table 2). The distribution of the delta eGFR in each subgroup was presented as a bar chart and violin plot in Supplementary Figure 1.
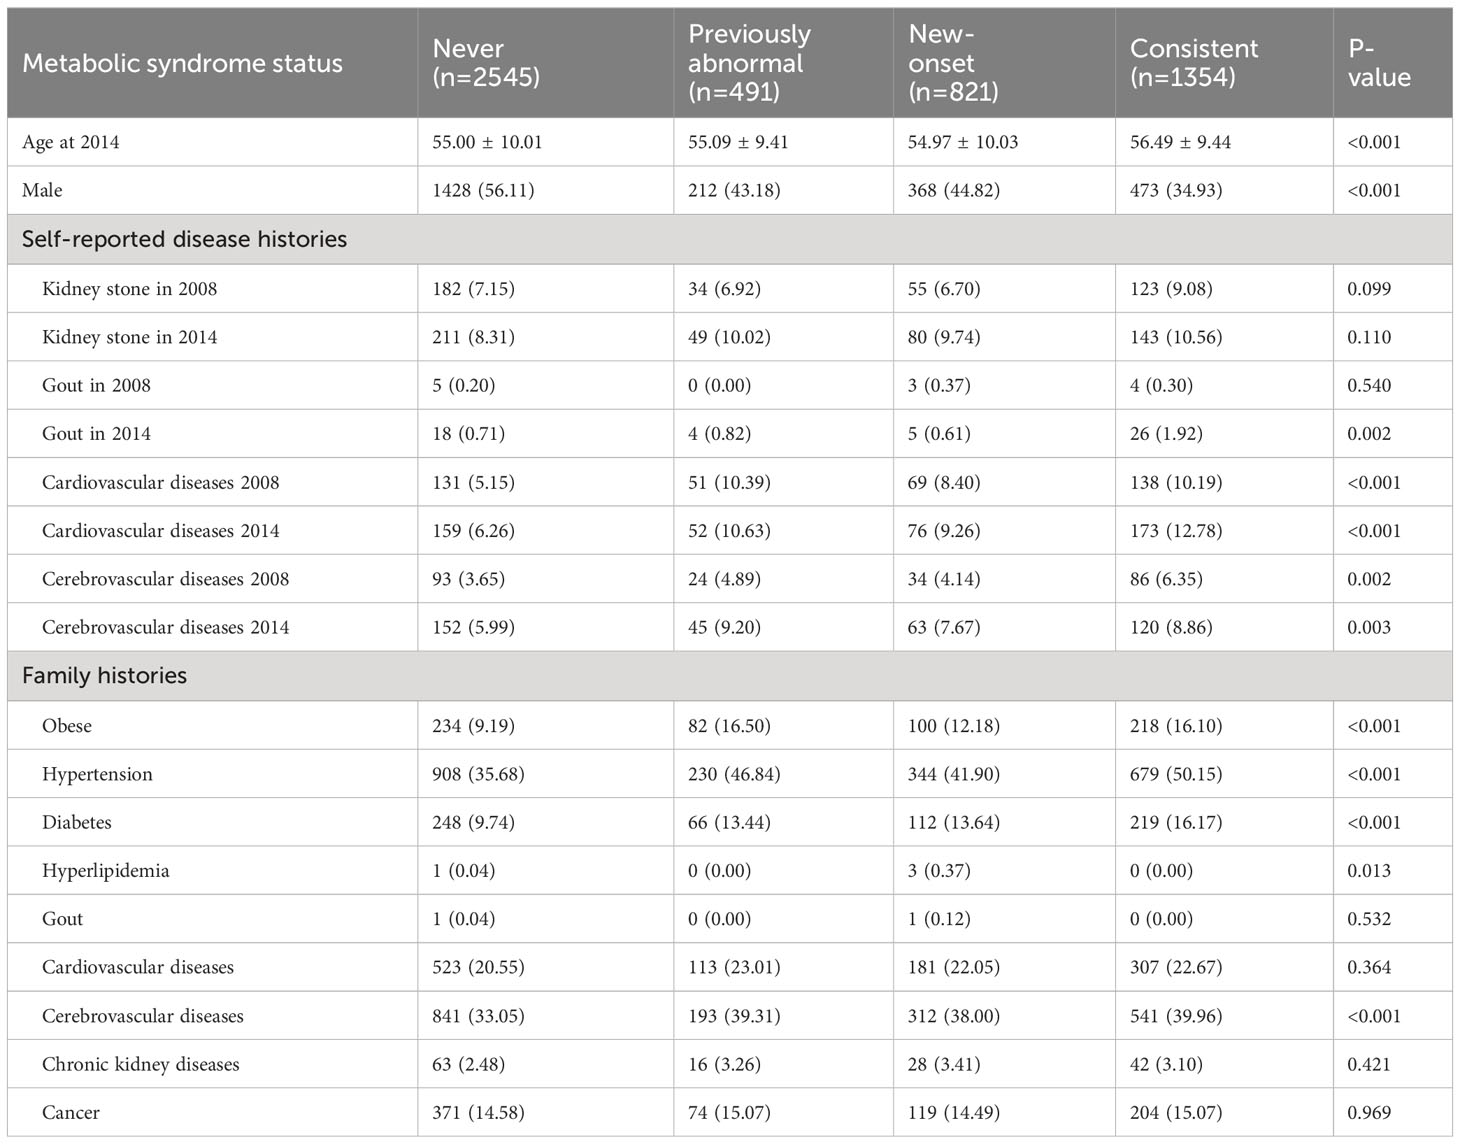
Table 1 Geographic features of the follow-up population in 2014 after the 2008 epidemiology study.
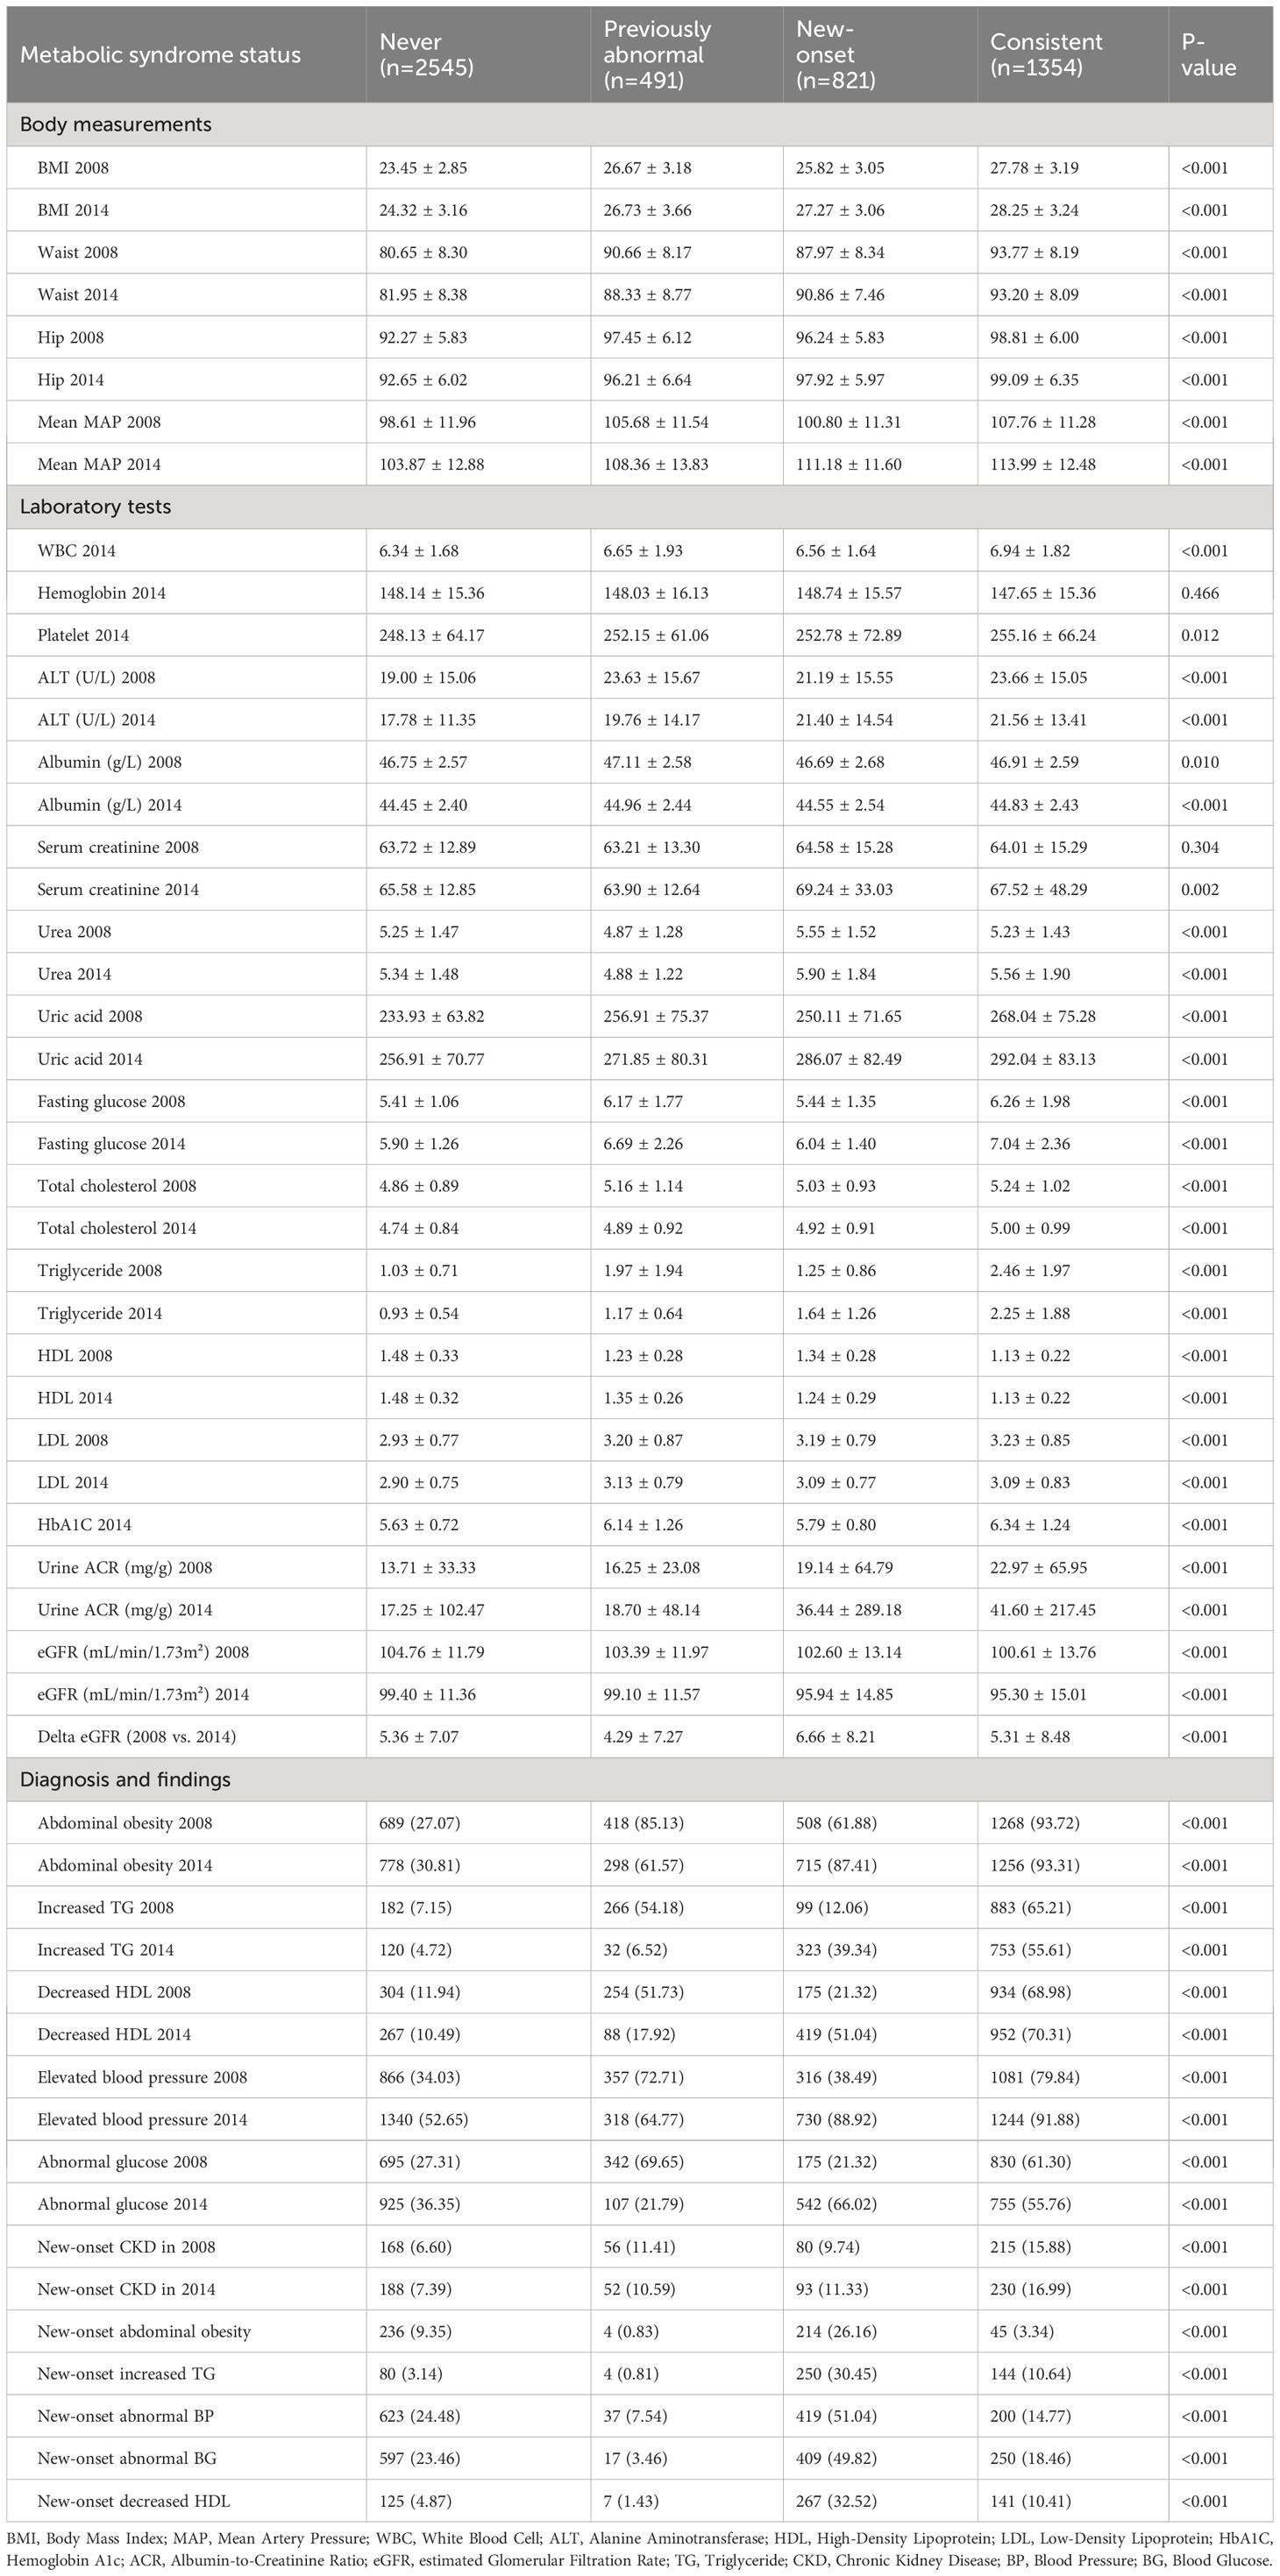
Table 2 Measurements and findings in follow-up population in 2008 and 2014 epidemiology studies.
We performed a univariate analysis of renal function decline (Supplementary Table 1). Compared with the Never group, the New-onset group showed a significant increase of risk in delta eGFR with a beta coefficient of 1.30 (95%CI: 0.70, 1.90), while the beta coefficient of the other two groups was -1.07 (95%CI: -1.81, -0.33) for the Previously abnormal group, and -0.05 (95%CI: -0.55, 0.46) for the Consistent group. Further multivariable regression analysis provided a better understanding of the relationship between metabolic syndrome status and renal function decline, along with its underlying driver (Table 3). The association between New-onset MetS in 2014 and delta eGFR was significant both in the non-adjusted model (β=1.30, 95%CI=0.70-1.90, P<0.001) and the model adjusted for gender and age (Adjust I: β=1.22, 95%CI=0.61-1.82, P<0.001). The model remained significant when additional adjusted covariates such as blood pressure, BMI, Urine ACR, albumin, glucose, TG, etc., were included (Adjust II: β=1.66, 95%CI=1.09-2.23, P<0.001). Still, the strength of the association was significantly reduced after additional adjustment for uric acid levels (Adjust III: β=0.91, 95%CI=0.37-1.45, P=0.001), suggesting that uric acid is a vital mediating factor between new-onset MetS status and decreased renal function. We also stratified by continuous and categorical variables (terciles) (Table 4). Conclusions and variation trends remained consistent in the stratified analysis of each factor.
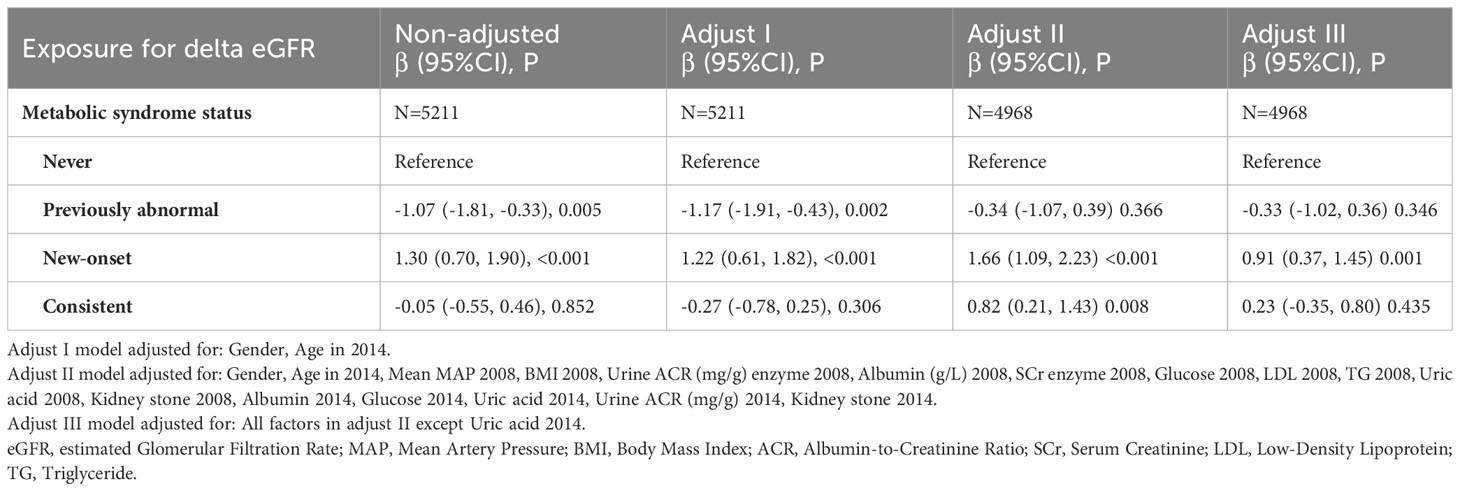
Table 3 Logistic regression for delta eGFR and metabolic syndrome status.
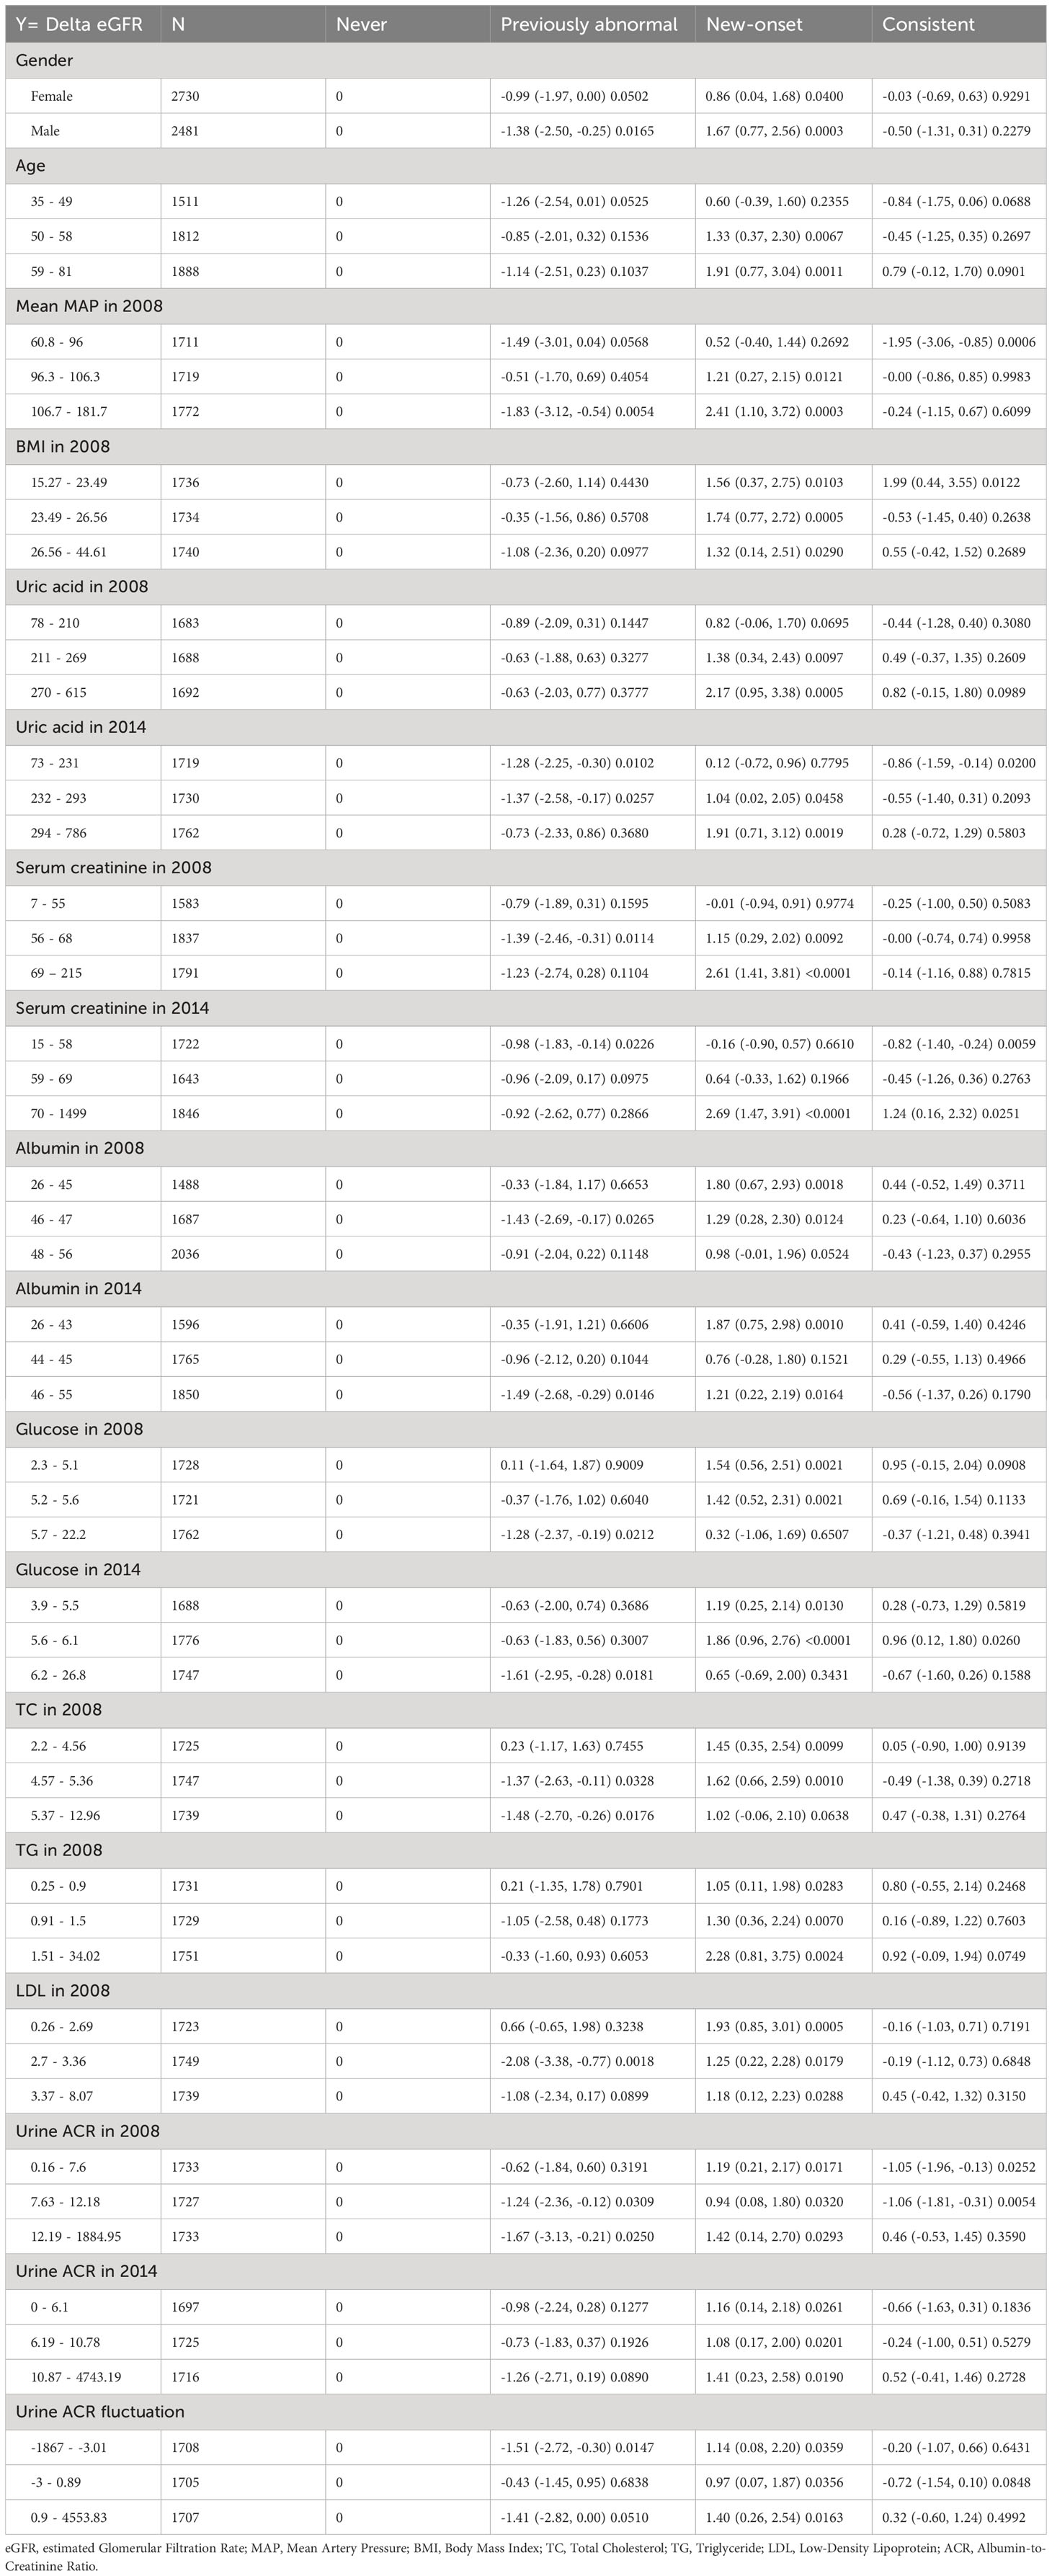
Table 4 Stratification analysis for delta eGFR in different metabolic syndrome status groups.
We then performed weighted generalized additive models and smoothing curve fitting to assess the role of uric acid levels in the decline of renal function under different MetS statuses. Under smooth curve fitting, uric acid levels were approximately positively correlated with renal function decline, but the slopes were slightly different at lower and higher uric acid levels (Supplementary Figure 2). In different MetS status groups, the two-segmented relationship was most evident in the New-onset and Consistent groups. When the uric acid was relatively high, the renal function decline in the New-onset MetS population was most remarkable with the uric acid level increase (Figure 2). To discover the turning points, we conducted the threshold effect analysis (Table 5). The log-likelihood ratio test comparing the one-line (non-segmented) model to the segmented regression model was used to determine whether a threshold existed. Except for the Previously abnormal group, the goodness of fit of the two-segmented model in the other three groups was better than that of the linear model. For the population with New-onset MetS, the turning point of uric acid was 426 μmol/L, indicating that when the level of uric acid exceeded this threshold, it was more significantly associated with the decline of kidney function.
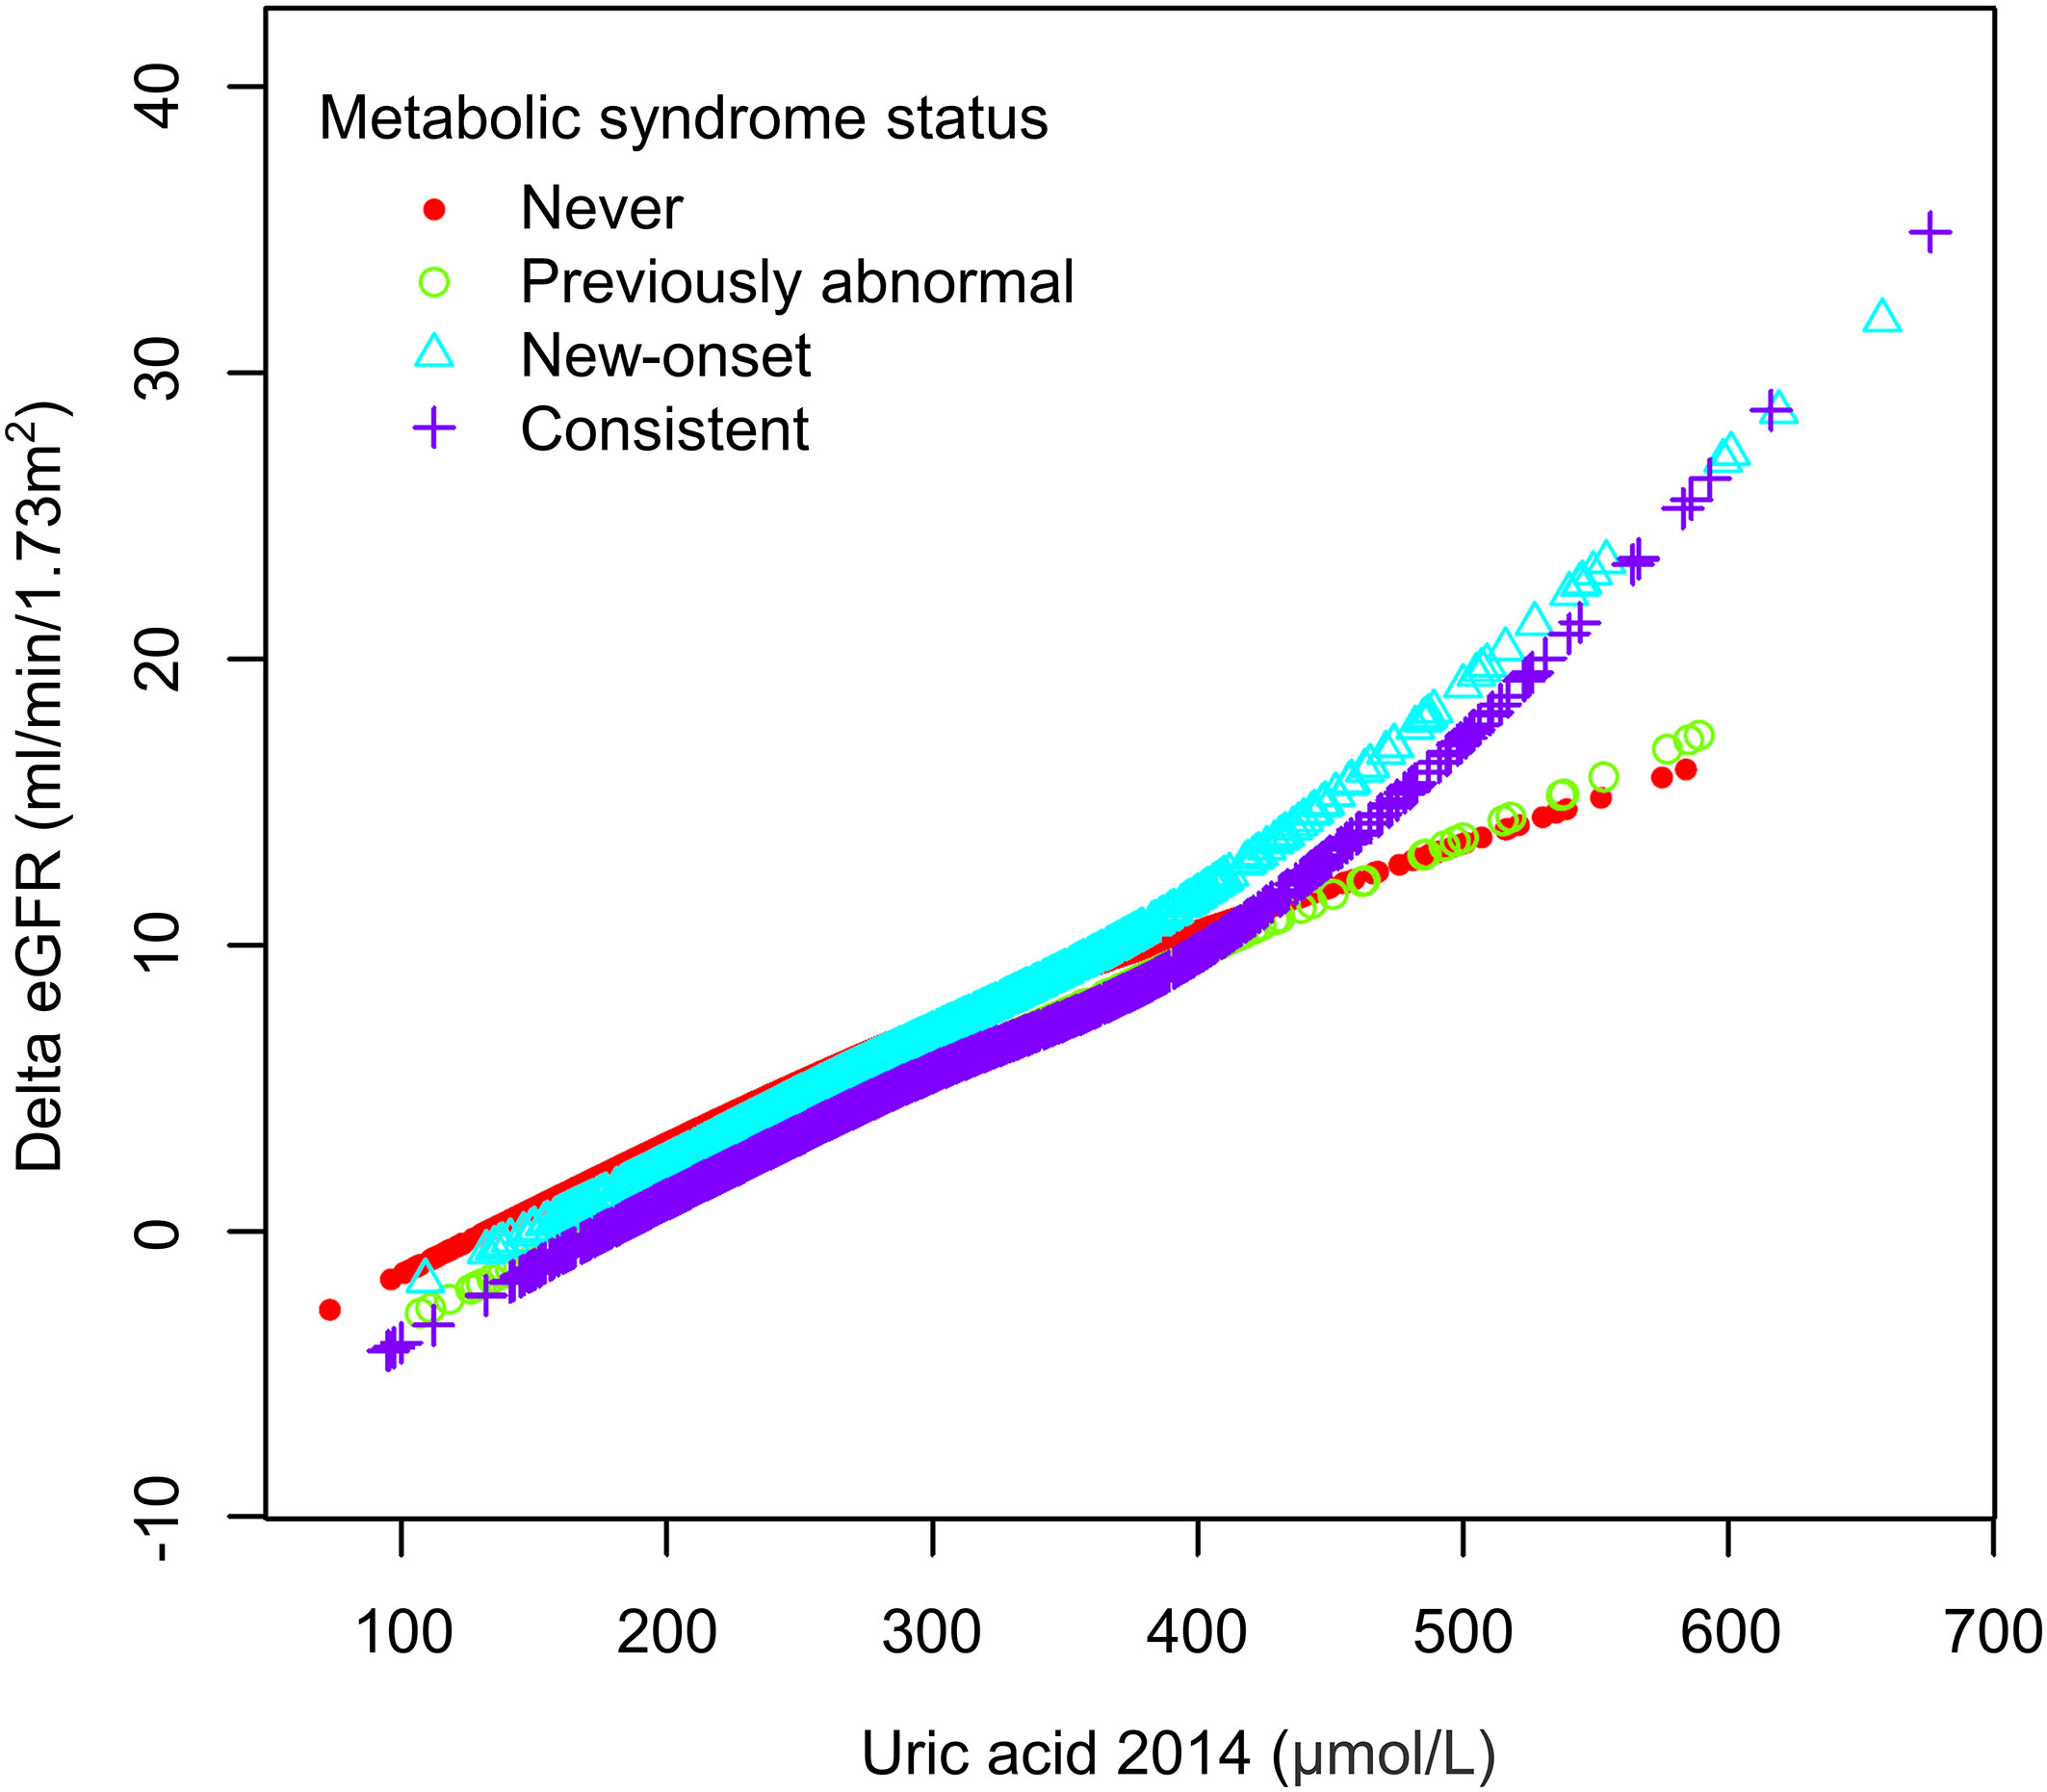
Figure 2 The association between uric acid and delta eGFR in different metabolic syndrome status subgroups.
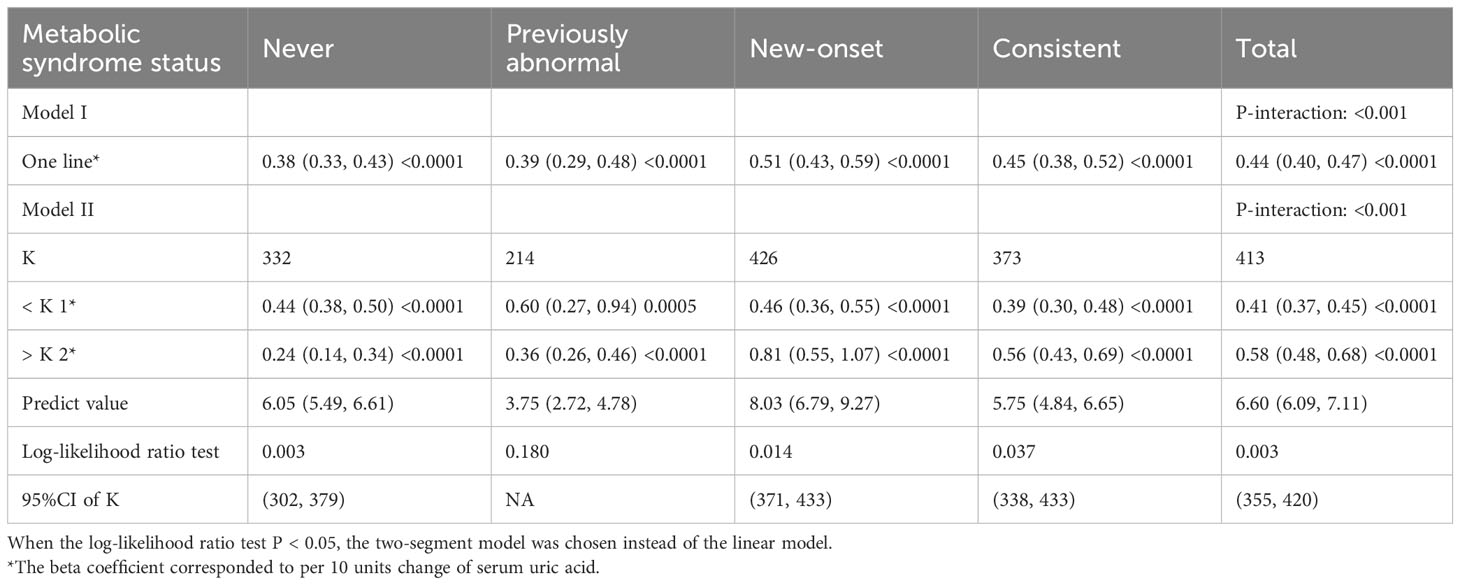
Table 5 Threshold effect analysis of uric acid on delta eGFR.
4 Discussion
In our study, participants with new-onset MetS had a more significant decline in renal function during aging than other populations. In contrast, the eGFR decline during aging returned to the healthy population’s average level when the MetS status was corrected. By further regression analysis, we found a dose-response relation between serum uric acid and risk of eGFR loss in a Chinese rural population, and plasma uric acid level was a strong independent predictor of renal function decline in the new-onset MetS group. Smooth curve fitting and threshold analysis showed that uric acid levels above around 420 μmol/L (7 mg/dL) are associated with more accelerated eGFR decline in people with MetS.
Although the results of previous studies suggest a close association between MetS and renal function decline, it was difficult to draw a causal association and discriminate which components of MetS give rise to renal functional deterioration. Furthermore, because of the lack of evidence from clinical trials specifically involving patients with MetS, it was still unclear whether therapeutic interventions that correct one or more of the syndrome’s many features may effectively prevent harming the target organ (30). Moreover, multiple cross-sectional or cohort studies focusing on the changes in metabolic syndrome status and their impact on renal function are notably scarce. In a Korean population study, researchers evaluated the 10-year risk of CKD by examining changes in MetS status over a two-year period (31). However, limitations include categorizing participants as never, intermittent, or persistent MetS without distinguishing MetS resolution from new-onset cases in the intermittent group. Another study indicated a reduced CKD risk in those recovering from MetS, yet it defined outcome events as CKD occurrence, offering baseline creatinine levels but lacking eGFR changes (32). Therefore, from a renal protection perspective, the most common preventive strategy was identifying those at higher risk of developing CKD in this population and close monitoring to ensure the early recognition and treatment of subsequent renal abnormalities and their related complications. Our study helped identify people at a higher risk of developing CKD. In addition to the current five constituent criteria of MetS, hyperuricemia was also an essential factor associated with decreased renal function.
The biological plausibility of uric acid as a factor that can cause renal damage was supported by several in vitro and in vivo studies. Experimental studies showed that uric acid was a potent activator of the renin–angiotensin–aldosterone system, contributing to hypertension development (33). As for the cellular effect, most studies suggested that uric acid’s primary metabolic and renal effects were mediated by intracellular urate (34, 35), which was distinctly different from the processes involved in gout (36). Previous studies on the direct renal injury of uric acid mainly focused on renal tubular interstitial damage and nephrolithiasis (37). In our population, severe hyperuricemia was not very common; the number of people with gout or kidney stones was also minimal. At least from the study participants, we had a high probability of excluding the influence of their direct damage to the kidney through gout or uric acid crystals. However, the role of uric acid in the metabolic syndrome population still needs a better definition. It remains unclear whether uric acid is simply a marker, a bystander, or a key pathological element of metabolic dysregulation (38). As suggested by an Italian study, in the context of greater global risk, as is the case when renal function is even slightly reduced, serum uric acid becomes a significant correlate of cardiovascular and all-cause mortality only at serum concentration more significant than what is observed in subjects with normal renal function (39). Therefore, hyperuricemia, particularly important in the MetS population, deserves our attention.
Our study showed for the first time that the serum uric acid value had a threshold effect in people with MetS, and the turning point of the accelerated decline of renal function was consistent with the current suggested diagnostic criteria of hyperuricemia (34). The threshold was initially based on the pathogenesis of gouty arthritis, using the level beyond 6.8–7.0 mg/dL at which extracellular uric acid supersaturates to define hyperuricemia (40). Subsequent epidemiological studies employed close but slightly different cut-off values to describe the gender-specific risk of gout development, defined as above 7.7 mg/dl in men and above 6.6 mg/dl in women (41) or above 7.0 mg/dl in men and above 5.7 (42) or 6 mg/dl in women (43). Although the definition of hyperuricemia varied, meta-analysis and systematic review found that uric acid was a significant independent risk factor for the development of CKD (44). As yet, whether to treat hyperuricemia uncomplicated by articular gout, urolithiasis, or uric acid nephropathy lacks universal agreement (45). Though available epidemiological data supported the view that hyperuricemia harmed kidney function, the benefits of treatment for hyperuricemia without gout or nephrolithiasis remained controversial (46). The results’ inconsistency was partially attributed to inadequate sample size, short follow-up times, and heterogeneity in study design characterizing the randomized controlled trials.
The prevalence of metabolism-related diseases in our studied population surpasses that in the broader Chinese population (47). Several factors may contribute to this observation. Firstly, our study’s inclusion criteria targeted individuals aged 30 and above, with an average age of around 55. As the incidence of metabolism-related diseases tends to escalate with age (1), the higher average age in our sample naturally results in a greater prevalence compared to studies based on the entire age spectrum or those starting from 18 (26). Moreover, our sampled population resides in the peri-urban rural areas surrounding a rapidly developing central city in northern China. Over the past two decades, the region’s accelerated urbanization and improved economic conditions have precipitated lifestyle changes. Nevertheless, many residents lack sufficient health awareness, contributing to the adoption of unhealthy lifestyle habits (48). Considering regional factors and our population’s age distribution, our data generally aligns with previous epidemiological surveys (26, 42).
The present research had potential limitations. Firstly, as with any observational study, associations did not imply causality. However, this study would hopefully guide future interventions targeting uric acid in people with MetS to find the basis of randomized controlled trials. Besides, our study had only two cross-sections and could not continuously observe the relationship between elevated uric acid and worsening renal function. Thus, we planned to conduct a third epidemiological survey of the same scale for this population in the coming years. Thirdly, confounding variables were likely to be present. Detailed medications for treating metabolic syndrome or related conditions were not collected in our study. Besides, hyperuricemia might also reflect an unhealthy lifestyle, such as diet, drinking, and exercise. These risk factors had been confirmed to play a pathogenic role in diabetes, hypertension, and metabolic syndrome, while they were hard to quantify by epidemiological questionnaires accurately. Further studies were required to determine the weight of lifestyle influences on the association between uric acid and renal function progression.
In conclusion, metabolic syndrome demonstrated a solid correlation with the progression of renal function, particularly in those with newly-onset MetS status. In addition to the diagnostic components of MetS, hyperuricemia could be used as a marker to identify the high risk of accelerating eGFR decline early. Furthermore, our study reiterated the significance of urate controlling for specific subgroups beyond gout and kidney stones. We suggested a potential renal benefit for the newly-onset MetS population when maintaining their serum uric acid level below the criteria for asymptomatic hyperuricemia. Clinical trials were warranted to determine whether urate-lowering treatment could halt the renal function decline of this population before it became clinically significant.
Data availability statement
The original contributions presented in the study are included in the article/Supplementary Material. Further inquiries can be directed to the corresponding authors.
Ethics statement
The studies involving humans were approved by Ethics Review Committee of Peking Union Medical College Hospital & Chinese Academy of Medical Sciences. The studies were conducted in accordance with the local legislation and institutional requirements. The participants provided their written informed consent to participate in this study.
Author contributions
QX: Conceptualization, Data curation, Formal analysis, Investigation, Methodology, Software, Visualization, Writing – original draft. XF: Data curation, Investigation, Validation, Writing – review & editing. GC: Conceptualization, Data curation, Formal analysis, Funding acquisition, Investigation, Methodology, Software, Supervision, Validation, Visualization, Writing – original draft. JM: Data curation, Investigation, Validation, Writing – review & editing. WY: Data curation, Investigation, Validation, Writing – review & editing. SA: Data curation, Investigation, Validation, Writing – review & editing. LW: Investigation, Methodology, Supervision, Validation, Writing – review & editing. KZ: Data curation, Funding acquisition, Investigation, Supervision, Validation, Writing – review & editing. YQ: Supervision, Validation, Writing – review & editing. LC: Supervision, Validation, Writing – review & editing. ML: Project administration, Supervision, Writing – review & editing. XL: Funding acquisition, Project administration, Supervision, Validation, Writing – review & editing.
Funding
The author(s) declare financial support was received for the research, authorship, and/or publication of this article. This work was supported by the National Key Technology Research and Development Program [grant numbers 2012BAJ18B03] (XL); Beijing Natural Science Foundation [grant number 7122143] (XL); National High Level Hospital Clinical Research Funding [2022-PUMCH-B-020] & [2022-PUMCH-B-021]; Bethune Charitable Foundation [J202103E006] (GC).
Conflict of interest
The authors declare that the research was conducted in the absence of any commercial or financial relationships that could be construed as a potential conflict of interest.
Publisher’s note
All claims expressed in this article are solely those of the authors and do not necessarily represent those of their affiliated organizations, or those of the publisher, the editors and the reviewers. Any product that may be evaluated in this article, or claim that may be made by its manufacturer, is not guaranteed or endorsed by the publisher.
Supplementary material
The Supplementary Material for this article can be found online at: https://www.frontiersin.org/articles/10.3389/fendo.2024.1328404/full#supplementary-material
References
1. Noubiap JJ, Nansseu JR, Lontchi-Yimagou E, Nkeck JR, Nyaga UF, Ngouo AT, et al. Geographic distribution of metabolic syndrome and its components in the general adult population: A meta-analysis of global data from 28 million individuals. Diabetes Res Clin Pract (2022) 188:109924. doi: 10.1016/j.diabres.2022.109924
2. Gami AS, Witt BJ, Howard DE, Erwin PJ, Gami LA, Somers VK, et al. Metabolic syndrome and risk of incident cardiovascular events and death: a systematic review and meta-analysis of longitudinal studies. J Am Coll Cardiol (2007) 49(4):403–14. doi: 10.1016/j.jacc.2006.09.032
3. Ford ES. Risks for all-cause mortality, cardiovascular disease, and diabetes associated with the metabolic syndrome: a summary of the evidence. Diabetes Care (2005) 28(7):1769–78. doi: 10.2337/diacare.28.7.1769
4. Hamaguchi M, Kojima T, Takeda N, Nakagawa T, Taniguchi H, Fujii K, et al. The metabolic syndrome as a predictor of nonalcoholic fatty liver disease. Ann Intern Med (2005) 143(10):722–8. doi: 10.7326/0003-4819-143-10-200511150-00009
5. Lin W, Liu C, Li T, Lin T, Chen W, Chen C, et al. In addition to insulin resistance and obesity, hyperuricemia is strongly associated with metabolic syndrome using different definitions in Chinese populations: a population-based study (Taichung Community Health Study). Ann Rheum Dis (2008) 67(3):432–3. doi: 10.1136/ard.2007.073601
6. Navaneethan SD, Schold JD, Kirwan JP, Arrigain S, Jolly SE, Poggio ED, et al. Metabolic syndrome, ESRD, and death in CKD. Clin J Am Soc Nephrol (2013) 8(6):945. doi: 10.2215/CJN.09870912
7. Alizadeh S, Ahmadi M, Ghorbani Nejad B, Djazayeri A, Shab-Bidar S. Metabolic syndrome and its components are associated with increased chronic kidney disease risk: Evidence from a meta-analysis on 11 109 003 participants from 66 studies. Int J Clin Pract (2018) 72(8):e13201. doi: 10.1111/ijcp.13201
8. Thomas G, Sehgal AR, Kashyap SR, Srinivas TR, Kirwan JP, Navaneethan SD. Metabolic syndrome and kidney disease: a systematic review and meta-analysis. Clin J Am Soc Nephrol (2011) 6(10):2364. doi: 10.2215/CJN.02180311
9. Chen J, Muntner P, Hamm LL, Jones DW, Batuman V, Fonseca V, et al. The metabolic syndrome and chronic kidney disease in US adults. Ann Intern Med (2004) 140(3):167–74. doi: 10.7326/0003-4819-140-3-200402030-00007
10. Kurella M, Lo JC, Chertow GM. Metabolic syndrome and the risk for chronic kidney disease among nondiabetic adults. J Am Soc Nephrol (2005) 16(7):2134–40. doi: 10.1681/ASN.2005010106
11. Bonnet F, Marre M, Halimi J-M, Stengel B, Lange C, Laville M, et al. Waist circumference and the metabolic syndrome predict the development of elevated albuminuria in non-diabetic subjects: the DESIR Study. J Hypertens (2006) 24(6):1157–63. doi: 10.1097/01.hjh.0000226206.03560.ac
12. Kitiyakara C, Yamwong S, Cheepudomwit S, Domrongkitchaiporn S, Unkurapinun N, Pakpeankitvatana V, et al. The metabolic syndrome and chronic kidney disease in a Southeast Asian cohort. Kidney Int (2007) 71(7):693–700. doi: 10.1038/sj.ki.5002128
13. Tozawa M, Iseki C, Tokashiki K, Chinen S, Kohagura K, Kinjo K, et al. Metabolic syndrome and risk of developing chronic kidney disease in Japanese adults. Hypertens Res (2007) 30(10):937–43. doi: 10.1291/hypres.30.937
14. Yang C, Gao B, Zhao X, Su Z, Sun X, Wang H-Y, et al. Executive summary for China kidney disease network (CK-NET) 2016 annual data report. Kidney Int (2020) 98(6):1419–23. doi: 10.1016/j.kint.2020.09.003
15. Yuan H, Yu C, Li X, Sun L, Zhu X, Zhao C, et al. Serum uric acid levels and risk of metabolic syndrome: a dose-response meta-analysis of prospective studies. J Clin Endocrinol Metab (2015) 100(11):4198–207. doi: 10.1210/jc.2015-2527
16. Bellomo G, Venanzi S, Verdura C, Saronio P, Esposito A, Timio M. Association of uric acid with change in kidney function in healthy normotensive individuals. Am J Kidney Dis (2010) 56(2):264–72. doi: 10.1053/j.ajkd.2010.01.019
17. Ben-Dov IZ, Kark JD. Serum uric acid is a GFR-independent long-term predictor of acute and chronic renal insufficiency: the Jerusalem Lipid Research Clinic cohort study. Nephrol Dial Transplant (2011) 26(8):2558–66. doi: 10.1093/ndt/gfq740
18. Chonchol M, Shlipak MG, Katz R, Sarnak MJ, Newman AB, Siscovick DS, et al. Relationship of uric acid with progression of kidney disease. Am J Kidney Dis (2007) 50(2):239–47. doi: 10.1053/j.ajkd.2007.05.013
19. Bose B, Badve SV, Hiremath SS, Boudville N, Brown FG, Cass A, et al. Effects of uric acid-lowering therapy on renal outcomes: a systematic review and meta-analysis. Nephrol Dial Transplant (2014) 29(2):406–13. doi: 10.1093/ndt/gft378
20. Kanji T, Gandhi M, Clase CM, Yang R. Urate lowering therapy to improve renal outcomes in patients with chronic kidney disease: systematic review and meta-analysis. BMC Nephrol (2015) 16(1):1–9. doi: 10.1186/s12882-015-0047-z
21. Fan X, Kalim S, Ye W, Zhao S, Ma J, Nigwekar SU, et al. Urinary stone disease and cardiovascular disease risk in a rural Chinese population. Kidney Int Rep (2017) 2(6):1042–9. doi: 10.1016/j.ekir.2017.06.001
22. Cai J, Fan X, Mou L, Gao B, Liu X, Li J, et al. Association of reduced renal function with hepatitis B virus infection and elevated alanine aminotransferase. Clin J Am Soc Nephrol (2012) 7(10):1561–6. doi: 10.2215/CJN.07410711
23. Expert Panel on Detection E. Executive summary of the third report of the National Cholesterol Education Program (NCEP) expert panel on detection, evaluation, and treatment of high blood cholesterol in adults (Adult Treatment Panel III). JAMA (2001) 285(19):2486–97. doi: 10.1001/jama.285.19.2486
24. Grundy SM, Cleeman JI, Daniels SR, Donato KA, Eckel RH, Franklin BA, et al. Diagnosis and management of the metabolic syndrome: an American Heart Association/National Heart, Lung, and Blood Institute Scientific Statement. Circulation (2005) 112(17):2735–52. doi: 10.1161/circulationaha.105.169404
25. Ranasinghe P, Mathangasinghe Y, Jayawardena R, Hills AP, Misra A. Prevalence and trends of metabolic syndrome among adults in the asia-pacific region: a systematic review. BMC Public Health (2017) 17(1):101. doi: 10.1186/s12889-017-4041-1
26. Lu J, Wang L, Li M, Xu Y, Jiang Y, Wang W, et al. Metabolic syndrome among adults in China: the 2010 China noncommunicable disease surveillance. J Clin Endocrinol Metab (2017) 102(2):507–15. doi: 10.1210/jc.2016-2477
28. Levey AS, Stevens LA, Schmid CH, Zhang Y, Castro AF III, Feldman HI, et al. A new equation to estimate glomerular filtration rate. Ann Intern Med (2009) 150(9):604–12. doi: 10.7326/0003-4819-150-9-200905050-00006
29. Levin A, Stevens PE, Bilous RW, Coresh J, De Francisco AL, De Jong PE, et al. KDIGO 2012 clinical practice guideline for the evaluation and management of chronic kidney disease. Kidney Int Suppl (2013) 3(1):1–150. doi: 10.1038/kisup.2012.73
30. Locatelli F, Pozzoni P, Del Vecchio L. Renal manifestations in the metabolic syndrome. J Am Soc Nephrol (2006) 17(4_suppl_2):S81–S5. doi: 10.1681/ASN.2005121332
31. Lee SJ, Lee HJ, Oh HJ, Go T, Kang DR, Kim JY, et al. Metabolic syndrome status over 2 years predicts incident chronic kidney disease in mid-life adults: a 10-year prospective cohort study. Sci Rep (2018) 8(1):12237. doi: 10.1038/s41598-018-29958-7
32. Park S, Lee S, Kim Y, Lee Y, Kang MW, Han K, et al. Reduced risk for chronic kidney disease after recovery from metabolic syndrome: a nationwide population-based study. Kidney Res Clin Pract (2020) 39(2):180. doi: 10.23876/j.krcp.20.016
33. Mazzali M, Hughes J, Kim Y-G, Jefferson JA, Kang D-H, Gordon KL, et al. Elevated uric acid increases blood pressure in the rat by a novel crystal-independent mechanism. Hypertension (2001) 38(5):1101–6. doi: 10.1161/hy1101.092839
34. Johnson RJ, Nakagawa T, Sanchez-Lozada LG, Shafiu M, Sundaram S, Le M, et al. Sugar, uric acid, and the etiology of diabetes and obesity. Diabetes (2013) 62(10):3307–15. doi: 10.2337/db12-1814
35. Sánchez-Lozada LG, Lanaspa MA, Cristóbal-García M, García-Arroyo F, Soto V, Cruz-Robles D, et al. Uric acid-induced endothelial dysfunction is associated with mitochondrial alterations and decreased intracellular ATP concentrations. Nephron Exp Nephrol (2013) 121(3-4):e71–e8. doi: 10.1159/000345509
36. Martinon F, Pétrilli V, Mayor A, Tardivel A, Tschopp J. Gout-associated uric acid crystals activate the NALP3 inflammasome. Nature (2006) 440(7081):237–41. doi: 10.1038/nature04516
37. Bardin T, Nguyen QD, Tran KM, Le NH, Do MD, Richette P, et al. A cross-sectional study of 502 patients found a diffuse hyperechoic kidney medulla pattern in patients with severe gout. Kidney Int (2021) 99(1):218–26. doi: 10.1016/j.kint.2020.08.024
38. Copur S, Demiray A, Kanbay M. Uric acid in metabolic syndrome: Does uric acid have a definitive role? Eur J Intern Med (2022) 103:4–12. doi: 10.1016/j.ejim.2022.04.022
39. Maloberti A, Mengozzi A, Russo E, Cicero AFG, Angeli F, Agabiti Rosei E, et al. The results of the URRAH (Uric acid right for heart health) project: A focus on hyperuricemia in relation to cardiovascular and kidney disease and its role in metabolic dysregulation. High Blood Press Cardiovasc Prev (2023) 30(5):411–25. doi: 10.1007/s40292-023-00602-4
40. Choi HK, Mount DB, Reginato AM. Pathogenesis of gout. Ann Intern Med (2005) 143(7):499–516. doi: 10.7326/0003-4819-143-7-200510040-00009
41. Chen J-H, Yeh W-T, Chuang S-Y, Wu Y-Y, Pan W-H. Gender-specific risk factors for incident gout: a prospective cohort study. Clin Rheumatol (2012) 31:239–45. doi: 10.1007/s10067-011-1802-6
42. Zhu Y, Pandya BJ, Choi HK. Prevalence of gout and hyperuricemia in the US general population: the National Health and Nutrition Examination Survey 2007–2008. Arthritis Rheumatol (2011) 63(10):3136–41. doi: 10.1002/art.30520
43. Lin K-C, Lin H-Y, Chou P. Community based epidemiological study on hyperuricemia and gout in Kin-Hu, Kinmen. J Rheumatol (2000) 27(4):1045–50.
44. Li L, Yang C, Zhao Y, Zeng X, Liu F, Fu P. Is hyperuricemia an independent risk factor for new-onset chronic kidney disease?: a systematic review and meta-analysis based on observational cohort studies. BMC Nephrol (2014) 15:1–12. doi: 10.1186/1471-2369-15-122
45. Paul BJ, Anoopkumar K, Krishnan V. Asymptomatic hyperuricemia: is it time to intervene? Clin Rheumatol (2017) 36:2637–44. doi: 10.1007/s10067-017-3851-y
46. Li X, Meng X, Timofeeva M, Tzoulaki I, Tsilidis KK, Ioannidis JP, et al. Serum uric acid levels and multiple health outcomes: umbrella review of evidence from observational studies, randomised controlled trials, and Mendelian randomisation studies. BMJ (2017) 357:j2376. doi: 10.1136/bmj.j2376
47. Li R, Li W, Lun Z, Zhang H, Sun Z, Kanu JS, et al. Prevalence of metabolic syndrome in Mainland China: a meta-analysis of published studies. BMC Public Health (2016) 16:296. doi: 10.1186/s12889-016-2870-y
Keywords: metabolic syndrome, chronic kidney disease, hyperuricemia, hypertension, diabetes mellitus, obesity
Citation: Xu Q, Fan X, Chen G, Ma J, Ye W, Ai S, Wang L, Zheng K, Qin Y, Chen L, Li M and Li X (2024) New-onset metabolic syndrome is associated with accelerated renal function decline partially through elevated uric acid: an epidemiological cohort study. Front. Endocrinol. 15:1328404. doi: 10.3389/fendo.2024.1328404
Received: 26 October 2023; Accepted: 16 January 2024;
Published: 02 February 2024.
Edited by:
Claudio Borghi, University of Bologna, ItalyCopyright © 2024 Xu, Fan, Chen, Ma, Ye, Ai, Wang, Zheng, Qin, Chen, Li and Li. This is an open-access article distributed under the terms of the Creative Commons Attribution License (CC BY). The use, distribution or reproduction in other forums is permitted, provided the original author(s) and the copyright owner(s) are credited and that the original publication in this journal is cited, in accordance with accepted academic practice. No use, distribution or reproduction is permitted which does not comply with these terms.
*Correspondence: Gang Chen, ChenGang@pumch.cn; Xuemei Li, lixmpumch@126.com
†These authors have contributed equally to this work