 Meiting Liang1,2
 Jingkun Liu3
 Wujin Chen4
 Yi He1,2Mayina Kahaer1Rui Li5Tingting Tian1Yezhou Liu1Bing Bai1Yuena Cui1Shanshan Yang6Wenjuan Xiong6Yan Ma7Bei Zhang1Yuping Sun1,8*
- 1Departent of Microbiology, School of Basic Medical Sciences, Xinjiang Medical University, Urumqi, China
- 2Department of Pathology, School of Basic Medical Sciences, XinJiang Second Medical College, Karamay, China
- 3Department of Oncology, The First Affiliated Hospital of XinJiang Medical University, Urumqi, China
- 4Department of Morphological Center, School of Basic Medical Sciences, Xinjiang Medical University, Urumqi, China
- 5Department of Human Parasitology, School of Basic Medical Sciences, Xinjiang Medical University, Urumqi, China
- 6Department of Clinical Laboratory, Xinjiang Medical University Affiliated Fifth People’s Hospital, Urumqi, China
- 7Department of Clinical Laboratory, Xinjiang Medical University Affiliated Second People’s Hospital, Urumqi, China
- 8Key Laboratory of Xinjiang Uygur Autonomous Region, Laboratory of Molecular Biology of Endemic Diseases, Urumqi, China
Background: We aimed to assess the differences in the gut microbiome among participants with different uric acid levels (hyperuricemia [HUA] patients, low serum uric acid [LSU] patients, and controls with normal levels) and to develop a model to predict HUA based on microbial biomarkers.
Methods: We sequenced the V3-V4 variable region of the 16S rDNA gene in 168 fecal samples from HUA patients (n=50), LSU patients (n=61), and controls (n=57). We then analyzed the differences in the gut microbiome between these groups. To identify gut microbial biomarkers, the 107 HUA patients and controls were randomly divided (2:1) into development and validation groups and 10-fold cross-validation of a random forest model was performed. We then established three diagnostic models: a clinical model, microbial biomarker model, and combined model.
Results: The gut microbial α diversity, in terms of the Shannon and Simpson indices, was decreased in LSU and HUA patients compared to controls, but only the decreases in the HUA group were significant (P=0.0029 and P=0.013, respectively). The phylum Proteobacteria (P<0.001) and genus Bacteroides (P=0.02) were significantly increased in HUA patients compared to controls, while the genus Ruminococcaceae_Ruminococcus was decreased (P=0.02). Twelve microbial biomarkers were identified. The area under the curve (AUC) for these biomarkers in the development group was 84.9% (P<0.001). Notably, an AUC of 89.1% (P<0.001) was achieved by combining the microbial biomarkers and clinical factors.
Conclusions: The combined model is a reliable tool for predicting HUA and could be used to assist in the clinical evaluation of patients and prevention of HUA.
Introduction
Uric acid is the end product of purine metabolism. The body excretes uric acid in two main ways: approximately 70% is excreted in urine via the kidneys and approximately 30% is transported by intestinal epithelial cells to the lumen for direct excretion or decomposition by gut microbes (1). Generally, uric acid metabolism is in a dynamic balance, but with changes in lifestyle, along with the influence of genetic factors, serum uric acid levels can become too high or too low.
Hyperuricemia (HUA) is diagnosed if the fasting blood uric acid level is >7 mg/dL in men and >6 mg/dL in women (2). Research has confirmed that HUA can cause kidney, cardiovascular, liver, and soft tissue damage (3). The main mechanism involves activating the oxidative stress response and promoting the release of inflammatory factors (4). Accordingly, the incidences of dyslipidemia, type 2 diabetes, and cardiovascular disease are higher in HUA patients than in healthy subjects (5–8). HUA is also a prerequisite for gout; continuously elevated serum uric acid can cause sodium urate crystal precipitation due to oversaturated urate, leading to gout. The cumulative incidence of gout increases with serum uric acid levels (9, 10).
Furthermore, low serum uric acid (LSU) is often overlooked. Some studies have shown that LSU (male <3.5 mg/dl and female <2.5 mg/dl) is associated with all-cause mortality and gender-specific cardiovascular mortality (11), but the overall relationship between cardiovascular disease risk and mortality are not clear. The harm of LSU may be related to the antioxidant properties of uric acid (11, 12).
The gut microbiota is a huge microbial population that colonizes the intestine and is symbiotic with the host. It plays an important role in functional metabolism and immune regulation. Many studies have found that it is related to uric acid metabolism disorders. Shao et al. (13) found that the diversity of the intestinal microbiota decreased in patients with gout, with increases in the opportunistic pathogens Bacteroides spp., Porphyromonadaceae, Rhodococcus, Erysipelatoclostridium spp., and Anaerolineaceae and decreases in Lachnospiraceae and Ruminococcaceae. In contrast, other gut microbes are capable of reducing intestinal uric acid production and/or increasing uric acid excretion. For example, Lactobacillus gasseri PA3 reduces exogenous purine absorption, including inosine 5-phosphate (IMP), inosine, hypoxanthine, guanosine 5-phosphate (GMP), and guanine nucleoside (14). Furthermore, Lactobacillus DM9218 isolated from pickles can degrade inosine and guanosine (two critical intermediates in purine metabolism), reduce the production of uric acid precursors, and effectively reduce serum uric acid levels (15). In summary, in the intestinal tract, which is an important site for uric acid excretion, the microbiome plays an indispensable role. It may be feasible to use the gut microbiome as a predictor of uric acid metabolic disorders.
The utility of using traditional clinical factors for predicting HUA, to better evaluate HUA occurrence and development, is limited. In current clinical practice, the serum uric acid level is still used to diagnose HUA, but the occurrence and development of HUA cannot be easily pre-empted. Therefore, it is important to establish a new diagnostic model involving both traditional clinical factors and gut microbial biomarkers. Controlling daily purine intake is an effective means to prevent HUA, but this is often disregarded at present; if cases of HUA could be effectively predicted, controlling daily purine intake may be a highly useful intervention.
To establish a new diagnostic model, we aimed to analyze the gut microbiota in participants with different uric acid levels by high-throughput sequencing. Using gut microbial biomarkers and clinical factors, we developed a novel diagnostic model for HUA and used decision curve analysis (DCA) to assess its clinical value.
Methods
Study participants
The study participants were aged 20–60 years old and were recruited from Balikun County Hospital, Xinjiang Province of China, from October 2019 to August 2021. All participants underwent physical examination in Balikun County Hospital. Height, weight, body mass index (BMI), blood pressure (BP), genetic and disease history, and drug use history were recorded.
The study cohort was divided into the following three groups according to mean serum uric acid levels (measured on 2 days): LSU group (males: <3.5 mg/dL; females: <2.5 mg/dL; n=61) (11), control group (n=57), and HUA group (males: >7 mg/dL; females: >6 mg/dL; n=50) (2).The exclusion criteria were gastrointestinal diseases, tumors, hematological diseases, severe liver or kidney dysfunction, and the use of antibiotics or microecological regulators that affect the gut microbiota within 1 month of the study.
The study was approved by the Ethics Committee of the First Affiliated Hospital of Xinjiang Medical University (Xinjiang, China). The sampling and other methods were carried out according to the approved guidelines. Each participant was informed about the study before study commencement, and they signed an informed consent form.
Fecal sample collection, DNA extraction, and sequencing
We provided each participant with a sterile container for stool sample collection and training on sample collection. After stool sample collection, 0.2 g fresh fecal sample from each participant was quickly placed into five sterile centrifuge tubes and rapidly transported to the laboratory for freezing at -80°C. The bacterial DNA was extracted from the samples using the bead-beating method. The quality of DNA was assessed using 0.8% agarose gel electrophoresis (16). The DNA was used as the template to amplify the V3-V4 region of the bacterial 16S rDNA gene. The DNA extraction and Illumina NovaSeq sequencing were performed by Shanghai Pisenno Biotechnology Co., Ltd. (Shanghai, China; http://www.personalbio.cn).
Gut microbiome analyses
Operational taxonomic unit (OTU) clustering analysis was performed on all sequences. The Ribosomal Database Project (RDP) Bayesian classifier was used to classify the representative OTU sequences at the 97% similarity level. The community composition of each sample was assessed according to various classification levels (phylum, class, order, family, and genus), and the community composition was statistically compared between groups at each classification level. We used the heatmap R package to present clustering results at phylum and genus levels in heatmaps.
α diversity analyses were used to assess the abundance and diversity (Shannon and Simpson indices) of microbial communities in the three uric acid-related groups. Using principal coordinates analysis (PCoA) of UniFrac distances and nonparametric analysis of similarities (ANOSIM), we assessed the similarity between the three uric acid-related groups. Additionally, we used linear discriminant analysis (LDA) effect size (LEfSe) to determine the specific gut microbes related to HUA.
Laboratory assessment
Peripheral venous blood samples of all participants were obtained after 12 h of fasting. Laboratory data, including serum biochemical indexes, liver function indexes, renal function indexes, and lipid results, were examined in the Balikun County Hospital as described previously.
Statistical analysis
We established three diagnostic models: a clinical model, microbial biomarker model, and combined model. To establish the clinical model, we used univariate logistic regression analyses to identify significant clinical factors for predicting HUA followed by a receiver operating characteristic (ROC) curve analysis of each factor to select the most valuable factors for predicting HUA, based on the area under the ROC curve (AUC) values. Next, using the significant variables with AUC value >0.5, we used least absolute shrinkage and selection operator (LASSO) regression to determine the independent risk factors for HUA. The available clinical factors included blood pressure, blood urea nitrogen (BUN), creatinine, blood glucose, alanine aminotransferase, aspartate aminotransferase, triglyceride (TG), total cholesterol (TC), high-density lipoprotein cholesterol (HDL-C), and low-density lipoprotein cholesterol (LDL-C).
To establish the microbial biomarker model, we used 10-fold cross-validation of a random forest model to ensure the reliability of the gut biomarkers. We randomly divided (2:1 ratio) the 107 volunteers in the HUA and control groups into the development and validation groups, and the former was used to construct the microbial biomarker model, while the latter was used to assess model reliability. The probability of disease (POD) index in the HUA and control samples in the development and validation groups was used to determine the diagnostic value of the gut microbial biomarkers. It was defined as the ratio between the number of decision trees that predicted “HUA” and the total number of sampling trees (in the development or validation group, nvotes/ntrees).
All variables from the other two models were included in the combined model. The combined model was visualized by constructing a nomogram using the rms R package. DCA was used to assess the clinical value of the combined model. Additionally, calibration curves comparing the model predictions and actual observations were used for graphical evaluation.
Statistical analysis was performed using SPSS software (version 21.0; IBM Corp., Armonk, NY, USA) and R software (version 4.0.4; R Foundation for Statistical Computing, Vienna, Austria). The normally and non-normally distributed continuous variables are expressed as mean ± standard deviation (mean ± SD) and median, respectively. The categorical variables are presented as percentages. Regarding normally distributed continuous variables, the three uric acid-related groups were compared using a one-way analysis of variance (ANOVA). Differences between the HUA and control groups were determined using t tests for normally distributed continuous variables and Wilcoxon rank-sum test for non-normally distributed continuous variables. Regarding categorical variables, groups were compared using the Chi-square test. P<0.05 was considered statistically significant.
Results
Participant characteristics
The study cohort comprised 168 Chinese adults, and it was divided into the LSU, control, and HUA groups (Figure 1). There were no significant differences in age, gender, or body mass index among the three groups, but there were significant differences in uric acid, BUN, creatinine, blood glucose, alanine aminotransferase, TG, HDL-C, and LDL-C (Table 1). The mean BUN, creatinine, blood glucose, TG, and LDL-C were higher in the HUA group and lower in the LSU group relative to the control group. These results show that the level of uric acid is associated with glucose and lipid metabolism, and HUA patients may be more prone to glucose and lipid metabolism disorders and related diseases. Therefore, predicting HUA occurrence and development should involve these clinical biochemical factors, to ensure a comprehensive evaluation.

Figure 1 Flow chart of the data screening.
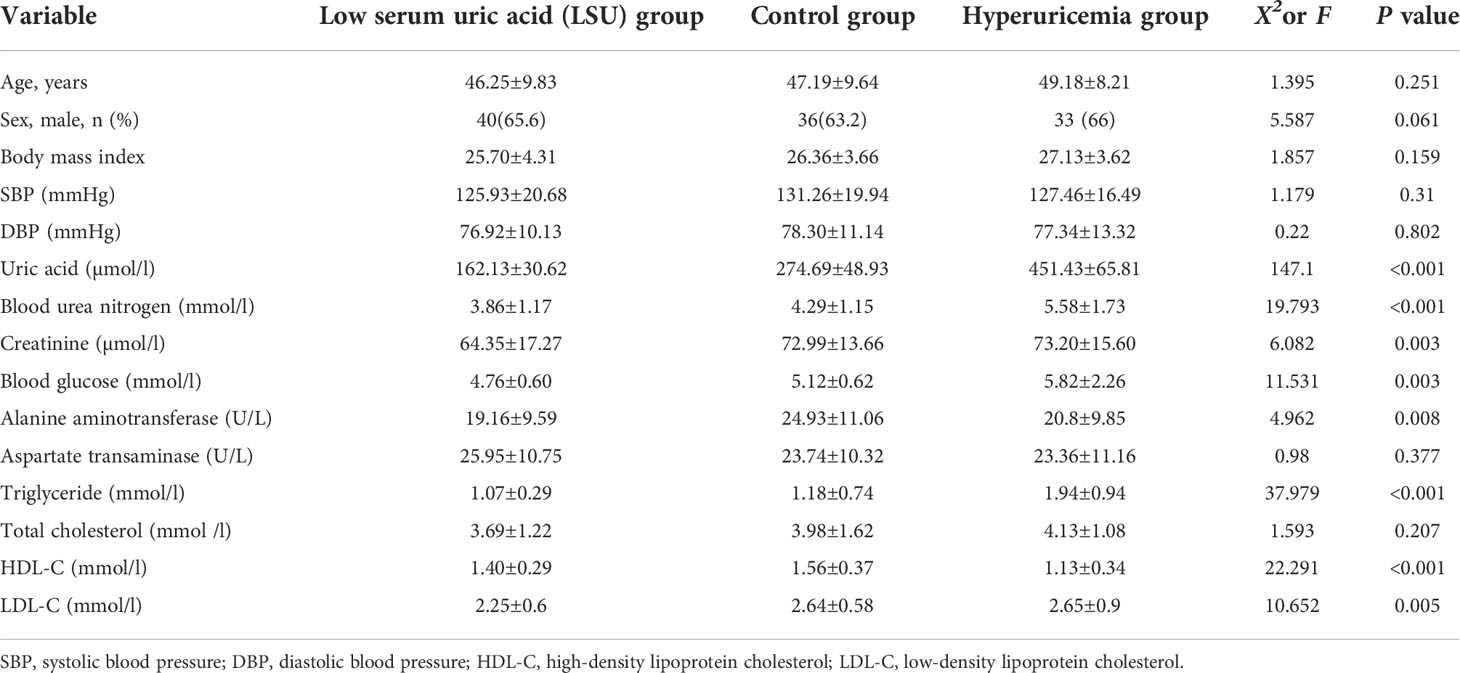
Table 1 Participant characteristics.
Alterations in the gut microbiome by serum uric acid level
The Simpson and Shannon indices (representing gut microbial α diversity) were significantly lower in the LSU and HUA groups than in the control group, but only the decreases in the HUA group were significant (P=0.0029 and P=0.013, respectively, Figure 2A), indicating that alterations in serum uric acid level were related to lower gut microbial α diversity.
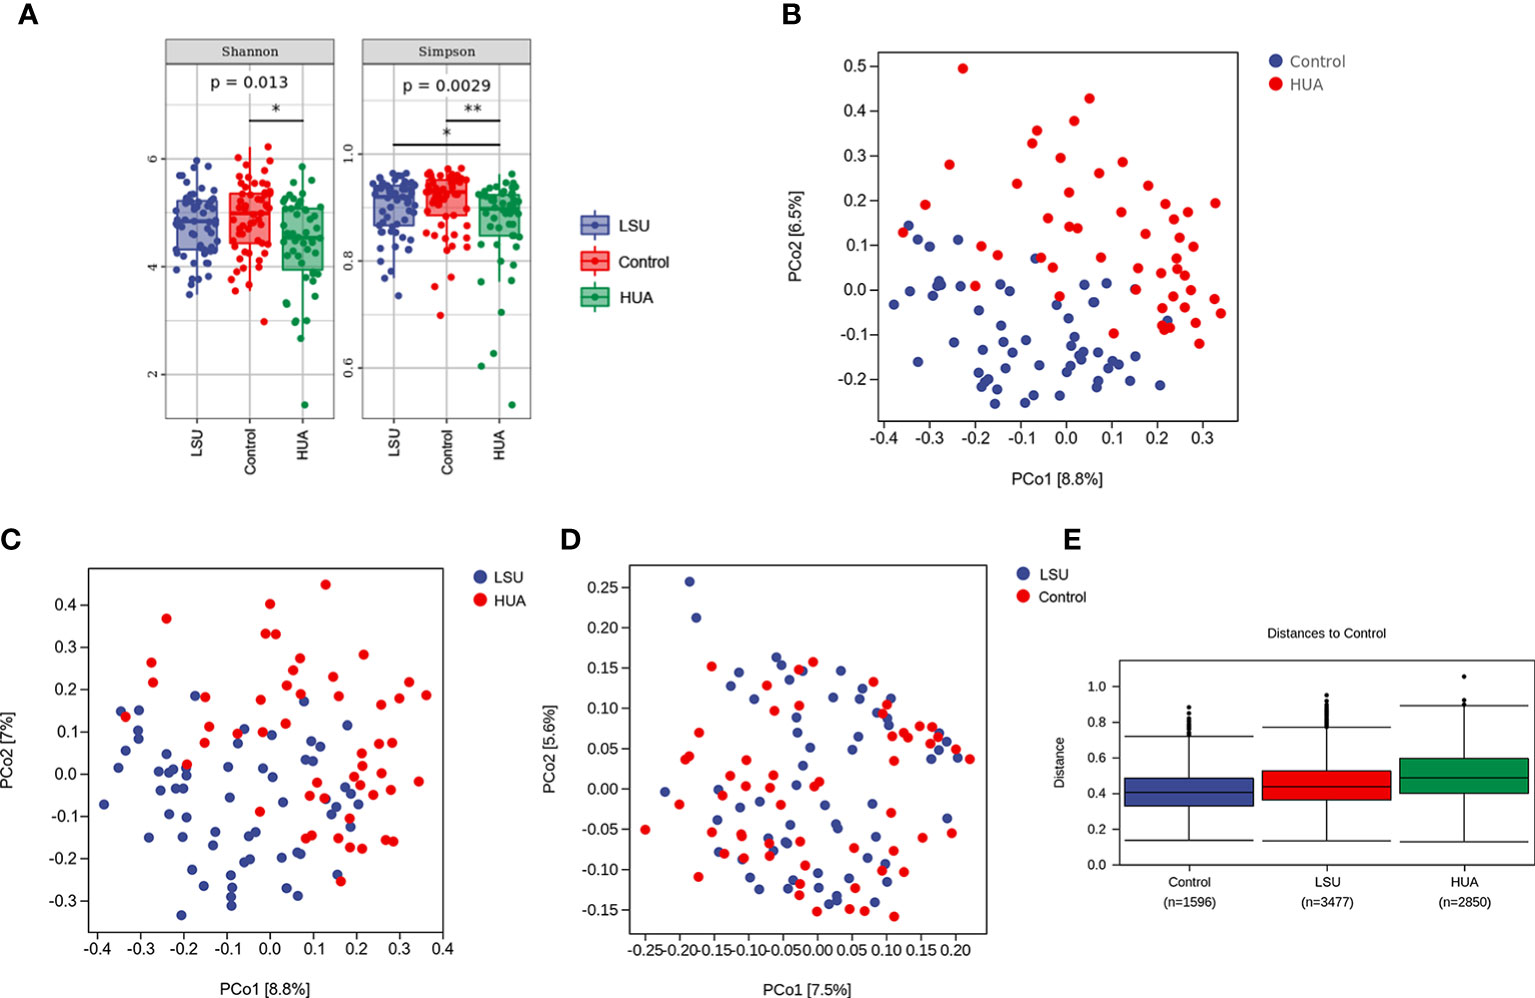
Figure 2 Serum uric acid level was associated with changes in the gut microbiota. (A) α diversity analyses based on Simpson and Shannon indices. Simpson and Shannon indices in the low serum uric acid (LSU) and hyperuricemia (HUA) groups decreased compared to the control group, but only the decreases in the HUA group were significant (P=0.0029 and P=0.013, respectively). (B–D) β diversity was assessed using principal coordinates analysis (PCoA) of unweighted UniFrac distances, which reflected the dispersion degree of the sample point distribution. There were large differences in the composition of the gut microbiota between the HUA and control groups. (E) Nonparametric analysis of similarities (ANOSIM) among the three groups showing that the LSU and HUA groups were far away from the control group. The control group box plot indicates the sample differences within the control group. The other two box plots indicate the distance from the HUA or LSU groups to the control group. The number corresponding to x-axis represents the number of comparisons between samples, and the y-axis represents the distance.
In addition, based on principal coordinates analysis (PCoA) of UniFrac distances, there were significant separations between the HUA group and the other two groups (Figures 2B, C), but there was no significant separation between the LSU and control groups (Figure 2D). These results showed that the gut microbial community structure in the HUA group was significantly altered (Figure 2B). Furthermore, nonparametric analysis of similarities (ANOSIM) also showed that the distribution and composition of gut microbial communities differed with uric acid level (Figure 2E and Table S1).
Gut microbes in HUA
We presented the clustering results at phylum and genus levels in heatmaps. Firmicutes, Actinobacteria, Bacteroidetes, Proteobacteria, and Verrucomicrobia were the dominant phyla in the HUA group (Figure 3A). Proteobacteria was significantly increased in the HUA group compared to the control group (P<0.001, Figure 3B). At the genus level (Figure 3C), Bacteroides was higher in the HUA group than the control group (P=0.02, Figure 3D), while Ruminococcaceae_Ruminococcus was lower (P=0.04, Figure 3E).
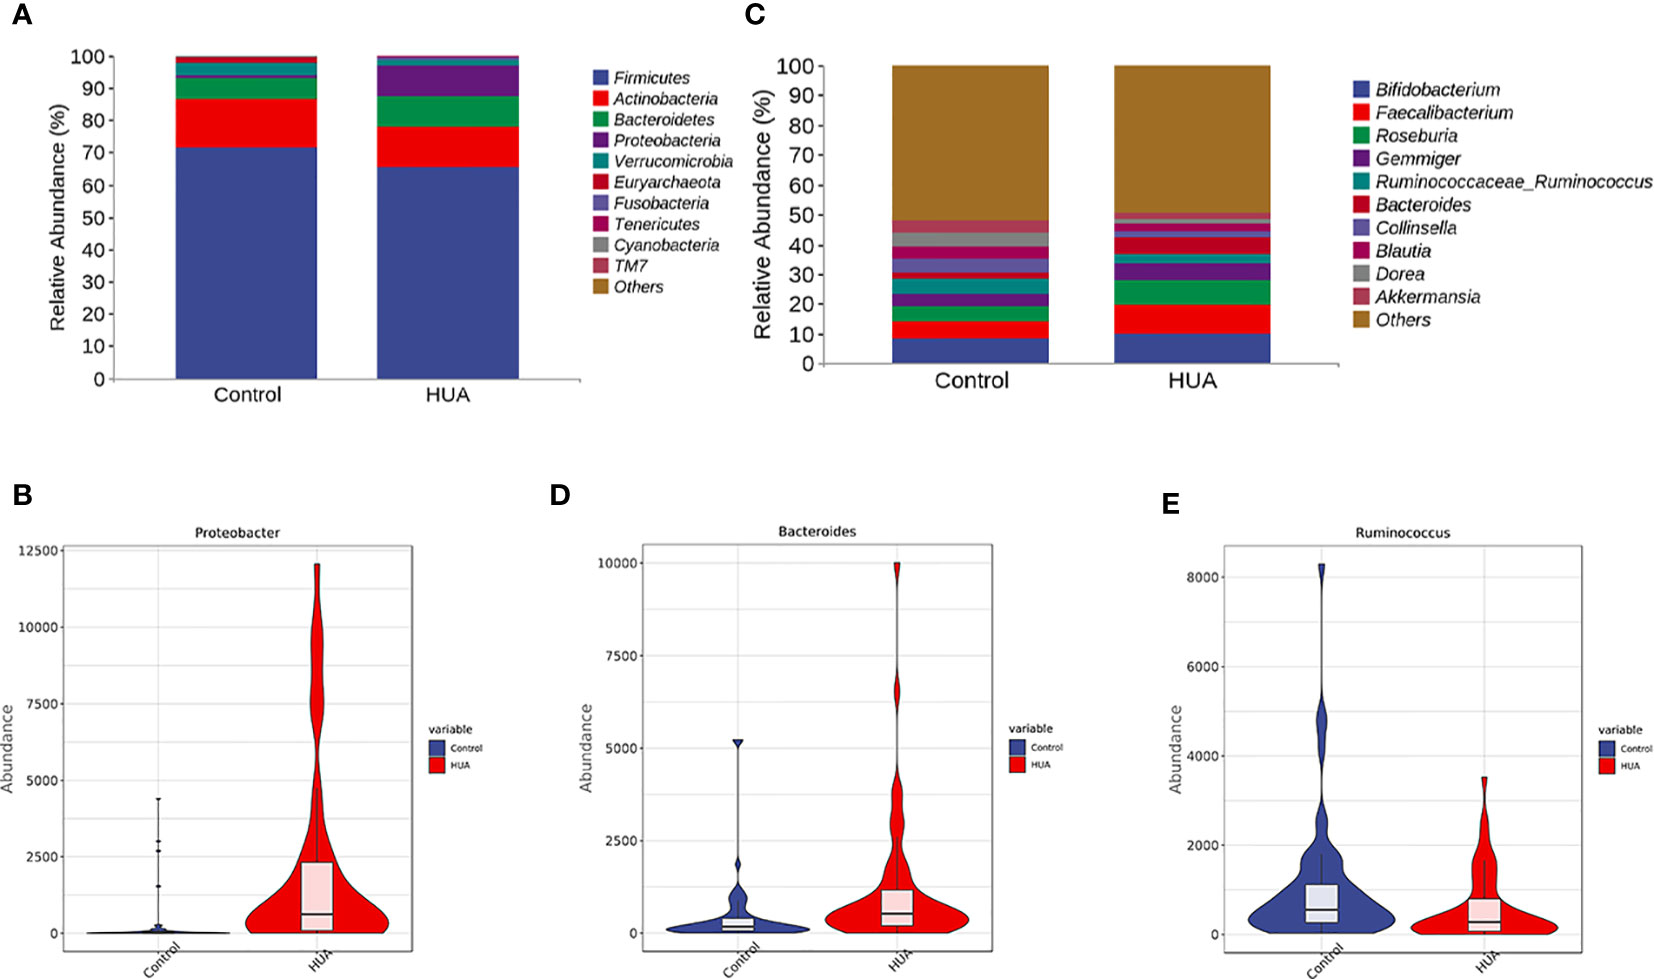
Figure 3 Differences in gut microbiota between the HUA and control groups. (A) Dominant phyla in HUA and control groups and (B) difference in Proteobacteria. (C) Dominant genera in HUA and control groups, and differences in (D) Bacteroides (P=0.02) and (E) Ruminococcaceae_Ruminococcus (P=0.04).
To determine the specific gut microbes related to HUA, we used linear discriminant analysis (LDA) effect size (LEfSe) to screen 186 gut microbial species. Figures 4A, B show the top 50. The phylum Bacteroidetes and its derivatives (Bacteroidia, Bacteroidaceae, and Bacteroides), the phylum Proteobacteria and its derivative (Gammaproteobacteria), the order Enterobacteriales and its derivatives (Enterobacteriaceae and Shigella), the class Erysipelotrichi and its derivatives (Erysipelotrichales and Erysipelotrichaceae), the family Streptococcaceae and its derivative (Streptococcus), and the order Lactobacillales and its derivatives (Lactobacillaceae and Lactobacillus) were higher in the HUA patients. Conversely, the phylum Verrucomicrobia and its derivatives (Verrucomicrobiae, Verrucomicrobiales, Verrucomicrobiaceae, and Akkermansia), the phylum Actinobacteria and its derivatives (Coriobacteriia, Coriobacteriales, Coriobacteriaceae, and Collinsella), and the family Ruminococcaceae and its derivative (Ruminococcus) were lower in the HUA patients.
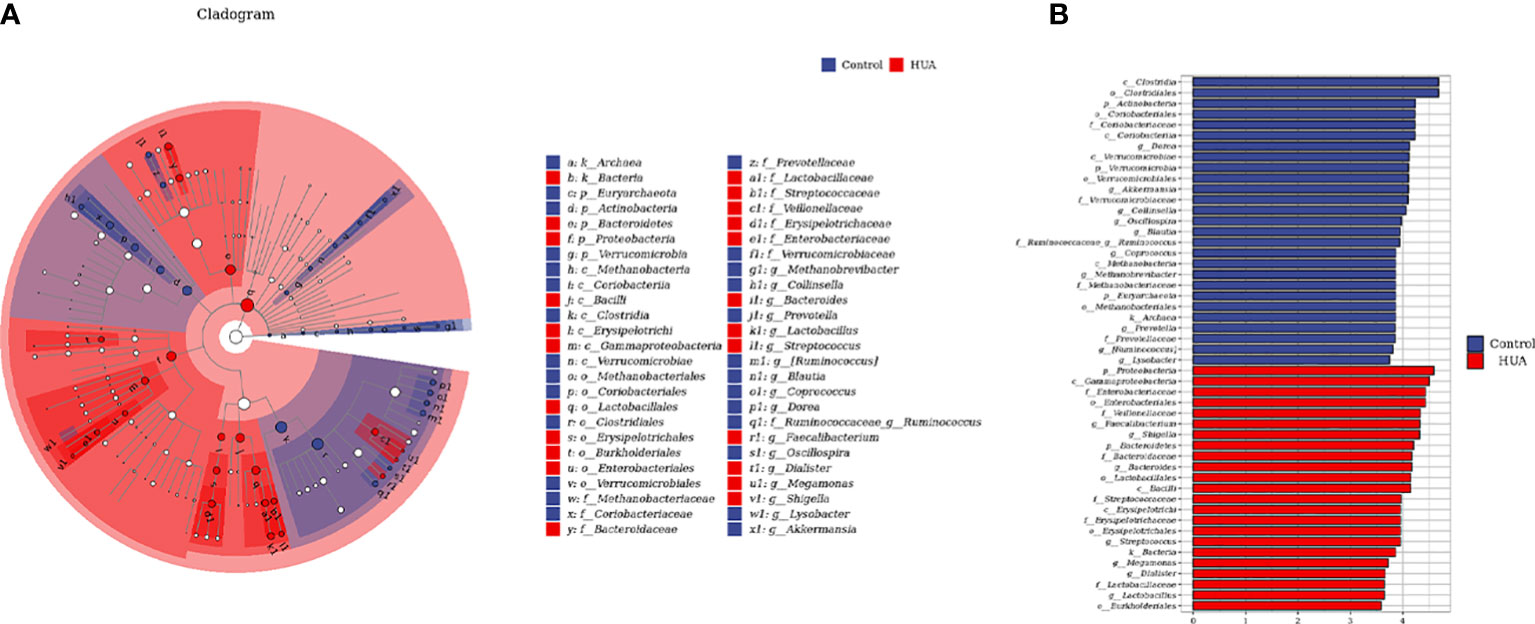
Figure 4 Linear discriminant analysis (LDA) effect size (LEfSe) analysis indicating the most differential genera between the HUA and control groups. (A) Cladogram. The brightness of each point is directly proportional to its effect. (B) Histogram. Blue and red represent control and HUA samples, respectively.
Microbial biomarker model for diagnosing HUA
To develop a HUA diagnostic model using gut microbial biomarkers, we randomly divided (2:1 ratio) 107 participants (from the HUA and control groups) into the development and validation groups. Subsequently, we performed a 10-fold cross-validation of the random forest model in the development group, and 12 gut microbial biomarkers were identified as the optimum parameter set (Table S2). The POD index in HUA and control samples in the development and validation groups was used to determine the diagnostic value of the 12 gut microbial biomarkers. The POD index was significantly increased in the HUA samples compared to the control samples in both groups (both P<0.001, Figures 5A, C). The POD index achieved an AUC value of 84.9% and 82% for distinguishing between the HUA patients and controls in the development and validation group, respectively (Figures 5B, D). To evaluate the discriminatory ability of the ROC curve, we computed the AUC with a 95% CI by using 500 bootstrap resamplings. Sensitivity, specificity, positive predictive value (PPV), negative predictive value (NPV), positive likelihood ratio (PLR), and negative likelihood ratio (NLR) of the stepwise model are also presented in Table 2 (which shows the clinical model and the combined model, similarly hereinafter). This suggested that the microbial biomarker model has a high diagnostic value for predicting HUA.
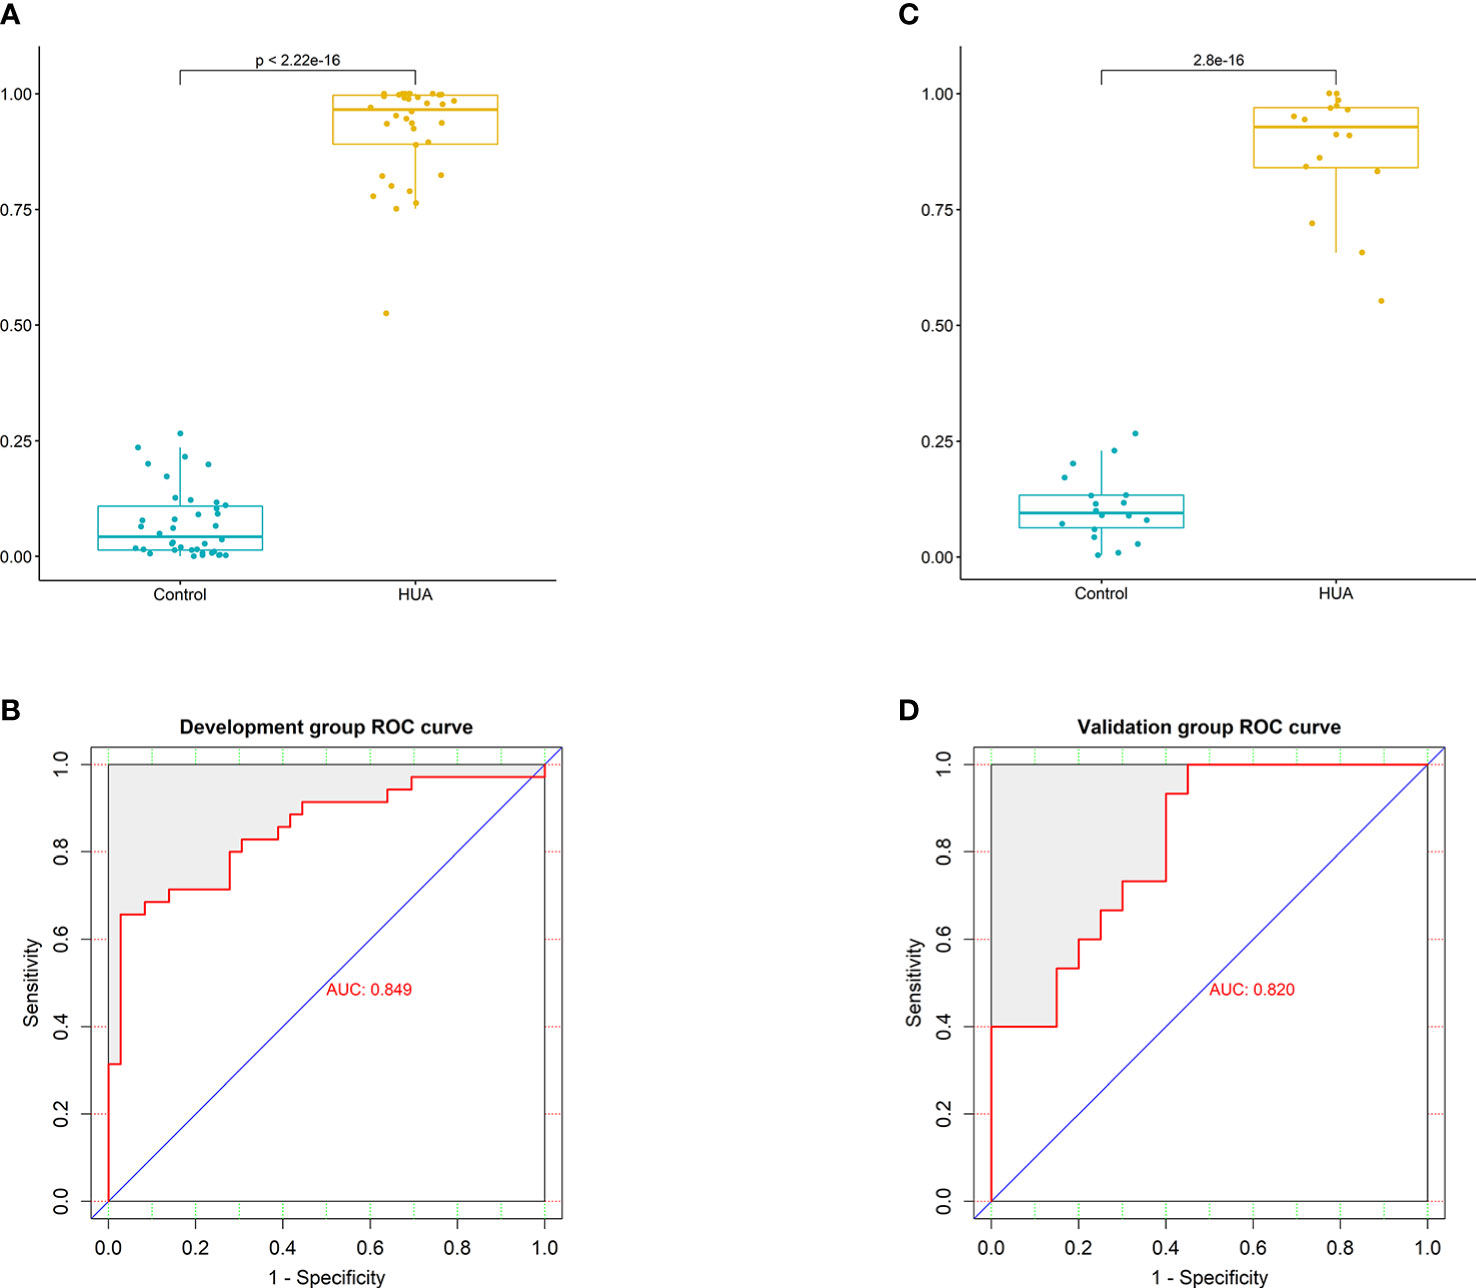
Figure 5 Performance of the microbial biomarker model for diagnosing HUA. (A) Comparison of the probability of disease (POD) index between the HUA and control groups and (B) ROC curve (with AUC) in the development group. (C) Comparison of the POD index between the HUA and control groups and (D) ROC curve (with AUC) in the validation group.
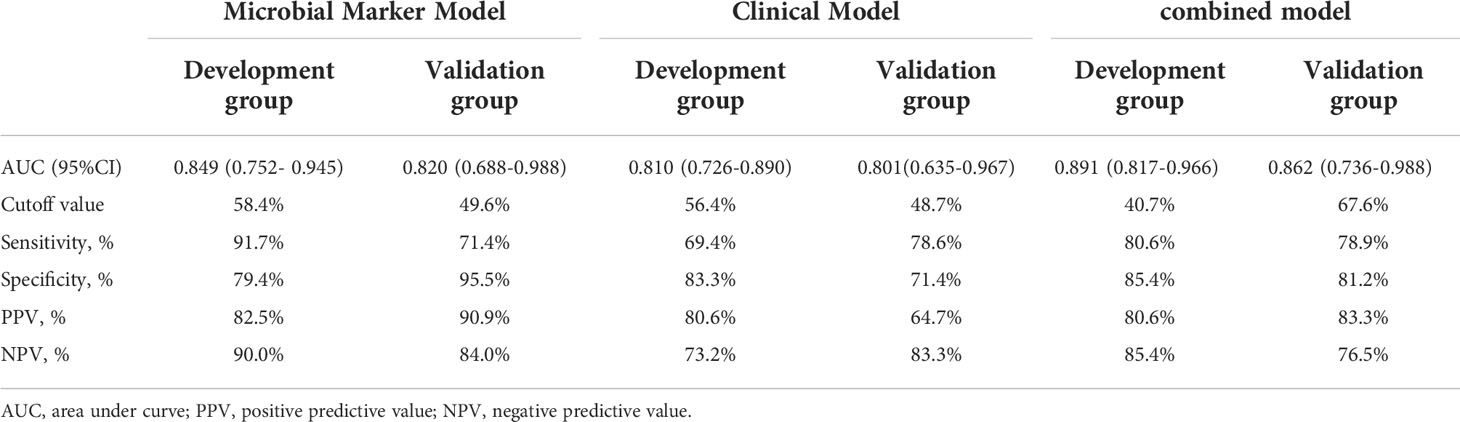
Table 2 Prediction Performance of the Three Models.
Combined model vs clinical and microbial marker models for diagnosing HUA
The clinical model was constructed using three clinical factors (BUN, TG, and HDL-C), and these factors were then also used in the combined model. These three clinical factors were selected using univariate regression and ROC curves (with AUCs), which identified 11 predictive clinical factors (Table 3), followed by least absolute shrinkage and selection operator (LASSO) regression of the 10 variables with AUC >0.5.
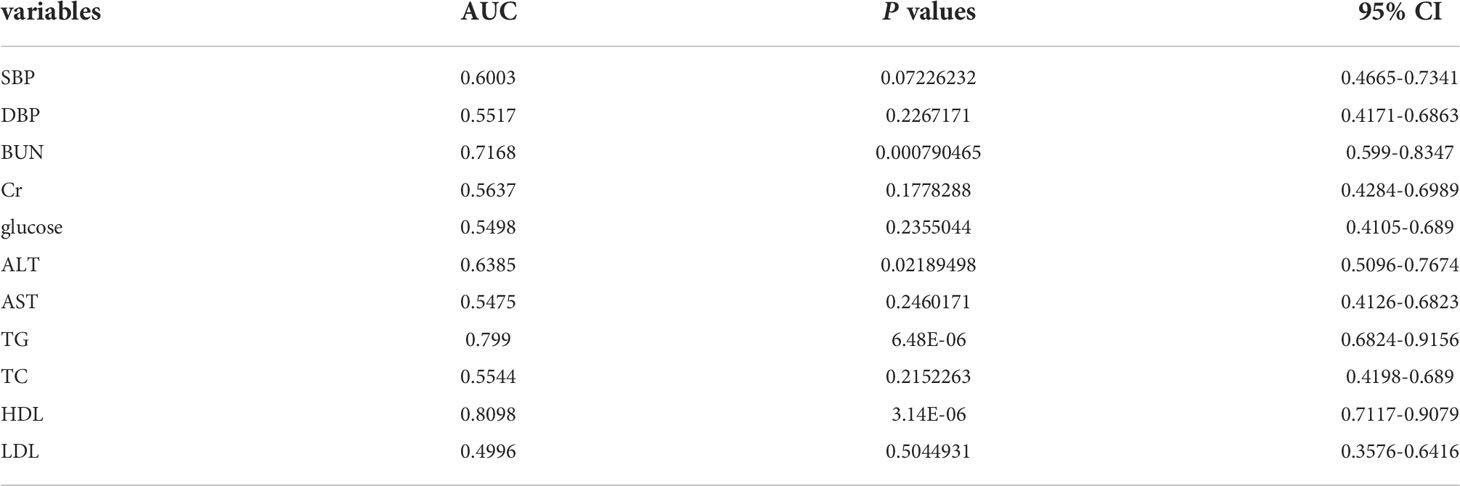
Table 3 Candidate Variables for Clinical Model Development.
In the development group, the combined model (Figures 6A, B) was superior to the clinical model (AUC: 89.1 vs 81%, P<0.001) and the microbial biomarker model (AUC: 89.1 vs 84.9%, P<0.001), while the clinical and microbial biomarker models did not significantly differ. Similarly, in the validation group, the combined model (Figures 6C, D) was superior to the clinical model (AUC: 86.2 vs 80.1%, P<0.001) and the microbial biomarker model (AUC: 86.2 vs 82%, P<0.001), while the clinical and microbial biomarker models did not significantly differ. In summary, the ROC curves of the three models in the development and validation groups indicated that the prediction results of the combined model were superior to those of the microbial biomarker and clinical models (Figures 6E, F).
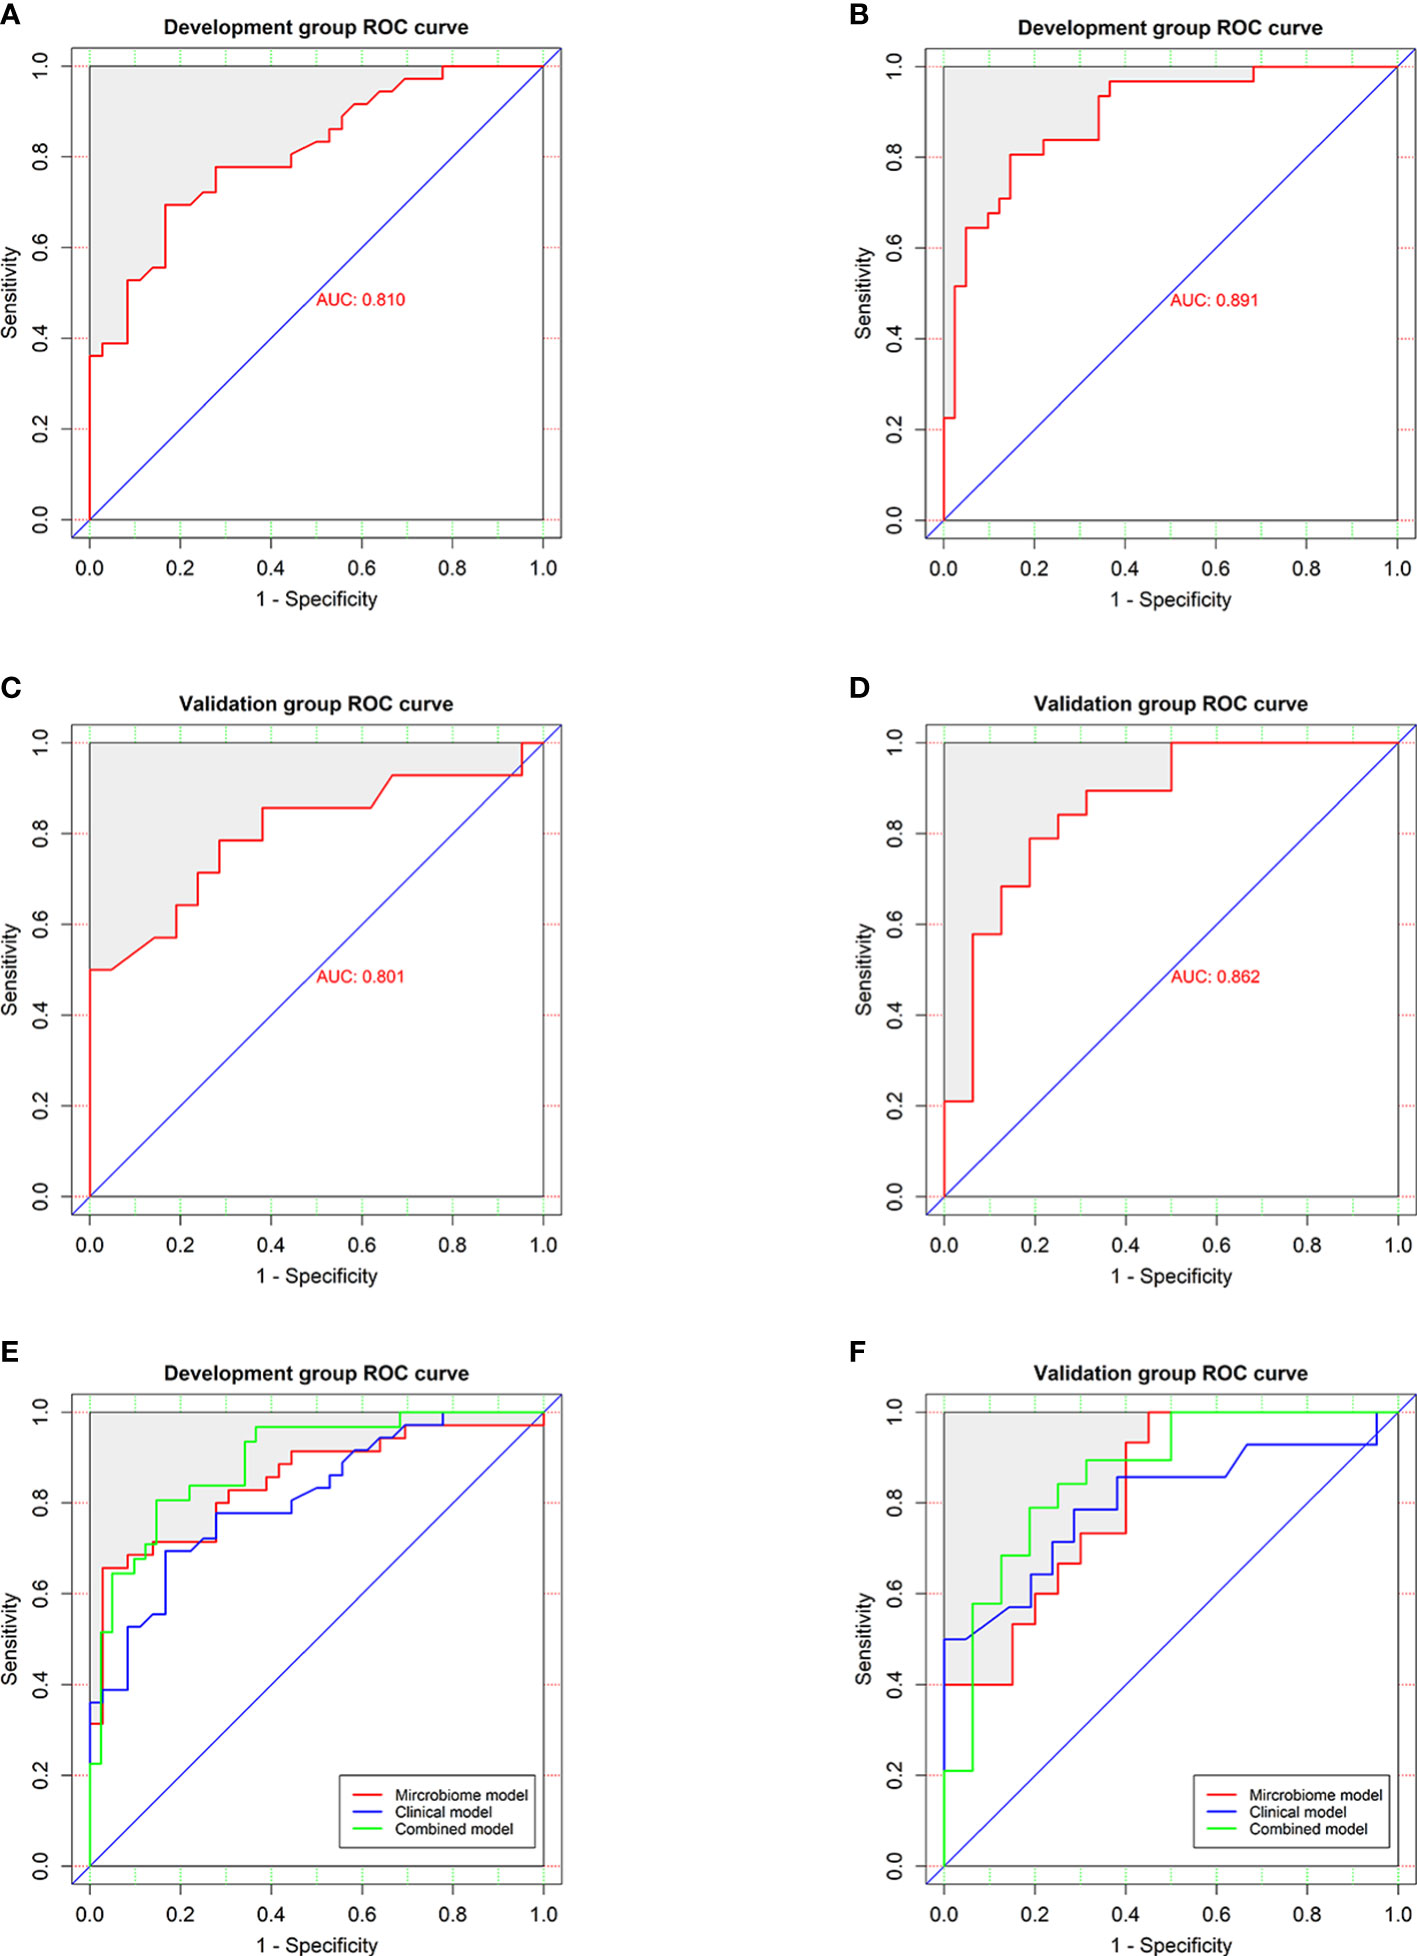
Figure 6 Performances of the clinical and combined models for diagnosing HUA. ROC curves (with AUCs) for the (A) clinical and (B) combined models in the development group were similar to those for the (C) clinical and (D) combined models in the validation group. ROC curves (with AUCs) of clinical model, microbial biomarker model, and combined model in the (E) development and (F) validation groups showing that the combined model was superior to the others models in both groups. The diagonal line (45°) indicates the performance of a diagnostic test that is no better than chance.
Combined model and nomogram for predicting HUA
To visualize the prediction of HUA using the combined model, we established a nomogram based on the combined model (Figure 7A). Based on the risk factors on the left side of the nomogram, it can be seen that the combined model involves four risk factors. The diagnostic index (DI) of HUA can be calculated according to the following formula for the combined model: 116.92062 + 9.09091×BUN (mmol/l) + 10.31362 × TG (mmol/l) - 39.40222 × HDL (mmol/l) - 42.84683 × microbiome.
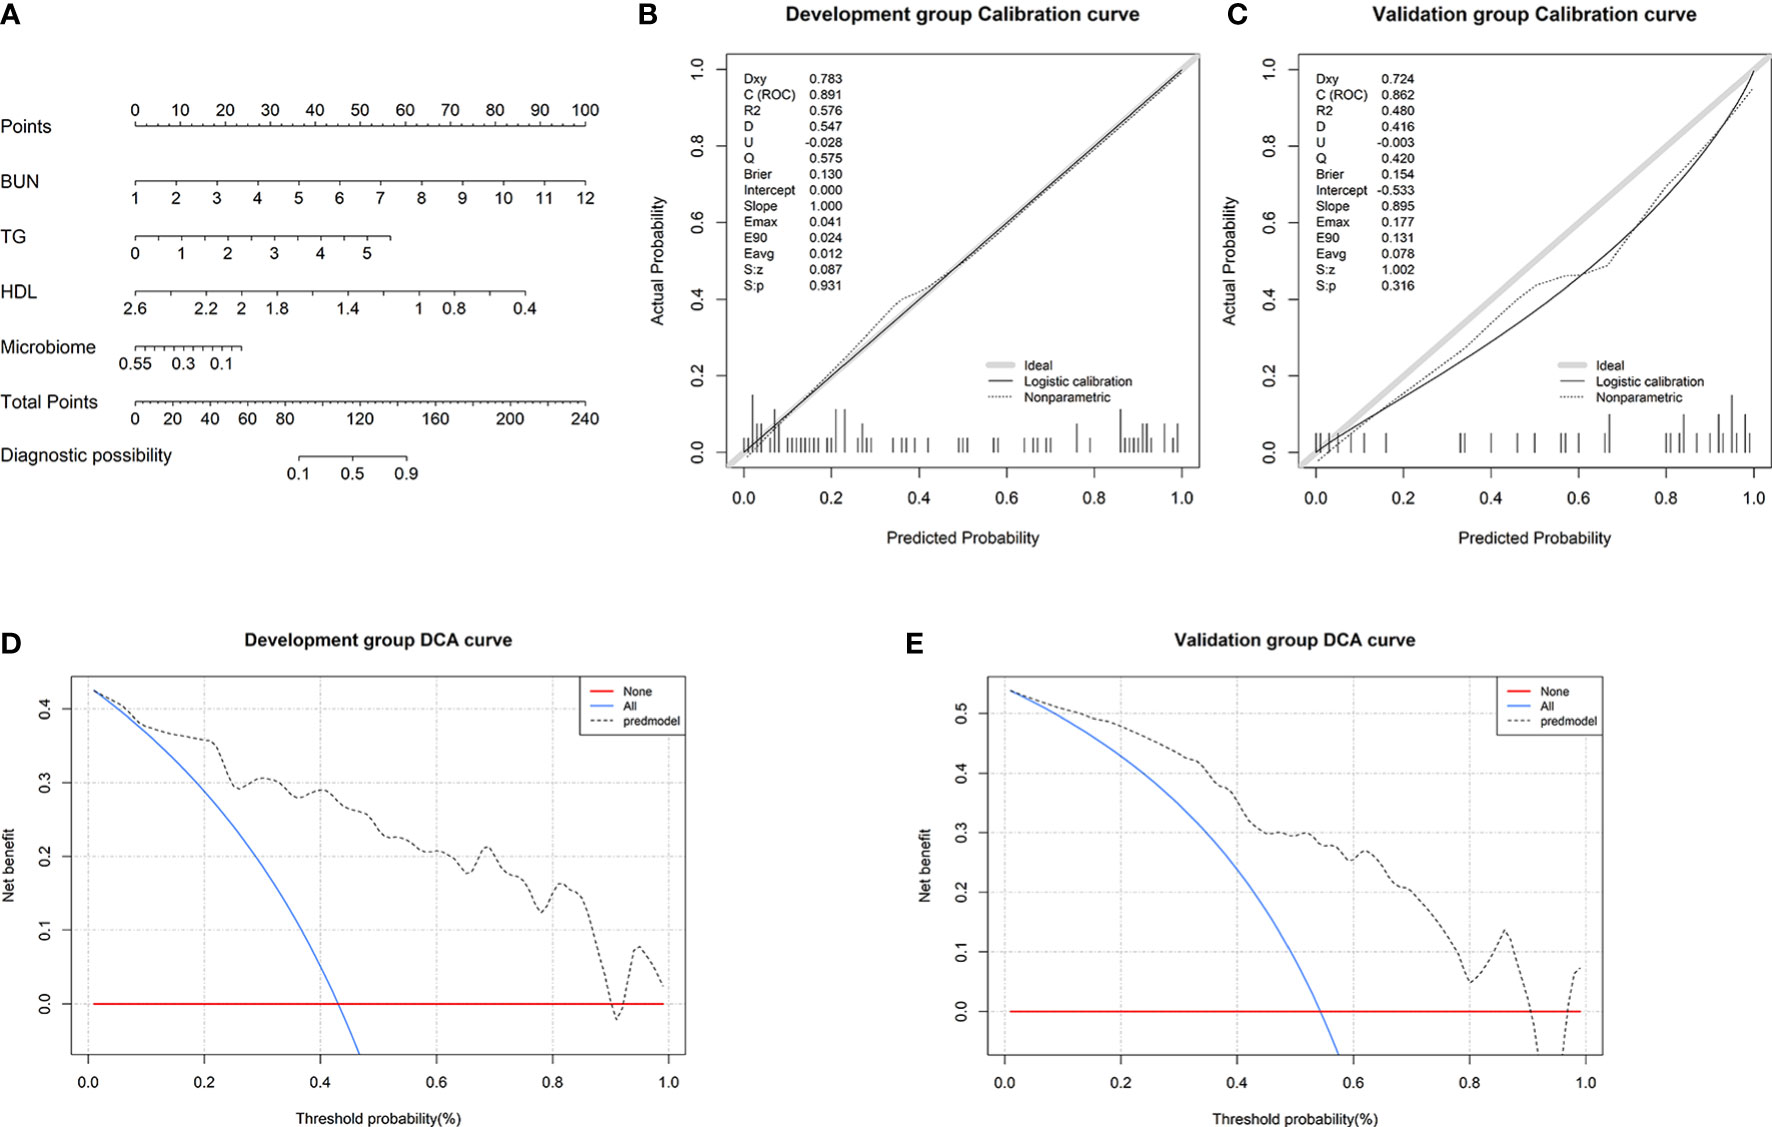
Figure 7 Nomogram and its performance. (A) To use the nomogram, draw a vertical line from the risk factor to the “Points” axis to determine the score of each risk factor in the nomogram. The total score is the sum of the scores of all risk factors. To estimate the probability of hyperuricemia (HUA), draw a vertical line from the “Total points” axis to the “Probability of HUA” axis. Calibration curves in the (B) development and (C) validation groups showing that the combined model prediction curve and actual observation curve are very close, indicating good calibration in the both groups. Decision curve analysis (DCA) in the (E) development and (F) validation groups. The red horizontal line and the blue diagonal line are two extreme states: intervention for no patients and intervention for all patients, respectively. The gray dotted line indicates the net benefit for the patients based on prediction using the combined model.
Subsequently, we found that the results of the Hosmer–Lemeshow goodness-of-fit tests for the combined model were P=0.931 and P=0.316 in the development and validation groups, respectively (Figures 7B, C). This indicates that there was no significant deviation between the observed and predicted probabilities. Thus, the nomogram based on the combined model (involving microbial biomarkers and clinical factors) has a high diagnostic ability regarding HUA. To further determine the clinical value of the combined model, we used DCA to evaluate the model. In both the development and validation groups, the curve for the combined model (gray dotted line) was far above the two extreme curves (intervention for none and intervention for all: red and blue lines, respectively), indicating that the combined model provides high net clinical benefit for HUA patients (Figures 7D, E).
Discussion
In this study, the composition and distribution of gut microbial communities in individuals with different uric acid levels were distinct. However, in current clinical practice, the serum uric acid level is still used to diagnose HUA, and the occurrence and development of HUA cannot be easily pre-empted. Therefore, we successfully developed a diagnostic model for HUA based on gut microbial biomarkers and clinical factors for the first time, which has clinical value according to the DCA evaluation.
More and more studies have shown that the gut microbiome is closely related to a variety of metabolic diseases, such as diabetes (16, 17), hypertension (18, 19), coronary heart disease (20, 21), hyperlipidemia (22), and gout (23, 24). Guo et al. (23) found that 17 bacterial genera (including Bacteroides, Holdemania, and Anaerotruncus) were enriched in gout patients, while Faecalibacterium, Coprococcus, and Ruminococcus were decreased. We used high-throughput sequencing of the V3-V4 region of the 16S rDNA gene to characterize the microbiome in 168 fecal samples. The α diversity decreased in LSU and HUA patients compared to controls (Figure 2A; Table 3).
Additionally, we found that certain opportunistic pathogens were enriched in HUA, such as the phylum Bacteroidetes (and its genera Bacteroides), genus Shigella, family Erysipelotrichaceae, and genus Streptococcus (Figures 3D, 4A). Bacteroides enrichment has been reported to be associated with intestinal inflammation, such as inflammatory bowel disease (IBD), and autoimmune diseases, such as systemic lupus erythematosus (25), rheumatoid arthritis (26), and type I diabetes (27, 28). Certain Bacteroides species are considered biomarkers of IBD and their associated OmpW proteins can be used as targets for developing IBD immunotherapy (29). Shigella and Erysipelotrichaceae are considered opportunistic pathogens in the human gut and are significantly increased in Crohn’s disease (30, 31). Erysipelotrichaceae can produce phenyl sulfate, which impairs glomerular function and is highly associated with diabetic nephropathy (32). Lastly, Streptococcus is a common type of pyogenic coccus that can cause various types of pyogenic inflammation related to intestinal inflammatory responses and intestinal mucosal damage, and it can affect intestinal uric acid excretion (33, 34).
In our HUA patients, the genera Ruminococcus, Coprococcus, and Blautia, which produce short-chain fatty acids (SCFAs), were significantly reduced (Figures 4A, B). SCFAs are bacterial metabolites that can promote health by regulating intestinal immune function and maintaining the intestinal mucosal barrier (35–37). The decreased Ruminococcus, Coprococcus, and Blautia in HUA may decrease SCFAs in the intestine, increasing the risk of HUA. Ruminococcus and Coprococcus are mainly associated with butyrate production (24). Butyrate, a major SCFA, is mainly produced by bacterial fermentation of dietary fiber in the gut. It is the main energy supply for intestinal epithelial cells (via fatty acid oxidation) and regulates intestinal health, inhibits inflammation, and has antioxidant and anticancer effects (38, 39). As mentioned, Ruminococcus was decreased in our HUA patients (Figure 3E). Chu et al. (24) also found that butyrate-producing bacteria were significantly reduced in gout patients. Additionally, long-term alcohol intake greatly decreases Ruminococcus in the gut, thereby affecting butyrate production and increasing the risk of steatohepatitis and liver injury; decreased Ruminococcus is also associated with lipid metabolism disorders, and dyslipidemia is an important risk factor for HUA (40). Furthermore, Wan et al. (41) found that a low-fat diet was associated with increased Blautia, and the butyrate in the feces of the high-fat diet group was significantly lower than in other groups. This indicates that a long-term high-fat diet had harmful effects on the gut microbiome, increasing the risk of inflammation and chronic diseases.
Thus, it could be seen that there were significant differences in the distribution of intestinal flora between HUA and healthy people in our research. In particular, gut microbes that produced SCFAs were significantly reduced in HUA. SCFAs are involved in energy metabolism (42); they can provide energy for intestinal epithelial cells and participate in the excretion of uric acid. The decrease in gut uric acid excretion increases the burden on the kidneys (43), and then affects the level of serum uric acid.
Subsequently, we used a random forest model to identify 12 gut microbial biomarkers as the optimal parameter set for predicting HUA. We then used the POD index of the 12 microbial biomarkers to predict HUA. This index had strong predictive ability in both the development and validation groups (AUC=84.9% and 82%, respectively; P<0.001). These results suggested that the microbial biomarker model might be useful for the early diagnosis of HUA.
In recent years, clinical factors have often been used to construct diagnostic prediction models. However, the model constructed using only clinical factors had only moderate predictive ability for HUA, and a combined model based on clinical factors and gut microbial biomarkers had not been previously developed for HUA. Therefore, we not only constructed a clinical model and a microbial biomarker model, but also used the factors in these two models to construct a combined model. The predictive ability of the combined model was significantly better than that of the other two models. To visualize the combined model, we constructed a nomogram that indicated the predictive ability of each included variable. More importantly, the predictive ability of the nomogram was assessed in both the development and validation groups. The results indicated that the combined model had good accuracy (based on the ROC curve), discrimination (based on the decision curve analysis), and calibration results (based on calibration curves) for predicting HUA.
There are several limitations to this study. First, although we developed a combined model that involved gut microbial biomarkers, the specific functions of these biomarkers remain unclear. Second, we only used 16S rDNA sequencing of DNA from stool samples, without assessing fecal metabolites or blood samples. Third, the sample size was relatively small, and external validation was not conducted. Multicenter studies involving different regions/countries are needed to verify the combination model.
In conclusion, we first found that there were distinct gut microbiomes among participants with different serum uric acid levels. The gut microbial diversity decreased in LSU and HUA patients compared to controls, especially in HUA patients. Therefore, we developed a diagnostic model by combining clinical factors and gut microbial biomarkers that has practical clinical value for predicting HUA.
Data availability statement
The original contributions presented in the study are publicly available. This data can be found here: NCBI repository, accession number PRJNA869365.
Ethics statement
The studies involving human participants were reviewed and approved by The Medical Ethics Committee of the First Affiliated Hospital of Xinjiang Medical University(No. K202105-08). The patients/Participants provided their written informed consent to participate in this study.
Author contributions
(I) Conception and design: ML, WC, YS. (II) Administrative support: YS, MK,YC, JL. (III) Provision of study materials or patients: YH, SY, YM. (IV) Collection and assembly of data: ML, TT, WX. (V) Data analysis and interpretation: WC, RL, BZ. (VI) Manuscript writing: all authors. (VII) Final approval of manuscript: all authors. All authors contributed to the article and approved the submitted version.
Funding
This study was funded by the National Natural Science Foundation of China (No.81960169 and 81760169), the Natural Science Foundation of the Xinjiang Uygur Autonomous Region (No.2019D01C219 and 2021D01C275), the Project of Scientific Research Program for Universities in Xinjiang Uygur Autonomous Region (No.XJEDU2021Y054), the Postgraduate Research Innovation Project in Xinjiang Uygur Autonomous Region (No.XJ2021G228) the Science and Technology Plan Project in Xinjiang Karamay City (20212022hjcxrc0060).
Acknowledgments
The authors are grateful to all the participants.
Conflict of interest
The authors declare that the research was conducted in the absence of any commercial or financial relationships that could be construed as a potential conflict of interest.
Publisher’s note
All claims expressed in this article are solely those of the authors and do not necessarily represent those of their affiliated organizations, or those of the publisher, the editors and the reviewers. Any product that may be evaluated in this article, or claim that may be made by its manufacturer, is not guaranteed or endorsed by the publisher.
Supplementary material
The Supplementary Material for this article can be found online at: https://www.frontiersin.org/articles/10.3389/fendo.2022.925119/full#supplementary-material
References
1. Mandal A, Mount D. The molecular physiology of uric acid homeostasis. Annu Rev Physiol (2015) 77:323–45. doi: 10.1146/annurev-physiol-021113-170343
2. Sandoval-Plata G, Morgan K, Abhishek A. Variants in urate transporters, ADH1B, GCKR and MEPE genes associate with transition from asymptomatic hyperuricaemia to gout: Results of the first gout versus asymptomatic hyperuricaemia GWAS in caucasians using data from the UK biobank. Ann Rheum Dis (2021) 80(9):1220–6. doi: 10.1136/annrheumdis-2020-219796
3. Sharaf El Din U, Salem M, Abdulazim D. Uric acid in the pathogenesis of metabolic, renal, and cardiovascular diseases: A review. J Adv Res (2017) 8(5):537–48. doi: 10.1016/j.jare.2016.11.004
4. Joosten L, Crişan T, Bjornstad P, Johnson R. Asymptomatic hyperuricaemia: A silent activator of the innate immune system. Nat Rev Immunol (2020) 16(2):75–86. doi: 10.1038/s41584-019-0334-3
5. Yip K, Cohen R, Pillinger M. Asymptomatic hyperuricemia: Is it really asymptomatic? Curr Opin Rheumatol (2020) 32(01):71–9. doi: 10.1097/bor.0000000000000679
6. Kocak M, Aktas G, Erkus E, Sincer I, Atak B, Duman T. Serum uric acid to HDL-cholesterol ratio is a strong predictor of metabolic syndrome in type 2 diabetes mellitus. Rev Assoc Med Bras (1992). (2019) 65(1):9–15. doi: 10.1590/1806-9282.65.1.9
7. Liu J, Wang K, Liu H, Zhao H, Zhao X, Lan Y, et al. Relationship between carotid-femoral pulse wave velocity and uric acid in subjects with hypertension and hyperuricemia. Endocr J (2019) 66(7):629–36. doi: 10.1507/endocrj.EJ18-0570
8. Zhao R, Wang Y, Fu T, Zhou W, Ge X, Sha X, et al. Gout and risk of diabetes mellitus: meta-analysis of observational studies. Psychol Health Med (2020) 25(8):917–30. doi: 10.1080/13548506.2019.1707241
9. Lioté F. Gout furonculosis. Joint Bone spine. (2019) 86(1):103. doi: 10.1016/j.jbspin.2018.05.002
10. Stamp L, Dalbeth N. Prevention and treatment of gout. Nat Rev Rheumatol (2019) 15(2):68–70. doi: 10.1038/s41584-018-0149-7
11. D’Silva K, Yokose C, Lu N, McCormick N, Lee H, Zhang Y, et al. Hypouricemia and mortality risk in the US general population. Arthritis Care Res (Hoboken). (2021) 73(8):1171–9. doi: 10.1002/acr.24476
12. Kuo C, See L, Yu K, Chou I, Chiou M, Luo S. Significance of serum uric acid levels on the risk of all-cause and cardiovascular mortality. Rheumatol (Oxford England). (2013) 52(1):127–34. doi: 10.1093/rheumatology/kes223
13. Shao T, Shao L, Li H, Xie Z, He Z, Wen C. Combined signature of the fecal microbiome and metabolome in patients with gout. Front Microbiol (2017) 8:268. doi: 10.3389/fmicb.2017.00268
14. Yamada N, Saito C, Murayama-Chiba Y, Kano H, Asami Y, Itoh H. Lactobacillus gasseri PA-3 utilizes the purines GMP and guanosine and decreases their absorption in rats. Nucleosides Nucleotides Nucleic Acids (2018) 37(5):307–15. doi: 10.1080/15257770.2018.1454949
15. Li M, Yang D, Mei L, Yuan L, Xie A, Yuan J. Screening and characterization of purine nucleoside degrading lactic acid bacteria isolated from Chinese sauerkraut and evaluation of the serum uric acid lowering effect in hyperuricemic rats. PloS One (2014) 9(9):e105577. doi: 10.1371/journal.pone.0105577
16. Brunkwall L, Orho-Melander M. The gut microbiome as a target for prevention and treatment of hyperglycaemia in type 2 diabetes: from current human evidence to future possibilities. Diabetologia (2017) 60(6):943–51. doi: 10.1007/s00125-017-4278-3
17. Gou W, Ling C, He Y, Jiang Z, Fu Y, Xu F, et al. Interpretable machine learning framework reveals robust gut microbiome features associated with type 2 diabetes. Diabetes Care (2021) 44(2):358–66. doi: 10.2337/dc20-1536
18. Muralitharan R, Jama H, Xie L, Peh A, Snelson M, Marques F. Microbial peer pressure: The role of the gut microbiota in hypertension and its complications. Hypertension (Dallas Tex: 1979) (2020) 76(6):1674–87. doi: 10.1161/hypertensionaha.120.14473
19. Calderón-Pérez L, Llauradó E, Companys J, Pla-Pagà L, Pedret A, Rubió L, et al. Interplay between dietary phenolic compound intake and the human gut microbiome in hypertension: A cross-sectional study. Food Chem (2021) 344:128567. doi: 10.1016/j.foodchem.2020.128567
20. Emoto T, Yamashita T, Kobayashi T, Sasaki N, Hirota Y, Hayashi T, et al. Characterization of gut microbiota profiles in coronary artery disease patients using data mining analysis of terminal restriction fragment length polymorphism: Gut microbiota could be a diagnostic marker of coronary artery disease. Heart Vessels (2017) 32(1):39–46. doi: 10.1007/s00380-016-0841-y
21. Emoto T, Yamashita T, Sasaki N, Hirota Y, Hayashi T, So A, et al. Analysis of gut microbiota in coronary artery disease patients: A possible link between gut microbiota and coronary artery disease. J Atheroscler Thromb (2016) 23(8):908–21. doi: 10.5551/jat.32672
22. Takagi T, Naito Y, Kashiwagi S, Uchiyama K, Mizushima K, Kamada K, et al. Changes in the gut microbiota are associated with hypertension, hyperlipidemia, and type 2 diabetes mellitus in Japanese subjects. Nutrients (2020) 12(10):1–13. doi: 10.3390/nu12102996
23. Guo Z, Zhang J, Wang Z, Ang K, Huang S, Hou Q, et al. Intestinal microbiota distinguish gout patients from healthy humans. Sci Rep (2016) 6:20602. doi: 10.1038/srep20602
24. Chu Y, Sun S, Huang Y, Gao Q, Xie X, Wang P, et al. Metagenomic analysis revealed the potential role of gut microbiome in gout. NPJ Biofilms Microbiomes. (2021) 7(1):66. doi: 10.1038/s41522-021-00235-2
25. Chen B, Jia X, Xu J, Zhao L, Ji J, Wu B, et al. An autoimmunogenic and proinflammatory profile defined by the gut microbiota of patients with untreated systemic lupus erythematosus. Arthritis Rheumatol (2021) 73(2):232–43. doi: 10.1002/art.41511
26. Zhang X, Zhang D, Jia H, Feng Q, Wang D, Liang D, et al. The oral and gut microbiomes are perturbed in rheumatoid arthritis and partly normalized after treatment. Nat Med (2015) 21(8):895–905. doi: 10.1038/nm.3914
27. Davis-Richardson A, Ardissone A, Dias R, Simell V, Leonard M, Kemppainen K, et al. Bacteroides dorei dominates gut microbiome prior to autoimmunity in Finnish children at high risk for type 1 diabetes. Front Microbiol (2014) 5:678. doi: 10.3389/fmicb.2014.00678
28. Zafar H, Saier M. BacteroidesGut species in health and disease. Gut Microbes (2021) 13(1):1–20. doi: 10.1080/19490976.2020.1848158
29. Wei B, Dalwadi H, Gordon L, Landers C, Bruckner D, Targan S, et al. Molecular cloning of a bacteroides caccae TonB-linked outer membrane protein identified by an inflammatory bowel disease marker antibody. Infect Immun (2001) 69(10):6044–54. doi: 10.1128/iai.69.10.6044-6054.2001
30. Zhang Z, Taylor L, Shommu N, Ghosh S, Reimer R, Panaccione R, et al. A diversified dietary pattern is associated with a balanced gut microbial composition of faecalibacterium and Escherichia/Shigella in patients with crohn’s disease in remission. J Crohns Colitis. (2020) 14(11):1547–57. doi: 10.1093/ecco-jcc/jjaa084
31. Turpin W, Bedrani L, Espin-Garcia O, Xu W, Silverberg M, Smith M, et al. Associations of NOD2 polymorphisms with erysipelotrichaceae in stool of in healthy first degree relatives of crohn’s disease subjects. BMC Med Genet (2020) 21(1):204. doi: 10.1186/s12881-020-01115-w
32. Kikuchi K, Saigusa D, Kanemitsu Y, Matsumoto Y, Thanai P, Suzuki N, et al. Gut microbiome-derived phenyl sulfate contributes to albuminuria in diabetic kidney disease. Nat Commun (2019) 10(1):1835. doi: 10.1038/s41467-019-09735-4
33. Ellmerich S, Schöller M, Duranton B, Gossé F, Galluser M, Klein J, et al. Promotion of intestinal carcinogenesis by streptococcus bovis. Carcinogenesis (2000) 21(4):753–6. doi: 10.1093/carcin/21.4.753
34. Abdulamir A, Hafidh R, Bakar F. Molecular detection, quantification, and isolation of streptococcus gallolyticus bacteria colonizing colorectal tumors: inflammation-driven potential of carcinogenesis via IL-1, COX-2, and IL-8. Mol Cancer. (2010) 9:249. doi: 10.1186/1476-4598-9-249
35. Andrade-Oliveira V, Amano M, Correa-Costa M, Castoldi A, Felizardo R, de Almeida D, et al. Gut bacteria products prevent AKI induced by ischemia-reperfusion. J Am Soc Nephrol. (2015) 26(8):1877–88. doi: 10.1681/asn.2014030288
36. Bindels L, Porporato P, Dewulf E, Verrax J, Neyrinck A, Martin J, et al. Gut microbiota-derived propionate reduces cancer cell proliferation in the liver. Br J Cancer. (2012) 107(8):1337–44. doi: 10.1038/bjc.2012.409
37. Burger-van Paassen N, Vincent A, Puiman P, van der Sluis M, Bouma J, Boehm G, et al. The regulation of intestinal mucin MUC2 expression by short-chain fatty acids: Implications for epithelial protection. Biochem J (2009) 420(2):211–9. doi: 10.1042/bj20082222
38. Liu J, Bayir H, Cosby D, Cox N, Williams S, Fowler J. Evaluation of encapsulated sodium butyrate on growth performance, energy digestibility, gut development, and salmonella colonization in broilers. J Poult Sci (2017) 96(10):3638–44. doi: 10.3382/ps/pex174
39. Singh N, Gurav A, Sivaprakasam S, Brady E, Padia R, Shi H, et al. Activation of Gpr109a, receptor for niacin and the commensal metabolite butyrate, suppresses colonic inflammation and carcinogenesis. Immunity (2014) 40(1):128–39. doi: 10.1016/j.immuni.2013.12.007
40. Singhal R, Donde H, Ghare S, Stocke K, Zhang J, Vadhanam M, et al. Decrease in acetyl-CoA pathway utilizing butyrate-producing bacteria is a key pathogenic feature of alcohol-induced functional gut microbial dysbiosis and development of liver disease in mice. Gut Microbes (2021) 13(1):1946367. doi: 10.1080/19490976.2021.1946367
41. Wan Y, Wang F, Yuan J, Li J, Jiang D, Zhang J, et al. Effects of dietary fat on gut microbiota and faecal metabolites, and their relationship with cardiometabolic risk factors: A 6-month randomised controlled-feeding trial. Gut (2019) 68(8):1417–29. doi: 10.1136/gutjnl-2018-317609
42. Nieuwdorp M, Gilijamse PW, Pai N, Kaplan LM. Role of the microbiome in energy regulation and metabolism. Gastroenterology (2014) 146(6):1525–33. doi: 10.1053/j.gastro.2014.02.008
Keywords: gut microbiome, uric acid, hyperuricemia, diagnostic model, nomogram
Citation: Liang M, Liu J, Chen W, He Y, Kahaer M, Li R, Tian T, Liu Y, Bai B, Cui Y, Yang S, Xiong W, Ma Y, Zhang B and Sun Y (2022) Diagnostic model for predicting hyperuricemia based on alterations of the gut microbiome in individuals with different serum uric acid levels. Front. Endocrinol. 13:925119. doi: 10.3389/fendo.2022.925119
Received: 21 April 2022; Accepted: 05 September 2022;
Published: 27 September 2022.
Edited by:
Benoit Cudennec, Lille University of Science and Technology, FranceReviewed by:
Jeena Gupta, Lovely Professional University, IndiaCheng Hu, Shanghai Jiao Tong University, China
Copyright © 2022 Liang, Liu, Chen, He, Kahaer, Li, Tian, Liu, Bai, Cui, Yang, Xiong, Ma, Zhang and Sun. This is an open-access article distributed under the terms of the Creative Commons Attribution License (CC BY). The use, distribution or reproduction in other forums is permitted, provided the original author(s) and the copyright owner(s) are credited and that the original publication in this journal is cited, in accordance with accepted academic practice. No use, distribution or reproduction is permitted which does not comply with these terms.
*Correspondence: Yuping Sun, sypmjj20080106@sina.com