 Zhenyuan Ma1,2
 Yibao Wei1,2
 Li Zhang1,2
 Xiaoqing Shi1,2Runlin Xing1,3Taiyang Liao1,2
 Nan Yang1,2Xiaochen Li1,3Lishi Jie1,2
 Peimin Wang1,2,3*
- 1Department of Orthopedics, Affiliated Hospital of Nanjing University of Chinese Medicine, Nanjing, China
- 2Key Laboratory for Metabolic Diseases in Chinese Medicine, First College of Clinical Medicine, Nanjing University of Chinese Medicine, Nanjing, China
- 3Department of Traditional Chinese Medicine Orthopedics, Jiangsu Province Hospital of Chinese Medicine, Nanjing, China
Purpose: OP and OA are chronic bone diseases with high incidence in the middle-aged and elderly populations. The latest research shows that the pathological environment of OP may be involved in the aggravation of the pathological process of OA, and the pathological state of OP plays an important role in the aggravation of OA pathology. EXD is a traditional Chinese medicine decoction that has been used to treat osteoporosis. Therefore, we further study whether OA will be aggravated in the OP environment and whether EXD can alleviate OA by intervening in the OP environment. The purpose of this study was to analyze the effect of OP on OA metabolites by using metabolomic methods and to explore the intervention mechanism of EXD on osteoporotic OA.
Method: Thirty-two SD rats were randomly divided into normal group, OA group, OP-OA group, and EXD group. EXD was administered by gavage. Histopathological evaluation of cartilage tissue was performed using Saffron fast green and HE staining. Western blot and qRT-PCR were used to detect the expression levels of chondrogenesis genes SOX9, COL2A1, and COMP in cartilage tissue. GC-TOFMS and LC-QTRAP-MS/MS metabolomics methods were used to analyze the changes of metabolites in serum samples of rats in each group.
Result: The slice results showed that the cartilage damage in the OP-OA group was more serious than that in the OA group, which was significantly relieved after EXD intervention, indicating that the cartilage damage in the OP-OA group was more severe than that in the OA group and further reduced the protein and gene expressions of cartilage markers SOX9, COL2A1, and COMP. Thirty-seven substances were identified, and gentiopicroside, emodin, quercetin, and diosmetin were analyzed as possible active components of EXD. EXD treatment significantly reduced cartilage damage and reversed the expression of these markers. Metabolomics showed that EXD attenuated cartilage destruction by modulating the expression of cystine, chenodeoxycholate, and D-Turanose, involving glycolysis/gluconeogenesis, pantothenate, and CoA biosynthesis metabolic pathways.
Conclusion: The OP environment may promote the progression of OA through metabolic factors. The benign intervention of EXD in osteoporotic OA involves cystine, chenodeoxycholate, and D-Turanose, and their associated glycolysis/gluconeogenesis, pantothenate, and CoA biosynthesis metabolic pathways. Therefore, we have a deep understanding of the metabolic-related intervention of EXD in osteoporotic OA and are eager to better understand the mechanism of multi-targeted intervention of EXD in bone metabolic lesions.
Introduction
Osteoporosis (OP) and osteoarthritis (OA) are the two most common diseases in the chronic degeneration of the musculoskeletal muscle system. The incidence rate is increasing year by year, which seriously endangers the physical and mental health of human beings (1–4). Previous studies have shown that metabolic disorders are the main pathological features of OP, manifested as osteopenia, fracture of trabecular bone, and thinning of cortical bone (5), while the main pathological features of OA are cartilage loss, osteophyte formation, and synovial inflammation in the trochlear joint (6). Therefore, OP has been considered to be inversely associated with OA for a long time, and low bone mass may even have a protective effect on OA at that time.
With the deepening of research, scholars have gradually realized that OP and OA may also occur in the same patient. Chu L et al. show that there are similarities in the pathological changes of subchondral bone in OP and OA patients. More ideas in recent years have suggested that SB loss may negatively affect osteochondral biomechanics, ultimately accelerating OA progression to osteoporotic OA (7). Different from the characteristic subchondral bone sclerosis and hyperplasia of OA, the disorder of subchondral bone metabolism in the early stage of OA is mainly bone resorption, showing decreased bone mass, decreased trabecular bone, and stress microfracture, which is similar to OP (6). At the same time, the above pathological changes tend to take precedence over cartilage degeneration in OA in time, indicating that the metabolic disorder of subchondral bone may be an important reason for the development of OA, and OP may have a driving effect on the progression of OA. Unfortunately, the specific effector targets and mechanism of action in this process are still lacking reports.
The reason why recent studies have focused on the role of metabolic abnormalities in Osteoporotic OA is precisely due to the similarities in the loss of bone homeostasis between OP and OA (8). Studies have shown that under high body mass index, excessive adipokines release and metabolic changes lead to the occurrence of OP and increased fracture risk (9–11). It is well known that a high body mass index not only brings more mechanical load to OA by increasing body weight but also increases the risk of OA by inducing sterile inflammation through adipokines (12). Therefore, the abnormal lipid metabolism accompanying the pathological progress of OP may induce OA at the same time, thereby accelerating the progress of OA. Metabolic differences in accelerated OA progression provide the possibility and a rationale for the treatment of Osteoporotic OA.
From a therapeutic point of view, some drugs for the treatment of OP, such as Pueraria lobata and Rhizoma Drynariae, etc., can also benefit OA in the clinical treatment of OA, that is, cutting off the progress of OP may alleviate OA (13–16). The traditional Chinese medicine decoction ErXian Decoction (EXD) is included in the famous medical book “Wenbing Tiaobian” in the Ming Dynasty (17). It consists of epimedium, curcuma, Morinda officinalis, angelica, phellodendron, and anemarrhena. It was widely used in the treatment of osteoporosis with a definite curative effect (18–21). Interestingly, EXD also achieved satisfactory results in the treatment of OA. Combined with the above, it is reasonable to speculate that the benefit of EXD in the treatment of OP and OA may be aimed at the metabolic disorders shared by the two diseases and may be used for the treatment of Osteoporotic OA. Therefore, in this study, an experimental animal OA model and Osteoporotic OA model were constructed by surgery, and gas chromatography-time of flight mass spectrometry (GC-TOFMS) and liquid chromatography quadrupole ion trap tandem mass spectrometry (LC-QTRAP-MS/MS) techniques were combined to study the metabolomic differences and related mechanisms under the action of OA, Osteoporotic OA and EXD.
Material and Methods
Preparation for EXD
The herbs that make up EXD include 9 g epimedium, 9 g curcuma, 9 g Morinda officinalis, 9 g angelica, 6 g phellodendron, 6 g anemarrhena (all herbs were obtained from Jiangsu Provincial Hospital of Traditional Chinese Medicine) (22), and all herbal materials used in our study were approved by Nanjing University of Traditional Chinese Medicine. It met the quality requirements of the 2015 edition of the Chinese Pharmacopoeia. Four times the mass of water for each sub-medicine were added, mixed and soaked, boiled two times, 30 min each time, and extracted three times.
Experimental Design
Thirty-two 2-month-old Sprague-Dawley (SD) female rats used in the experiment were provided by Nanjing Qinglongshan Animal Farm (ethical number: ACU211204), weighing 180-220 g. Rats were maintained in a specific pathogen-free laminar flow environment at a temperature of 25 ± 2°C, humidity 55%, and a 12-h light/dark regimen. The animal care and use protocol followed the National Institutes of Health Guide for the Care and Use of Laboratory Animals and was approved by the Animal Care and Use Committee of Nanjing University of Chinese Medicine.
The rats were randomly divided into four groups: Normal group (n=8), OA group (n=8), Osteoporotic-osteoarthritis (OP-OA) group (n=8), and EXD group (n=8). The model of OA was obtained by amputating the anterior cruciate ligament of the rat knee joint by ACLT method, and the ACLT model was determined by the anterior drawer test (23). The OP model was obtained by removing both ovaries from rats using bilateral oophorectomy according to the references (24). In the OP-OA group and EXD group, both ACLT method and bilateral oophorectomy were used to establish the model. After 14 days of successful modeling, the EXD group was given EXD by intragastric administration at a dose of 0.5 ml/100 g for 21 consecutive days and other groups were used equal amounts of normal saline. After the last intragastric administration of EXD, blood was collected from the abdominal aorta and cartilage tissue was collected from the rats in each group.
Sample Collection and Preparation
After the last intragastric administration of EXD, the rats were anesthetized by intraperitoneal injection of 3% pentobarbital, and blood was collected from the abdominal aorta. The rats in each group were sacrificed and serum and cartilage tissues were collected. The rat’s knee joint was shaved, and the skin was incised along both sides of the patellar ligament. From the upper edge of the patella, the distal quadriceps muscle was incised laterally to the femur, and the free patella and its surrounding tissues were pulled up and opened to the distal end. Exposing the knee joint, the surrounding tissue and the anterior and posterior cruciate ligaments were cut off. Exposing the tibial plateau, the cartilage was carefully cut to maintain its integrity as much as possible. Cartilage tissues from two rats were randomly selected from each group and stored in 4% paraformaldehyde for pathological sectioning.
Micro-CT Examination
Rats were randomly selected from each group and the hip joint was removed. The intact tissue of the knee joint was preserved and stored in 4% paraformaldehyde for Micro CT examination. Imaging system (model Quantum GX, USA).
Histopathological Analysis
The cartilage tissue was fixed with 4% paraformaldehyde, soaked in EDTA, embedded in paraffin, and sectioned for hematoxylin-eosin (HE) staining.
The tissue sections were gradient dehydrated, and then stained using safranin O-fast green cartilage staining kit according to the instructions.
From the cartilage structure, chondrocyte density, and inflammatory cell infiltration degree, Mankin’s score was used to detect the degree of damage to the knee articular cartilage tissue in each group of rats (25). Scores were 0-1 no cartilage destruction, 2-4 low-grade cartilage destruction, and 5-9 high-grade cartilage destruction. The standard is shown in Table 1.
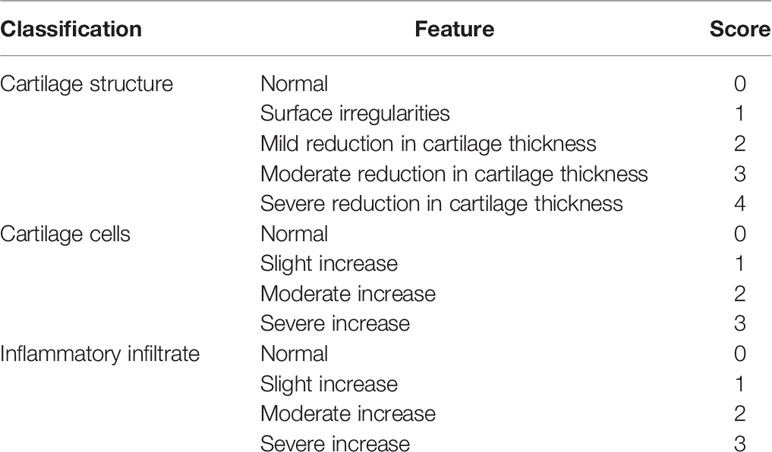
Table 1 Markin’s Score standard (25).
Western Blotting
The cartilage tissue of each group of rats was cut into pieces, poured into liquid nitrogen for 10 min, and then RIPA lysis solution containing 0.1% PMSF was added to mix for 10 min. After standing on ice for 30 min, the supernatant was collected after centrifugation. Protein levels were quantified using a BCA protein detection kit (Beyotime Biotechnology, Shanghai, China). The protein was denatured at 98°C for 7 min. The proteins were separated by electrophoresis, transferred from the gel to PVDF membrane, and blocked with 5% nonfat milk for 2 h. The membrane was incubated with the COL2A1, SOX9, β-actin, COMP overnight at 4°C, and then incubated with the secondary antibody (1:5000 affinity, USA) at room temperature for 2 h, and then the bands were exposed by ECL. Gray value was quantified with β-actin as an internal marker, i.e., target protein gray value/internal reference overall gray value.
Quantitative Real-Time Polymerase Chain Reaction
The RNA of cartilage tissue was extracted with Trizol solution, and the purity and concentration of RNA were determined by spectrophotometer. Reverse transcription was performed using 5 × HiScript II qRT Super Mix according to the kit instructions (vazyme, Nanjing, China). qRT-PCR was performed using a SYBR Premix Ex Taq II according to the manufacturer’s instructions in an ABI PRISM 7300 (Applied Biosystems, USA) instrument. Primers were designed and synthesized by Shanghai Biotechnology Service Company. The primer sequences are as follows:
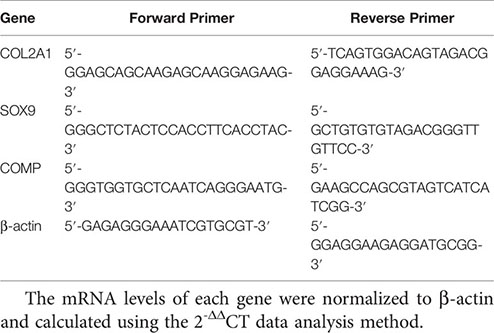
The mRNA levels of each gene were normalized to β-actin and calculated using the 2-ΔΔCT data analysis method.
Processing and Testing of EXD
After thawing on ice, the EXD samples were vortexed for 30 s, centrifuged for 15 min at 4°C, 12000 rpm (centrifugal force 13800 ×g, radius 8.6 cm), 300 μL of supernatant was taken into a 1.5 ml EP tube, add 1000 μL Extraction solution (methanol:water = 4:1, internal standard concentration of 10 μg/mL), vortexed for 30 s, sonicated in ice-water bath for 5 min, after standing at -40°C for 1 h, the sample was placed at 4°C, 12000 rpm (centrifugal force 13800 ×g, radius 8.6 cm), and centrifuged for 15 min, the supernatant was taken out and passed through a 0.22 μm filter membrane, injected into the sample bottle, and tested ion the machine. Then 100 μL of each sample was mixed to form a QC sample.
LC-MS/MS analysis was performed on an UHPLC system (Vanquish, Thermo Fisher Scientific). The flow rate was set at 0.5 mL/min and the sample injection volume was set at 5 μL. The mobile phase consisted of 0.1% formic acid in water (A) and 0.1% formic acid in acetonitrile (B). The multi-step linear elution gradient program was as follows: 0-11 min, 85-25% A, 11-12 min, 25-2% A, 12 -14 min, 2-2% A, 14-14.1 min, 2-85% A, 14.1-16 min, 85%-85% A.
An Orbitrap Exploris 120 mass spectrometer coupled with an Xcalibur software was employed to obtain the MS and MS/MS data based on the IDA acquisition mode. Ion Transfer Tube Temp: 350°C, Vaporizer Temp: 350°C, Sheath gas flow rate: 35 Arb, Aux gas flow rate: 15 Arb, Full ms resolution: 60000, MS/MS resolution: 15000, Collision energy: 16/38/42 in NCE mode, Spray Voltage: 5.5 kV (positive) or-4 kV (negative).
Analysis Conditions of GC/LC-MS Treatment of the Serum Samples of Rats
After the sample serum was thawed at 4°C, 50 μL of the sample was accurately weighed into a 2 mL EP tube, and 1 mL of a mixed solution of isopropanol: acetonitrile: water (3:3:2, v/v/v) was added and sonicated at room temperature for 5 min. Then centrifuge at 14,000 rpm for 2 min, 500 μL of the supernatant taken and added to a new 2 mL EP tube (remaining backup), and the supernatant placed in a vacuum concentrator to concentrate to dryness. GC-MS analysis: added 80 μL of 20 mg/mL methoxyamine solution to the evaporated sample, vortexed for 30 s, and incubated at 60°C for 60 min, then added 100 μL of BSTFA reagent, and incubated at 70°C for 90 min, centrifuge at 14,000 rpm for 3 min, 90-100 μL of the supernatant taken and added to the liner in the GCMS detection bottle, and then 20 μL taken from each sample to be tested and mixed into a QC sample. LC-MS analysis: added 200 μL of acetonitrile:methanol (1:1) to the thoroughly evaporated sample, vortexed for 30 s, centrifuged at 14,000 rpm for 3 min, 90-100 μL of the supernatant added to the LCMS detection bottle Then 20 μL of each sample to be tested taken and mixed into a QC sample.
GC-MS conditions: Agilent 7890 gas chromatography time of flight mass spectrometer is used for detection. The specific analysis conditions of GC-TOF-MS are as follows: Column: DB-5MS(30m×250μm×0.25μm), Sample Volume: 1μL, Column Flow:1mL min−1, Front Injection Temperature: 280°C, Transfer Line Temperature: 320°C, Ion Source Temperature: 230°C, Electron Energy: 70eV, Mass Range:m/z: 75-650, Acquisition Rate: 10 spectra per second. Ms-dial software was used to analyze the mass spectrometry data, such as peak extraction, peak integration, peak alignment, baseline correction, and deconvolution (17). Fiehnbinbase database (18) was used for substance qualitative work, including retention time index matching and mass spectrometry matching. Finally, the peaks were removed with the detection rate ≤ 50% in QC samples or the detection rate < 50% or RSD > 30% in each group except the QC group (19).
LC-MS conditions: Chromatographic conditions: The samples were separated using a 7890b high-performance liquid chromatograph (Agilent, USA) and equipped with a CSH C18 column (1.7 μm,2.1 × 100mm). Injection volume: 2μL, Flow rate: 0.30 L/min, Mobile phase A: water (containing 0.1% FA), Mobile phase B: acetonitrile, the gradient elution procedure is shown as follows:
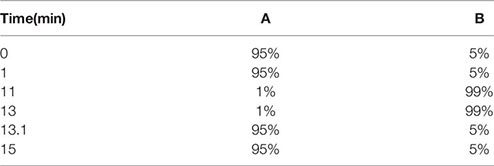
The column temperature was 65°C, and the injection volume was 2 μL in both positive and negative ion mode. Mass spectrum conditions: Pegasus BT gas chromatography time of flight mass spectrometer (LECO, USA) was used to detect samples. The instrument parameters are as follows: Scanning mode: SMRM IDA EPI, Curtain Gas (CUR): 35psi, Collision Gas (CAD): Medium, Temperature (TEM): 550°C, Ion Source Gas 1 (GS1): 60psi, Ion Source Gas 2 (GS2): 60psi, Ion Spray Voltage (IS): 5500V (Positive ion mode)/-4500V (Negative ion mode).
Statistical Analysis
Mass spectral data were analyzed by peak extraction, peak integration, and peak alignment using ABOX software. P<0.05 indicates statistical significance. The raw data were converted to Abf format using Abf Converter software (http://www.reifycs.com/AbfConverter/), and positive and negative ion mode data were imported into MS-DIAL software for data preprocessing, filtering, alignment, and peak identification. Identified metabolites, retention times (Rt), mass-to-charge ratios (m/z), and peak information was obtained for all samples. The data exported from MS-DIAL was normalized by the SERRF algorithm through the R language. The fold change (FC) was compared with the median peak height of each group using the R language. FC>2.0 was considered to indicate a significant difference. Principal component analysis and cluster analysis were performed on the data using Metaboanalyst (http://www.metaboanalyst.ca/). Analysis was performed using GraphPad Prism software 8.0 (Solvusoft Corporation, USA). Statistical analysis was performed using SPSS 20.0 software (SPSS Inc., Chicago, IL, USA). Data are presented as mean ± standard deviation. Group comparisons were assessed with one-way ANOVA. A value of P<0.05 was considered statistically significant. Quantitative data were expressed as mean plus or minus standard deviation, and normal distribution was tested by Student’s t-test.
Result
EXD Can Relieve Cartilage Destruction of Osteoporotic Osteoarthritis and Promote Cartilage Repair
In order to explore the intervention effect of EXD on Osteoporotic OA, safranin O-fast green and HE staining were performed on cartilage tissue of rats in each group, and Mankin’s score was calculated. Micro-CT was used to identify osteoporosis in each group of rats, and gene and protein expressions were analyzed by PCR and WB. Figure 1A shows that the Mankin’s score of the OA group and the OP-OA group were significantly higher than those of the normal group, the score of the OP-OA group was higher than the OA group, and the score of the EXD group was significantly lower. Figure 1B shows that the OP-OA group had more severe osteoporosis than the OA group and the normal group. Compared with OA group, the trabecular bone was sparse and low in signal density in the proximal tibia region of the OP-OA group, and this change was improved after EXD intervention. Figure 1C shows that compared with the normal group, the OP-OA group and OA group have more inflammatory cell infiltration in HE-stained sections, and OP-OA group has more inflammatory cell infiltration than OA group, and inflammatory cells after EXD intervention infiltration was relieved. At the same time, under the Saffron fast green staining section, it was found that compared with the normal group, the cartilage damage of the OP-OA group and OA group was obvious, and the cartilage damage of the OP-OA group was more serious, which was alleviated after EXD intervention. Figures 1D, E show that the degree of cartilage degeneration was increased in the OP-OA group compared with the OA group due to decreased protein expression of COL2A1, SOX9, and COMP. Cartilage degeneration was improved under EXD intervention due to elevated COL2A1, SOX9, COMP protein expression. Figure 1F shows that the degree of cartilage degeneration was increased in the OP-OA group compared with the OA group due to decreased gene expression of COL2A1, SOX9, and COMP. Cartilage degeneration was improved under EXD intervention due to elevated COL2A1, SOX9, and COMP gene expression.
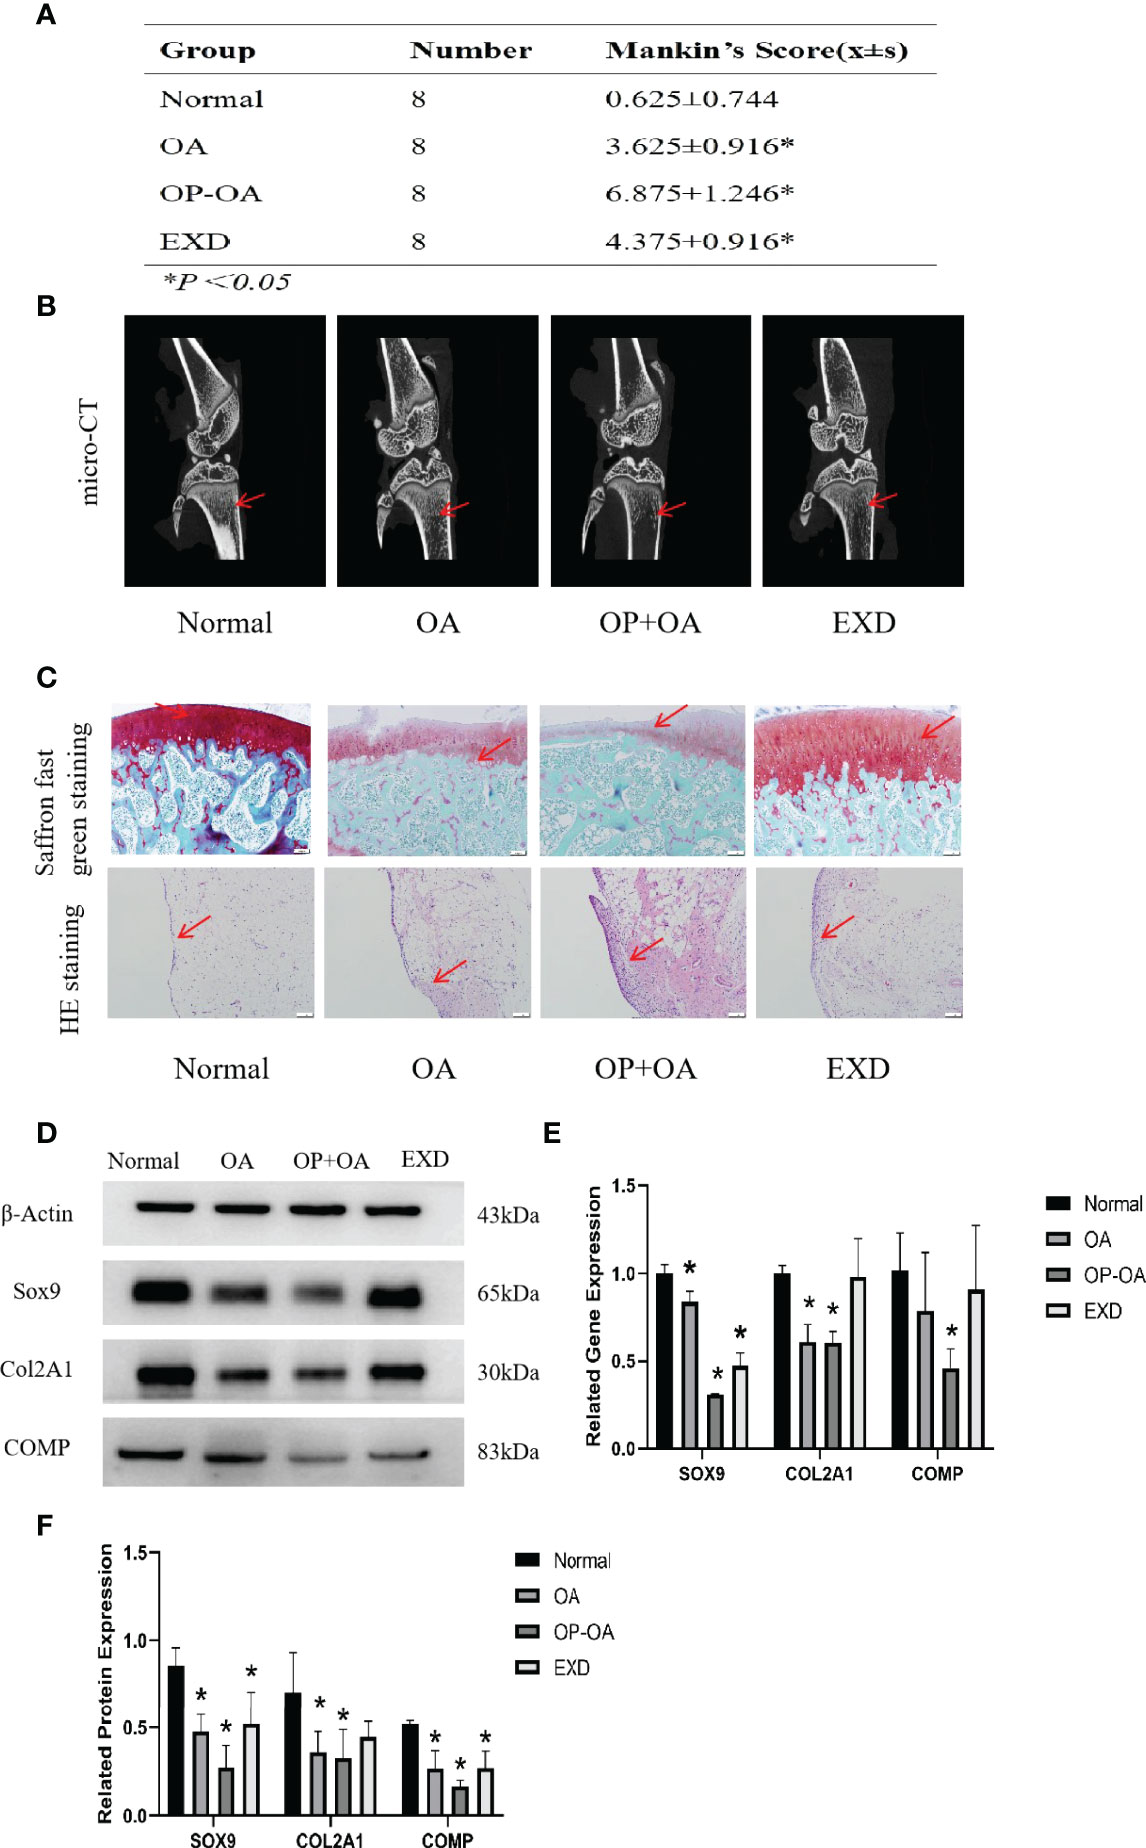
Figure 1 EXD can relieve cartilage destruction of Osteoporotic OA and promote cartilage repair. (A) The Mankin’s score of the normal group and EXD group were significantly lower than those of the OA group and OP-OA group. The score of OP-OA group was higher than that of OA group, and the inflammatory infiltration and cartilage damage were obvious. (B) Micro-CT verification of osteoporotic trabecular bone in each group of rats. Compared with normal and OA, the trabecular bone in the proximal tibia of OP-OA was sparse and showed low signal density, while the trabecular bone in the proximal tibia after EXD intervention was dense and showed high signal density. The red-pointing area indicates the increase or decrease of trabecular bone. (C) Cartilage histomorphology of each group stained with safranin O-fast green and H&E,100x scale bar=100 μm. Red-pointing areas indicate cartilage changes and cellular infiltration. (D, E) Western blot analysis of the effects of EXD on SOX9, COL2A1, and COMP in rat cartilage tissue. (F) Relative protein and gene expression of SOX9, COL2A1, and COMP in each group of cartilage tissue. *P<0.05.
EXD Active Substance Analysis
The main components of the compounds in the EXD soup were preliminarily identified using UHPLC-QE-MS omics detection. Figures 2A, B depict the base peak chromatogram of EXD extract. The chemical components identified in the EXD water extract (Tables 2, 3) describe 12 compounds in negative ion mode and 25 compounds in positive ion mode obtained by analysis (Table 3 is the positive and Table 2 is negative ion modes). We identified compounds such as Gentiopicroside, emodin, Quercetin, etc.
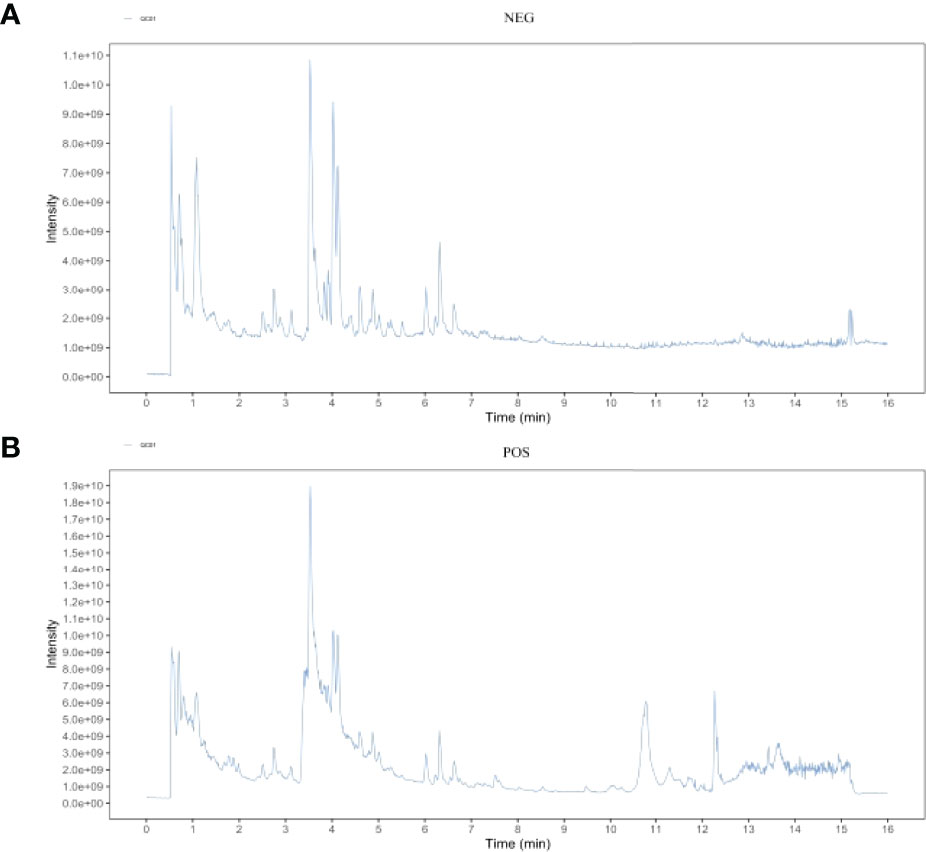
Figure 2 Total ion chromatogram of the methanol extract acquired by UHPLC-QE-MS in the positive (A) and negative (B) ion modes.
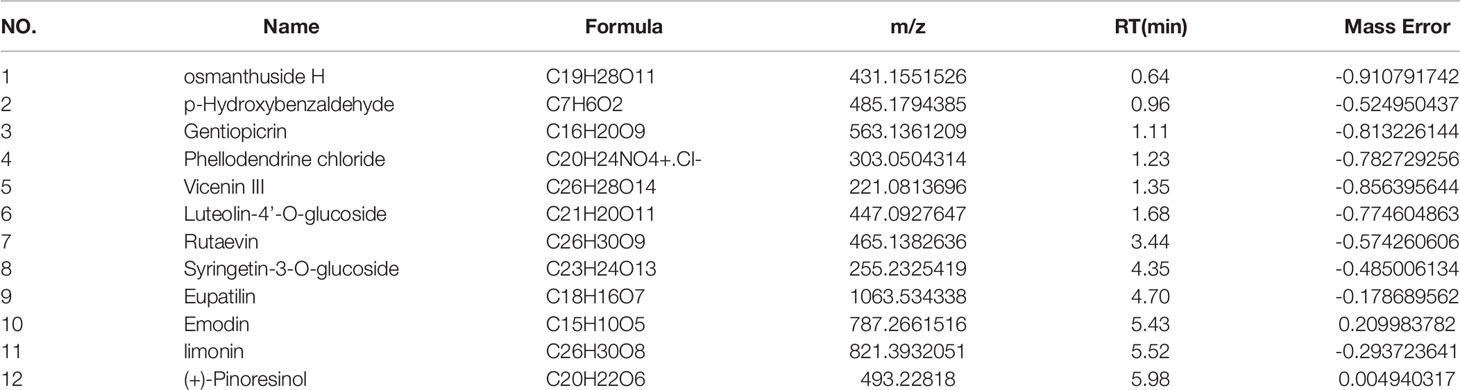
Table 2 NEG.
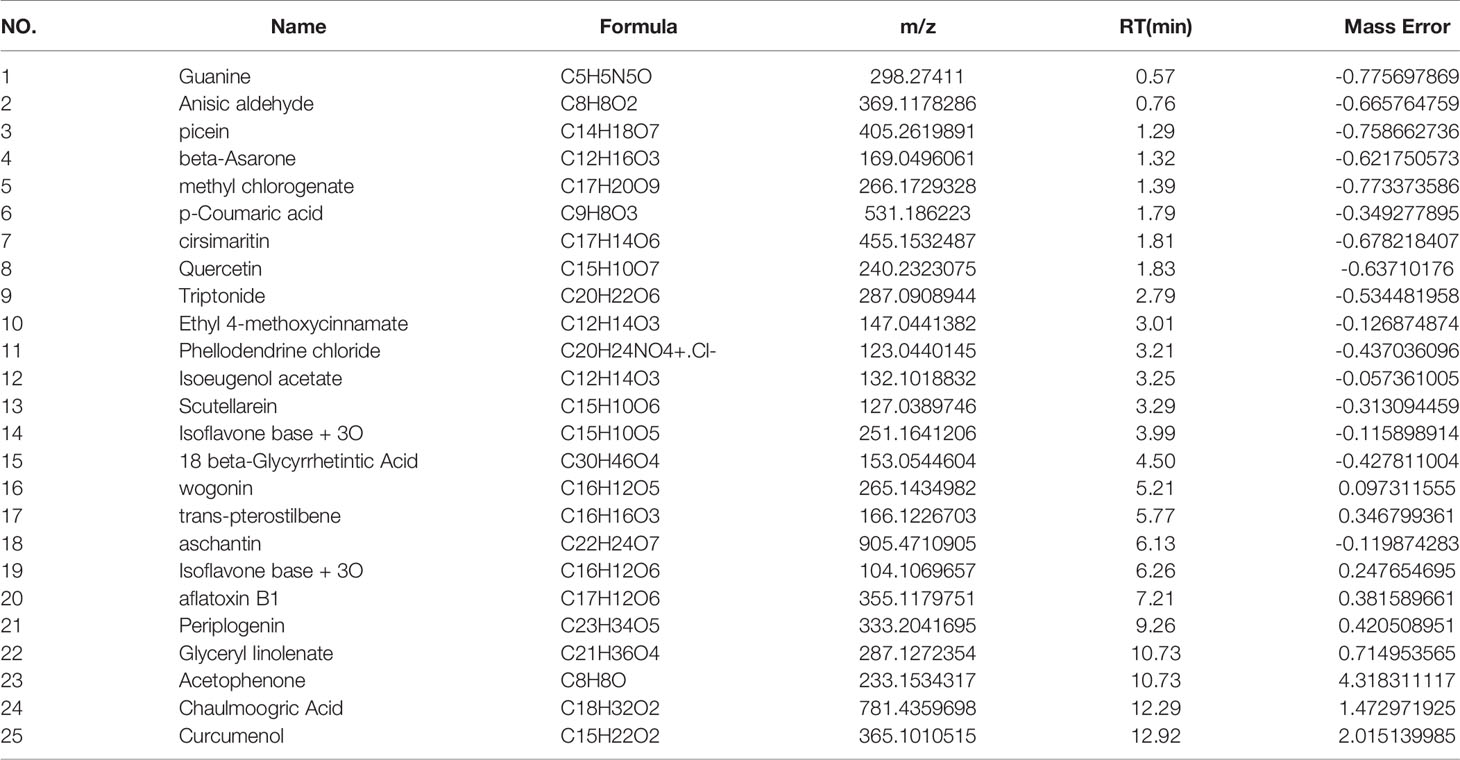
Table 3 POS.
Metabolomics Reveals Relevant Differential Metabolites Between OA & OP-OA
Principal component analysis was performed on serum metabolites in the normal group, OA group, and OP-OA group. The results are shown in Figure 3A. Each point in the graph represents a sample, and all sample points are distributed within a circular area (95% confidence interval). The metabolites between the normal group and the OA group were significantly different, and the metabolites in the OP-OA group and the OA group were separated and kept away from the normal group, suggesting that the OP environment further disturbed the levels of metabolites in the rat and aggravated the progression of OA.
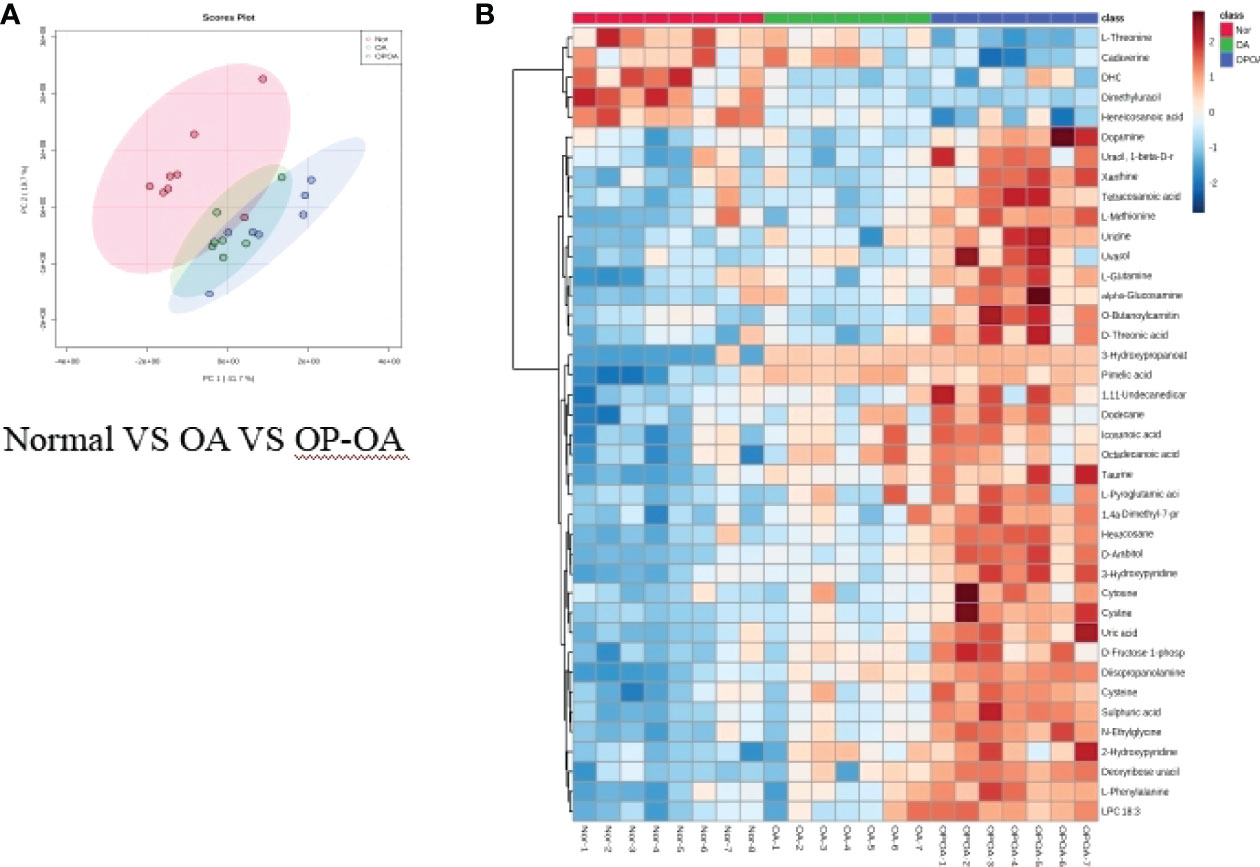
Figure 3 Metabolomics reveals relevant differential metabolites between normal, OA, & OP-OA. (A) PCA chart of the normal group, OA group, and OP-OA group. (B) Comparison heat map of differential metabolites in the normal group, OA group, and OP-OA group.
Compared with the normal group, 10 differential metabolites were obtained in the OA group compared with the normal group with a Fold change >2.0, one showed an upward trend and nine showed a downward trend (Table 4). Under the same standard, the OP-OA group obtained 15 differential metabolites compared with the OA group, four showed an upward trend, and 11 showed a downward trend (Table 5). The data for these differential metabolites were analyzed to obtain the heatmap shown in Figure 3B. Each square in the figure represents the mean value of the corresponding intensity of the metabolites in each group of samples, with red representing an increase in intensity and blue representing a decrease in intensity. The changes of some metabolites in the OP-OA group and the OA group were obvious, and there was a significant difference with the normal group (P<0.05). Therefore, it is speculated that the OP environment affects the levels of these metabolites such as Cystine, Chenodeoxycholate, D-mannitol, (S)-oleuropein, etc. and related metabolic pathways, leading to the further development of OA.
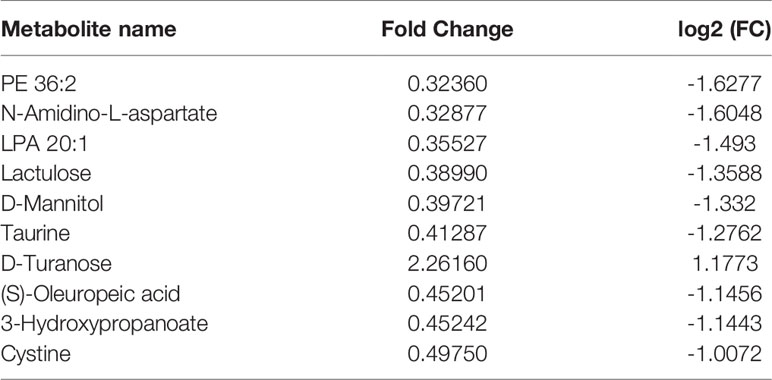
Table 4 Differential metabolites.
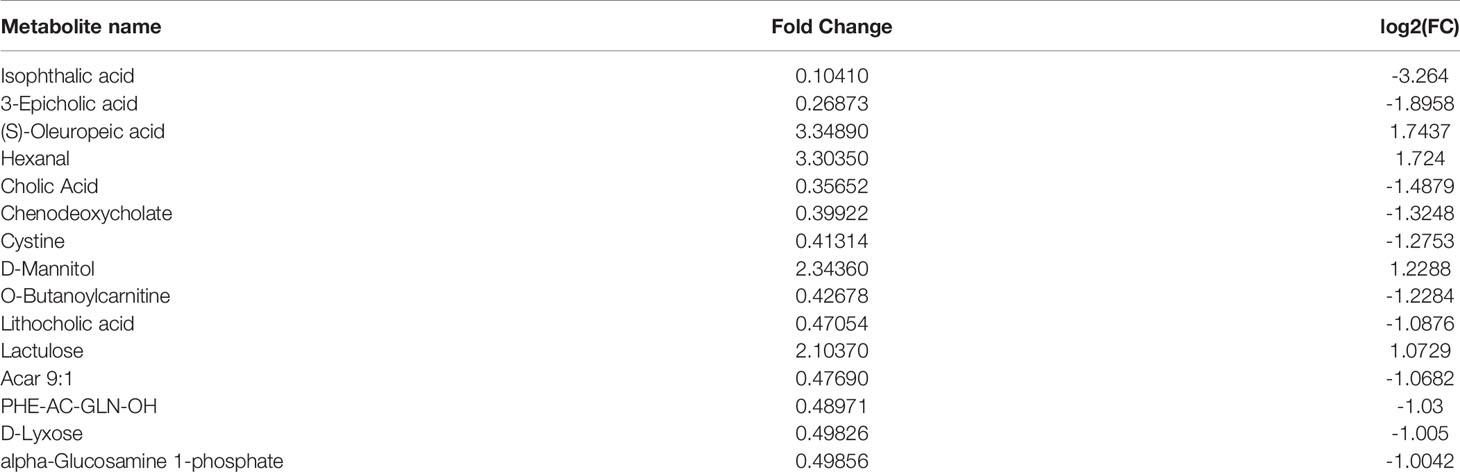
Table 5 Differential metabolites.
Metabolomics reveals correlated differential metabolic pathways between normal, OA, and OP-OA
Figure 4 shows these differential metabolites were further altered in the OP-OA group were imported into Metaboanalyst (http://www.Metabo-analyst.ca/) for metabolic pathway enrichment analysis, and 17 related metabolites were obtained by P<0.05 analysis pathways (Table 6): Sulfur metabolism, purine metabolism, pyrimidine metabolism, beta-Alanine metabolism, phenylalanine metabolism, tyrosine and tryptophan biosynthesis, retinol metabolism, vitamin B6 metabolism, pentose phosphate pathway, steroid hormone biosynthesis, steroid biosynthesis, pantothenate and CoA biosynthesis, D-glutamine and D-glutamate metabolism, taurine and hypotaurine metabolism, arginine biosynthesis, cysteine and methionine metabolism, and glutathione. The comparison results show that under the intervention of OP, the most significant effect was sulfur metabolism.
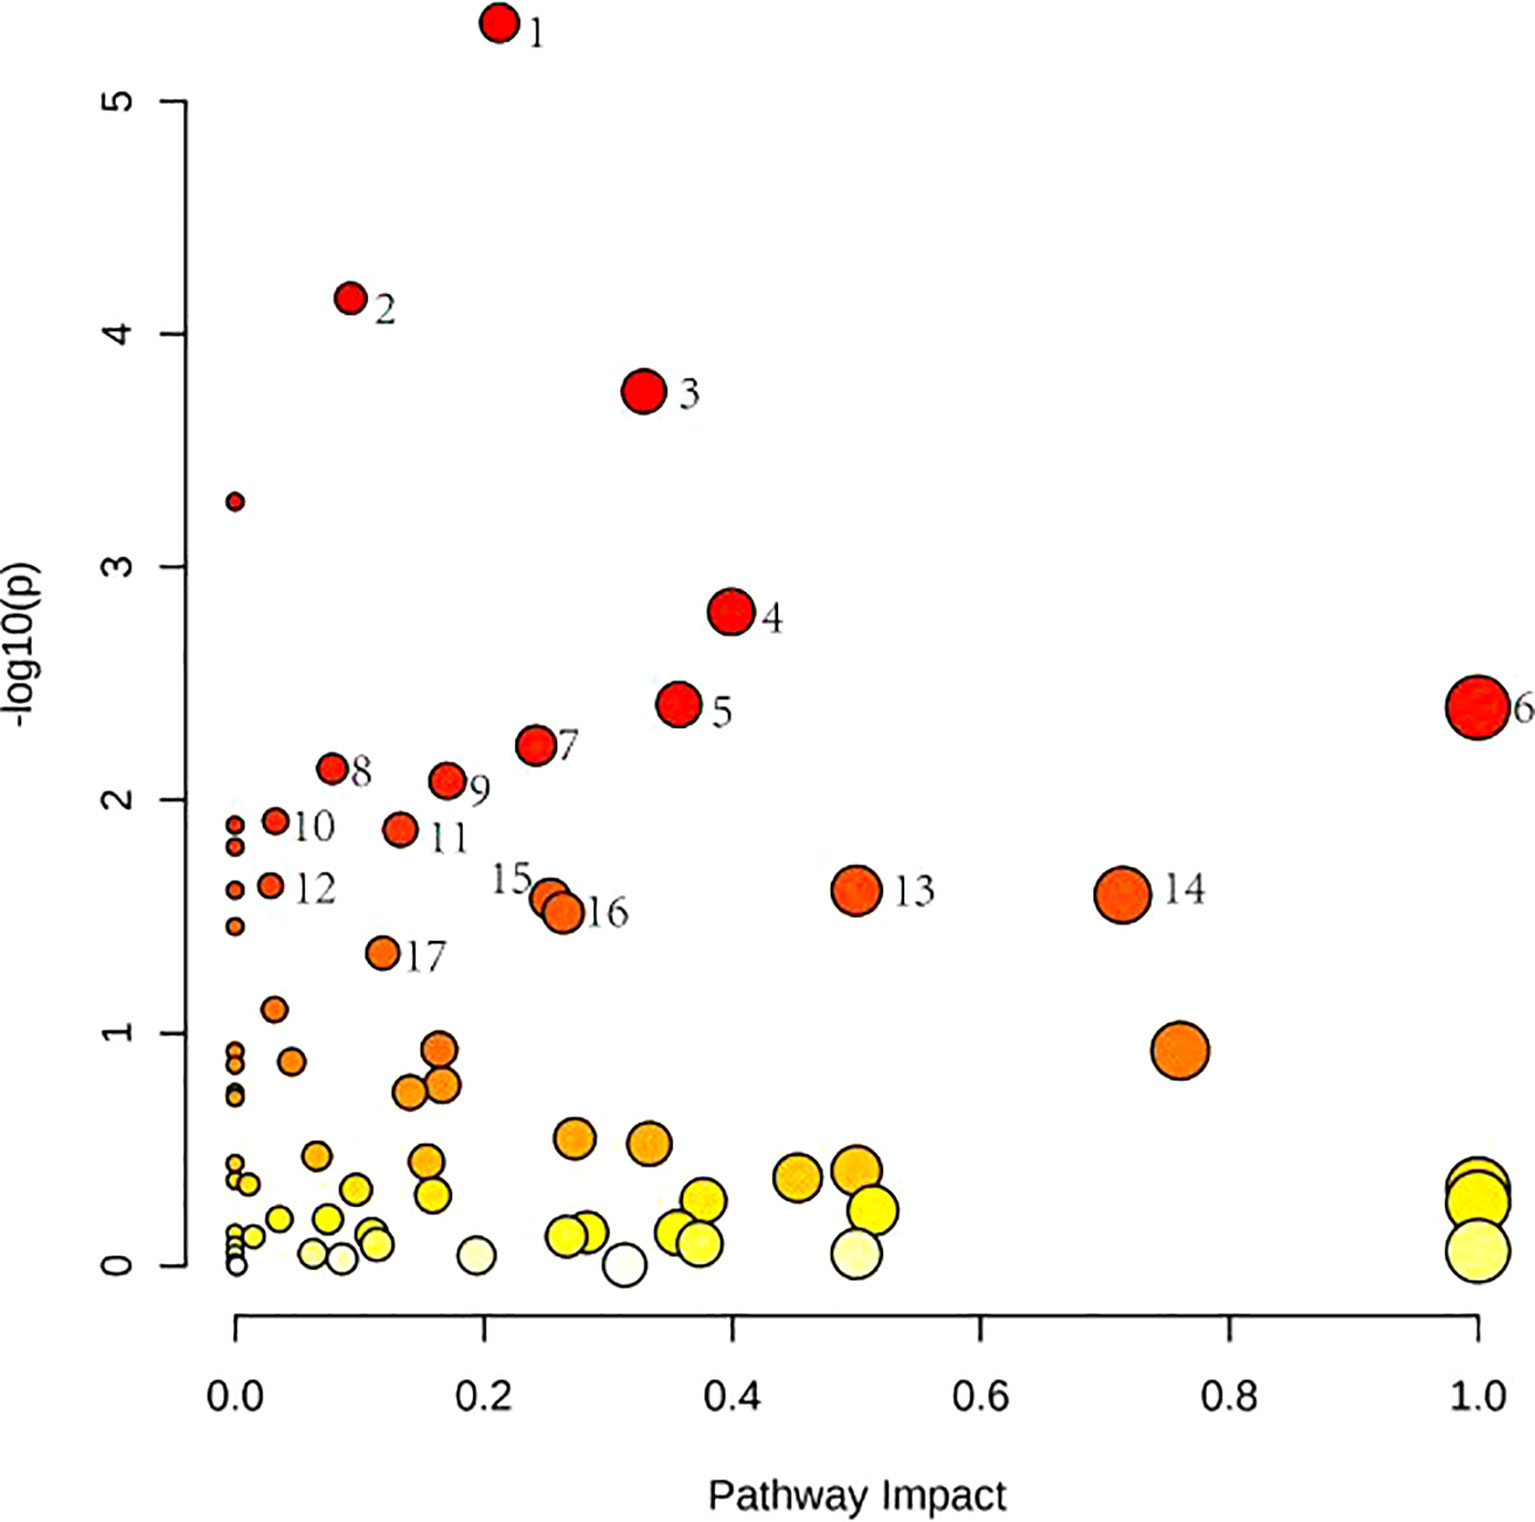
Figure 4 Metabolomics reveals correlated differential metabolic pathways between normal, OA, and OP-OA. Metaboanalyst (http://www.Metabo-analyst.ca/) carried out metabolic pathway enrichment analysis, with P<0.05; 17 related metabolic pathways were analyzed.
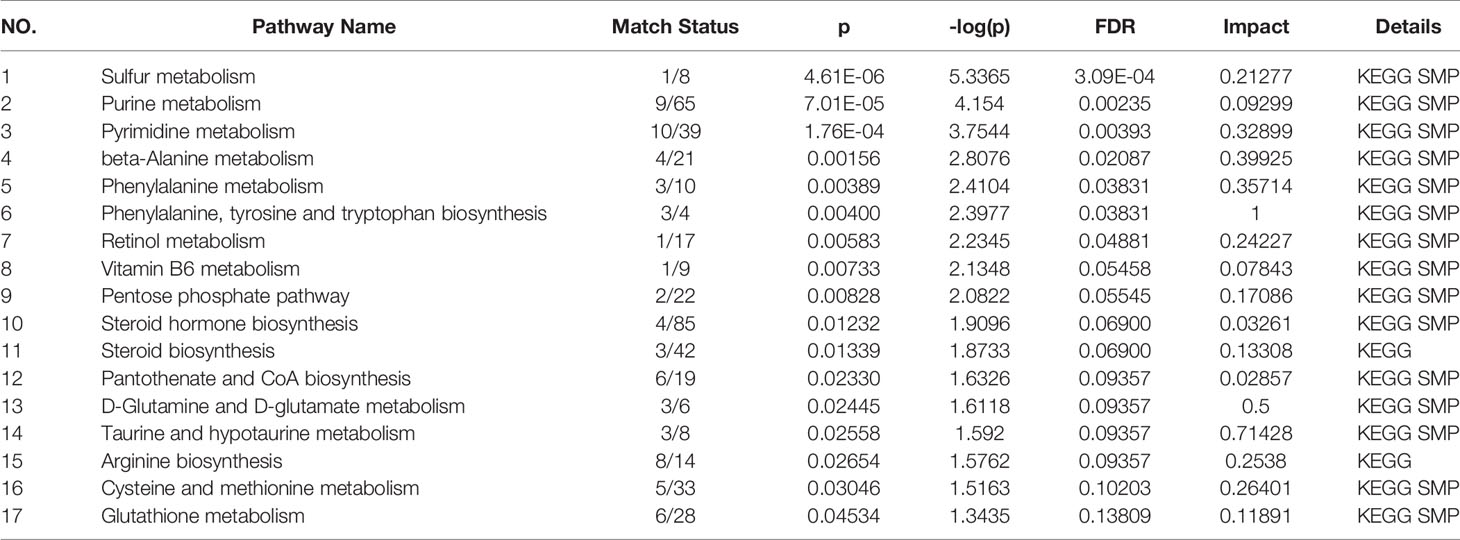
Table 6 Pathway.
Metabolomics Reveal Relevant Differential Metabolites Between Normal, OP-OA, and EXD
Principal component analysis was performed on the metabolites of the normal group, OP-OA group, and EXD group, and the results are shown in Figure 5A. Each point in the figure represents a sample, and all sample points are distributed in a circular area (i.e., 95% confidence interval). The metabolites in the OP-OA group and the normal group were separated, suggesting that the OP environment further disturbed the levels of metabolites in rats, thereby further aggravating the destruction of OA cartilage, but it was visible after EXD intervention. The EXD group was significantly different from the OP-OA group, and migrated to the normal group, suggesting that EXD could regulate the metabolites in rats to normal levels, thereby reducing cartilage damage. The metabolites obtained in the normal group and the OP-OA group were processed and analyzed respectively, and 27 differential metabolites were obtained with a fold change >2.0 as the standard, of which four showed an upward trend and 23 showed a downward trend (Table 7). Fourteen differential metabolites were observed between the OP-OA group and the EXD group, and nine showed an upward trend and five showed a downward trend (Table 8). The normalized data of the differential metabolites in the OP-OA group and the EXD group were subjected to univariate analysis, and a heat map was made as shown in Figure 5B. The concentrations of some metabolites in the EXD group have significant changes compared with the OP-OA group, and there was a significant difference compared with the normal group (P<0.05). Therefore, it is speculated that EXD may play a role in promoting OP-OA cartilage repair by affecting the levels of isophthalic acid, D-Turanose, (S)-Oleuropeic acid, and chenodeoxycholate metabolites and related metabolic pathways.
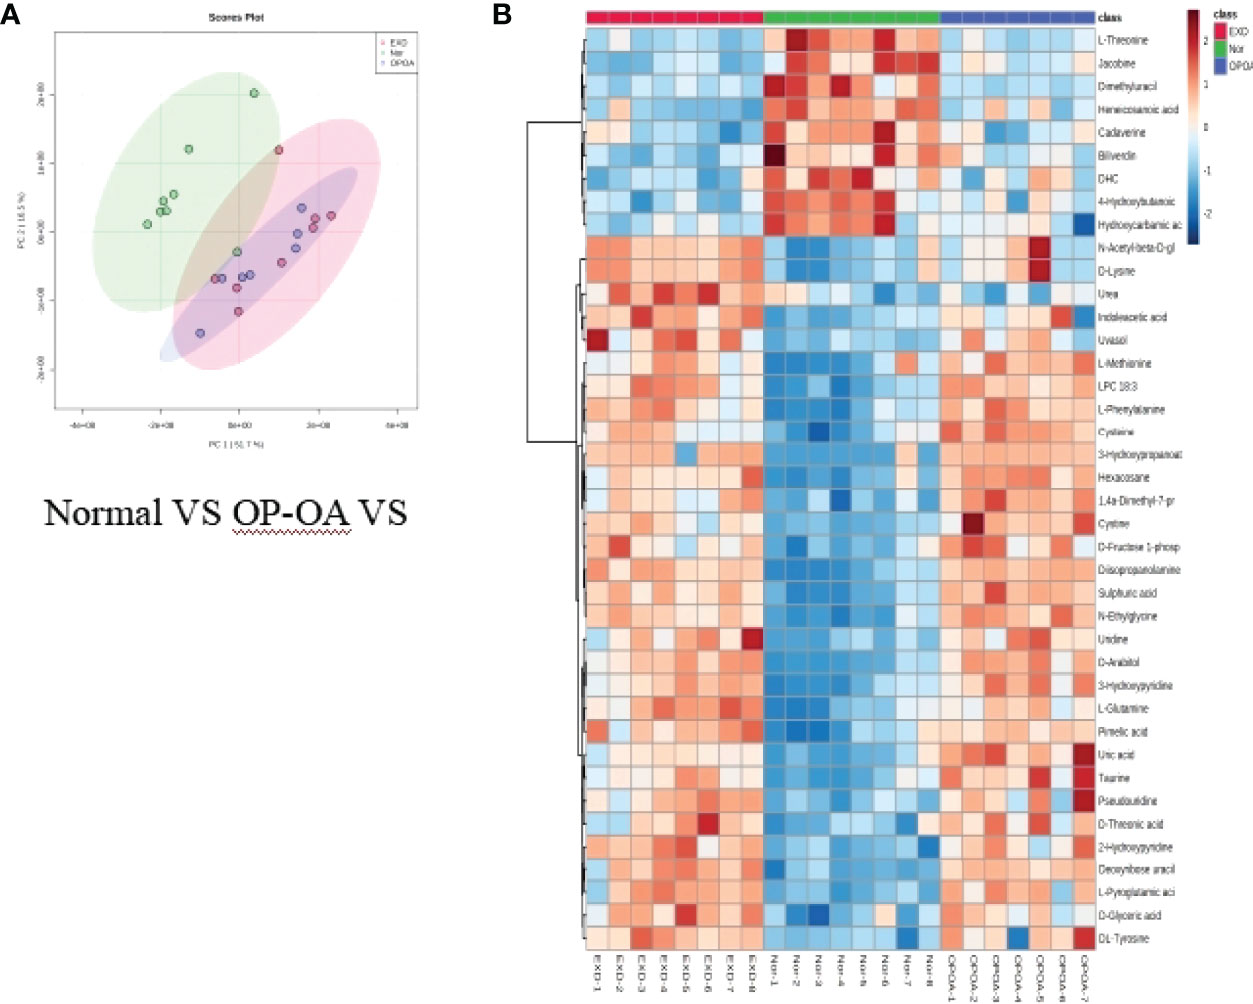
Figure 5 Metabolomics reveals relevant differential metabolites between normal, OP-OA, and EXD. (A) PCA chart of the normal group, OP-OA group, and EXD group. (B) Comparison heat map of differential metabolites in the normal group, OP-OA group, and EXD group.
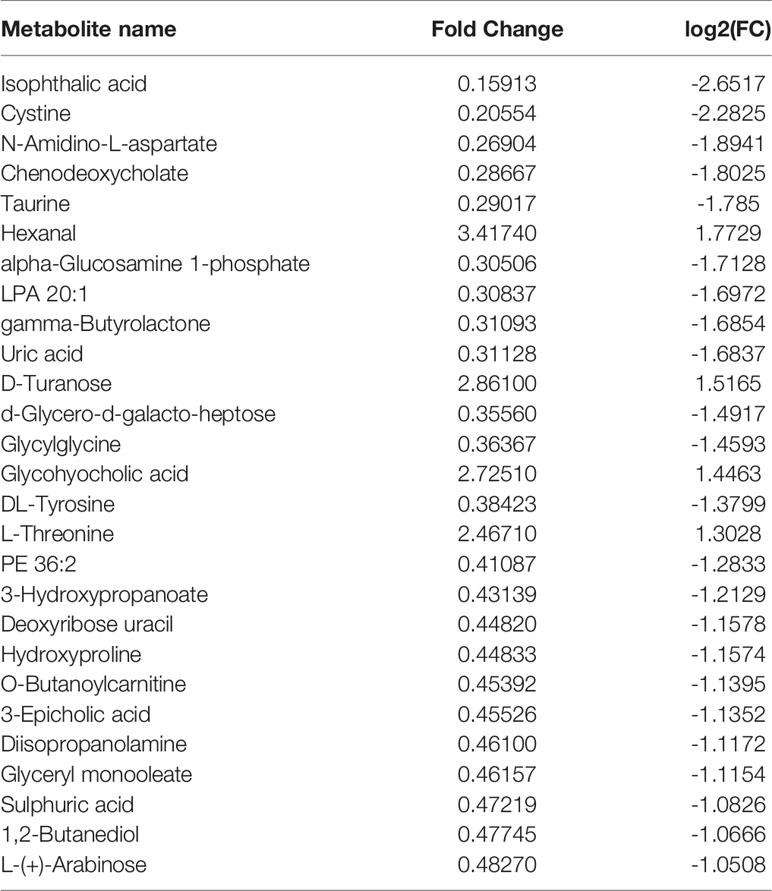
Table 7 Differential metabolites.
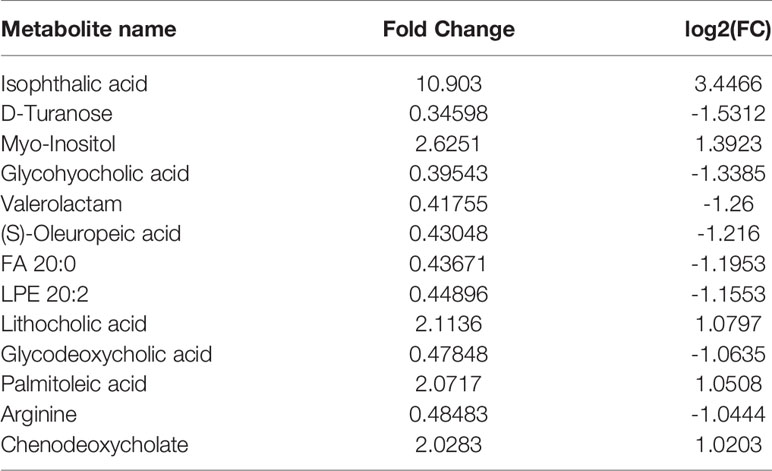
Table 8 Differential metabolites.
Metabolomics Reveal Correlated Differential Metabolic Pathways Between Normal, OP-OA, and EXD
Relevant differential metabolites were imported into Metaboanalyst (http://www.Metabo-analyst.ca/) for metabolic pathway enrichment analysis, and a total of 10 metabolic pathways were analyzed with P<0.05 (Table 9): Purine metabolism, phosphatidylinositol signaling system, glycolysis/gluconeogenesis, pyruvate metabolism, arginine biosynthesis, retinol metabolism, pyrimidine, pentose phosphate pathway, butanoate metabolism, pantothenate, and CoA biosynthesis (Figure 6). The comparison results showed that under the intervention of EXD, the most significant effect was purine metabolism.
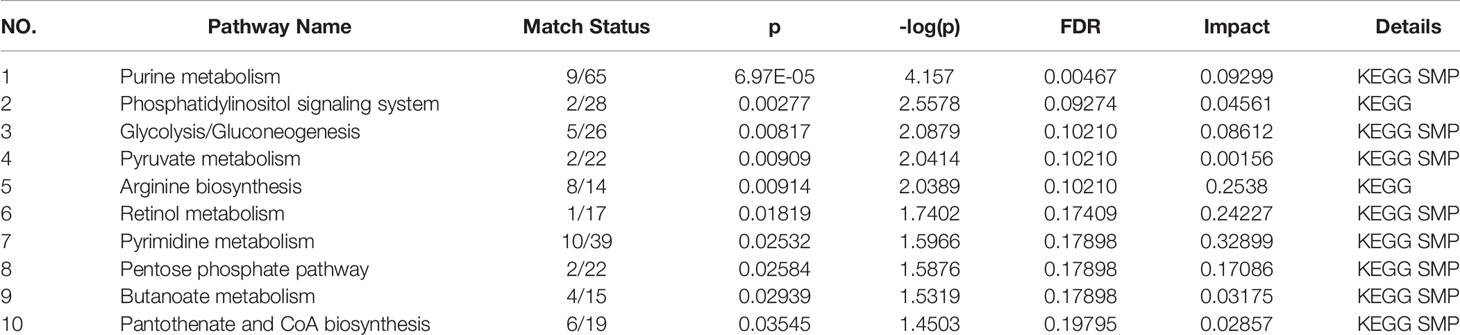
Table 9 Pathway.
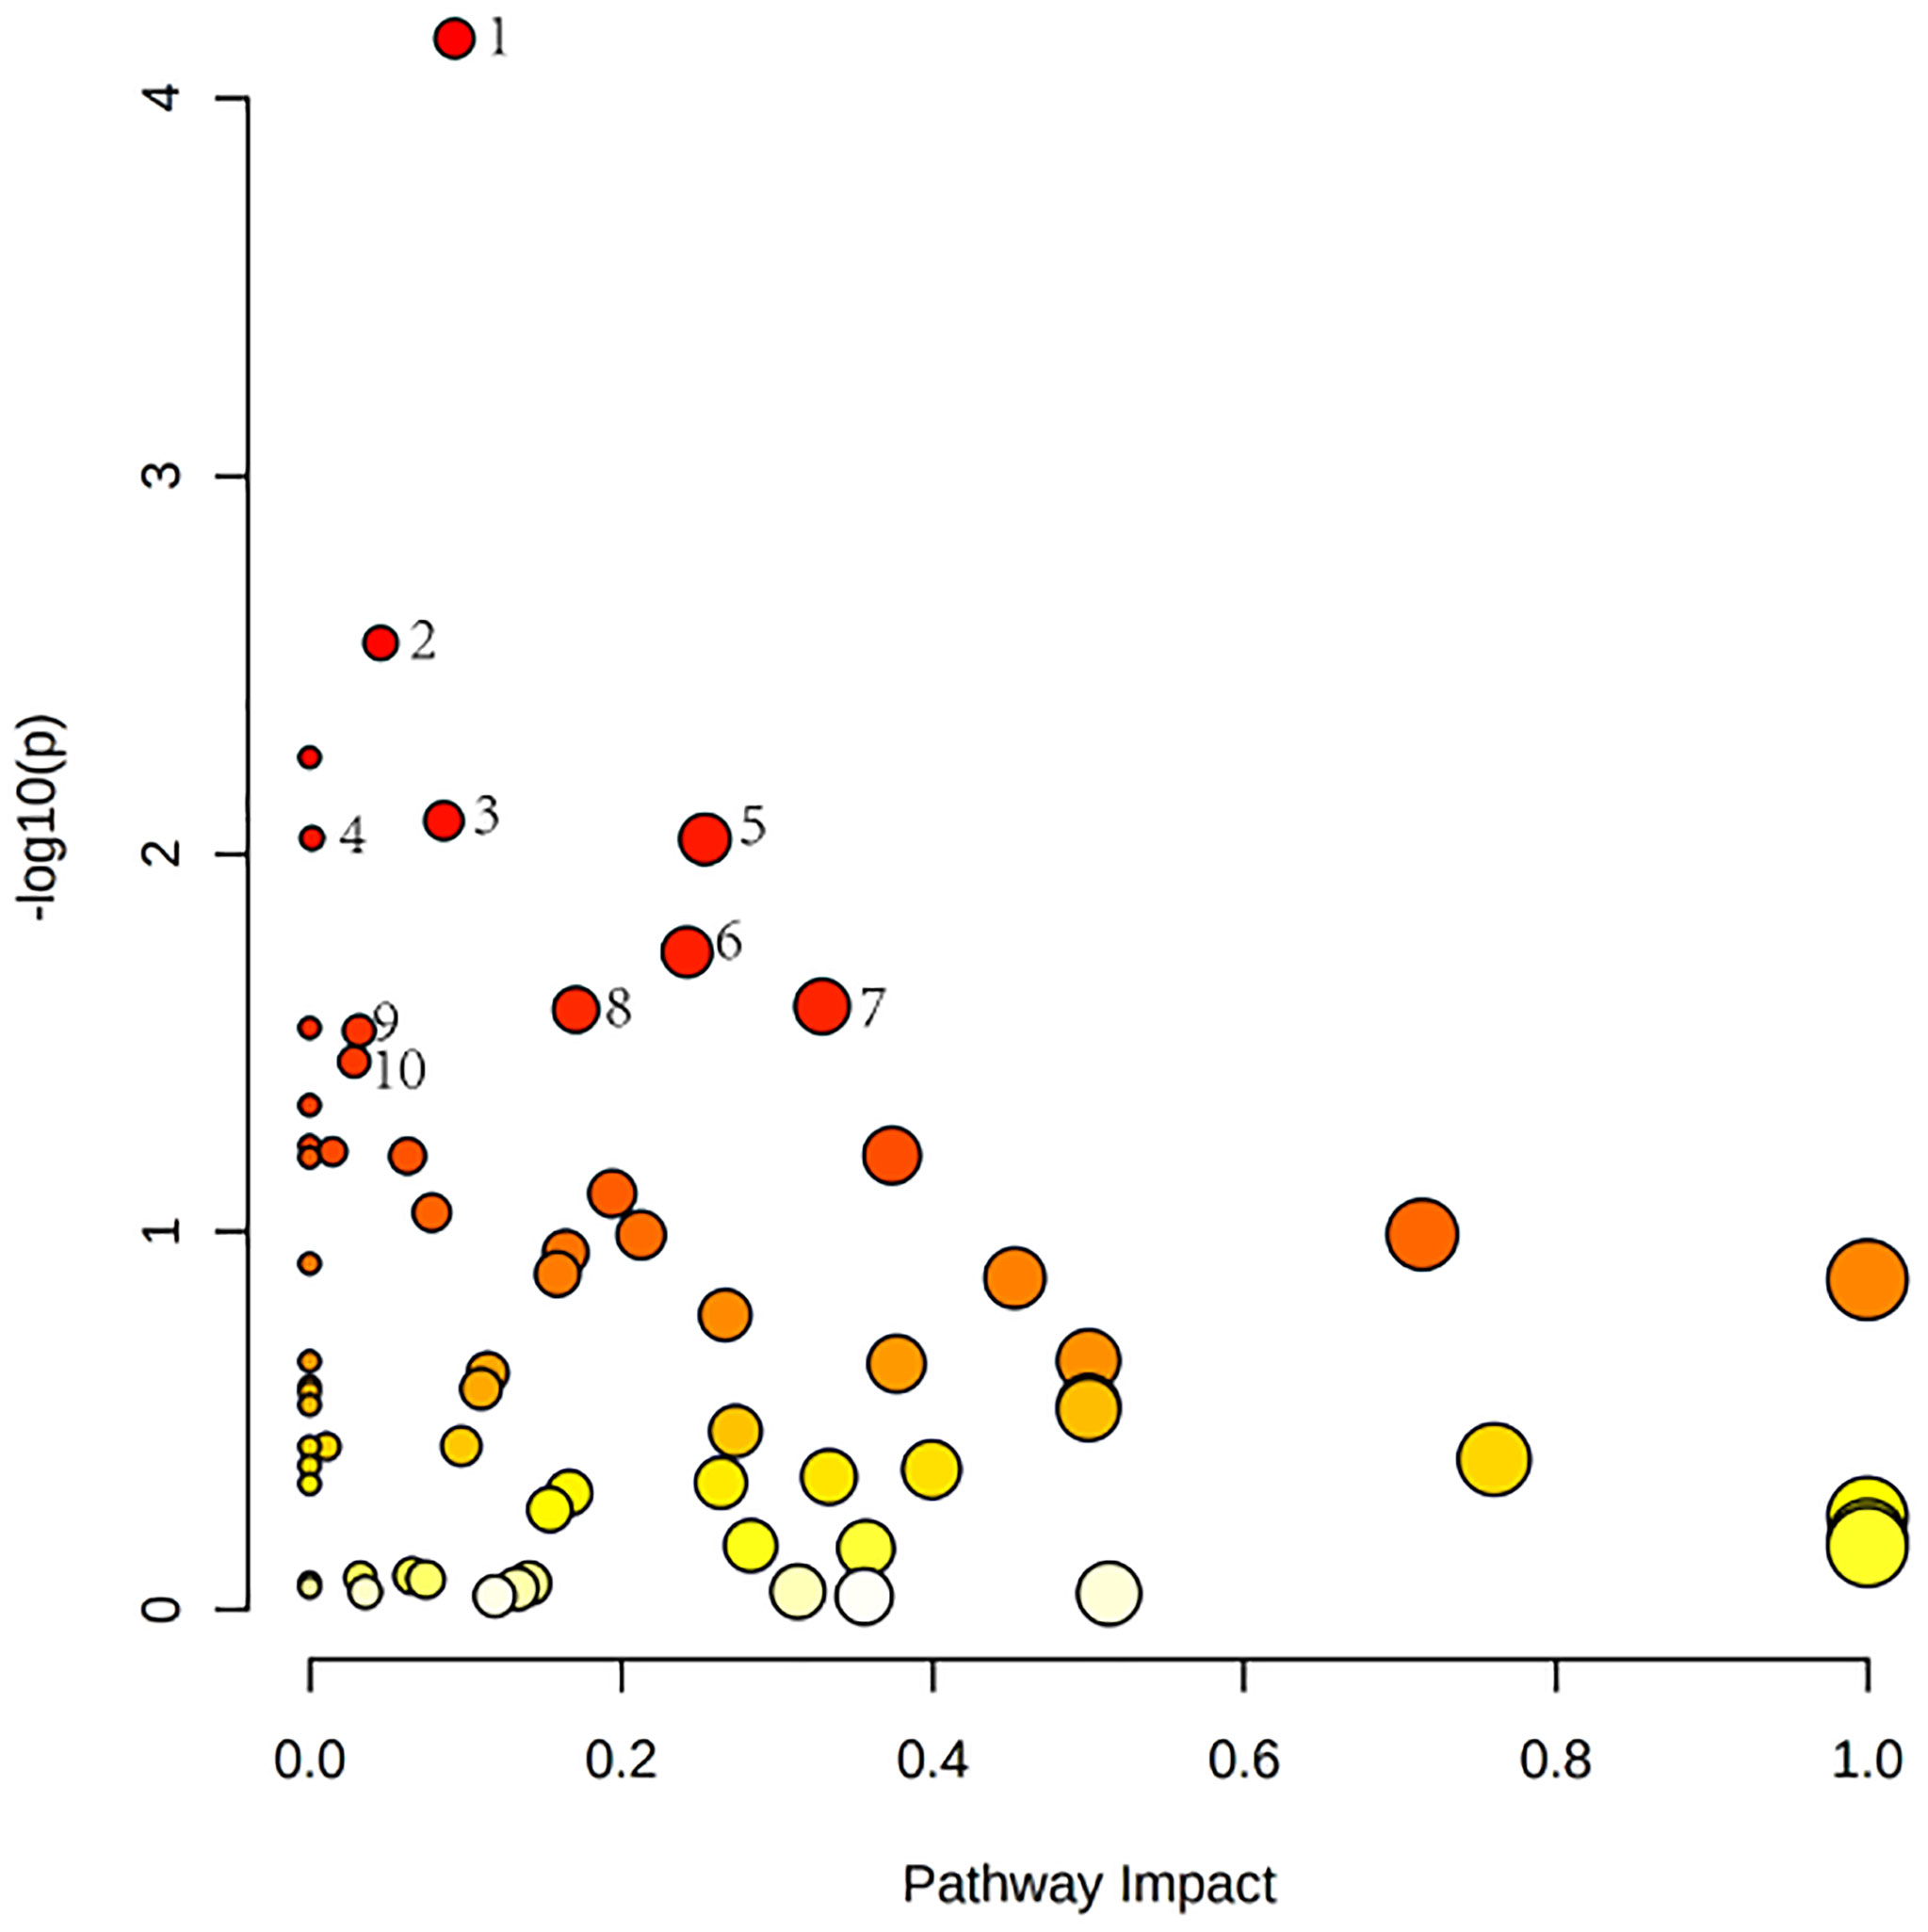
Figure 6 Metabolomics reveals correlated differential metabolic pathways between normal, OP-OA, and EXD. (A) Metaboanalyst (http://www.Metabo-analyst.ca/) carried out metabolic pathway enrichment analysis, with P<0.05, 10 related metabolic pathways were analyzed.
Discussion
In this study, we used GC-TOFMS and LC-QTRAP-MS/MS techniques to study the metabolomic differences between OA and Osteoporotic OA, as well as the target and efficacy mechanism of EXD in Osteoporotic OA. Our study shows that the OP environment has a promoting effect on the pathological progression of OA, mainly manifested as the elevated gene and protein expressions of cartilage-related markers SOX9, COL2A1, and COMP and the aggravation of osteoporosis under the influence of bone metabolism, while EXD has a negative effect on Osteoporotic OA and has a significant intervention effect, which is mainly reflected in reducing the gene and protein expressions of cartilage-related markers SOX9, COL2A1, and COMP, thereby protecting cartilage, relieving osteoporosis, and improving bone and joint structure and environment (26–28).The intervention of chenodeoxycholate, D-Turanose, cystine and other metabolites may regulate and purine metabolism, phosphatidylinositol signaling system, glycolysis/gluconeogenesis, pyruvate metabolism, arginine biosynthesis, visual flavonol metabolism, pyrimidine metabolism, pentose phosphate pathway, butyrate metabolism, pantothenate, and CoA biosynthesis pathways are related.
EXD has a regulatory effect on the above metabolites. In order to further clarify the medicinal substances of EXD, we studied the composition of EXD. The middle peak is higher, which may be the main pharmacodynamic substance of EXD in the treatment of Osteoporotic OA. Combined with literature analysis, the findings are consistent with our research. Gentiopicroside, as one of the active ingredients of gentiana grandis, showed effective protection against IL-1β-induced inflammatory response of rat articular chondrocytes and alleviated the progression of OA (29). At the same time, studies have also shown that gentiopicroside can improve OP by regulating the β-catenin-bone morphogenetic protein 2 signaling pathway to promote the osteogenic differentiation of bone mesenchymal stem cells (30). Hydroxy anthraquinone compounds in a variety of herbal medicines have anti-inflammatory, antibacterial, antiviral, antitumor, antitussive, antihypertensive, and other pharmacological effects, and have broad research prospects. Hu et al. showed that emodin can protect rat knee cartilage through the anti-matrix degradation pathway, thereby alleviating the further development of OA (31). Kim JY et al. showed that emodin can also promote bone remodeling by regulating abnormal bone metabolism. Quercetin alleviates rat OA by inhibiting chondrocyte inflammation and apoptosis, regulating synovial macrophage polarization into M2 type macrophages, and can also regulate autophagy and apoptosis improvement in rat osteocytes and bone metabolism, thereby alleviating OP symptoms caused by oophorectomy (32). In addition, diosmetin, wogonin, and other monomers have also been confirmed in existing studies to play an anti-inflammatory and cartilage protective role in OA and OP by regulating related signaling pathways, inhibiting osteoclast differentiation, and activating intrachondral signaling pathways (33–36). It can be regarded as the active pharmaceutical ingredient of EXD.
Both GC-TOFMS and LC-QTRAP-MS/MS are techniques widely used for metabolite component analysis and related pathway identification with good agreement. These techniques have good potential for rapid analysis of non-targeted metabolite profiles and have great advantages in the study of metabolites and related pathways intervened by traditional Chinese medicine compounds. Hossam M Abdallah et al. used GC-TOFMS and LC-QTRAP-MS/MS to study the anti-osteoporosis and bone protection effects of ovariectomized rats under the intervention of Lepidium sativum extract (37). A Batushansky et al. used the GC-TOFMS method to study OA, showing the characteristics of articular cartilage metabolism and the plasticity of chondrocyte metabolism, providing a basis for further research on the role of cartilage metabolism in OA (38). In our study, the differential metabolites of normal compared with OA were found mainly by metabolomic identification: PE 36:2, N-Amidino-L-aspartate, LPA 20:1, Lactulose, D-Mannitol, taurine, D-Turanose, (S)-Oleuropeic acid, 3-Hydroxypropanoate, cystine, and the differential metabolites between the normal group and the OP-OA group are isophthalic acid, cystine, chenodeoxycholate, taurine, hexanal, LPA 20:1, uric acid, D-Turanose, glycylglycine, glycohyocholic acid and other 27. By comparison, it was found that D-Turanose, cystine, and chenodeoxycholate may be the key factors for OP to accelerate the progression of OA.
From our study, we found that the metabolites D-Turanose, cystine, and chenodeoxycholate were most significantly different in the OP-OA group and the OA group. D-Turanose is a carbohydrate metabolite, and the study by Yan Chao Cui et al. showed that the growth of osteoclasts depends on glycolysis as the main energy-producing pathway involved in the regulation of bone metabolism and has a role in cartilage and bone repair, thereby delaying OP progression (39). Cystine, as an oxidized dimer compound of cysteine, is a frequently occurring form of cysteine in organic tissues and is important to the progression of OA. Wei-Yuan Tsaiet et al. showed that glutathione is synthesized in chondrocytes to induce cartilage destruction through the cystine/glutamate anti-transport system, and inhibition of this system delays further cartilage destruction (40). Chenodeoxycholate is the main active component of animal bile. Zhao et al. demonstrated that chenodeoxycholate can effectively alleviate cartilage degeneration on the surface of femoral condyle in rabbit OA model, reduce articular cartilage damage, joint erosion, and the expression of related factors, thereby reducing pathological changes in articular cartilage and synovium, delaying the progression of OA (41). The above metabolites and related pathways were found to be consistent with our research predictions through literature search.
To sum up, this study found that there are many metabolic differences between Osteoporotic OA and OA. Among them, cystine and chenodeoxycholate may be the key to OP aggravating the key damage of OA. EXD has good effects on Osteoporotic OA. Emodin, quercetin, and gentiopicroside may be its main active substances. In addition, the intervention effect of EXD on Osteoporotic OA may be related to the metabolic differences of D-Turanose and chenodeoxycholate, involving metabolic pathways such as glycolysis/gluconeogenesis, pantothenate, and CoA biosynthesis. Our study elucidates the metabolic factors that promote the progression of OA for OP and provides evidence for the target and efficacy mechanism of EXD in the treatment of Osteoporotic OA.
Data Availability Statement
The data reported in this paper have been deposited in the OMIX, China National Center for Bioinformation / Beijing Institute of Genomics, Chinese Academy of Sciences (https://ngdc.cncb.ac.cn/omix: accession no. OMIX001328).
Ethics Statement
The animal study was reviewed and approved by the Ethics Committee of the Affiliated Hospital of Nanjing University of Chinese Medicine.
Author Contributions
ZM, YW, and PW participated in the design of the study and wrote the manuscript. LZ, XS, and RX analyzed the data. XL, TL, NY, and LJ performed the experiments. All authors read and approved the final manuscript.
Funding
This work was supported by the Peak Academic Talent Project of Jiangsu Province Hospital of Chinese Medicine (y2021rc02, y2021rc20) and the General Project of Natural Fund of Nanjing University of Traditional Chinese Medicine (k2021x05).
Conflict of Interest
The authors declare that the research was conducted in the absence of any commercial or financial relationships that could be construed as a potential conflict of interest.
Publisher’s Note
All claims expressed in this article are solely those of the authors and do not necessarily represent those of their affiliated organizations, or those of the publisher, the editors and the reviewers. Any product that may be evaluated in this article, or claim that may be made by its manufacturer, is not guaranteed or endorsed by the publisher.
References
1. Chen P, Li Z, Hu Y. Prevalence of Osteoporosis in China: A Meta-Analysis and Systematic Review. BMC Public Health (2016) 16(1):1039. doi: 10.1186/s12889-016-3712-7
2. Li D, Li S, Chen Q, Xie X. The Prevalence of Symptomatic Knee Osteoarthritis in Relation to Age, Sex, Area, Region, and Body Mass Index in China: A Systematic Review and Meta-Analysis. Front Med (Lausanne) (2020) 7:304. doi: 10.3389/fmed.2020.00304
3. Palermo A, Tuccinardi D, Defeudis G, Watanabe M, D'Onofrio L, Lauria Pantano A, et al. BMI and BMD: The Potential Interplay Between Obesity and Bone Fragility. Int J Environ Res Public Health (2016) 13(6):544. doi: 10.3390/ijerph13060544
4. Zheng H, Chen C. Body Mass Index and Risk of Knee Osteoarthritis: Systematic Review and Meta-Analysis of Prospective Studies. BMJ Open (2015) 5(12):e007568. doi: 10.1136/bmjopen-2014-007568
5. Lane JM, Russell L, Khan SN. Osteoporosis. Clin Orthop Relat Res (2000) 372):139–50. doi: 10.1097/00003086-200003000-00016
6. Hunter DJ, Bierma-Zeinstra S. Osteoarthritis. Lancet (2019) 393(10182):1745–59. doi: 10.1016/S0140-6736(19)30417-9
7. Herrero-Beaumont G, Roman-Blas JA, Mediero A, Sánchez-Pernaute O, Largo R. Treating Osteoporotic Osteoarthritis, or the Art of Cutting a Balding Man's Hair. Osteoarthritis Cartilage (2020) 28(3):239–41. doi: 10.1016/j.joca.2019.10.015
8. Dragojevič J, Zupan J, Haring G, Herman S, Komadina R, Marc J. Triglyceride Metabolism in Bone Tissue is Associated With Osteoblast and Osteoclast Differentiation: A Gene Expression Study. J Bone Miner Metab (2013) 31(5):512–9. doi: 10.1007/s00774-013-0445-x
9. Tsiklauri L, Werner J, Kampschulte M, Frommer KW, Berninger L, Irrgang M, et al. Visfatin Alters the Cytokine and Matrix-Degrading Enzyme Profile During Osteogenic and Adipogenic MSC Differentiation. Osteoarthritis Cartilage (2018) 26(9):1225–35. doi: 10.1016/j.joca.2018.06.001
10. Roomi AB, Nori W, Al-Badry SH. The Value of Serum Adiponectin in Osteoporotic Women: Does Weight Have an Effect? J Obes (2021) 2021:5325813. doi: 10.1155/2021/5325813
11. Aleidi SM, Alnehmi EA, Alshaker M, Masood A, Benabdelkamel H, Al-Ansari MM, et al. A Distinctive Human Metabolomics Alteration Associated With Osteopenic and Osteoporotic Patients. Metabolites (2021) 11(9):628. doi: 10.3390/metabo11090628
12. Deveza LA, Melo L, Yamato TP, Mills K, Ravi V, Hunter DJ. Knee Osteoarthritis Phenotypes and Their Relevance for Outcomes: A Systematic Review. Osteoarthritis Cartilage (2017) 25(12):1926–41. doi: 10.1016/j.joca.2017.08.009
13. Luo Y, Zheng S, Ding Y, Dai Y, Zhou Y, Xiang R, et al. Preventive Effects of Kudzu Root on Bone Loss and Cartilage Degradation in Ovariectomized Rats [Corrected]. Am J Transl Res (2017) 9(7):3517–27.
14. Li N, Jiang Y, Wooley PH, Xu Z, Yang SY. Naringin Promotes Osteoblast Differentiation and Effectively Reverses Ovariectomy-Associated Osteoporosis. J Orthop Sci (2013) 18(3):478–85 doi: 10.1007/s00776-013-0362-9
15. Liu M, Li Y, Yang ST. Effects of Naringin on the Proliferation and Osteogenic Differentiation of Human Amniotic Fluid-Derived Stem Cells. J Tissue Eng Regener Med (2017) 11(1):276–84. doi: 10.1002/term.1911
16. Guo D, Wang J, Wang X, Luo H, Zhang H, Cao D, et al. Double Directional Adjusting Estrogenic Effect of Naringin From Rhizoma Drynariae (Gusuibu). J Ethnopharmacol (2011) 138(2):451–7. doi: 10.1016/j.jep.2011.09.034
17. Xue L, Wang Y, Liu L, Zhao L, Han T, Zhang Q, et al. A HNMR-Based Metabonomics Study of Postmenopausal Osteoporosis and Intervention Effects of Er-Xian Decoction in Ovariectomized Rats. Int J Mol Sci (2011) 12(11):7635–51. doi: 10.3390/ijms12117635
18. Yang L, Fan L, Wang K, Chen Y, Liang L, Qin X, et al. Analysis of Molecular Mechanism of Erxian Decoction in Treating Osteoporosis Based on Formula Optimization Model. Oxid Med Cell Longev (2021) 2021:6641838. doi: 10.1155/2021/6641838
19. Liu Y, Liu Q, Yin C, Li Y, Wu J, Chen Q, et al. Uncovering Hidden Mechanisms of Different Prescriptions Treatment for Osteoporosis via Novel Bioinformatics Model and Experiment Validation. Front Cell Dev Biol (2022) 10:831894. doi: 10.3389/fcell.2022.831894
20. Nian H, Qin LP, Zhang QY, Zheng HC, Yu Y, Huang BK. Antiosteoporotic Activity of Er-Xian Decoction, a Traditional Chinese Herbal Formula, in Ovariectomized Rats. J Ethnopharmacol (2006) 108(1):96–102. doi: 10.1016/j.jep.2006.04.020
21. Li JY, Jia YS, Chai LM, Mu XH, Ma S, Xu L, et al. Effects of Chinese Herbal Formula Erxian Decoction for Treating Osteoporosis: A Systematic Review. Clin Interv Aging (2017) 12:45–53. doi: 10.2147/CIA.S117597
22. Liu S, Sun Y, Li J, Dong J, Bian Q. Preparation of Herbal Medicine: Er-Xian Decoction and Er-Xian-Containing Serum for In Vivo and In Vitro Experiments. J Vis Exp (2017) 123):55654. doi: 10.3791/55654
23. Xing R, Wang P, Zhao L, Xu B, Zhang N, Li X. Mechanism of TRPA1 and TRPV4 Participating in Mechanical Hyperalgesia of Rat Experimental Knee Osteoarthritis. Arch Rheumatol (2017) 32(2):96–104. doi: 10.5606/ArchRheumatol.2017.6061
24. Zhang F, Xie J, Wang G, Zhang G, Yang H. Anti-Osteoporosis Activity of Sanguinarine in Preosteoblast MC3T3-E1 Cells and an Ovariectomized Rat Model. J Cell Physiol (2018) 233(6):4626–33. doi: 10.1002/jcp.26187
25. Mankin HJ, Johnson ME, Lippiello L. Biochemical and Metabolic Abnormalities in Articular Cartilage From Osteoarthritic Human Hips. III. Distribution and Metabolism of Amino Sugar-Containing Macromolecules. J Bone Joint Surg Am (1981) 63(1):131–9.
26. Song H, Park KH. Regulation and Function of SOX9 During Cartilage Development and Regeneration. Semin Cancer Biol (2020) 67(Pt 1):12–23. doi: 10.1016/j.semcancer.2020.04.008
27. Wehland M, Steinwerth P, Aleshcheva G, Sahana J, Hemmersbach R, Lützenberg R, et al. Tissue Engineering of Cartilage Using a Random Positioning Machine. Int J Mol Sci (2020) 21(24):9596. doi: 10.3390/ijms21249596
28. Maly K, Andres Sastre E, Farrell E, Meurer A, Zaucke F. COMP and TSP-4: Functional Roles in Articular Cartilage and Relevance in Osteoarthritis. Int J Mol Sci (2021) 22(5):2242. doi: 10.3390/ijms22052242
29. Zhao L, Ye J, Wu GT, Peng XJ, Xia PF, Ren Y. Gentiopicroside Prevents Interleukin-1 Beta Induced Inflammation Response in Rat Articular Chondrocyte. J Ethnopharmacol (2015) 172:100–7. doi: 10.1016/j.jep.2015.06.031
30. Jiang H, Zhong J, Li W, Dong J, Xian CJ, Shen YK, et al. Gentiopicroside Promotes the Osteogenesis of Bone Mesenchymal Stem Cells by Modulation of β-Catenin-BMP2 Signalling Pathway. J Cell Mol Med (2021) 25(23):10825–36. doi: 10.1111/jcmm.16410
31. Hu H, Song X, Li Y, Ma T, Bai H, Zhao M, et al. Emodin Protects Knee Joint Cartilage in Rats Through Anti-Matrix Degradation Pathway: An In Vitro and In Vivo Study. Life Sci (2021) 269:119001. doi: 10.1016/j.lfs.2020.119001
32. Hu Y, Gui Z, Zhou Y, Xia L, Lin K, Xu Y. Quercetin Alleviates Rat Osteoarthritis by Inhibiting Inflammation and Apoptosis of Chondrocytes, Modulating Synovial Macrophages Polarization to M2 Macrophages. Free Radic Biol Med (2019) 145:146–60. doi: 10.1016/j.freeradbiomed.2019.09.024
33. Hsu YL, Kuo PL. Diosmetin Induces Human Osteoblastic Differentiation Through the Protein Kinase C/p38 and Extracellular Signal-Regulated Kinase 1/2 Pathway. J Bone Miner Res (2008) 23(6):949–60. doi: 10.1359/jbmr.080219
34. Chen Y, Wang Y, Liu M, Zhou B, Yang G. Diosmetin Exhibits Anti-Proliferative and Anti-Inflammatory Effects on TNF-α-Stimulated Human Rheumatoid Arthritis Fibroblast-Like Synoviocytes Through Regulating the Akt and NF-κb Signaling Pathways. Phytother Res (2020) 34(6):1310–9. doi: 10.1002/ptr.6596
35. Khan NM, Haseeb A, Ansari MY, Devarapalli P, Haynie S, Haqqi TM. Wogonin, a Plant Derived Small Molecule, Exerts Potent Anti-Inflammatory and Chondroprotective Effects Through the Activation of ROS/ERK/Nrf2 Signaling Pathways in Human Osteoarthritis Chondrocytes. Free Radic Biol Med (2017) 106:288–301. doi: 10.1016/j.freeradbiomed.2017.02.041
36. Geng X, Yang L, Zhang C, Qin H, Liang Q. Wogonin Inhibits Osteoclast Differentiation by Inhibiting NFATc1 Translocation Into the Nucleus. Exp Ther Med (2015) 10(3):1066–70. doi: 10.3892/etm.2015.2615
37. Abdallah HM, Farag MA, Algandaby MM, Nasrullah MZ, Abdel-Naim AB, Eid BG, et al. Osteoprotective Activity and Metabolite Fingerprint via UPLC/MS and GC/MS of Lepidium Sativum in Ovariectomized Rats. Nutrients (2020) 12(7):2075. doi: 10.3390/nu12072075
38. Batushansky A, Lopes EBP, Zhu S, Humphries KM, Griffin TM. GC-MS Method for Metabolic Profiling of Mouse Femoral Head Articular Cartilage Reveals Distinct Effects of Tissue Culture and Development. Osteoarthritis Cartilage (2019) 27(9):1361–71. doi: 10.1016/j.joca.2019.05.010
39. Cui YC, Qiu YS, Wu Q, Bu G, Peli A, Teh SW, et al. Metabolic Utilization of Human Osteoblast Cell Line hFOB 1.19 Under Normoxic and Hypoxic Conditions: A Phenotypic Microarray Analysis. Exp Biol Med (Maywood) (2021) 246(10):1177–83. doi: 10.1177/1535370220985468
40. Tsai WY, Tsai RY, Liu CC, Wu JL, Wong CS. Sulfasalazine Attenuates ACL Transection and Medial Menisectomy-Induced Cartilage Destruction by Inhibition of Cystine/Glutamate Antiporter. J Orthop Res (2016) 34(4):650–7. doi: 10.1002/jor.23069
Keywords: knee osteoarthritis, osteoporosis, metabolomics, erxian decoction, osteoporotic osteoarthritis
Citation: Ma Z, Wei Y, Zhang L, Shi X, Xing R, Liao T, Yang N, Li X, Jie L and Wang P (2022) GCTOF-MS Combined LC-QTRAP-MS/MS Reveals Metabolic Difference Between Osteoarthritis and Osteoporotic Osteoarthritis and the Intervention Effect of Erxian Decoction. Front. Endocrinol. 13:905507. doi: 10.3389/fendo.2022.905507
Received: 27 March 2022; Accepted: 31 May 2022;
Published: 28 July 2022.
Edited by:
Ling-Feng Zeng, Guangdong Provincial Hospital of Chinese Medicine, ChinaReviewed by:
Hongting Jin, Zhejiang Chinese Medical University, ChinaQianqian Liang, Shanghai University of Traditional Chinese Medicine, China
Gang LI, Affiliated Hospital of Shandong University of Traditional Chinese Medicine, China
Copyright © 2022 Ma, Wei, Zhang, Shi, Xing, Liao, Yang, Li, Jie and Wang. This is an open-access article distributed under the terms of the Creative Commons Attribution License (CC BY). The use, distribution or reproduction in other forums is permitted, provided the original author(s) and the copyright owner(s) are credited and that the original publication in this journal is cited, in accordance with accepted academic practice. No use, distribution or reproduction is permitted which does not comply with these terms.
*Correspondence: Peimin Wang, drwpm@163.com