 Jianzhong Ye1†
 Yishuai Lin2†Qing Wang3,4†Yating Li3,4†
 Yajie Zhao1
 Lijiang Chen1Qing Wu1Chunquan Xu1Cui Zhou1Yao Sun1Wanchun Ye5Fumao Bai1*
 Tieli Zhou1*
- 1Department of Clinical Laboratory, The First Affiliated Hospital of Wenzhou Medical University, Wenzhou, China
- 2School of Laboratory Medicine and Life Sciences, Wenzhou Medical University, Wenzhou, China
- 3Collaborative Innovation Center for the Diagnosis and Treatment of Infectious Diseases, State Key Laboratory for the Diagnosis and Treatment of Infectious Diseases, The First Affiliated Hospital, School of Medicine, Zhejiang University, Hangzhou, China
- 4National Clinical Research Center for Infectious Diseases, The First Affiliated Hospital, School of Medicine, Zhejiang University, Hangzhou, China
- 5Department of Chemotherapy 2, Wenzhou Central Hospital, Wenzhou, China
Background: Nonalcoholic steatohepatitis (NASH) is rapidly becoming a major chronic liver disease worldwide. However, little is known concerning the pathogenesis and progression mechanism of NASH. Our aim here is to identify key genes and elucidate their biological function in the progression from hepatic steatosis to NASH.
Methods: Gene expression datasets containing NASH patients, hepatic steatosis patients, and healthy subjects were downloaded from the Gene Expression Omnibus database, using the R packages biobase and GEOquery. Differentially expressed genes (DEGs) were identified using the R limma package. Functional annotation and enrichment analysis of DEGs were undertaken using the R package ClusterProfile. Protein-protein interaction (PPI) networks were constructed using the STRING database.
Results: Three microarray datasets GSE48452, GSE63067 and GSE89632 were selected. They included 45 NASH patients, 31 hepatic steatosis patients, and 43 healthy subjects. Two up-regulated and 24 down-regulated DEGs were found in both NASH patients vs. healthy controls and in steatosis subjects vs. healthy controls. The most significantly differentially expressed genes were FOSB (P = 3.43×10⁻¹⁵), followed by CYP7A1 (P = 2.87×10⁻¹¹), and FOS (P = 6.26×10⁻¹¹). Proximal promoter DNA-binding transcription activator activity, RNA polymerase II-specific (P = 1.30×10⁻⁵) was the most significantly enriched functional term in the gene ontology analysis. KEGG pathway enrichment analysis indicated that the MAPK signaling pathway (P = 3.11×10⁻⁴) was significantly enriched.
Conclusion: This study characterized hub genes of the liver transcriptome, which may contribute functionally to NASH progression from hepatic steatosis.
Introduction
Nonalcoholic steatohepatitis (NASH) is a severe form of nonalcoholic fatty liver disease (NAFLD). Its histological features include simple steatosis, hepatic and systemic inflammation, and liver injury with varying degrees of fibrosis. The global prevalence of NASH is approximately 1.5%–6.5% (1). Patients with NASH, especially those with advanced fibrosis, are more likely to progress to hepatocellular carcinoma (HCC) (2). It has been suggested that NASH will become the principal indication for liver transplantation in the near future (3). NASH is now a major public health concern due to its increasing prevalence and poor prognosis (4).
Historically, the underlying pathogenesis of NASH was explained by the so-called “two-hit” theory (5). The first “hit” was triglyceride accumulation, resulting in hepatic steatosis. The second “hit” includes oxidative stress, hormonal imbalance, and mitochondrial abnormalities, which together contribute to the progression from simple steatosis to NASH. However, accumulated evidence suggests that the “two-hit” theory does not explain many of the multiple molecular and metabolic alterations seen in this disease (6). Moreover, hepatic steatosis is benign and does not progress in most subjects, suggesting NASH may be a heterogeneous disease with a distinct pathogenesis (7). There is thus a pressing need to fully understand the pathogenesis of NASH more completely.
Motivated by this dilemma, our aim was to mine hub genes within the liver transcriptome that can drive progression of hepatic steatosis to NASH, using extant information deposited in the Gene Expression Omnibus (GEO) (8) database at the National Center for Biotechnology Information (NCBI). Datasets that contained NASH patients, hepatic steatosis patients, and healthy subjects were selected from the GEO database, and used to conduct a reliable genome-wide microarray analysis of mRNA expression profiles. First, we identified a set of differentially expressed genes (DEGs) by comparing hepatic steatosis and healthy control samples. Second, we compared the gene expression profile from samples of NASH patients and healthy controls. Third, we pooled those genes that were differentially expressed in both steatosis patients versus healthy controls and in NASH patients versus healthy controls. Finally, 26 DEGs were identified and subjected to additional functional analysis.
Materials and Methods
Inclusion and Exclusion Criteria
Initially, we undertook a systematic and comprehensive search within the GEO database (http://www.ncbi.nlm.nih.gov/geo/) (9). Our retrieval strategy used the following search term: {[homo sapiens (Organism)] AND [(non-alcoholic fatty liver disease) OR (nonalcoholic fatty liver disease) OR (NAFLD) OR (steatosis)] AND [(non-alcoholic steatohepatitis) OR (nonalcoholic steatohepatitis) OR (NASH)]}. “Study type” was restricted to “expression profiling by array”. Details of the retrieval strategy and subsequent analysis are presented in Supplemental Figure 1.
Datasets meeting the following criteria were included in the study: 1) mRNA expression profiling was conducted using liver samples; 2) GEO datasets contained hepatic steatosis subjects, NASH subjects, and matched healthy controls; 3) definite diagnosis of steatosis or NASH.
Datasets meeting the following criteria were excluded from the study: 1) patients with other diseases, such as hepatocellular carcinoma (HCC); 2) obese subjects matched as controls; 3) ambiguous diagnosis, as such where steatosis and NASH were collectively referred to as NAFLD.
Data Cleaning
Three datasets: GSE48452 (10), GSE63067 (11), and GSE89632 (12), met all criteria and were included in this study, from 27 studies initially identified by screening GEO. Raw microarray data were downloaded using R studio (https://www.rstudio.com/) with biobase and GEOquery packages. The data were then annotated and merged, using a custom-written Perl script (https://www.perl.org/). All probes were mapped to their corresponding Entrez Gene ID. When multiple probes matched with one gene, their mean expression was used. Probes were excluded if they did not map to any known genes. The microarray mRNA expression data were then batch normalized using R packages sva and limma. Obese patients (n=16) or individuals having had bariatric surgery (n=19) in GSE48452 were excluded, based on the predefined exclusion criteria above. Details of included datasets are outlined in Table 1.
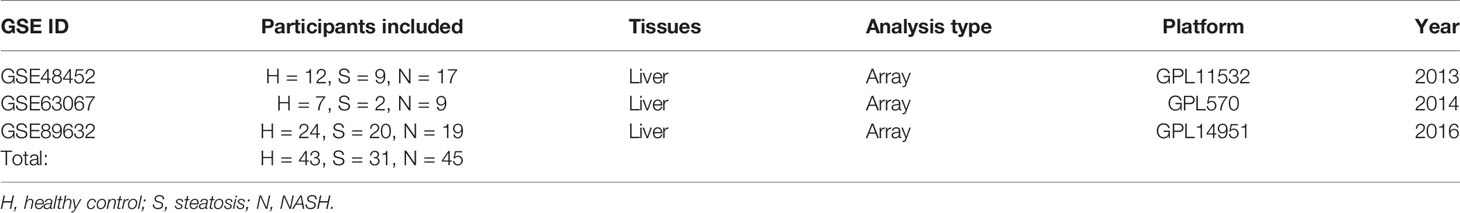
Table 1 Characteristics of the included GEO datasets.
Identification of Differentially Expressed Genes
Pre-processed mRNA expression data were analyzed to identify DEGs using the R package limma. The resulting P-values were corrected using the Benjamini and Hochberg approach, at a False Discovery Rate (FDR) of 5%. Genes with an adjusted P-value of <0.05 and log fold change (FC) greater than 1 were considered as DEGs. The log FC is the logarithm of the ratio of the change in expression for each gene between groups (13). Liver transcriptome profiles from steatosis and NASH samples were first compared to healthy controls. Data were then pooled using principal component analysis (PCA) with the prcomp function of R package stats, and visualized using R packages ggplot2. PCA is an orthogonal linear transformation of an existing coordinate frame such that the largest variance of the projected data lies on the first coordinate, or so-called first principal component (PC1), the second largest variance on the second coordinate, or PC2, which is perpendicular to PC1, and so on (14). Volcano plots were used to visualize the differential gene expression between the groups. Venn diagrams were plotted to identify DEGs present in both steatosis patients vs. healthy control comparisons and comparisons of NASH subjects vs. healthy controls. Heatmaps visualized the expression levels of the commonly shared DEGs in NASH patients and healthy subjects, and were plotted based on hierarchical clustering analysis using the R package pheatmap. The expression levels of the top 10 DEGs in NASH patients and healthy controls were shown as box plots, using the R package ggplot2.
Functional Annotation and Enrichment Analysis of DEGs
To understand the biological function and signaling pathways of the commonly shared DEGs involved in NASH, the 26 identified DEGs were subjected to enrichment analysis within the Gene Ontology (GO; http://www.geneontology.org/) database and pathway analysis within the Kyoto Encyclopedia of Genes and Genomes (KEGG; https://www.kegg.jp/) using the R package ClusterProfile. Adjusted P-values of <0.05 and Q-values <0.05 were used to define the working threshold for statistical significance (15, 16). Terms included in the GO enrichment analysis were: “biological process” (BP), “cellular component” (CC), and “molecular function” (MF).
Construction of the Protein–Protein Interaction Network
The Search Tool for the Retrieval of Interacting Genes database (STRING version 11.0; https://string-db.org/) (17) was used to construct protein-protein interaction (PPI) networks for the 26 identified DEGs. A combined score above 0.4 was used as the selection threshold. Then, Cytoscape software (http://www.cytoscape.org) (18) was used to visualize the PPI networks.
Expression Validation of DEGs
Validation of expression was undertaken using data from a high throughput sequencing GEO dataset (GSE126848: 15 steatosis patients, 16 NASH patients, and 14 healthy controls). A count-based differential expression analysis of RNA-seq data was undertaken using the edgeR function (19). A P-value of <0.05 was set as the significance threshold (20).
Results
Identification and Analysis of 26 DEGs Present in Both NASH vs. Healthy Controls and Steatosis vs. Healthy Controls
First, we merged and normalized three GEO datasets: GSE48452, GSE63067, and GSE89632. DEGs were identified between steatosis patients and healthy controls and between NASH patients and healthy controls. A PCA analysis indicated the presence of three distinct clusters (Figure 1A). 63 genes were differentially expressed between steatosis and healthy controls: 10 up-regulated and 53 down-regulated (Figure 1B, Supplemental Table 1). 41 genes were differentially expressed between NASH and healthy controls: 14 up-regulated and 27 down-regulated (Figure 1C, Supplemental Table 2). By using a Venn diagram, 26 DEGs were found to be common to both analyses: 2 up-regulated and 24 down-regulated (Figure 1D, Supplemental Table 3). A heatmap indicated distinct expression patterns exhibited by the 26 DEGs, when comparing NASH patients and healthy subjects (Figure 2A). This suggests these genes may play some role in driving NASH progression. Table 2 lists the top 10 most statistically significant DEGS in NASH, ordered by the magnitude of altered expression. The 10 DEGs included two up-regulated genes (CYP7A1, and PEG10), and eight down-regulated genes (FOSB, FOS, IL6, GADD45G, MYC, SLITRK3, JUNB, IGFBP2). Box plots of mRNA expression levels of the 10 DEGs are shown in Figure 2B.
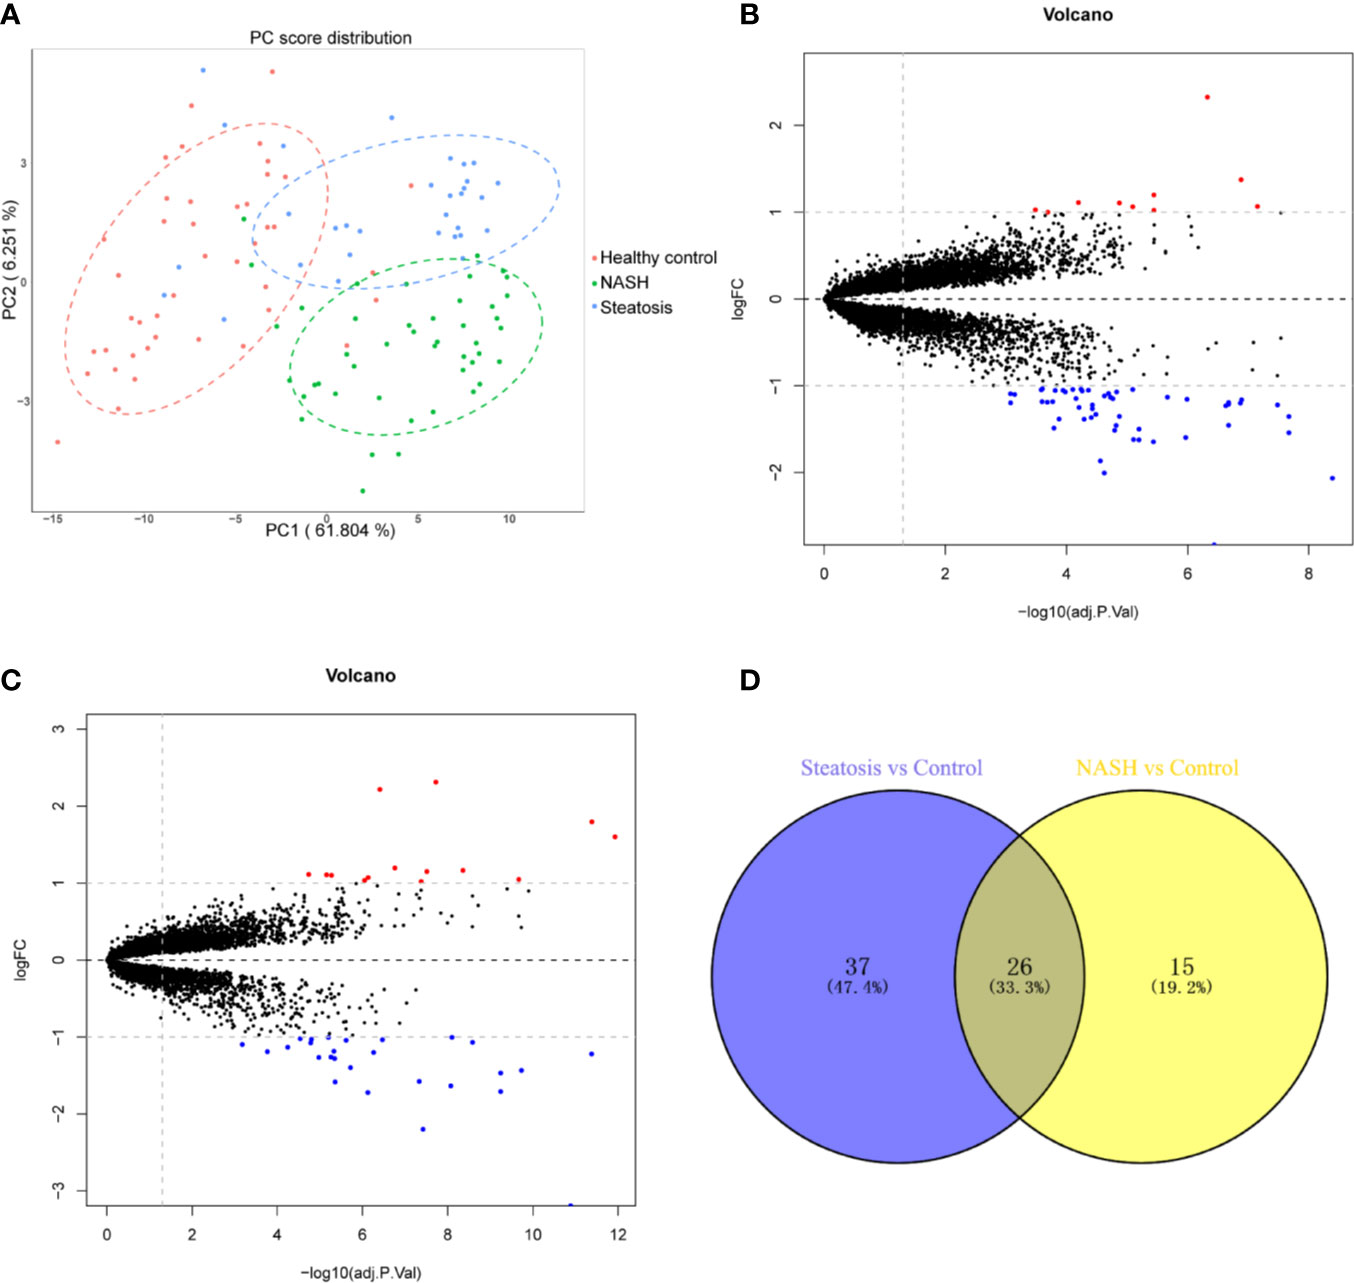
Figure 1 Identification of differentially expressed genes (DEGs) in both NASH and steatosis subjects when compared to healthy controls. (A) Principal component analysis (PCA) showing that steatosis patients, NASH patients, and healthy subjects are clearly separated into distinct clusters. (B) Volcano plot showing 10 up-regulated genes (red dots) and 53 down-regulated genes (blue dots) in steatosis patients when compared to healthy controls; log fold change (FC) >1, P <0.05. (C) Volcano plot showing 14 up-regulated genes (red dots) and 27 down-regulated (blue dots) in NASH patients when compared to healthy controls; log fold change (FC) >1, P <0.05. (D) Venn diagram displaying 26 DEGs present in both NASH and steatosis subjects.
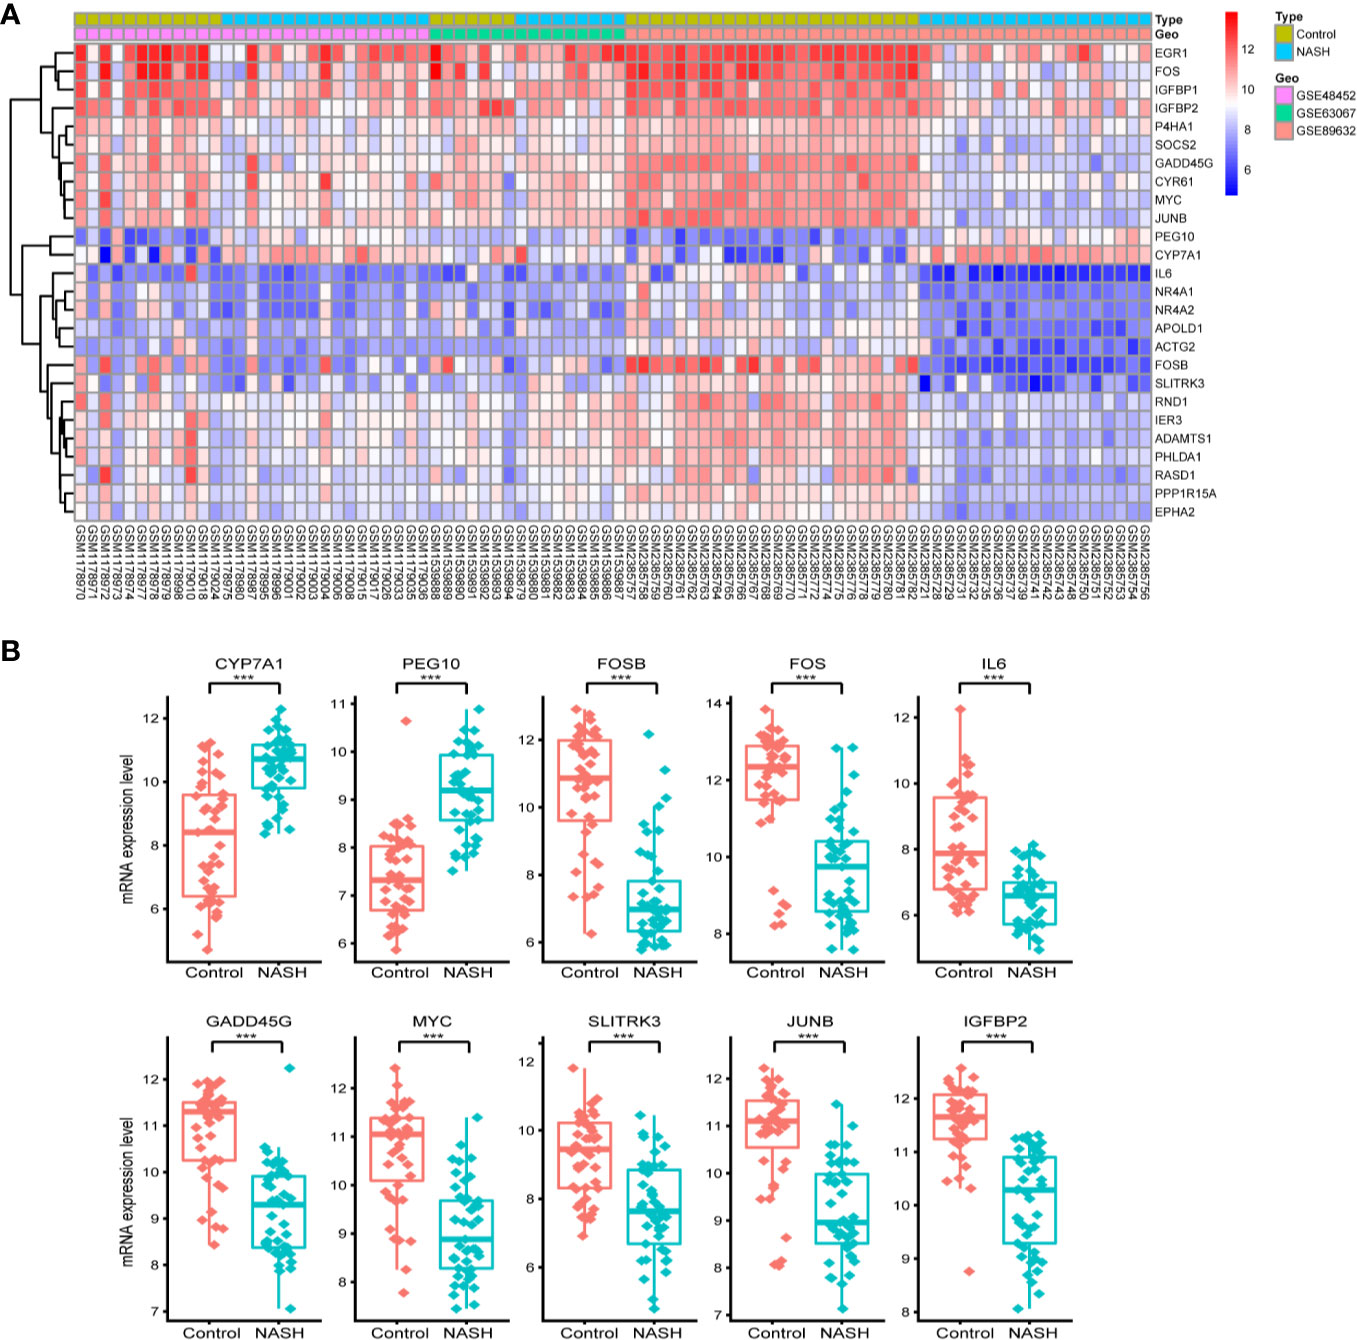
Figure 2 Characterizing the 26 differentially expressed genes (DEGs) shared by NASH and steatosis subjects. (A) A heatmap of the 26 DEGs. Each row represents a gene and each column represents a sample. The color scale on the right illustrates the relative expression level of DEGs from blue (low) to red (high). (B) Scatter plot of expression levels of the identified top 10 DEGs. The top two up-regulated genes (CYP7A1, PEG10) and the top eight down-regulated genes (FOSB, FOS, IL6, GADD45G, MYC, SLITRK3, JUNB, IGFBP2) are ranked by their respective change in expression level. Detailed information on 26 genes is listed in Table 2. ***P < 0.001.
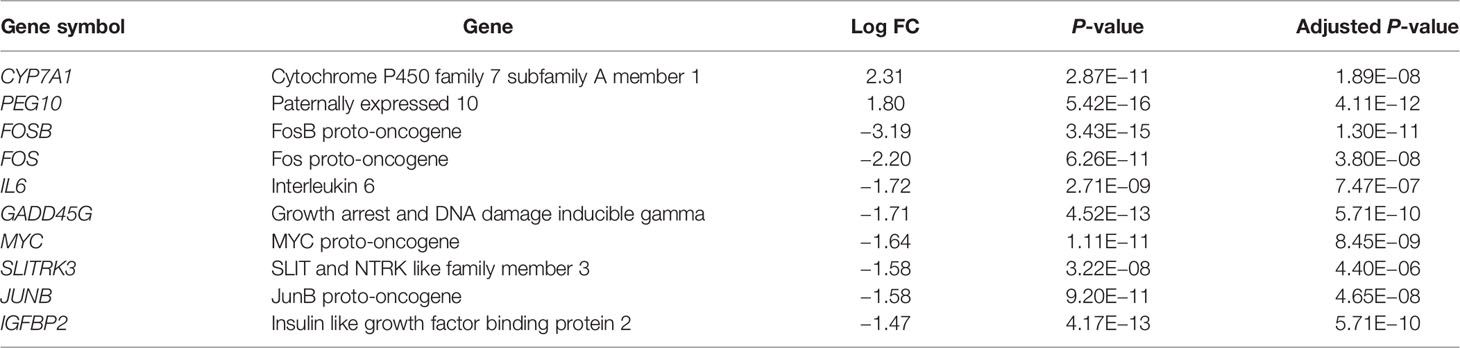
Table 2 Top 10 aberrantly expressed DEGs in NASH.
Significant Biological Differences of the 26 DEGs as Carried Out by Gene Ontology Enrichment Analysis
To investigate the biological function of the 26 identified DEGs shared between NASH and steatosis, a gene ontology (GO) enrichment analysis was undertaken (Figure 3). The most significantly enriched GO term of molecular function (MF) was proximal promoter DNA−binding transcription activator activity, RNA polymerase II−specific (GO:0001077; P = 1.30×10⁻⁵). Response to steroid hormone was the most significantly enriched GO term of biological processes (BP) (GO:0048545; P = 1.36×10⁻⁵). In terms of cellular component (CC) ontology, endoplasmic reticulum lumen was significantly enriched (GO:0005788; P = 6.17×10⁻⁴).
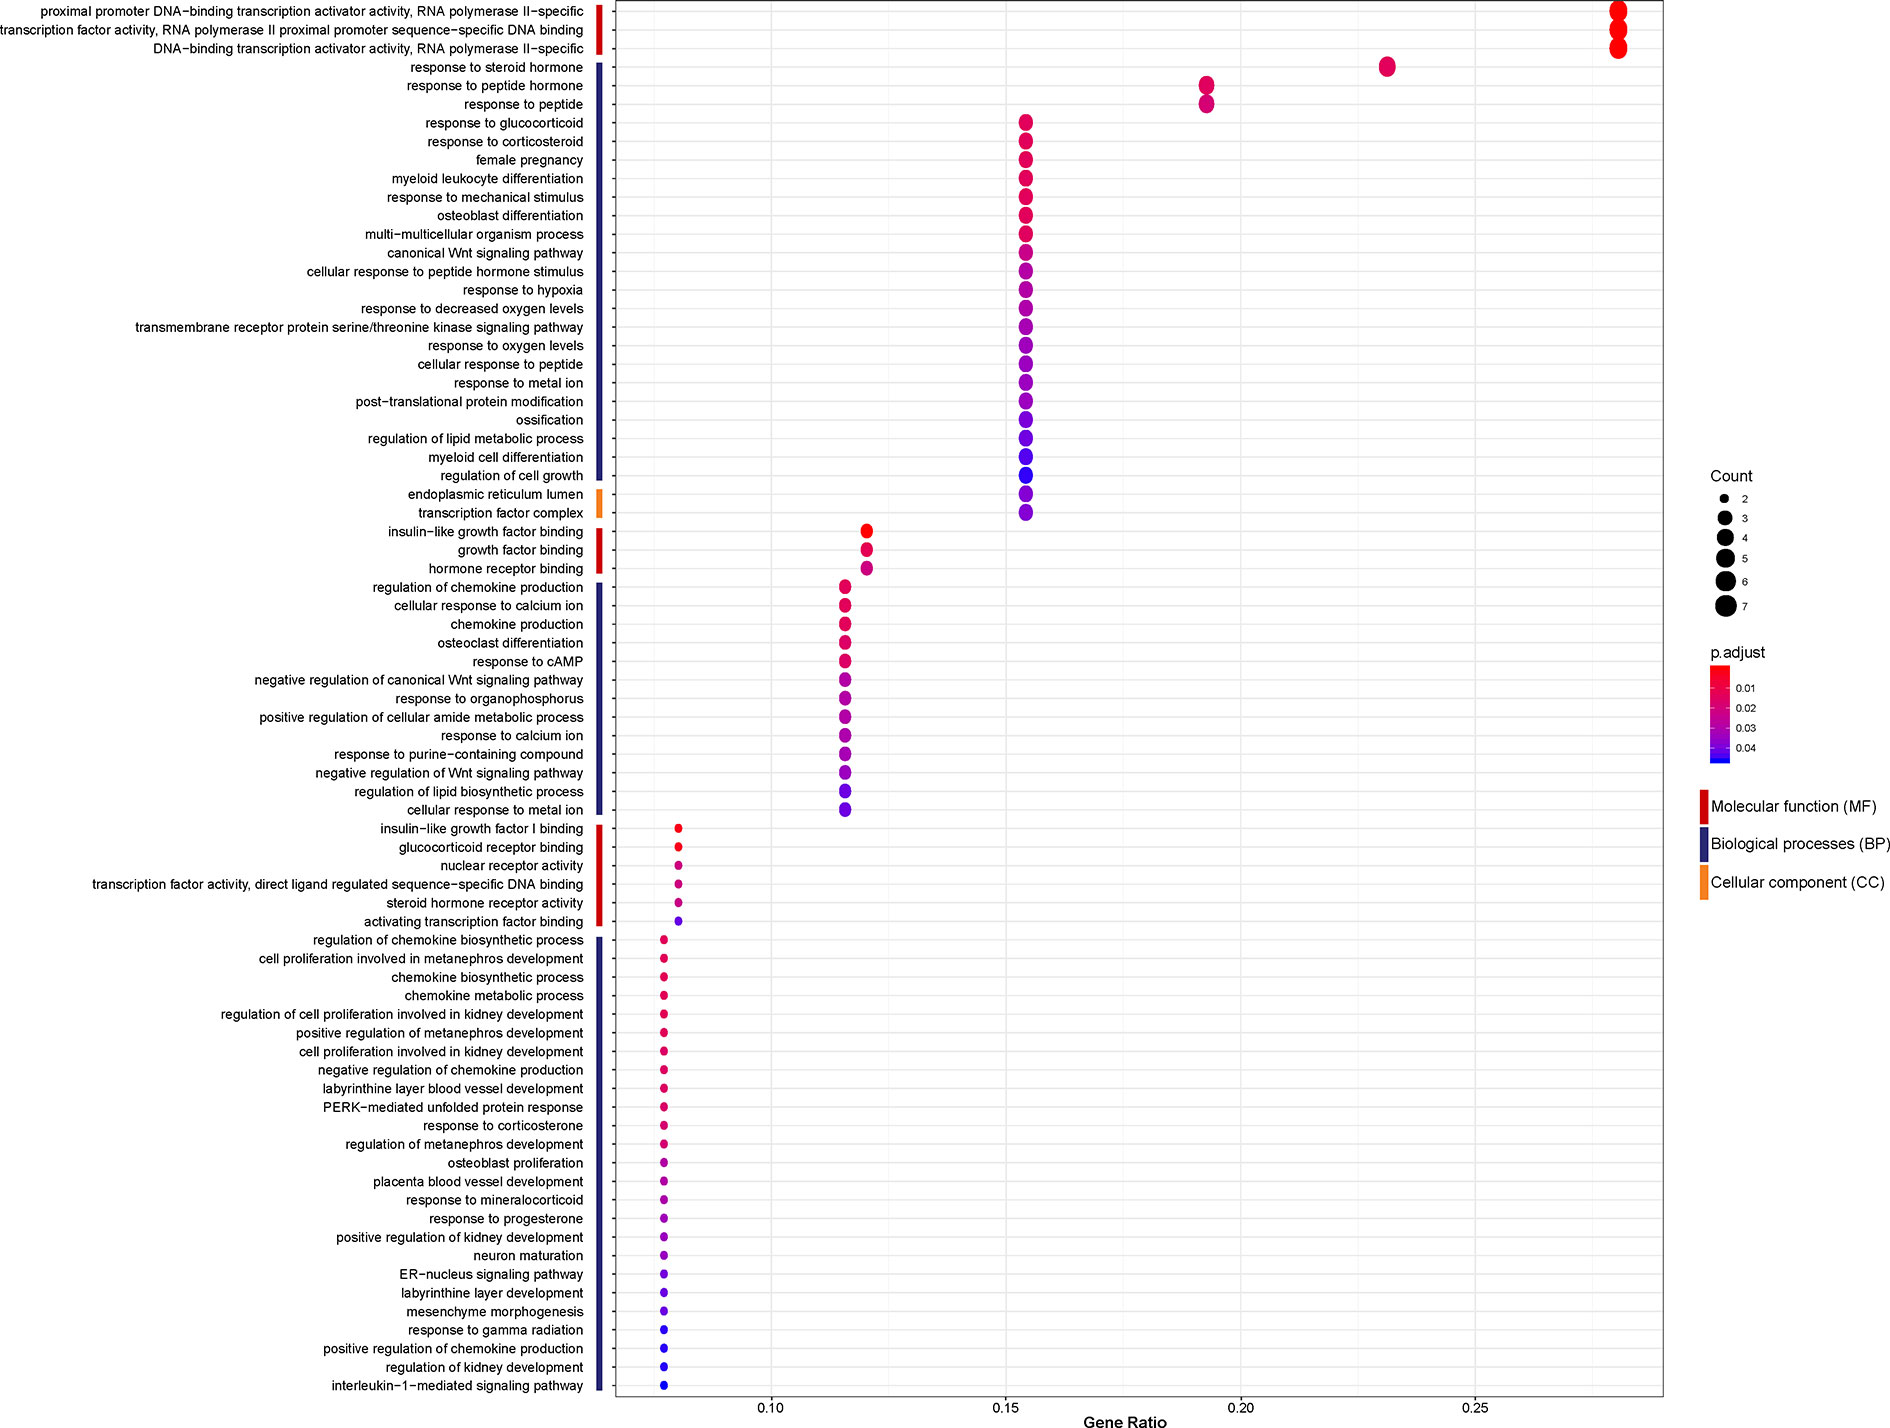
Figure 3 Enriched gene ontology (GO) functions of the 26 differentially expressed genes (DEGs) according to three complementary biological roles: molecular function (MF), biological process (BP), and cellular component (CC).
A Signature of Signaling Pathways of the 26 DEGs That Were Revealed by Kyoto Encyclopedia of Genes and Genomes Pathway Analysis
Analysis of Kyoto Encyclopedia of Genes and Genomes (KEGG) pathways was undertaken to elucidate the signaling pathways of the 26 DEGs identified previously. “MAPK signaling pathway”, “Colorectal cancer”, “IL-17 signaling pathway”, “Human T-cell leukemia virus 1 infection”, “Parathyroid hormone synthesis, secretion and action”, “TNF signaling pathway”, “Osteoclast differentiation”, “Prion diseases”, “Thyroid cancer”, “Breast cancer”, “Cellular senescence”, “JAK-STAT signaling pathway”, “Hepatitis B”, “PI3K-Akt signaling pathway”, “Endometrial cancer”, “Kaposi sarcoma-associated herpesvirus infection”, “Transcriptional misregulation in cancer” were significantly enriched KEGG pathways. A histogram indicating the percentage of genes affected in these pathways is shown in Figure 4A. The MAPK signaling pathway was found to be most significantly enriched in NASH patients (hsa04010; P = 3.11×10⁻⁴), and is shown in Figure 4B.
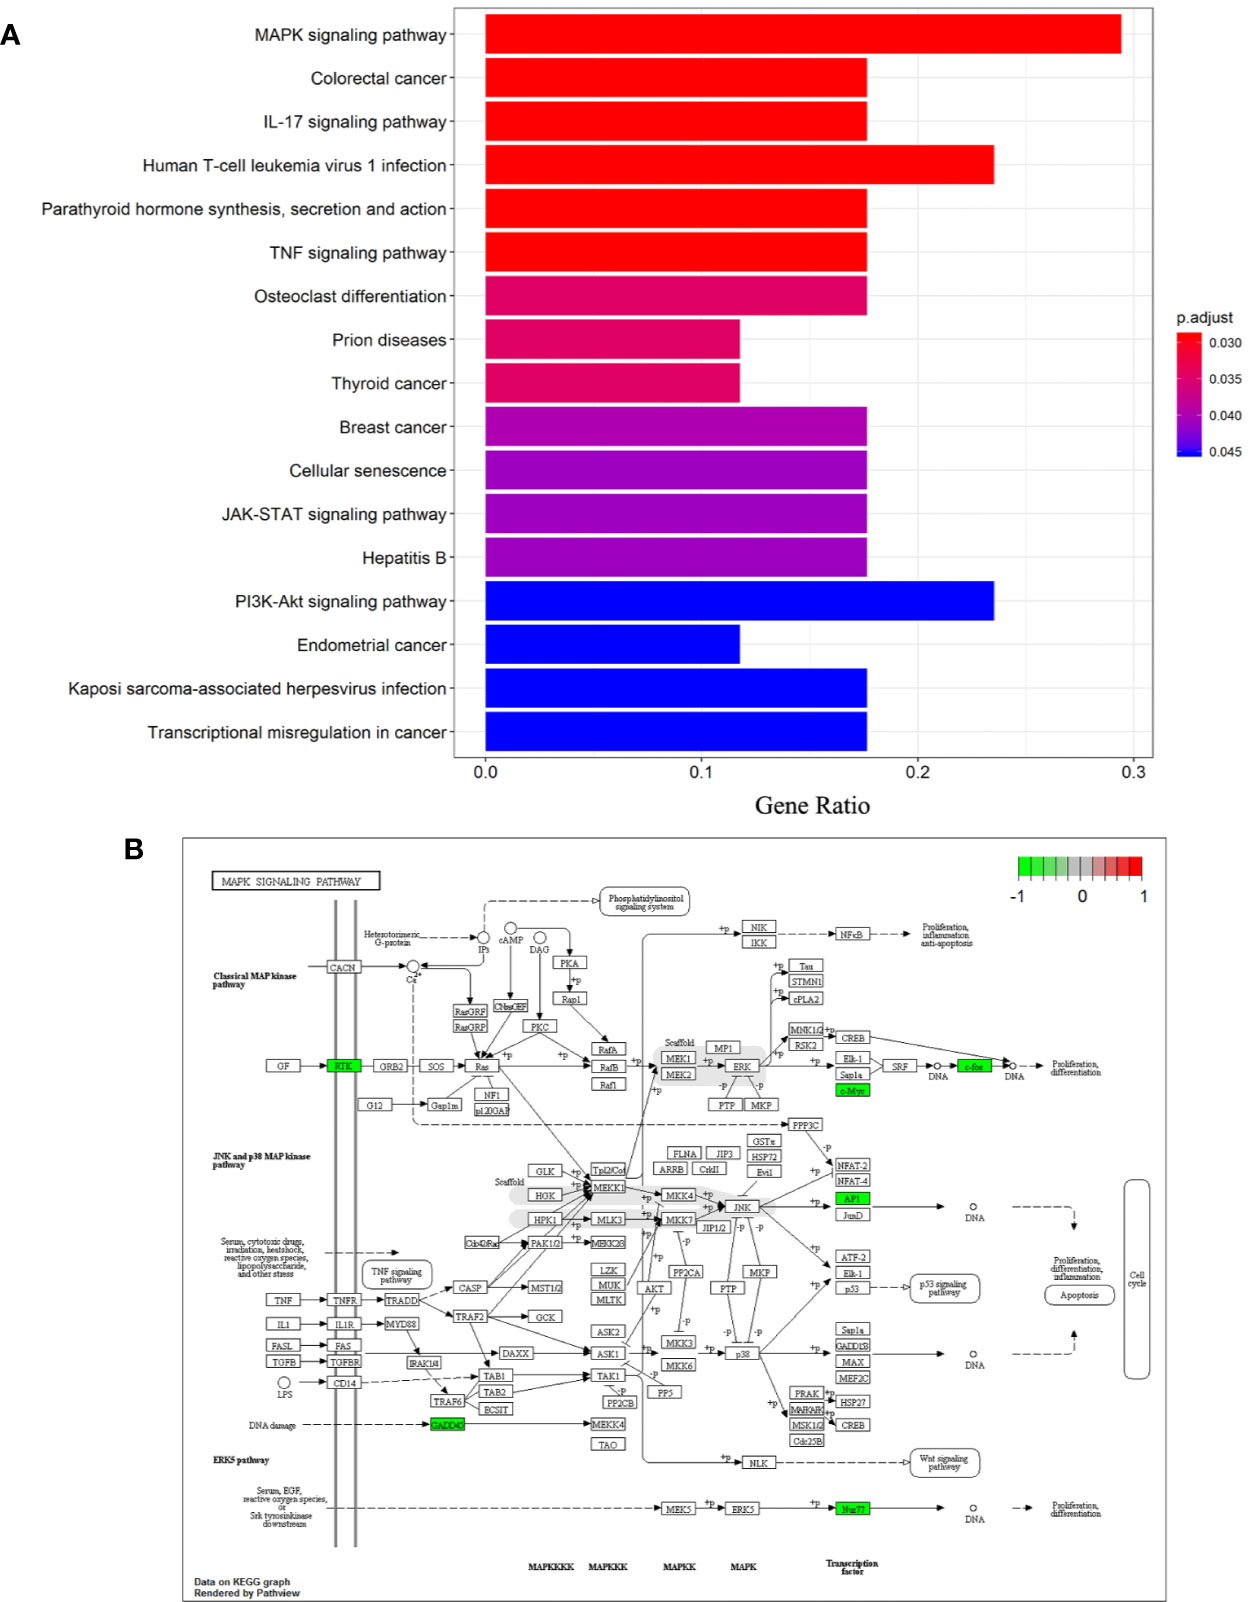
Figure 4 Differentiation-associated KEGG functional analysis. (A) A histogram of KEGG biological signaling pathways. (B) Colored map of the MAPK signaling pathway.
Key Candidate Genes Were Identified With DEGs Protein–Protein Interaction Network
STRING and Cytoscape were used to create and visualize a PPI network involving the 26 DEGs (Figure 5). The network comprised 18 nodes and 88 edges, with FOS and IL6 each having 10 connections. An additional 16 proteins had considerable interaction with other proteins: EGR1 (node degree=9), FOSB (degree=9), CYR61 (degree=8), MYC (degree=8), JUNB (degree=7), NR4A1 (degree=7), NR4A2 (degree=5), IER3 (degree=3), EPHA2 (degree=2), IGFBP1 (degree=2), PPP1R15A (degree=2), SOCS2 (degree=2), ADAMTS1 (degree=1), IGFBP2 (degree=1), PEG10 (degree=1), PHLDA1 (degree=1). Among the top 10 identified DEGs, PEG10, FOSB, FOS, IL6, MYC, JUNB, IGFBP2 were identified as hub genes.
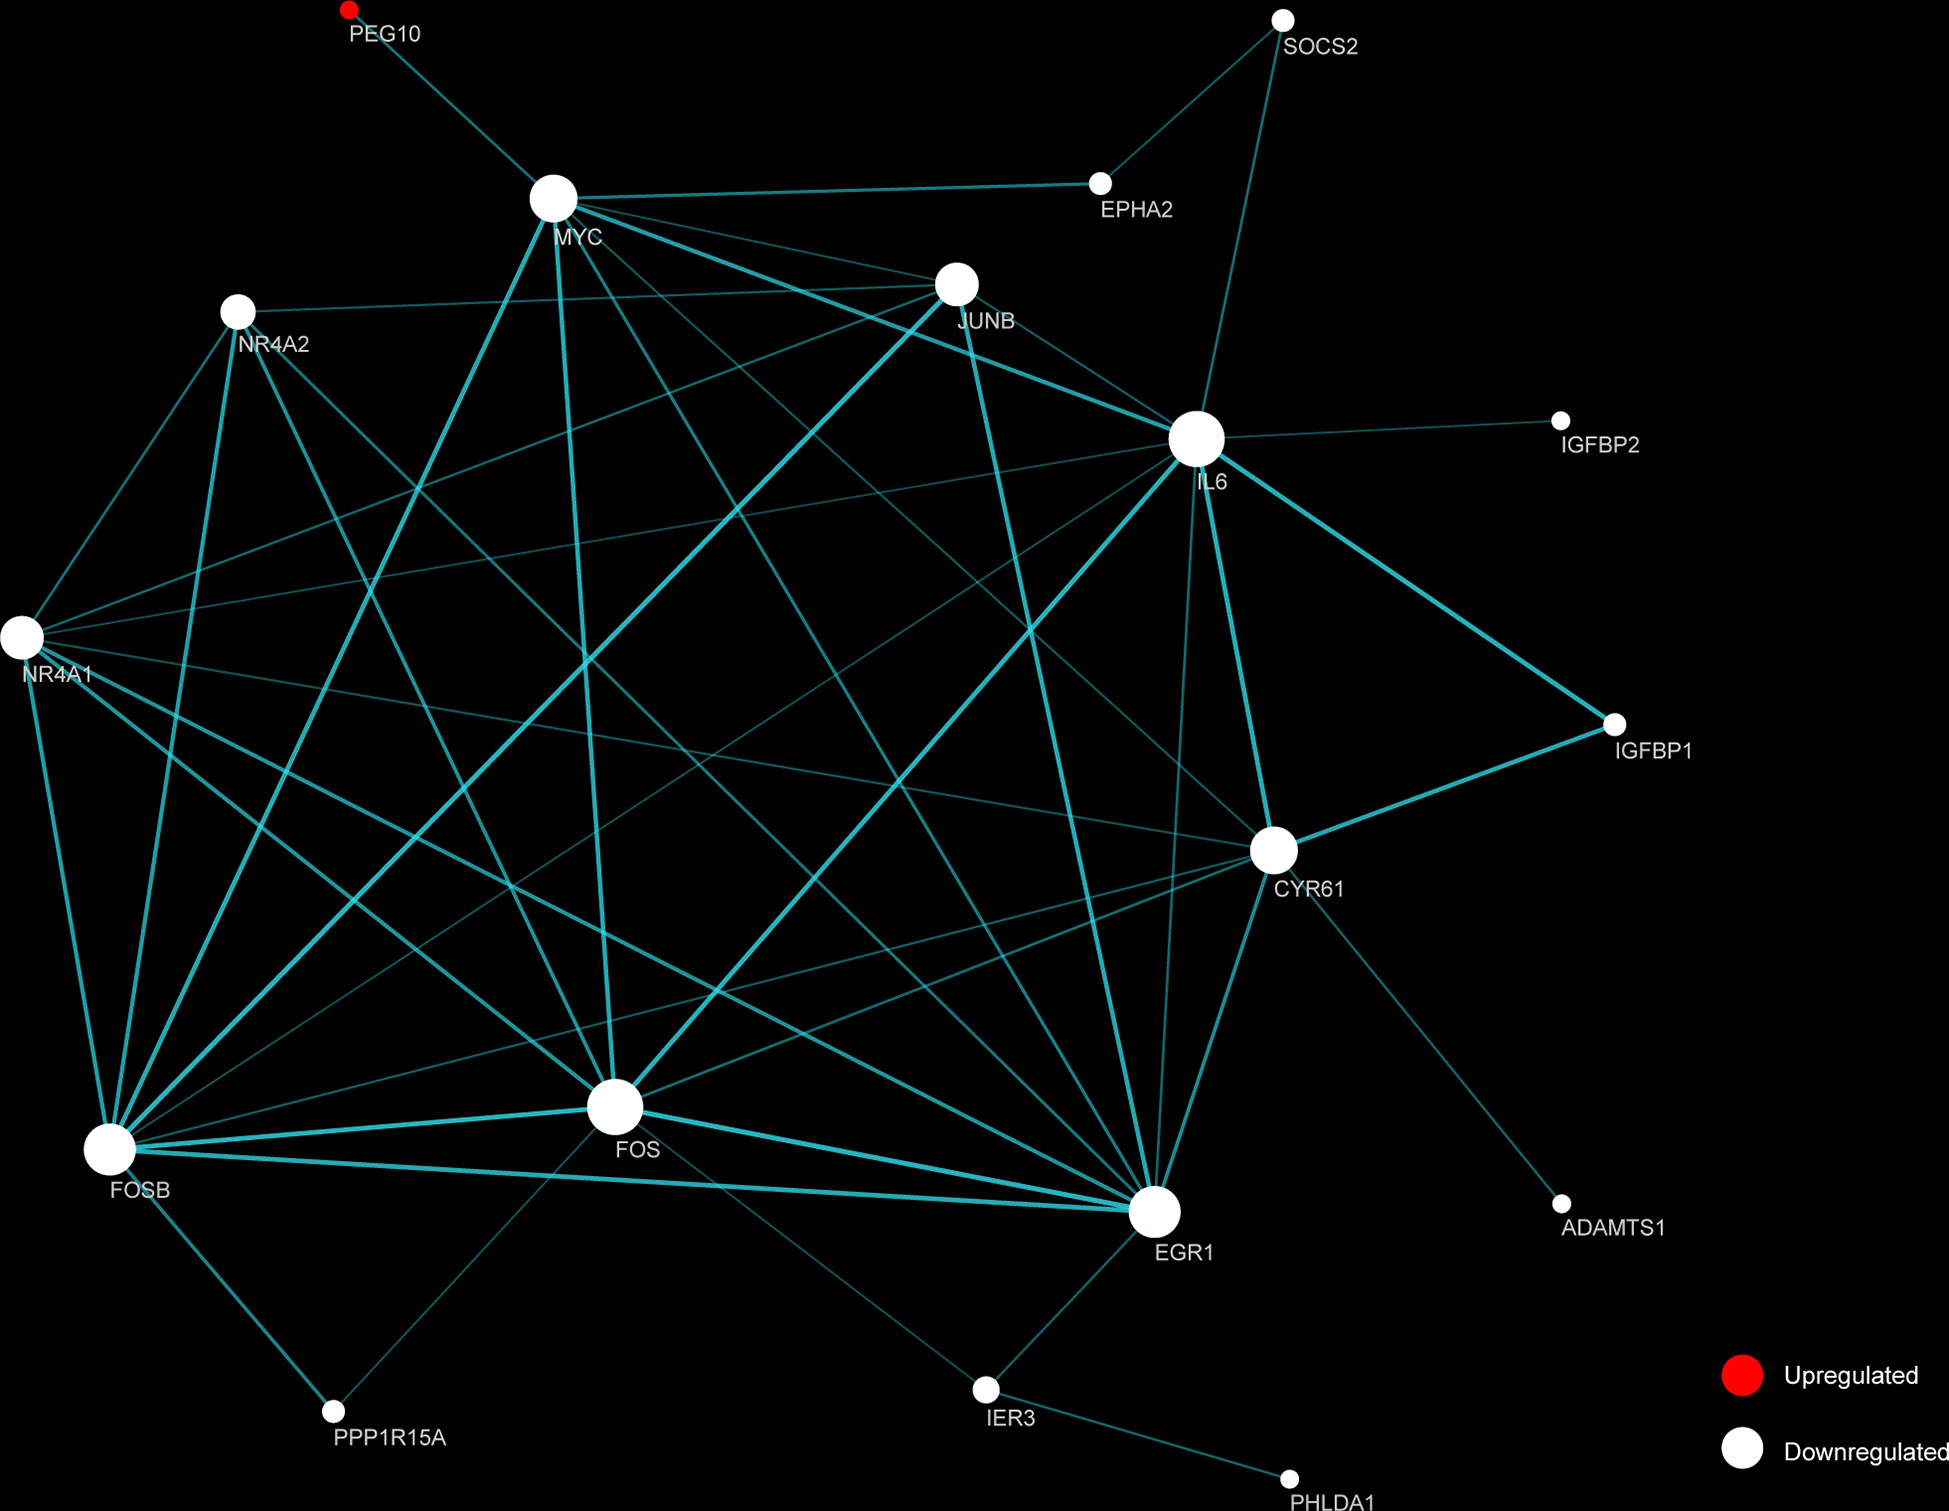
Figure 5 Functional protein-protein interaction (PPI) network analysis of the differentially expressed genes (DEGs). Nodes represent proteins encoded by up-regulated (red) and down-regulated (white) DEGs, respectively. Node size indicates contribution made by the proteins. Edges represent protein-protein interaction. Width and transparency of edges are indicative of the network score.
The Independent Validation Results of DEGs Expression Levels
We verified DEGs expression using RNA-seq dataset GSE126848, finding that 10 out of the 26 DEGs and five out of the top 10 DEGs found by integrated multichip analysis also exhibited significant differential expression and an identical expression trend (Supplemental Table 4). We then queried the 10 DEGs validated above in the PPI network, six proteins were overlapped with the discovery cohort, which consisted of 18 proteins that interacted highly with other proteins (Supplemental Table 5).
Discussion
Despite the rising prevalence of nonalcoholic steatohepatitis (NASH), which is a severe form of nonalcoholic fatty liver disease (NAFLD), its underlying etiology remains unclear (21). Insights into the molecular changes that occur during NASH pathogenesis have come to light through studies that have determined the key DEGs between NASH and healthy controls (22) or by identifying DEGs among NASH, steatosis and normal tissues (23–25). However, genes expressed in both NASH and steatosis, when compared to healthy individuals, rather than differentially expressed genes, may instead drive disease progression. In the present study, we searched the Gene Expression Omnibus (GEO) database systematically for liver transcriptome studies that contained data from hepatic steatosis patients, NASH patients, and healthy subjects, identifying differentially expressed genes (DEGs) common to steatosis and NASH patients, when compared to healthy subjects. We hypothesized that such genes might play important roles in driving progression of steatosis to NASH, helping us to understand the pathogenesis of NASH more completely. Moreover, functional annotation and PPI network construction were undertaken to study the potential biological functions of DEGs.
Among the 63 DEGs identified in the comparison of steatosis patients versus healthy subjects, and the 41 DEGs identified in the NASH patients versus healthy subjects comparison, 26 DEGs were common to both comparisons, with the same pattern of up-regulation or down-regulation. Of the top-ranked 10 genes, two genes (CYP7A1 and PEG10) were significantly up-regulated in both steatosis and NASH patients, while eight genes (FOSB, FOS, IL6, GADD45G, MYC, SLITRK3, JUNB, and IGFBP2) were significantly down-regulated. Among them, PEG10, FOSB, FOS, IL6, MYC, JUNB, and IGFBP2 were identified as hub genes in the PPI network analysis.
CYP7A1 (Cytochrome P450 family 7 subfamily A member 1) is a rate-limiting enzyme for the initial stage of bile acid biosynthesis (26), and thus acts as a cholesterol scavenger (27). Increased CYP7A1 activity may enlarge pools of toxic bile acids, such as hydrophobic bile acids (28). Consistent with our findings, hepatic expression of CYP7A1 is known to be significantly elevated in steatosis and NASH patients (29, 30). PEG10 (Paternally Expressed Gene 10) is not expressed by normal livers but is over-expressed in several human cancers, such as hepatocellular carcinoma (HCC), pancreas cancer, gallbladder cancer, leukemia, breast cancer, and prostate cancer (31, 32). PEG10 expression correlates with poor survival and increased recurrence in HCC (32). Recently, PEG10 was found to be positively associated with disease severity in NAFLD and NASH (33).
Of the eight down-regulated genes, three (FOS, FOSB, and JUNB) were the transcription factor subunits of activator protein-1 (AP-1). AP-1 plays a key role in the hepatic response to acute stress, acting as a link between lipid metabolism and NAFLD (34). FOS proto-oncogene (also known as c-FOS) and its paralogue, FOSB proto-oncogene, were differentially expressed in various cancers and play key roles in proliferation, differentiation, migration, and the apoptosis of tumor cells (35, 36). Both FOS and FOSB were down-regulated in HCC patients (35). Little or nothing seems to be known concerning the contribution of FOS, FOSB, and JUNB to NAFLD etiology, necessitating further elucidation of their function. MYC proto-oncogene overexpression is associated with aggressive and poorly differentiated HCC (37). Mice progress spontaneously to HCC when MYC oncogene were activated in the liver (38). The livers of MYC knock-out mice developed features of NAFLD, and gradually resembled those seen in NASH (39). Our findings support the conjecture that MYC is consistently down-regulated in steatosis and NASH patients, MYC may be indispensable for the homeostasis of lipid metabolism. In our KEGG enrichment analysis, components of the MAPK signaling pathway were also significantly enriched, and aberrantly expressed MAPK genes included FOS and MYC among the DEGs. This indicates the potential role of MAPK signaling pathway in NASH progression.
IL6 (Interleukin 6) is an inflammatory factor usually thought to be correlated with NASH severity (40, 41). Our results instead showed a clear down-regulation of IL6 in both steatosis and NASH patients. Other studies indicate that IL6 has beneficial effects in liver regeneration (42), anti-apoptosis (43), and the repair of liver injury (44). This suggests IL6 is a pleiotropic cytokine and worthy of further research. GADD45G (Growth arrest and DNA damage 45G) functions as a stress sensor in many biological processes, inhibiting HCC development through induction of cellular senescence (45). The down-regulated expression of GADD45G may contribute to HCC progression (46). However, its specific role in NAFLD or NASH is not fully understood. Our findings indicate that reduced GADD45G expression may also be crucial in NAFLD progression. We also found the expression of SLITRK3 (SLIT and NTRK like family member 3) was down-regulated in steatosis and NASH patients. SLITRK3 is up-regulated in many cancers, including gastrointestinal cancer (47), and there is no clear information available about its association with NAFLD and NASH. Detailed research is still needed regarding this unsolved puzzle. We found IGFBP2 (Insulin like growth factor binding protein 2) was down-regulated in NASH patients. Yet, adenoviral overexpression of IGFBP2 has been shown to improve steatosis and diabetes in obese mice (48). The role of IGFBP2 in steatosis has yet to be elucidated.
We have successfully provided insight into the functional changes that accompany the progression of NASH, yet there are limitations inherent within our study. (1) It is not known which DEGs are protective or which are disease exacerbating in the progression of NASH. (2) It remains unclear whether inferred changes in expression are causes or consequences of disease progression. (3) Experimental validation has yet to be undertaken, due to the difficulty of obtaining clinical samples from healthy and diseased livers. In the future, it will be necessary to collect liver tissue from steatosis patients, NASH patients, and healthy subjects, thus facilitating full DEG verification. In turn, this should allow the much deeper study of any potential disease-related functions exhibited by the several DEGs we have identified.
Conclusion
In this study, we identified 26 DEGs that were present in both comparisons between NASH patients and healthy subjects and between steatosis patients and healthy subjects. Of the top-ranked 10 genes, two were significantly up-regulated (CYP7A1 and PEG10) and eight were significantly down-regulated (FOSB, FOS, IL6, GADD45G, MYC, SLITRK3, JUNB, and IGFBP2). Among the identified DEGs, PEG10, FOSB, FOS, IL6, MYC, JUNB, and IGFBP2 were identified as hub genes from our PPI network analysis. These genes may be involved in NASH progression. Once properly validated, they may provide the basis for new approaches to diagnosis or prove to be novel potential molecular targets for therapeutic intervention in NASH.
Data Availability Statement
Publicly available datasets were analyzed in this study. This data can be found here: https://www.ncbi.nlm.nih.gov/geo/query/acc.cgi?acc=GSE48452; https://www.ncbi.nlm.nih.gov/geo/query/acc.cgi?acc=GSE63067; https://www.ncbi.nlm.nih.gov/geo/query/acc.cgi?acc=GSE89632.
Author Contributions
JY, FB, and TZ designed the study. QW, YIL, YZ, and YAL collected the data. LC, QWu, CX, CZ, and YS analyzed and interpreted the data. JY and WY drafted the manuscript. YIL conducted an independent expression validation of DEGs. JY, YIL, FB, and TZ contributed to the critical revision of the manuscript. All authors contributed to the article and approved the submitted version.
Funding
This work was supported by the National Natural Science Foundations of China (Grant Number: 81741059 and 81971986), the Health Department of Zhejiang Province of the People’s Republic of China (Grant Number: 2019KY098), Start-up Funding for Talent Research Program in the First Affiliated Hospital of Wenzhou Medical University (Grant Number: 2019QD011).
Conflict of Interest
The authors declare that the research was conducted in the absence of any commercial or financial relationships that could be construed as a potential conflict of interest.
Supplementary Material
The Supplementary Material for this article can be found online at: https://www.frontiersin.org/articles/10.3389/fendo.2020.601745/full#supplementary-material
References
1. Sanyal AJ, Harrison SA, Ratziu V, Abdelmalek MF, Diehl AM, Caldwell S, et al. The Natural History of Advanced Fibrosis Due to Nonalcoholic Steatohepatitis: Data From the Simtuzumab Trials. Hepatology (2019) 70:1913–27. doi: 10.1002/hep.30664
2. Grohmann M, Wiede F, Dodd GT, Gurzov EN, Ooi GJ, Butt T, et al. Obesity Drives STAT-1-Dependent NASH and STAT-3-Dependent HCC. Cell (2018) 175:1289–306.e1220. doi: 10.1016/j.cell.2018.09.053
3. Pais R, Barritt AST, Calmus Y, Scatton O, Runge T, Lebray P, et al. NAFLD and liver transplantation: Current burden and expected challenges. J Hepatol (2016) 65:1245–57. doi: 10.1016/j.jhep.2016.07.033
4. Garcia-Jaramillo M, Spooner MH, Lohr CV, Wong CP, Zhang W, Jump DB. Lipidomic and transcriptomic analysis of western diet-induced nonalcoholic steatohepatitis (NASH) in female Ldlr -/- mice. PLoS One (2019) 14:e0214387. doi: 10.1371/journal.pone.0214387
5. Day CP, James OF. Steatohepatitis: a tale of two “hits”? Gastroenterology (1998) 114:842–5. doi: 10.1016/s0016-5085(98)70599-2
6. de Faria Ghetti F, Oliveira DG, de Oliveira JM, de Castro Ferreira L, Cesar DE, Moreira APB. Influence of gut microbiota on the development and progression of nonalcoholic steatohepatitis. Eur J Nutr (2018) 57:861–76. doi: 10.1007/s00394-017-1524-x
7. Tilg H, Moschen AR. Evolution of inflammation in nonalcoholic fatty liver disease: the multiple parallel hits hypothesis. Hepatology (2010) 52:1836–46. doi: 10.1002/hep.24001
8. Edgar R, Domrachev M, Lash AE. Gene Expression Omnibus: NCBI gene expression and hybridization array data repository. Nucleic Acids Res (2002) 30:207–10. doi: 10.1093/nar/30.1.207
9. Barrett T, Wilhite SE, Ledoux P, Evangelista C, Kim IF, Tomashevsky M, et al. NCBI GEO: archive for functional genomics data sets–update. Nucleic Acids Res (2013) 41:D991–995. doi: 10.1093/nar/gks1193
10. Ahrens M, Ammerpohl O, von Schonfels W, Kolarova J, Bens S, Itzel T, et al. DNA methylation analysis in nonalcoholic fatty liver disease suggests distinct disease-specific and remodeling signatures after bariatric surgery. Cell Metab (2013) 18:296–302. doi: 10.1016/j.cmet.2013.07.004
11. Frades I, Andreasson E, Mato JM, Alexandersson E, Matthiesen R, Martinez-Chantar ML. Integrative genomic signatures of hepatocellular carcinoma derived from nonalcoholic Fatty liver disease. PLoS One (2015) 10:e0124544. doi: 10.1371/journal.pone.0124544
12. Arendt BM, Comelli EM, Ma DW, Lou W, Teterina A, Kim T, et al. Altered hepatic gene expression in nonalcoholic fatty liver disease is associated with lower hepatic n-3 and n-6 polyunsaturated fatty acids. Hepatology (2015) 61:1565–78. doi: 10.1002/hep.27695
13. Love MI, Huber W, Anders S. Moderated estimation of fold change and dispersion for RNA-seq data with DESeq2. Genome Biol (2014) 15:550. doi: 10.1186/s13059-014-0550-8
14. Ringner M. What is principal component analysis? Nat Biotechnol (2008) 26:303–4. doi: 10.1038/nbt0308-303
15. Dutkowski J, Kramer M, Surma MA, Balakrishnan R, Cherry JM, Krogan NJ, et al. A gene ontology inferred from molecular networks. Nat Biotechnol (2013) 31:38–45. doi: 10.1038/nbt.2463
16. Kanehisa M, Furumichi M, Tanabe M, Sato Y, Morishima K. KEGG: new perspectives on genomes, pathways, diseases and drugs. Nucleic Acids Res (2017) 45:D353–61. doi: 10.1093/nar/gkw1092
17. Szklarczyk D, Franceschini A, Wyder S, Forslund K, Heller D, Huerta-Cepas J, et al. STRING v10: protein-protein interaction networks, integrated over the tree of life. Nucleic Acids Res (2015) 43:D447–452. doi: 10.1093/nar/gku1003
18. Shannon P, Markiel A, Ozier O, Baliga NS, Wang JT, Ramage D, et al. Cytoscape: a software environment for integrated models of biomolecular interaction networks. Genome Res (2003) 13:2498–504. doi: 10.1101/gr.1239303
19. Robinson MD, McCarthy DJ, Smyth GK. edgeR: a Bioconductor package for differential expression analysis of digital gene expression data. Bioinformatics (2010) 26:139–40. doi: 10.1093/bioinformatics/btp616
20. Jia X, Zhai T. Integrated Analysis of Multiple Microarray Studies to Identify Novel Gene Signatures in Non-alcoholic Fatty Liver Disease. Front Endocrinol (Lausanne) (2019) 10:599. doi: 10.3389/fendo.2019.00599
21. Ye J, Lv L, Wu W, Li Y, Shi D, Fang D, et al. Butyrate Protects Mice Against Methionine-Choline-Deficient Diet-Induced Non-alcoholic Steatohepatitis by Improving Gut Barrier Function, Attenuating Inflammation and Reducing Endotoxin Levels. Front Microbiol (2018) 9:1967. doi: 10.3389/fmicb.2018.01967
22. Baciu C, Pasini E, Angeli M, Schwenger K, Afrin J, Humar A, et al. Systematic integrative analysis of gene expression identifies HNF4A as the central gene in pathogenesis of non-alcoholic steatohepatitis. PLoS One (2017) 12:e0189223. doi: 10.1371/journal.pone.0189223
23. Feng G, Li XP, Niu CY, Liu ML, Yan QQ, Fan LP, et al. Bioinformatics analysis reveals novel core genes associated with nonalcoholic fatty liver disease and nonalcoholic steatohepatitis. Gene (2020) 742:144549. doi: 10.1016/j.gene.2020.144549
24. Liu J, Lin B, Chen Z, Deng M, Wang Y, Wang J, et al. Identification of key pathways and genes in nonalcoholic fatty liver disease using bioinformatics analysis. Arch Med Sci (2020) 16:374–85. doi: 10.5114/aoms.2020.93343
25. Li L, Liu H, Hu X, Huang Y, Wang Y, He Y, et al. Identification of key genes in nonalcoholic fatty liver disease progression based on bioinformatics analysis. Mol Med Rep (2018) 17:7708–20. doi: 10.3892/mmr.2018.8852
26. Bae JS, Park JM, Lee J, Oh BC, Jang SH, Lee YB, et al. Amelioration of non-alcoholic fatty liver disease with NPC1L1-targeted IgY or n-3 polyunsaturated fatty acids in mice. Metabolism. (2017) 66:32–44. doi: 10.1016/j.metabol.2016.10.002
27. Liang H, Huang H, Tan PZ, Liu Y, Nie JH, Zhang YT, et al. Effect of iron on cholesterol 7alpha-hydroxylase expression in alcohol-induced hepatic steatosis in mice. J Lipid Res (2017) 58:1548–60. doi: 10.1194/jlr.M074534
28. Li T, Matozel M, Boehme S, Kong B, Nilsson LM, Guo G, et al. Overexpression of cholesterol 7alpha-hydroxylase promotes hepatic bile acid synthesis and secretion and maintains cholesterol homeostasis. Hepatology (2011) 53:996–1006. doi: 10.1002/hep.24107
29. Jiao N, Baker SS, Chapa-Rodriguez A, Liu W, Nugent CA, Tsompana M, et al. Suppressed hepatic bile acid signalling despite elevated production of primary and secondary bile acids in NAFLD. Gut (2018) 67:1881–91. doi: 10.1136/gutjnl-2017-314307
30. Min HK, Kapoor A, Fuchs M, Mirshahi F, Zhou H, Maher J, et al. Increased hepatic synthesis and dysregulation of cholesterol metabolism is associated with the severity of nonalcoholic fatty liver disease. Cell Metab (2012) 15:665–74. doi: 10.1016/j.cmet.2012.04.004
31. Kempinska K, Malik B, Borkin D, Klossowski S, Shukla S, Miao H, et al. Pharmacologic Inhibition of the Menin-MLL Interaction Leads to Transcriptional Repression of PEG10 and Blocks Hepatocellular Carcinoma. Mol Cancer Ther (2018) 17:26–38. doi: 10.1158/1535-7163.MCT-17-0580
32. Bang H, Ha SY, Hwang SH, Park CK. Expression of PEG10 Is Associated with Poor Survival and Tumor Recurrence in Hepatocellular Carcinoma. Cancer Res Treat (2015) 47:844–52. doi: 10.4143/crt.2014.124
33. Arendt BM, Teterina A, Pettinelli P, Comelli EM, Ma DWL, Fung SK, et al. Cancer-related gene expression is associated with disease severity and modifiable lifestyle factors in non-alcoholic fatty liver disease. Nutrition (2019) 62:100–7. doi: 10.1016/j.nut.2018.12.001
34. Hasenfuss SC, Bakiri L, Thomsen MK, Williams EG, Auwerx J, Wagner EF. Regulation of steatohepatitis and PPARgamma signaling by distinct AP-1 dimers. Cell Metab (2014) 19:84–95. doi: 10.1016/j.cmet.2013.11.018
35. Liu S, Yao X, Zhang D, Sheng J, Wen X, Wang Q, et al. Analysis of Transcription Factor-Related Regulatory Networks Based on Bioinformatics Analysis and Validation in Hepatocellular Carcinoma. BioMed Res Int (2018) 2018:1431396. doi: 10.1155/2018/1431396
36. Barrett CS, Millena AC, Khan SA. TGF-beta Effects on Prostate Cancer Cell Migration and Invasion Require FosB. Prostate (2017) 77:72–81. doi: 10.1002/pros.23250
37. Kaposi-Novak P, Libbrecht L, Woo HG, Lee YH, Sears NC, Coulouarn C, et al. Central role of c-Myc during malignant conversion in human hepatocarcinogenesis. Cancer Res (2009) 69:2775–82. doi: 10.1158/0008-5472.CAN-08-3357
38. Brown ZJ, Fu Q, Ma C, Kruhlak M, Zhang H, Luo J, et al. Carnitine palmitoyltransferase gene upregulation by linoleic acid induces CD4(+) T cell apoptosis promoting HCC development. Cell Death Dis (2018) 9:620. doi: 10.1038/s41419-018-0687-6
39. Edmunds LR, Otero PA, Sharma L, D’Souza S, Dolezal JM, David S, et al. Abnormal lipid processing but normal long-term repopulation potential of myc-/- hepatocytes. Oncotarget (2016) 7:30379–95. doi: 10.18632/oncotarget.8856
40. Wu W, Li W, Wei J, Wang C, Yao Y, Zhu W, et al. Chronic intermittent hypoxia accelerates liver fibrosis in rats with combined hypoxia and nonalcoholic steatohepatitis via angiogenesis rather than endoplasmic reticulum stress. Acta Biochim Biophys Sin (Shanghai) (2019) 51:159–67. doi: 10.1093/abbs/gmy169
41. Cobbina E, Akhlaghi F. Non-alcoholic fatty liver disease (NAFLD) - pathogenesis, classification, and effect on drug metabolizing enzymes and transporters. Drug Metab Rev (2017) 49:197–211. doi: 10.1080/03602532.2017.1293683
42. Cressman DE, Greenbaum LE, DeAngelis RA, Ciliberto G, Furth EE, Poli V, et al. Liver failure and defective hepatocyte regeneration in interleukin-6-deficient mice. Science (1996) 274:1379–83. doi: 10.1126/science.274.5291.1379
43. Kovalovich K, Li W, DeAngelis R, Greenbaum LE, Ciliberto G, Taub R. Interleukin-6 protects against Fas-mediated death by establishing a critical level of anti-apoptotic hepatic proteins FLIP, Bcl-2, and Bcl-xL. J Biol Chem (2001) 276:26605–13. doi: 10.1074/jbc.M100740200
44. Zhang X, Tachibana S, Wang H, Hisada M, Williams GM, Gao B, et al. Interleukin-6 is an important mediator for mitochondrial DNA repair after alcoholic liver injury in mice. Hepatology (2010) 52:2137–47. doi: 10.1002/hep.23909
45. Zhang L, Yang Z, Ma A, Qu Y, Xia S, Xu D, et al. Growth arrest and DNA damage 45G down-regulation contributes to Janus kinase/signal transducer and activator of transcription 3 activation and cellular senescence evasion in hepatocellular carcinoma. Hepatology (2014) 59:178–89. doi: 10.1002/hep.26628
46. Wang SY, Feng LY, Meng ZQ. Bicluster and pathway enrichment analysis related to tumor progression of hepatocellular carcinoma. Eur Rev Med Pharmacol Sci (2015) 19:1191–7.
47. Hu DG, McKinnon RA, Hulin JA, Mackenzie PI, Meech R. Novel Nine-Exon AR Transcripts (Exon 1/Exon 1b/Exons 2-8) in Normal and Cancerous Breast and Prostate Cells. Int J Mol Sci (2016) 18:40–63. doi: 10.3390/ijms18010040
Keywords: nonalcoholic steatohepatitis, hepatic steatosis, microarray, differentially expressed genes, integrated analysis
Citation: Ye J, Lin Y, Wang Q, Li Y, Zhao Y, Chen L, Wu Q, Xu C, Zhou C, Sun Y, Ye W, Bai F and Zhou T (2020) Integrated Multichip Analysis Identifies Potential Key Genes in the Pathogenesis of Nonalcoholic Steatohepatitis. Front. Endocrinol. 11:601745. doi: 10.3389/fendo.2020.601745
Received: 01 September 2020; Accepted: 30 October 2020;
Published: 26 November 2020.
Edited by:
Pieter de Lange, University of Campania Luigi Vanvitelli, ItalyReviewed by:
Dragos Cretoiu, Carol Davila University of Medicine and Pharmacy, RomaniaMarta Letizia Hribal, University of Catanzaro, Italy
Copyright © 2020 Ye, Lin, Wang, Li, Zhao, Chen, Wu, Xu, Zhou, Sun, Ye, Bai and Zhou. This is an open-access article distributed under the terms of the Creative Commons Attribution License (CC BY). The use, distribution or reproduction in other forums is permitted, provided the original author(s) and the copyright owner(s) are credited and that the original publication in this journal is cited, in accordance with accepted academic practice. No use, distribution or reproduction is permitted which does not comply with these terms.
*Correspondence: Fumao Bai, baifumao2ll@foxmail.com; Tieli Zhou, wyztli@163.com
†These authors have contributed equally to this work