 Carmela Colica1
 Elisa Mazza2
 Yvelise Ferro2Antonietta Fava2Daniele De Bonis2Marta Greco3
 Daniela Patrizia Foti3Elio Gulletta3Stefano Romeo2,4Arturo Pujia2
 Tiziana Montalcini5*
- 1Institute of Molecular Bioimaging and Physiology, CNR, Organizational Support Unit, University Magna Grecia, Catanzaro, Italy
- 2Department of Medical and Surgical Science, Nutrition Unit, University Magna Grecia, Catanzaro, Italy
- 3Department of Health Science, Laboratory Unit, University Magna Grecia, Catanzaro, Italy
- 4Department of Molecular and Clinical Medicine, Sahlgrenska Center for Cardiovascular and Metabolic Research, University of Gothenburg, Göteborg, Sweden
- 5Department of Clinical and Experimental Medicine, Nutrition Unit, University Magna Grecia, Catanzaro, Italy
Purpose: Although the role of dietary factors in the prevention of bone loss and fractures has been investigated in many studies, few studies have examined the association between dietary patterns and total body bone density. Our aim was to determine the relations between dietary patterns and whole-body bone mineral density (WB-BMD) and the association between dietary patterns, fractures, and multiple fractures in the elderly.
Methods: This cross-sectional study included 177 individuals aged ≥65 years. A dual X-ray absorptiometry scan was performed to measure BMD. Dietary patterns were ascertained by a combination of dietary intake assessment and principal components analysis.
Results: Only three dietary patterns correlated with whole-body bone density. The multivariate-adjusted mean bone density across tertiles of these dietary patterns showed that the highest tertile of both the patterns 1 and 2 had a significantly higher bone density than the lowest tertile (pattern 1: 1.021 ± 0.01 and 1.070 ± 0.01 g/cm2 for T1 and T3, respectively; p = 0.043; pattern 2: 1.023 ± 0.01, and 1.081 ± 0.01 g/cm2 for T1 and T3, respectively; p = 0.003). We also find significant gender difference in these results. The highest adherence to the dietary pattern 5 was associated with decreased odds of having fractures (OR = 0.20, p = 0.009), and adherence to the pattern 1 was negatively associated with multiple fractures.
Conclusion: A high adherence to the dietary pattern 1 (high intake of grains, fish and olive oil) was associated with a high BMD and a low number of fractures. The highest adherence to the dietary pattern 5 (legumes and wine) was associated with decreased odds of having fractures. Our finding would suggest a potential bone-preserving properties of specific dietary patterns in the elderly.
Introduction
The potential role of multiple dietary factors on bone health and fracture risk has been widely reported (1). Adherence to a healthy dietary pattern consisting in the intake of a high amount of fruit, vegetables, whole grains, fish, nuts, and legumes and low-fat dairy products decreases osteoporosis and fracture risk (1). It has been found that an increased intake of nutrient-dense foods (that provide a high amount of nutrients but have relatively few calories) together with a low intake of sweet foods is associated with a low risk for osteoporosis and fractures in adults and elderly individuals (2, 3). Diet is more related to fracture in older individuals (2), possibly since food choices matter more in older individuals (2). However, the relationship of nutrients–bone mass is complex and needs further in-depth investigation. For instance, it is not clear whether whole grains, fruits, and vegetables have beneficial effects on bone due to the alkaline ash these foods create or direct effect of the minerals on bone cells. Studies testing the cumulative effects of a combination of nutrients on bone mineral density (BMD) seem to provide more realistic results than studies on the potential effect of an individual nutrient because such nutrient effects might be too small to be identify (4). In addition, the majority of studies have investigated the relationship between nutrients or dietary patterns and spine and/or hip BMD (1–3). It is well accepted, however, that there may be a discordance in the diagnosis of osteoporosis using spine and hip bone densitometry (5). Osteoarthritis in these two sites may have dramatic effects on BMD measurements in the elderly (6, 7). In particular, the effect of osteophytes may be sufficient enough to cause 20–50% of men and 10–25% of women to be misdiagnosed (7). Proximal femur fracture, implants or a difficult femur rotation due to arthritis or pain render BMD measurement inaccurate and may vary between skeletal sites, especially in the elderly (6). There is a close relationship between whole-body (WB)-BMD and that assessed by spine and hip scans (8) and between WB-BMD and fractures (9). However, few studies have investigated the association between dietary patterns and WB-BMD. While postmenopausal osteoporosis causes accelerated trabecular bone resorption and tends to involve the spine, femur, and wrist, senile osteoporosis affects both trabecular and cortical bone, resulting in characteristic fractures of the proximal humerus, tibia, pelvis, and hip (10), thus a WB-BMD assessment may be a precious methodology in the elderly. For these reasons, in this study the main measurement outcome was WB-BMD. The objective of the present study was to determine the relations between dietary patterns and WB-BMD and the possible association between dietary patterns and fractures and the number of fractures (multiple fractures) in a population of elderly individuals.
Materials and Methods
This is a cross-sectional study conducted from February 2013 to June 2014, whose protocol was approved by the local ethics committee at the “Mater Domini” University Hospital in Catanzaro, Italy and approved by the Italian Ministry of Health (projects codes 2011.48). The participants were invited to participate in the study by newspapers advertisements. We enrolled white, community-dwelling individuals aged ≥65 years from Calabria, southern Italy. Subjects were excluded if they presented any clinical condition affecting bone metabolism (such as kidney, liver, thyroid or parathyroids, rheumatic diseases, malabsorption syndromes, malignant tumors, or hematological diseases). No patients were taking dietary supplements, psychotropic drugs, glucocorticoids, estrogens, thyroid hormone, fluoride, or calcitonin as ascertained from their medical history, a physical examination, and laboratory tests (11, 12). Undergoing therapy for osteoporosis, hypertension, hyperlipidemia, and diabetes was not considered an exclusion criterion.
All participants underwent a WB-dual X-ray absorptiometry scan to measure WB-BMD. Written informed consent was obtained from participants. The investigation conforms to the principles outlined in the Declaration of Helsinki (13).
Fractures Assessment
The prevalence of morphological vertebral fractures was determined by lateral thoracolumbar radiographs which were read by a radiologist. A vertebral fracture was quantitatively defined as a loss of height in the anterior, middle, or posterior dimension of the vertebral body that exceeded 20% relative to normal looking adjacent vertebra or relative to what one would expect normal vertebral height to be at that level (14). In addition to changes in dimension, vertebral fractures were detected on the basis of the presence of endplate deformities, the lack of parallelism of the endplates, and the general altered appearance compared with neighboring vertebrae (14).
Non-vertebral fractures were assessed through interviews or the evaluation of clinical records (when available). Fractures number was estimated for each participants. Pathological or high-energy fractures such as those caused by major trauma (e.g., motor vehicle accidents, a fall from a height higher than standing), and fractures in sites not commonly associated with osteoporosis such as those of the fingers, face, skull, and toes, were not taken into account.
Dietary Intake Assessment
Dietary intake data were assessed by a 24-h recall and a 7-day food record, and calculated using nutritional software MetaDieta 3.0.1 (Metedasrl, San Benedetto del Tronto, Italy) (11). Participants ate freely and self-reported their intake. Precisely, the 24-h recall was performed via a face-to-face interview with a dietitian who used images associated with a comprehensive food list. The recall required 15–20 min to complete for each participant. The patients were also asked to report any ingredients, food and food waste in a food diary for a 7-day period. Each patient was trained by a skilled dietitian before starting the study. The dietitian showed how various foods should be recorded. The portion sizes used were based on the typical or natural portion consumed (e.g., a slice of bread, one egg). When a typical portion size was not obvious, a commonly used portion size was selected (e.g., one cup). We focused on major food groups, such as consumption of fish, meat, cereals, fruits, olive oil, wine, legumes, eggs, milk, potatoes, vegetables, sugary drinks, animal fats/margarines, and cake/pies. The database used to calculate energy intake was derived primarily from INRAN (National Institute of Food Research) 2000 and IEO (European Institute of Oncology) 2008 (11). This database includes over 5,000 foods and brand name products, and is updated annually.
Assessment of the Factors and Medications Influencing BMD
We assessed the presence of the factors, such as diabetes, obesity, smoking, sufficient levels of physical activity (SPA), and medications use which may affect bone, from clinical records and patients interview (15, 16). Obesity was defined by the presence of a body mass index (BMI) ≥30 kg/m2 (17). Definition of SPA was the following: 150 min total of walking, moderate or vigorous PA per week (16).
Biochemical Evaluation
Venous blood was collected after fasting overnight into vacutainer tubes (Becton & Dickinson, Plymouth, England) and centrifuged within 4 h. Serum glucose, creatinine, and calcium were measured with enzymatic colorimetric test. 25-hydroxy vitamin D—25OH D—was measured by radioimmunoassay (normal value 30–100 ng/mL). Quality control was assessed daily for all determinations.
WB-BMD Measurement
Whole-body bone mineral density was measured using a dual X-ray absorptiometry (DXA) scan (Hologic QDR Inc., MA, USA). BMD was expressed as the amount of mineral (grams) divided by the area scanned (square centimeters) (12). Bone density was then expressed as the T score defined as the number of SDs from the healthy young adult mean while the Z score was the number of SDs in comparison to healthy subjects of the same age (12, 18). The DXA instrument was calibrated daily in accordance with the manufacturer’s recommendations. The in vivo precision was <1%.
Statistical Analysis
Data are reported as mean ± SD. To find a 4% difference (~0.040 g/cm2 of BMD) between high and low tertiles of dietary pattern scores, considering a SD (S) of the outcome in the population equal to 0.07 and an effect size (E) equal to 0.04 with a E/S ratio equal to 0.60, with 80% power on a two-sided level of significance of 0.05, 44 subjects each group are required.
Food Pattern Analysis
We obtained food patterns by using the principal components analysis (PCA) (11, 19). The goal of this analysis is to transform a given data set of large dimension to an alternative data set of smaller dimension. The food variables were correlated together (correlation coefficients r > 0.4). The orthogonal rotation (obtained with varimax option) was used to derive food patterns (non-correlated components). To fix the number of components to retain, a screen plot of the eigenvalues, that derived from the correlation matrix of the standardized variables, was examined. The eigenvalue is a value that indicates the proportion of the variance in consumption explained by each component. According to the Kaiser criterion, the number of components that should be retained from PCA is equal to the number of eigenvalues that are greater than 1. The food patterns were named according to scores of the foods that correlated most with the factor (>0.4). A higher absolute values in the correlation coefficients indicated that the food variable contributes most to the construction of the component. Principal components are the directions where there is the most variance. The eigenvector with the highest eigenvalue is therefore the principal components. Thus, the data set was reduced from large dimensions (the average consumption of single types of food in grams per person/day) to only six patterns by ignoring all the eigenvectors that have insignificant eigenvalues.
Association between Dietary Patterns and WB-BMD
Pearson’s correlations were used to identify the dietary patterns (i.e., factors scores as continuous variables) and the variables (i.e., age, BMI, serum glucose, calcium, creatinine, and vitamin D) correlated with WB-BMD, given that the continuous variables were normally distributed. We also tested the correlations with the medications and fractures as binary variables.
Dietary pattern scores were categorized into tertiles (high, medium, and low levels) to provide sensitive indicators of the food intake level to assess the association of a food pattern intake to the WB-BMD. In the whole population, we compared the adjusted mean for each tertiles of each dietary pattern using the general linear model and performing two models. In model 1, we adjusted for BMI, glucose, and creatinine (according with the Pearson’s correlations); in model 2, we further adjusted for gender, medications (as antiosteoporotics, antihypertensives, anticoagulants, antidiabetics, statins, calcium, and vitamin D supplements), and current smoking. We also performed this statistical analysis by gender. P values to test for linear trends were calculated by using dietary pattern scores as a continuous variable after control for possible confounding factors.
Association between Dietary Patterns, Fractures, and Number of Fractures
We classified the population in two groups according to the presence of fracture (i.e., individuals with vs. without fracture). Then, we used a multinomial logistic regression analysis to estimate the adjusted odds ratios (ORs) for the lowest and middle tertile of the dietary patterns intakes of having a fracture as compared with the highest tertile group (reference category).
Furthermore, we categorized the population according to the presence of “multiple fractures” (i.e., participants with only one fracture vs. those with more than one fracture). A binary logistic regression analysis was performed to test the association between all of the potentially confounding variables and dietary patterns (as independent variables), with “multiple fracture” serving as the dependent variable (potential confounders were all those factors correlated in the univariate analysis with a p value <0.1).
Significant differences were assumed to be present at p < 0.05 (two-tailed). All comparisons were performed using SPSS 20.0 for Windows (IBM Corporation, New York, NY, USA).
Results
A total of 177 individuals (63% female) were enrolled. Table 1 shows the characteristics of the study population and Table 2 shows the food groups used in the PCA. The mean age was 69 ± 3 years. The mean energy intake was 1,867 ± 449 kcal (1,884 ± 478 in male and 1,858 ± 433 in female). A total of 41 participants (23%) had fractures (total fractures number = 52; femoral n = 1; vertebral n = 6; other sites n = 45). More than one fracture was reported in nine individuals. None of the participants had a SPA. In Table S1 in Supplementary Material, we report the characteristics of the study population by gender. A significant difference exists regarding age (Table S1 in Supplementary Material).
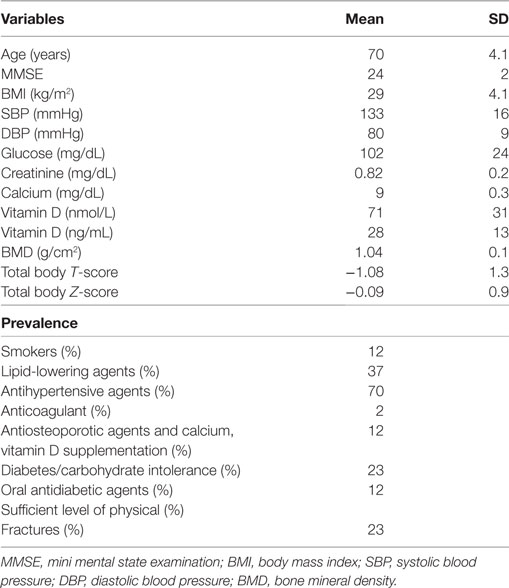
Table 1. Mean ± SD participants’ demographic, anthropometric, and clinical characteristics.
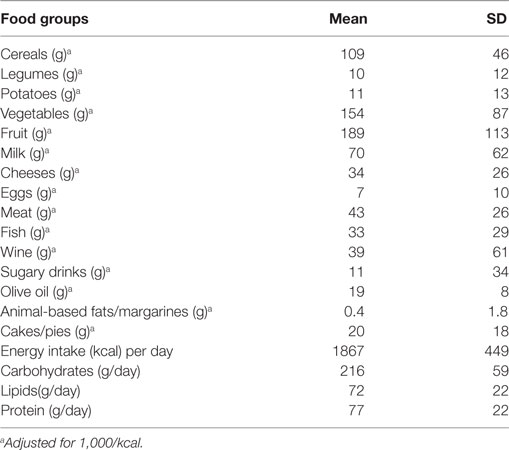
Table 2. Mean ± SD participants’ energy and food groups intake.
Food Patterns Analysis and Association with WB-BMD
Six dietary patterns were identified (screen plot in Figure 1), with a cumulative explained variance of 55%, namely: Pattern 1 dietary pattern characterized by a high intake of meat, grains, olive oil, and potatoes; Pattern 2, characterized by a high intake of fish, vegetables and milk; Pattern 3, characterized by a high intake of cheese, cakes and fruit; Pattern 4, characterized by a high intake of cheese and animal-based fats; Pattern 5, characterized by a high intake of eggs, legumes, and wine and Pattern 6, characterized by a high intake of cakes, biscuits, and sugary drinks.
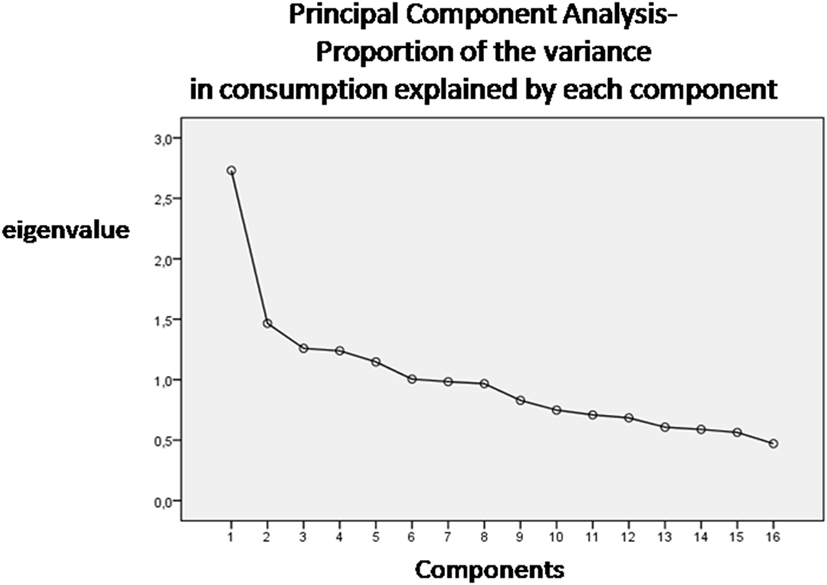
Figure 1. Screen plot of the eigenvalues–number of components (dietary patterns).
The following factors were correlated with WB-BMD: BMI (r = 0.14, p = 0.05), glucose (r = 0.24, p = 0.001), creatinine (r = 0.25, p = 0.001), statins (r = 0.15, p = 0.09), gender (r = 0.52, p = 0.001), antiosteoporotic agents (r = −0.16 and p = 0.065), and Pattern 1 (factor score as continuous variables, r = 0.19, p = 0.009), Pattern 2 (factor score, r = 0.14, p = 0.064), and Pattern 5 (factor score, r = 0.13, p = 0.096) (table not shown). No association with BMD was seen for any other dietary pattern.
The multivariate-adjusted mean WB-BMD across tertiles of all three dietary patterns is shown in Table 3. A significant and positive linear trend was observed for WB-BMD across increasing tertiles of dietary patterns (P-trend <0.05 for each). The highest tertile of both the Pattern 1 and 2 had a significantly higher WB-BMD than the lowest tertile after adjustment (model 2) for non-dietary factors and medications (Pattern 1: 1.021 ± 0.01 and 1.070 ± 0.01 g/cm2 for T1 and T3, respectively; p = 0.043; Pattern 2: 1.023 ± 0.01, and 1.081 ± 0.01 g/cm2 for T1 and T3, respectively; p = 0.003; Table 3). Table S2 in Supplementary Material reports the principal tertile characteristics within each dietary pattern. In particular, the highest tertile of the pattern 1 had a significantly higher grains, fish, and olive oil consumption than the lowest tertile (p < 0.001; p = 0.007 and p < 0.001, respectively); the highest tertile of the pattern 2 had a significantly higher grains, vegetables and olive oil consumption than the lowest tertile (p = 0.002; p < 0.001 and p < 0.001, respectively); the highest tertile of the pattern 5 had a significantly higher legumes, wine, and olive oil consumption than the lowest tertile (p < 0.001; p < 0.001 and p = 0.03, respectively) (Table S2 in Supplementary Material).
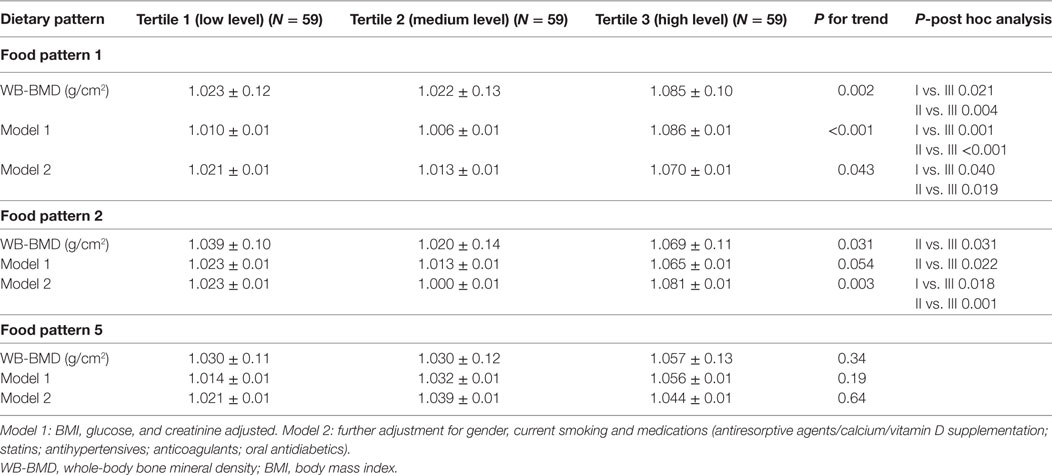
Table 3. Multivariate-adjusted mean WB-BMD across tertiles of dietary patterns- general linear model test.
Table S3 in Supplementary Material shows the multivariate-adjusted mean WB-BMD across tertiles of all dietary patterns by gender. In female, the highest tertile of the pattern 1 had a significantly higher adjusted WB-BMD than the lowest tertile (Table S3 in Supplementary Material). In male, the highest tertile of the pattern 2 had a significantly higher adjusted WB-BMD than the lowest tertile (Table S3 in Supplementary Material). We adjusted WB-BMD according with the variables which were significant different between gender (Table 2) and medications and current smoking.
Dietary Patterns and Decreased Odds of Having Fractures
Pearson’s correlation was performed to identify which dietary pattern correlated with fractures. Only dietary Pattern 5 was correlated (p = 0.01, r = −0.16) (table not shown).
With the multinomial logistic regression analysis, a significantly lower adjusted OR for “Fractures” was estimated in individuals for the Tertile II (T2, OR = 0.20, p = 0.009) than those in the Tertile I (T1, OR = 0.21, p = 0.01) (T3 reference category) (OR medications, BMI, current smoking, and gender adjusted) (Table 4).
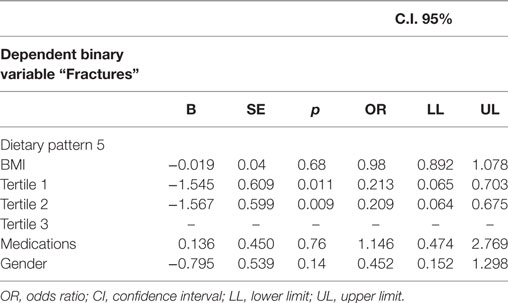
Table 4. Multinomial logistic regression analysis—“Fractures” being the dependent binary variable, adjusted predictions with 95% CI.
Association between Dietary Patterns and Fractures Number
The following factors were correlated with “multiple fractures”: BMI (p = 0.06, r = −0.29) and dietary pattern 1 (p = 0.038, r = −0.32; table not shown).
In the logistic regression analysis (Table 5), dietary pattern 1 remained negatively associated with multiple fractures (B = −1.27, p = 0.03; OR = 0.28, CI 0.08–0.89; the highest adherence the lowest risk).
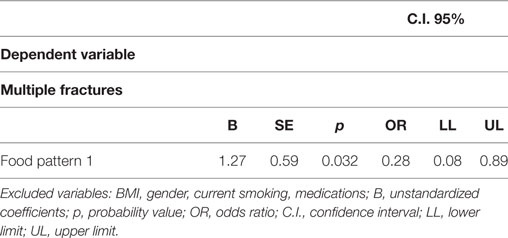
Table 5. Logistic regression analysis—dietary patterns and other factors associated with “multiple fractures” as binary variable (individuals with one fracture vs. those with more than one fracture).
No association with multiple fractures was seen for any other dietary patterns, BMI, and other potential confounding factors as gender, current smoking, and medications (Table 5).
Discussion
Using the PCA, an approach that considers overall eating patterns, we identified 6 dietary patterns in 177 elderly individuals aged ≥65 years. However, only three patterns (Patterns 1, 2, and 5, characterized, as a whole, by a high intake of meat, grains, olive oil, potatoes, wine, legumes, and eggs) were correlated with WB-BMD. We found that the highest tertile of both the dietary pattern 1 and 2 had a significantly higher WB-BMD than the lowest tertile, after adjustment for non-dietary factors and medications (Table 3). In particular, in female the highest tertile of the pattern 1 had a significantly higher WB-BMD than the lowest tertile, while in male, the highest tertile of the pattern 2 had a significantly higher WB-BMD than the lowest tertile (Table S3 in Supplementary Material). Although all the highest tertiles of these dietary patterns were high in olive oil, they had a significantly higher grains and fish (pattern 1), grains and vegetables (pattern 2), and legumes and wine (pattern 5) than the lowest tertiles (Table S2 in Supplementary Material). Finally, in the whole population, the highest adherence to the dietary pattern 5 was associated with decreased odds of having fractures (Table 4) and adherence to the dietary pattern 1 was negatively associated with multiple fractures (Table 5).
The choice of different foods in the elderly has a significant impact on bone health (17, 20), but there are also studies with negative findings (21–23). Few studies have investigated the association between dietary patterns and WB-BMD in the elderly (24, 25). In one study, the authors enrolled only adult women while, in our study, we investigated both genders (24). In another study, a greater adherence to an overall healthy lifestyle including adequate physical activity was associated with better BMD at various sites among elderly Chinese individuals (25). Compared to the aforementioned studies, our study can, therefore, viewed as an original investigation.
We investigated the potential effects of dietary patterns on WB-BMD since several biases are systematically found in older populations over the age of 65 years with a DXA scan (5–7). Disk degeneration and fractures increase vertebral and/or hip BMD, aortic calcifications project additional minerals in the spine area. In one study, lumbar spine osteophytes affected 75% of men and 61.1% of women, and hip osteophytes affected 31.7% of men and 27.4% of women (7). Furthermore, bone loss predominantly regards the cortical bone in the elderly (10), and a strong association between WB- BMD and fractures was reported (9). However, aside from the accuracy in the diagnosis of osteoporosis (26), our study can be considered important as it could reveal a new approach to maintaining BMD.
Our results are, to some extent, confirmed by those reported in previous studies focusing on femoral BMD. In one study, adherence to a fruit, vegetable, and dairy pattern was associated with high femoral BMD and a low risk of fractures (3). The combined intake of vegetables, meat, fish, potatoes and wine has also been shown to be associated with a high femoral BMD in a population of middle-aged and elderly subjects (27). In this study two dietary patterns, similar to those involved in our study, were associated with a higher BMD: a “Traditional” pattern, characterized by a high intake of potatoes, meat and fat, and a “Health conscious” dietary pattern, characterized by a high intake of fruit, vegetables, poultry, fish, and alcohol (27). A dietary pattern including a high consumption of fish and olive oil, as in our pattern 1, was positively related to WB-BMD in adult women (24) confirming our results in women (Table S3 in Supplementary Material). In addition, in one study, both legumes and meat intake independently reduced the risk of hip fracture by 40–64% (28), partially confirming our findings (Tables 3 and 4).
In our study, males and females have the same amount of energy intake. Probably, women were significantly more likely to perceive themselves as susceptible to osteoporosis than male, perceiving greater benefits from nutrients intake (29).
Although our study was not designed to investigate the mechanisms underlying the association between dietary pattern and BMD or bone loss, our results highlight the important effect of a combination of nutrients on bone. The anti-inflammatory effect associated with an adherence to a dietary pattern including whole grains, olive oil, legumes, vegetables, and fish are well known (30), which could be crucial in preventing age- and menopause-related bone loss (31). A dietary pattern high in protein, as in the pattern 1 (highest tertiles = 68 g/die) and 2 (highest tertile = 77 g/die) has a protective effect on bone probably because the dietary protein intake increases the absorption of calcium in the intestine, the serum level of the anabolic hormone insulin-like growth factor 1 and decreases the serum parathyroid hormone (32).
Zinc, copper, manganese, and other micronutrients found in abundance in fruit and vegetables may also have an important role since they are known to be essential metallic cofactors for enzymes involved in the synthesis of various bone matrix components (33). The similarity in structure between isoflavones and estrogen together with the findings that isoflavones possess an estrogenic activity, as shown by several studies, provide the basis for speculation that isoflavones from legumes may promote bone health and reduce the risk of fracture (34).
Our finding, therefore, highlight the potential bone-preserving properties of specific dietary patterns in the elderly and should encourage the elderly to increase their weekly intake of specific food groups (for example, more than three serving of cereals and vegetables per day and three servings of meat and legumes per week).
Strengths and Limitations
Our study has several strengths. We investigate the influence of medications and other non-dietary factors on the associations between dietary pattern and WB-BMD (Table 3). The use of a PCA to determine dietary patterns provides a realistic reflection of dietary patterns in a study population, and the six patterns identified in this study explain 55% of the overall variance. However, we also recognize various limitations. Residual confounding related to a general healthy lifestyle might still be present. PCA does not automatically provide the most optimal dietary pattern. Our sample size is relatively small and generalizability to other groups with different dietary patterns is not possible. Of course, with a cross-sectional study there is no evidence of a temporal relationship between exposure and outcome. However, few studies have investigated the association between dietary patterns and WB-BMD in the elderly. Thus, these results may suggest the hypotheses for a future, more complex, investigation. Finally, none of the bone turnover markers, which have a large day-to-day variations especially in patients with fractures (35), were assessed.
Conclusion
This investigation emphasizes the possible key role of a dietary pattern, characterized by a high intake of meat, grains, olive oil, and potatoes and a dietary pattern characterized by a high intake of fish, vegetables, and milk in preserving WB-BMD. The highest adherence to the dietary pattern 5 characterized by a high intake in legumes, eggs, and wine, was also associated with decreased odds of having fractures and the high adherence to the dietary pattern 1 was associated with a low number of fractures.
Ethics Statement
This study protocol was approved by the local ethics committee at the “Mater Domini” University Hospital in Catanzaro, Italy (projects codes 2011.48) and approved by the Italian Ministry of Health with written informed consent from all subjects. The investigation conforms to the principles outlined in the Declaration of Helsinki.
Author Contributions
TM and AP were responsible for study design, data analysis, manuscript writing. CC, EM, AF, and YF were responsible for data collection and integrity of data. CC, AF, and YF were responsible for enrollment. EM, AF, and DB were responsible for anthropometric and nutritional measurements. MG, DPF, SR, and EG were responsible for laboratory assessment. All authors approved final manuscript.
Conflict of Interest Statement
The authors CC, EM, YF, AF, DB, MG, DF, EG, SR, AP, and TM declare that they have no competing interests.
The reviewer AS and handling Editor declared their shared affiliation.
Funding
This study was supported by a grant from the Italian Ministry of Health (GR 2009-1567179).
Supplementary Material
The Supplementary Material for this article can be found online at http://www.frontiersin.org/articles/10.3389/fendo.2017.00344/full#supplementary-material.
Abbreviations
BMI, body mass index; WB-BMD, whole-body bone mineral density; DXA, dual X-ray absorptiometry; 25OH-vitamin D, 25-hydroxy-vitamin D; PCA, principal components analysis; SPA, sufficient levels of physical activity.
References
1. Movassagh EZ, Vatanparast H. Current evidence on the association of dietary patterns and bone health: a scoping review. Adv Nutr (2017) 8:1–16. doi:10.3945/an.116.013326
2. Langsetmo L, Hanley DA, Prior JC, Barr SI, Anastassiades T, Towheed T, et al. Dietary patterns and incident low-trauma fractures in postmenopausal women and men aged ≥50 y: a population-based cohort study. Am J Clin Nutr (2011) 93:192–9. doi:10.3945/ajcn.110.002956
3. de Jonge EA, Kiefte-de Jong JC, Hofman A, Uitterlinden AG, Kieboom BC, Voortman T, et al. Dietarypatterns explaining differences in bone mineral density and hip structure in the elderly: the Rotterdam Study. Am J Clin Nutr (2017) 105:203–11. doi:10.3945/ajcn.116.139196
4. Hu FB. Dietary pattern analysis: a new direction in nutritional epidemiology. Curr Opin Lipidol (2002) 13:3–9. doi:10.1097/00041433-200202000-00002
5. El Maghraoui A, MouingaAbayi DA, Rkain H, Mounach A. Discordance in diagnosis of osteoporosis using spine and hip bone densitometry. J Clin Densitom (2007) 10:153–6. doi:10.1016/j.jocd.2006.12.003
6. Moayyeri A, Soltani A, Tabari NK, Sadatsafavi M, Hossein-Neghad A, Larijani B. Discordance in diagnosis of osteoporosis using spine and hip bone densitometry. BMC Endocr Disord (2005) 5:3. doi:10.1186/1472-6823-5-3
7. Liu G, Peacock M, Eilam O, Dorulla G, Braunstein E, Johnston CC. Effect of osteoarthritis in the lumbar spine and hip on bone mineral density and diagnosis of osteoporosis in elderly men and women. Osteoporos Int (1997) 7:564–9. doi:10.1007/BF02652563
8. Franck H, Munz M. Total body and regional bone mineral densitometry (BMD) and soft tissue measurements: correlations of BMD parameter to lumbar spine and hip. Calcif Tissue Int (2000) 67:111–5. doi:10.1007/s00223001124
9. Schott AM, Cormier C, Hans D, Favier F, Hausherr E, Dargent-Molina P, et al. How hip and whole-body bone mineral density predict hip fracture in elderly women: the EPIDOS Prospective Study. Osteoporos Int (1998) 8:247–54. doi:10.1007/s001980050061
10. Riggs BL, Melton LJ III. Involutional osteoporosis. N Engl J Med (1986) 314:1676–86. doi:10.1056/NEJM198606263142605
11. Mazza E, Fava A, Ferro Y, Moraca M, Rotundo S, Colica C, et al. Impact of legumes and plant proteins consumption on cognitive performances in the elderly. J Transl Med (2017) 15:109. doi:10.1186/s12967-017-1209-5
12. Montalcini T, Gallotti P, Coppola A, Zambianchi V, Fodaro M, Galliera E, et al. Association between low C-peptide and low lumbar bone mineral density in postmenopausal women without diabetes. Osteoporos Int (2015) 26:1639–46. doi:10.1007/s00198-015-3040-2
13. World Medical Association. World Medical Association Declaration of Helsinki: ethical principles for medical research involving human subjects. JAMA (2013) 310:2191–4. doi:10.1001/jama.2013.281053
14. Genant HK, Wu CY, van Kuijk C, Nevitt MC. Vertebral fracture assessment using a semiquantitative technique. J Bone Miner Res (1993) 8:1137–48. doi:10.1002/jbmr.5650080915
15. Pujia A, Gazzaruso C, Ferro Y, Mazza E, Maurotti S, Russo C, et al. Individuals with metabolically healthy overweight/obesity have higher fat utilization than metabolically unhealthy individuals. Nutrients (2016) 8(1):2. doi:10.3390/nu8010002
16. Armstrong T, Bauman A, Davies J. Physical Activity Patterns of Australian Adults. Results of the 1999 National Physical Activity Survey. Canberra: AIHW (2000).
17. Benetou V, Orfanos P, Pettersson-Kymmer U, Bergström U, Svensson O, Johansson I, et al. Mediterranean diet and incidence of hip fractures in a European cohort. Osteoporos Int (2013) 24:1587–98. doi:10.1007/s00198-012-2187-3
18. Larussa T, Suraci E, Nazionale I, Leone I, Montalcini T, Abenavoli L, et al. No evidence of circulating autoantibodies against osteoprotegerin in patientswith celiac disease. World J Gastroenterol (2012) 18:1622–7. doi:10.3748/wjg.v18.i14.1622
19. Panagiotakos DB, Pitsavos C, Skoumas Y, Stefanadis C. The association between food patterns and the metabolic syndrome using principal components analysis: the ATTICA Study. J Am Diet Assoc (2007) 107:979–87. doi:10.1016/j.jada.2007.03.006
20. Tucker KL, Hannan MT, Chen H, Cupples LA, Wilson PW, Kiel DP. Potassium, magnesium, and fruit and vegetable intakes are associated with greater bone mineral density in elderly men and women. Am J Clin Nutr (1999) 69:727–36.
21. McTiernan A, Wactawski-Wende J, Wu L, Rodabough RJ, Watts NB, Tylavsky F, et al. Women’s Health Initiative Investigators. Low-fat, increased fruit, vegetable, and grain dietary pattern, fractures, and bone mineral density: the Women’s Health Initiative Dietary Modification Trial. Am J Clin Nutr (2009) 89:1864–76. doi:10.3945/ajcn.2008.26956
22. Hamidi M, Boucher BA, Cheung AM, Beyene J, Shah PS. Fruit and vegetable intake and bone health in women aged 45 years and over: a systematic review. Osteoporos Int (2011) 22:1681–93. doi:10.1007/s00198-010-1510-0
23. Macdonald HM, New SA, Golden MH, Campbell MK, Reid DM. Nutritional associations with bone loss during the menopausal transition: evidence of beneficial effect of calcium, alcohol, and fruit and vegetable nutrients and of detrimental effect of fatty acids. Am J Clin Nutr (2004) 79(1):155–65.
24. Kontogianni MD, Melistas L, Yannakoulia M, Malagaris I, Panagiotakos DB, Yiannakouris N. Association between dietary patterns and indices of bone mass in a sample of Mediterranean women. Nutrition (2009) 25:165–71. doi:10.1016/j.nut.2008.07.019
25. Liu ZM, Wong CK, Wong SY, Leung J, Tse LA, Chan R, et al. Healthier lifestyle pattern for cardiovascular risk reduction is associated with better bone mass in southern Chinese elderly men and women. Medicine (2015) 94:e1283. doi:10.1097/MD.0000000000001283
26. Lewiecki EM, Watts NB, McClung MR, Petak SM, Bachrach LK, Shepherd JA, et al. International Society for Clinical Densitometry. Official positions of the international society for clinical densitometry. J Clin Endocrinol Metab (2004) 89:3651–5. doi:10.1210/jc.2004-0124
27. de Jonge EA, Rivadeneira F, Erler NS, Hofman A, Uitterlinden AG, Franco OH, et al. Dietary patterns in an elderly population and their relation with bone mineral density: the Rotterdam Study. Eur J Nutr (2016). doi:10.1007/s00394-016-1297-7
28. Lousuebsakul-Matthews V, Thorpe DL, Knutsen R, Beeson WL, Fraser GE, Knutsen SF. Legumes and meat analogues consumption are associated with hip fracture risk independently of meat intake among Caucasian men and women: the Adventist Health Study-2. Public Health Nutr (2014) 17:2333–43. doi:10.1017/S1368980013002693
29. Sedlak CA, Doheny MO, Estok PJ, Zeller RA, Winchell J. DXA, health beliefs, and osteoporosis prevention behaviors. J Aging Health (2007) 19:742–56. doi:10.1177/0898264307304303
30. Chrysohoou C, Panagiotakos DB, Pitsavos C, Das UN, Stefanadis C. Adherence to the Mediterranean diet attenuates inflammation and coagulation process in healthy adults: the ATTICA Study. J Am Coll Cardiol (2004) 44:152–8. doi:10.1016/j.jacc.2004.03.039
31. Montalcini T, Romeo S, Ferro Y, Migliaccio V, Gazzaruso C, Pujia A. Osteoporosis in chronic inflammatory disease: the role of malnutrition. Endocrine (2013) 43:59–64. doi:10.1007/s12020-012-9813-x
32. Fenton TR, Tough SC, Lyon AW, Eliasziw M, Hanley DA. Causal assessment of dietary acid load and bone disease: a systematic review & meta-analysis applying Hill’s epidemiologic criteria for causality. Nutr J (2011) 10:41. doi:10.1186/1475-2891-10-41
33. New SA. Bone health: the role of micronutrients. Br Med Bull (1999) 55:619–33. doi:10.1258/0007142991902501
34. Messina MJ. Legumes and soybeans: overview of their nutritional profiles and health effects. Am J Clin Nutr (1999) 70:439S–50S.
Keywords: bone mineral density, principal components analysis, elderly, dietary patterns, meat, grains, olive oil
Citation: Colica C, Mazza E, Ferro Y, Fava A, De Bonis D, Greco M, Foti DP, Gulletta E, Romeo S, Pujia A and Montalcini T (2017) Dietary Patterns and Fractures Risk in the Elderly. Front. Endocrinol. 8:344. doi: 10.3389/fendo.2017.00344
Received: 07 September 2017; Accepted: 27 November 2017;
Published: 13 December 2017
Edited by:
Antonello Simone Lorenzini, Università di Bologna, ItalyReviewed by:
James Harper, Sam Houston State University, United StatesAurelia Santoro, Università di Bologna, Italy
Piero Marchetti, University of Pisa, Italy
Copyright: © 2017 Colica, Mazza, Ferro, Fava, De Bonis, Greco, Foti, Gulletta, Romeo, Pujia and Montalcini. This is an open-access article distributed under the terms of the Creative Commons Attribution License (CC BY). The use, distribution or reproduction in other forums is permitted, provided the original author(s) or licensor are credited and that the original publication in this journal is cited, in accordance with accepted academic practice. No use, distribution or reproduction is permitted which does not comply with these terms.
*Correspondence: Tiziana Montalcini, tmontalcini@unicz.it