Vesiculation of Rhyolitic Melts Under Oscillatory Pressure
 Gilles Seropian1*
  Ben M. Kennedy1
  Jackie E. Kendrick2,3
  Yan Lavallée2
  Alexander R. L. Nichols1
  Felix W. von Aulock2
  Donald B. Dingwell4
  Kai-Uwe Hess4
  Anthony Lamur2
  Jenny Schauroth2
  Jérémie Vasseur4
  Fabian B. Wadsworth5
- 1School of Earth and Environment, University of Canterbury, Christchurch, New Zealand
- 2Department of Earth, Ocean and Ecological Sciences, University of Liverpool, Liverpool, United Kingdom
- 3School of Geosciences, University of Edinburgh, Edinburgh, United Kingdom
- 4Department of Earth and Environmental Sciences, Ludwig-Maximilians-Universität München, Munich, Germany
- 5Department of Earth Sciences, Durham University, Durham, United Kingdom
Magma ascending in the Earth’s crust can undergo oscillations in pressure, from ultra-low frequency changes associated with tectonics, to relatively higher frequency oscillations associated with seismicity. Seismic waves travelling through shallow magma bodies can lead to a range of unrest phenomena and potentially trigger volcanic eruptions. The mechanisms by which pressure oscillations can induce unrest or eruption remain debated. Here, we experimentally impose pressure oscillations on magma and study how they affect vesiculation processes. We use cylindrical samples (4.00 mm long, 4.85 mm diameter) of hydrous rhyolitic obsidian (0.11 ± 0.01 wt% H2O) placed in alumina (AL23) crucibles and vary pressure by the uniaxial loading of an alumina plunger in a thermo-mechanical analyzer. We monitor vesiculation at temperatures of 950–990°C and confining pressure of 177 kPa. We perform two types of experiment: 1) “static” experiments (at constant pressure) and 2) “oscillating” experiments in which we impose sinusoidal pressure oscillations of up to 71 kPa upon the static pressure (i.e., between 106 and 250 kPa). In both cases, we dilatometrically observe sample expansion driven by vesiculation. Post-experimental bubble textures reveal that bubbles formed preferentially at the sample margins. For the oscillating experiments, the sample expansion rate is lower than in the static experiments, and there are fewer vesicles at the sample margins. We examine the constituent processes of bubble formation (nucleation, growth, coalescence) and gas loss (diffusion, permeable flow) occurring during static experiments and with the added element of pressure oscillations. The most likely mechanism responsible for reduced sample expansion is that pressure oscillations drive the sample in and out of water saturation conditions and thus reduce the fraction of residence time over which bubble nucleation and/or growth are driven. Future work will be needed to confirm this hypothesis. These results are relevant to the study of earthquake-volcano interactions, where a magma body that sits close to volatile saturation is subject to pressure fluctuations.
1 Introduction
Gas bubbles play a fundamental role in driving, modulating, and recording volcanic and magmatic processes. Characterizing the kinetics of processes associated with vesiculation is thus a key goal of modern volcanology. The processes related to the nucleation, growth, coalescence and loss of bubbles are complex, often non-linear, and with numerous potential feedbacks (e.g., Sparks, 1978; Gonnermann and Manga, 2007). High-temperature experiments provide useful phenomenological insights into how bubbles might behave in magma in nature, whilst minimizing the scaling issues associated with using non-magmatic analogue liquids (Fiege and Cichy, 2015). In the majority of high temperature experiments to date, vesiculation has been triggered by inducing supersaturation via isothermal decompression (e.g., Hurwitz and Navon, 1994; Lyakhovsky et al., 1996; Gardner et al., 1999; Mourtada-Bonnefoi and Laporte, 1999; Mangan and Sisson, 2000; Martel and Bureau, 2001; Mourtada-Bonnefoi and Mader, 2001; Mourtada-Bonnefoi and Laporte, 2002; Gardner and Denis, 2004; Mourtada-Bonnefoi and Laporte, 2004; Mangan et al., 2004a,b; Mangan and Sisson, 2005; Gardner, 2007; Cluzel et al., 2008; Hamada et al., 2010; Cichy et al., 2011; Gondé et al., 2011; Nowak et al., 2011; Pichavant et al., 2013; Fiege et al., 2014; Fiege and Cichy, 2015; Martel and Iacono-Marziano, 2015; Gardner et al., 2018; Hajimirza et al., 2019) or isobaric heating (e.g., Murase and McBirney, 1973; Bagdassarov et al., 1996; Stevenson et al., 1997; Yamashita, 1999; Liu and Zhang, 2000; Bai et al., 2008; Yoshimura and Nakamura, 2008; Lautze et al., 2011; Baker et al., 2012; Fife et al., 2012; Masotta et al., 2014; Pistone et al., 2015; Ryan et al., 2015; von Aulock et al., 2017; Pleše et al., 2018; Cáceres et al., 2020). Only recently has experimentation focused on vesiculation processes under oscillatory pressure conditions (Masotta and Keppler, 2017), which may be of importance in magmatic scenarios.
Pressure fluctuations are highly likely to occur during magma storage and transport. The source of pressure oscillations may be external (e.g., earthquake or tidal; Manga and Brodsky, 2006; Girona et al., 2018) or internal (e.g., unsteady and pulsatory magma flow or gas-filled cavity resonance; Chouet, 1996; Wylie et al., 1999; Longo et al., 2012). In particular, constraining the effects of seismic waves on vesiculating magma is one key to understanding earthquake-volcano interactions, as evidence indicates that seismic waves can trigger a range of volcanic responses (e.g., Hill et al., 2002; Manga and Brodsky, 2006; Eggert and Walter, 2009; Sawi and Manga, 2018) depending on specific conditions dictated by the volcano type and the earthquake characteristics (Seropian et al., 2021).
Masotta and Keppler (2017) employed a hydrothermal moissanite cell, enabling direct optical observation of bubbles growing in a melt under pressure oscillations. They investigated mean pressures of 50 and 60 MPa, with oscillation amplitudes between 5 and 40 MPa, but their experiments were limited to samples <100 µm thick. We seek to extend their analysis to larger samples. Here, we employ thicker samples (4 mm), in experiments based on confined or “contained” dilatometry (Bagdassarov et al., 1996; Stevenson et al., 1997; Gottsmann et al., 1999). This dilatometric approach enables the volumetric monitoring of vesiculation. We report the results of a series of high temperature (950–990°C) experiments where pressure oscillations are imposed on vesiculating rhyolitic melt. We focus on how the various bubble processes (nucleation, growth, coalescence and gas loss) are affected by the oscillations. We then explore the relevant geological conditions where our results could be applied and examine the potential applications of this novel type of experiment.
2 Materials and Methods
2.1 Starting Material
All samples employed here were prepared from a single ∼20 × 10 × 10 cm block of aphyric, bubble-free peraluminous rhyolitic obsidian, collected from the AO sample site of Tuffen and Castro (2009) at Hrafntinnuhryggur, Krafla, Iceland (Figure 1A; Table 1). We drilled cylindrical cores (4.85 ± 0.05 mm diameter) from the block, and cut them into 4.00 ± 0.05 mm-long samples using a diamond wire saw. A thin disc was also obtained from between each successive sample, and prepared as a free-standing wafer, polished on both surfaces, for Fourier-transform infrared (FTIR) spectroscopy.
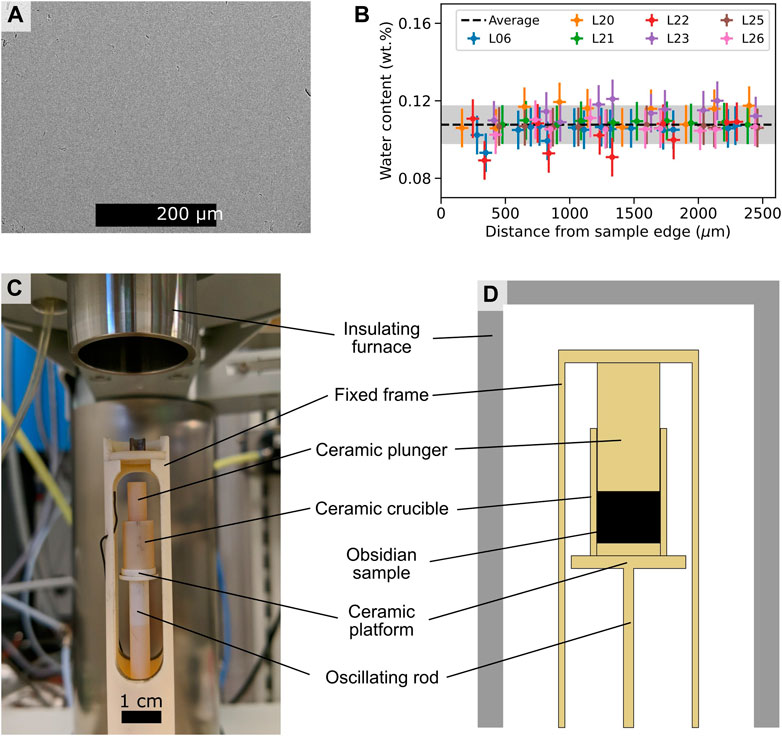
FIGURE 1. (A) Backscattered electron image of the obsidian used in the experiments, showing the absence of microlites and vesicles. (B) Water contents of the original obsidian measured by FTIR spectroscopy, across slices cut from the end disks of seven samples; the average is shown as a black dashed line and the gray shaded region represents the analytical uncertainty. (C) Photograph and (D) schematic diagram of the experimental setup.
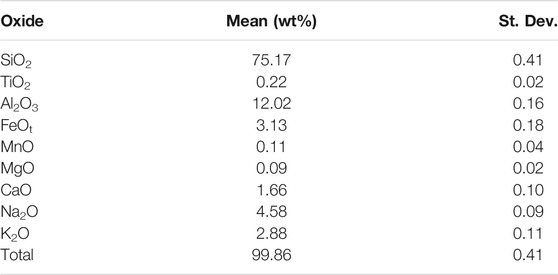
TABLE 1. Glass chemical composition of our starting material, determined by electron probe microanalysis by Tuffen and Castro (2009). The mean and standard deviation were computed from 100 analyses.
Water content was determined via FTIR spectroscopy using a Bruker Vertex 70 spectrometer attached to a Bruker Hyperion 2000 IR-microscope at the University of Canterbury. The spectrometer is equipped with a Globar source, an MCT detector cooled with liquid N2 and a KBr beamsplitter. The spectrometer and microscope were continuously purged with N2 gas. Samples were resting on an IR-invisible BaF2 window. Transmittance spectra were recorded at 10 aligned spots, with a 100 µm square aperture limiting the beam, in the wavenumber range 6,800–400 cm−1, with a resolution of 4 cm−1, using 128 scans and corrected against a background measured before each set of sample measurements. We measured the height of the 3,570 cm−1 peak above a linear baseline and used a density of 2,460 kg m−3, calculated with DensityX, for the composition given in Table 1 at 20°C and 1 bar (Iacovino and Till, 2018). Similarly to Tuffen and Castro (2009), we assumed that all of the water is present as OH− and used a molar absorptivity coefficient of 100 ± 2 L mol−1 cm−1 (Newman et al., 1986). Reflectance spectra were also collected at all measurement locations and used to calculate local thickness where possible, following the method of Wysoczanski and Tani (2006) with a refractive index of 1.5, appropriate for rhyolite glasses (Long and Friedman, 1968). Alternatively, in cases where reflectance spectra did not allow thickness to be determined, we measured thickness manually with a digital displacement micrometer (following von Aulock et al., 2014). All our samples are homogeneous within measurement uncertainty with an average water content of 0.11 ± 0.01 wt% (Figure 1B, full details in Supplementary Material).
2.2 Experimental Apparatus and Procedure
Our experimental setup is illustrated in Figures 1C, D. The geometry is similar to that of Bagdassarov et al. (1996), Stevenson et al. (1997) and Gottsmann et al. (1999). The prepared obsidian samples were placed inside crucibles composed of an alumina ceramic tube (DEGUSSIT AL23 produced by Friatec) with outer and inner diameters of 8 and 5 mm (±5%), respectively, and lengths of ∼12 mm. Tight-fitting cylindrical bases of the same material were prepared and inserted at the bottom, in order to avoid leaks. A cylinder of the same material was inserted above the obsidian sample, inside the crucible, to act as a plunger. Plungers were cut to lengths of ∼10 mm and lathed to a diameter of ∼4.9 mm so that they could fit snugly inside the crucible but still slide without resistance. The pre-experimental smooth sliding indicates the existence of a narrow space between the plunger and the crucible, such that the sample assembly can be assumed not to be gas-tight during the experiments. Every piece of ceramic used in the experiments was first heat-treated at 1200°C for 3 h, to remove impurities, and minimize potential geometrical changes to the sample assembly during the experiments.
These dilatometric experiments were performed in a NETZSCH TMA 402F1 Hyperion thermo-mechanical analyzer (TMA) at the University of Liverpool. The TMA consists of a sample holding platform and a vertical alumina push-rod, all enclosed in a silicon carbide furnace. The digital resolution of the push rod vertical position is 0.125 nm and resolution of the applied force is <0.01 mN. A fixed frame limits the rod’s upward motion, and serves as support for a K-type thermocouple, which is located within 5 mm of the sample, and exposed to the furnace gas. The crucible containing the obsidian sample and ceramic plunger was placed onto the platform, resting on the oscillating rod. For each experiment, initially a calibration was performed using a ceramic standard with dimensions that were within 3% of those of the obsidian sample, in order to quantify the geometrical response of the system (i.e., push-rod, crucible, base plate and plunger) to the precise temperature path. These calibration data were then subtracted from the data obtained during experiments on the actual sample to constrain precisely the sample response. Experiments were run in an Ar atmosphere to avoid melt hydration and inhibit melt oxidation. In order to reduce discrepancies between experiments, we first applied a constant force of 1 N for 10 min, at a temperature of 50°C. Next, a load of 1.5 N was applied and maintained as the temperature was increased to the target isothermal value (between 950 and 990°C) at a constant heating rate of 10°C min−1. The force applied by the rod, the vertical position of the rod, the furnace temperature and the Ar flow rate were monitored at a sampling rate of 2 Hz throughout the experiment. At the end of the experiment, the samples were cooled at 10°C min−1.
2.3 Post-Experimental Analysis
After each experiment, the samples were mounted in epoxy and cut parallel to the ends into halves: one half for textural analysis and one to measure water contents.
The first half was polished and gold coated for observation with a JEOL IT-300 scanning electron microscope (SEM) at the University of Canterbury. Backscattered electron (BSE) images were acquired with a 15 kV accelerating voltage and a 40 nA beam current at a 10 mm working distance. We quantitatively estimated the bubble fraction using the BSE images. We first manually delineated bubbles in Inkscape and produced segmented ternary images with pixel colors representing either glass (black), vesicles (white) or crucible (gray). Bubbles were further manually divided between core and rim bubbles. Bubble fraction was then computed from the number of relevant bubble pixels (core or rim) divided by the sum of bubble and melt pixels.
The second half of the sample was polished on both sides to create a wafer for FTIR spectroscopy. Post-experimental water contents were determined via FTIR spectroscopy following the same procedure as was employed for measuring pre-experimental water contents.
2.4 Experimental Conditions
Preliminary experiments were undertaken in order to assess our experimental methods, to optimize our sample and crucible preparation, and to identify “ideal” experimental conditions (i.e., windows of temperature and timescale where vesiculation occurs at a manageable rate and is reproducible). We chose temperatures in the range 950–990°C, yielding viscosities of 107.4–106.9 Pa s, for a water content of 0.11 wt%, according to the viscosity model of Giordano et al. (2008). To ensure our samples reach a relaxed state during experiments, we compare the shear relaxation timescale

TABLE 2. List of symbols used in the text and equations.
During an experiment, lateral melt expansion is contained by the presence of the crucible. The experiments have also been designed such that the space between the plunger and the crucible is too narrow to permit melt extrusion along the narrow annulus between the containers’ end pieces and cylinder during these experiments (e.g., Gotsmann et al., 1999; Yoshimura and Nakamura, 2008). Thus, the melt cylinder is effectively trapped between the plunger above and the crucible end piece underneath, and the crucible surrounding it radially. Under such circumstances the uniaxial loading of the plunger generates a bulk stress, transmitted through the melt body resulting in its transient pressurization. The viscous state of the melt on the timescale of the pressurization step ensures that the pressure is homogeneously distributed throughout the melt according to Pascal’s law. It can be estimated as the force applied by the rod divided by the contact area with the obsidian sample. Here, the contact area is a disk with a diameter of 5 mm, i.e., ∼20 mm2. The force (and thereby volume stress or pressure) can be set to either a constant value or to follow sinusoidal oscillations, corresponding to static and oscillating experiments, respectively. In static experiments, a constant force,
In the oscillating experiments, F0 was continuously applied during heating and for 10 min of thermal equilibration at the isotherm. The force with time is then set to:
where F0 is the constant baseline force, ∆F is the oscillation amplitude and t is time. For the majority of the oscillating experiments, we set ∆F = 1.4 N, and the pressure therefore oscillates between 106 ± 1 and 250 ± 10 kPa, during an oscillating experiment. The maximum instantaneous pressure change rate
Our samples initially contain 0.11 ± 0.01 wt% water so depending upon the water solubility in the melt at experimental P-T conditions, water will either exsolve (supersaturated case) or remain in the melt (undersaturated case). Water solubility in the melt can be estimated for our experimental conditions using the empirical model of Liu et al. (2005) (Figure 2). During a static experiment at 965°C and 177 kPa, our samples are within the saturation uncertainty of the model, which does not allow a priori assessment of whether vesiculation will occur or not. Therefore, we explored whether vesiculation occurs by comparing expansion during static experiments of 1) a standard borosilicate dry glass (NIST SRM 717a) and 2) our hydrous obsidian, as starting materials. During oscillating experiments, samples alternate between supersaturated and undersaturated conditions, beyond the uncertainty of the model (Figure 2).
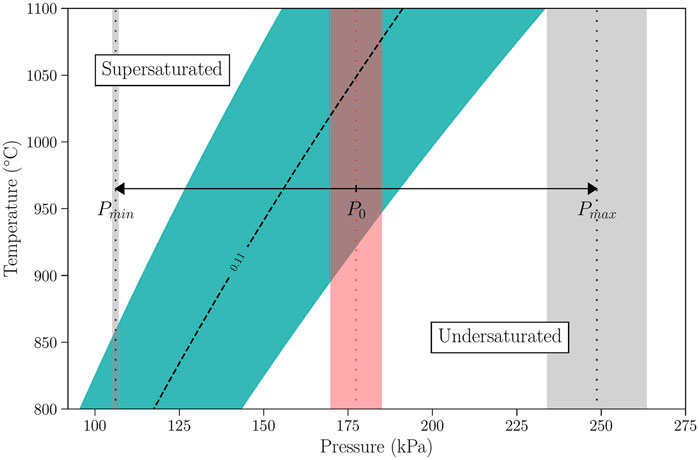
FIGURE 2. Temperature-pressure conditions of our experiments. The predicted P-T conditions of saturation for a rhyolite containing 0.11 ± 0.01 wt% of water are shown as a dashed line with a blue shaded region representing uncertainty, using the model from Liu et al. (2005). Above and left of this region, the sample is supersaturated in water. Below and right of this region, the sample is undersaturated. The pressure during static experiments is P0 = 177 ± 8 kPa and displayed as a red vertical dotted line (with red shaded regions representing uncertainty). The minimum and maximum pressures reached during oscillations, Pmin = 106 ± 1 and Pmax = 250 ± 10 kPa respectively, are shown as black vertical dotted lines (with gray shaded regions representing uncertainty). The horizontal double-headed arrow is located at T = 965°C, where the majority of experiments were performed.
3 Results
3.1 Tracking Vesiculation With Sample Expansion
As noted above, we tested whether the TMA can track vesiculation by comparing length changes (i.e., expansion) during static experiments with 1) a standard borosilicate dry glass (NIST SRM 717a) and 2) our hydrous obsidian as starting material (Figure 3). For each experiment, strain was computed by normalizing sample length to the initial length, whereby positive strain is defined as corresponding to expansion. Figure 3 shows typical examples of the strain evolution during experiments, including the heating and dwell phases. The initial trends are identical in both dry and hydrous experiments. Initially volume increases due to thermal expansion of the glass samples, increasing in rate as the samples cross the glass transition (e.g., Gottsmann et al., 1999). At temperatures above the glass transition, the samples viscously relax the applied stress, and as a result viscously adjust, accommodate themselves and spread inside the crucible, corresponding to a sudden phase of compressive strain (Figure 3). As the isotherm is reached and the melt sample fills the crucible, the strain curve flattens. Once the samples are viscously accommodated within the crucibles, the strain remains constant with time in the case of the dry NIST sample (Figure 3A), whereas the sample length begins to increase in the case of the hydrous obsidian (Figure 3B), indicating vesiculation. The obsidian samples can therefore be concluded to be supersaturated in water at the test conditions (T = 965°C and p = 177 kPa).
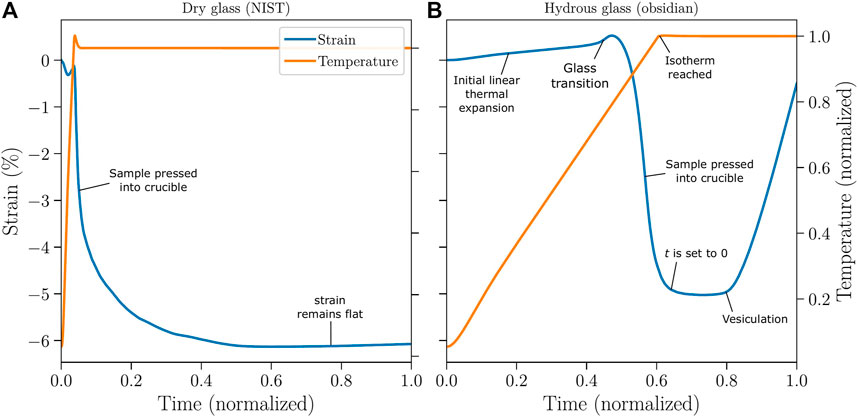
FIGURE 3. Comparison of static experiments using (A) standard borosilicate dry glass NIST SRM 717a and (B) hydrous obsidian from Hrafntinnuhryggur, Iceland as starting material. After an initial phase of compressive strain (blue line) as the samples are pressed inside the crucible, strain then remains flat in the case of a dry glass (A) but strain reverses in the case of a hydrous glass during the isotherm (B) indicating vesiculation. Temperature (orange line, normalized to target isothermal value, namely 640°C in (A) and 965°C in (B)) is also plotted. Time (since the beginning of the experiment) was normalized to the total experiment time, namely 9 h in (A) and 2 h in (B).
In comparisons going forward we suppress the reporting of the heating phase, setting both time and strain to zero 5 min after the isotherm is reached (as indicated on Figure 3B), thereby accounting for thermal equilibration of the furnace. At this point, melt has accommodated its form to the crucible and can no longer expand radially; therefore longitudinal strain can be converted to volume change, whereby positive changes correspond to expansion.
3.2 Experimental Results
We report the results of 14 experiments, seven at static pressure conditions and seven under oscillating pressure conditions. The majority of experiments were performed at 965°C. All experimental parameters are summarized in Table 3.
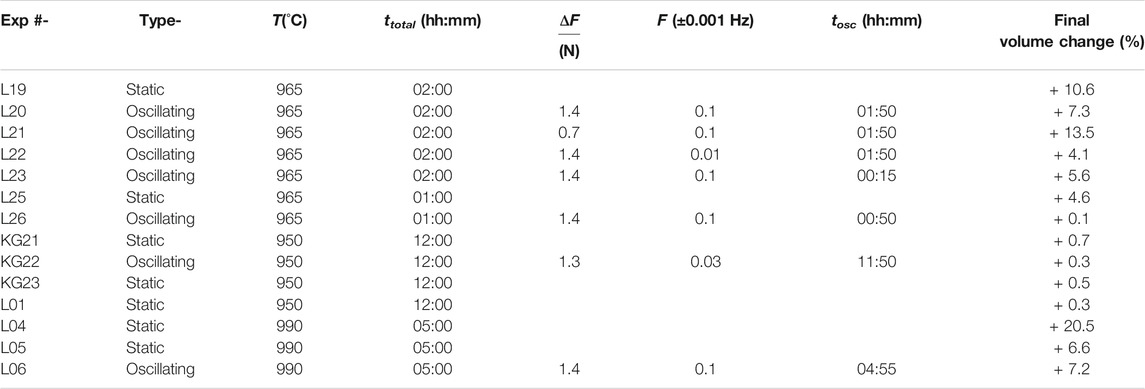
TABLE 3. Summary of experimental conditions. T is temperature, ttotal is the total time spent at isotherm temperature, ΔF is the oscillation amplitude, f is the oscillation frequency and tosc is the duration of oscillation. For the final volume change, + symbol indicates an increased in volume (i.e., sample expansion).
3.2.1 Vesiculation During Static vs Oscillating Experiments
Figure 4 shows experimental data from two static and two oscillation experiments at 965°C. We first describe the results from static experiments, and then compare them with the results from oscillation experiments.
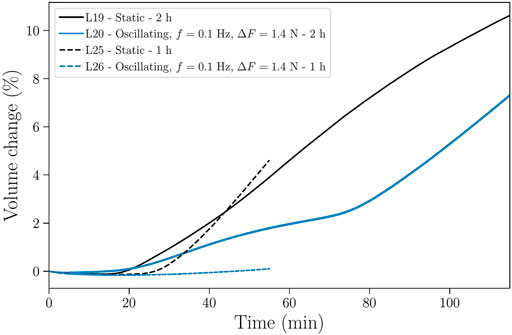
FIGURE 4. Volume change as a function of time for four experiments at 965°C, two static (black) and two oscillating (blue). Time is set to zero 5 min after the isotherm is reached (the heating phase is not shown). The uncertainty on the volume change is smaller than the line thickness.
The two static curves (obtained over 1- and 2-h periods) follow similar trends, reflecting our experimental reproducibility. Initially, the volume change curve remains flat, close to zero, as the sample lengths do not vary. After 18–25 min, volume increases as the samples expand. The expansion rate remains approximately constant for 1 h, before slightly reducing (observed in experiments with sufficient duration, Figure 4). Once started, sample expansion proceeds continuously until the end of the experiment. Therefore, longer experiment durations yield larger volumes, as indicated by the higher final volume change values in the 2-h experiments compared to those of 1-h experiments (Figure 4). These results are consistent with previous static dilatometry experiments (Bagdassarov et al., 1996; Stevenson et al., 1997). Sample expansion is attributed to water vapour bubbles nucleating and growing in the melt. The initial flat segment, termed “incubation period” by Bagdassarov et al. (1996), corresponds to the time required for bubbles to nucleate and grow to a detectable size after supersaturation is established. The incubation period in our static experiments (∼20 min, Figure 4) is similar to observations from Ryan et al. (2015) and Cáceres et al. (2020) who performed static vesiculation experiments with the same starting material, at similar temperatures and at atmospheric pressures.
During pressure oscillation experiments, the volume change curves are initially flat, similar to the static case, as the samples undergo a period of incubation of 20–40 min before expansion starts. After the incubation period is complete, the trend differs in two ways: 1) the expansion rate is unsteady with successive acceleration and deceleration, and 2) the volume change values are consistently lower than in the static cases. These observations suggest that, in the oscillating cases, the samples expand at a slower rate (as evidenced by the overall shallower slope of the curves) and more erratically (as evidenced by the greater range of the curves).
We also explored temperatures of 950 and 990°C (Supplementary Figures S1–S3). At 950°C, the measured strains remained close to zero in both static and oscillating experiments, presumably because vesiculation was effectively inhibited. At 990°C, sample expansion occurred faster than at 965°C, with an incubation period of <5 min in the static case and in the oscillating case, sample expansion occurred again at a relatively slower rate and more erratically.
3.2.2 Varying Oscillation Parameters
We investigated the role of three oscillating parameters on sample expansion kinematics: 1) oscillation amplitude ∆F, 2) oscillation frequency f, and 3) oscillation duration tosc. We use the 2-h experiments presented in Figure 4 (L19 and L20) as a comparative baseline to understand the effects of each parameter (Figure 5). We observe that the general trend remains the same in all cases. All experiments started with an incubation period of 20–40 min (at 965°C), before the onset of sample expansion.
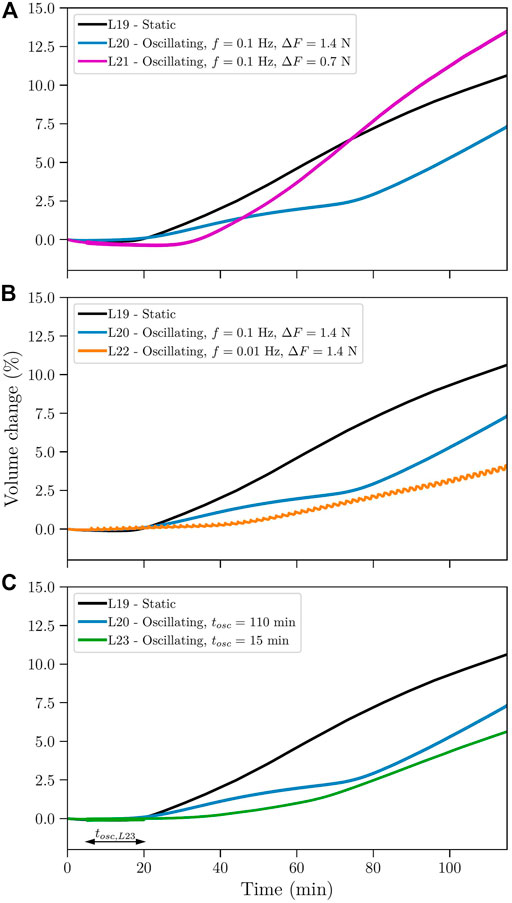
FIGURE 5. Volume change as a function of time for varying (A) oscillation amplitude
When the force was halved (∆F = 0.7 N instead of 1.4 N, Figure 5A), the volume increased to values similar to those observed in the static experiment, despite a delayed onset. Hence for forces low enough, sample expansion is not affected by pressure oscillations. Thus the oscillation amplitude appears to exert a control on sample expansion, with larger amplitudes leading to lower total volumes. In contrast, with either a reduced oscillation frequency (f = 0.01 Hz instead of 0.1 Hz, Figure 5B) or reduced oscillation duration (15 min as opposed to 110 min, Figure 5C), the volume change curve matches the original oscillating experiment (L20). Therefore, pressure oscillations with either a low frequency or a short duration appear to reduce sample expansion. Thus, under our experimental conditions, oscillation amplitude exerts the greater influence on sample expansion kinematics.
3.3 Textural Analysis
Following our experiments, the samples recovered from both static and oscillating experiments contain bubbles, consistent with the interpretation that the volume increase is driven by vesiculation. Segmented images of horizontal cross sections from the final experimental products of the four experiments shown in Figure 4 are presented in Figure 6A.
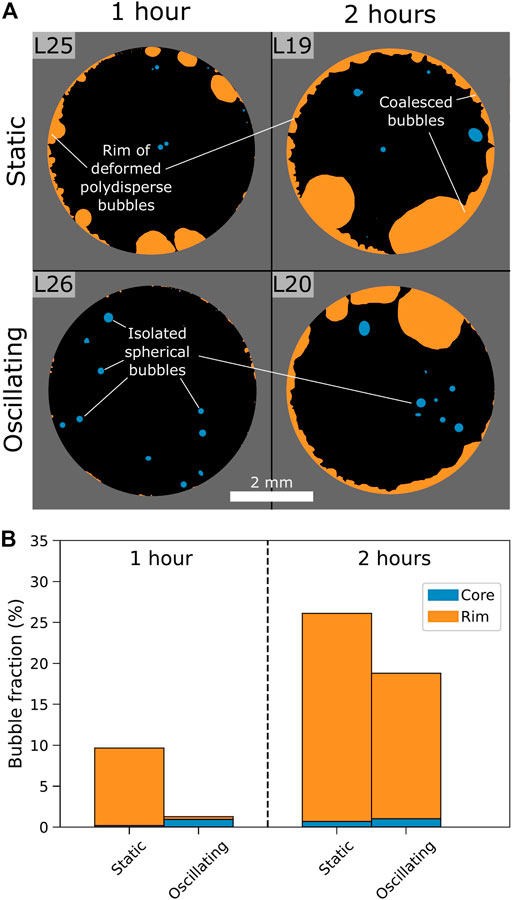
FIGURE 6. (A) Segmented images of the experimental products from the four experiments presented in Figure 4. Glass is in black, the ceramic crucible is in gray, core bubbles are in blue and rim bubbles are in orange. Original SEM images used to produce these can be found in the Supplementary Material. (B) Bubble fractions from the images in (A), divided between core bubbles (blue) and rim bubbles (orange).
In the static cases, bubbles are unevenly distributed. Most bubbles are located on the outer margin of the samples, at the boundary with the ceramic crucible, forming a rim of bubbles. The bubbles on the rim are densely packed, exhibit a wide range of diameters (0.001–1 mm) with larger bubbles generally deformed (i.e., not round) and showing evidence of coalescence (Figure 6A; c.f. Castro et al., 2012). We also observe a few bubbles in the core of the sample; these tend to be isolated, spherical and of uniform size (∼0.1 mm diameter).
The bubble textures in samples from oscillating experiments are broadly similar to the static cases. Again, bubbles are unevenly distributed with 1) a polydisperse, deformed and coalesced population on the outer margin, and 2) a more monodisperse spherical population in the core. Core bubble populations are indistinguishable between static and oscillating experiments but we observe fewer bubbles on the rim of the samples that have undergone pressure oscillations.
We used the segmented images of the samples to assess the relative proportions of core and rim bubbles (Figure 6B). This quantitative analysis supports our observations that the majority of the bubbles are found on the outer margin and that longer experiment durations lead to larger volumes. Comparison between the bubble fractions formed during static versus oscillating tests confirms that 1) core bubble fractions are similar, and 2) bubble fractions on the rim are reduced in the oscillating case compared to the static case.
3.4 Post-Experimental Water Content
Water contents were measured post-experimentally, where possible, using FTIR spectroscopy (Figure 7, full details in Supplementary Material). The average post-experimental water content is 0.11 ± 0.01 wt%. Post-experimental water contents are therefore indistinguishable from pre-experimental water contents. Additionally, we do not observe any correlation between post-experimental water contents and distance to the nearest sample edge (Figure 7).
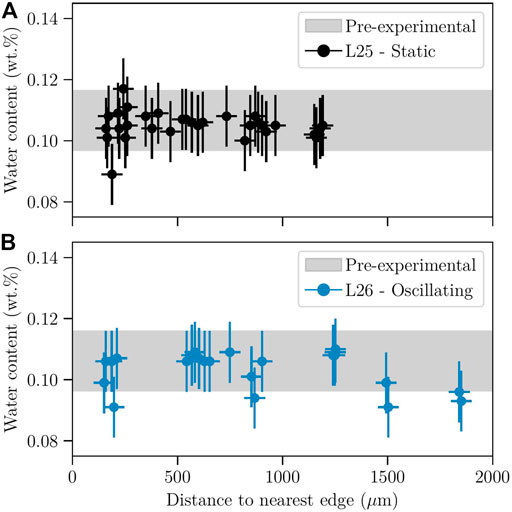
FIGURE 7. Post-experimental water contents (from FTIR spectroscopy) as a function of the distance to the nearest edge or bubble for the two 1-h experiments presented in Figures 4 and 6, L25 (static) and L26 (oscillating). The range of water contents in the original samples are indicated as grey bands for comparison.
4 Discussion
4.1 Static Experiments
In all static experiments, samples expanded (Figure 4), indicating that vesiculation occurred, as later confirmed in physical examination (Figure 6). Vesiculation consists of three main processes: bubble nucleation, growth and coalescence (e.g., Burgisser and Degruyter, 2015). Most of the observed expansion likely results from the formation and/or accumulation of bubbles on the outer margin (Figure 6). A rim of bubbles (also termed “fringe” of bubbles by Mangan and Sisson, 2000) is a common occurrence in contained vesiculation experiments (e.g., Mangan and Sisson, 2000; Mourtada-Bonnefoi and Laporte, 2002; Fiege and Cichy, 2015). These bubbles are interpreted to result from a combination of heterogeneous nucleation at the contact with the crucible (e.g., Mangan and Sisson, 2000; Mourtada-Bonnefoi and Laporte, 2002) and diffusion into interstitial air trapped at the sample-crucible interface (e.g., Wiesmaier et al., 2015). It is very unlikely that bubbles migrated within the sample during the experiments, due to the high melt viscosity (ca. 107 Pa s). Bubble migration velocity for a bubble with radius R can be estimated using Stokes’ law as:
where ρ is the melt density (=2,370 kg m−3, computed with DensityX, at T = 965°C and P = 177 kPa; Iacovino and Till, 2019), η is the melt viscosity (= 107 Pa s) and
Bubble formation (i.e., nucleation and/or growth) is followed by coalescence, as evidenced by the textures observed on the rim of the experimental products (Figure 6). Given the high viscosity of the melt, bubble coalescence most likely results from inter-bubble melt films stretching and thereby thinning, driven by bubble growth (e.g., Castro et al., 2012; Masotta et al., 2014; Giachetti et al., 2019). Ostwald ripening (the spontaneous growth of large bubbles at the expense of smaller ones) might also occur due to the variety of bubble sizes observed in the rim, but, at such high viscosities, ripening effects generally become significant on timescales of days to weeks, i.e., orders of magnitude longer than the duration of our experiments (e.g., Lautze et al., 2011; Masotta et al., 2014).
As our experimental apparatus is permeable to volatiles, some gas may progressively escape from the system, diminishing the driving force for bubble growth. There are two possible escape routes for water vapor: either via direct diffusion through the narrow space between the plunger and the crucible, or via porous flow through the ceramic crucible. In the case of the former, there is a thin ring of melt in direct contact with the furnace atmosphere around the base of the plunger. Here, water will diffuse from the pressurized melt into the furnace, due to the low partial pressure of water in the Ar atmosphere. This diffusion process will lead to the formation of a low water content, bubble-free, impermeable skin which effectively seals the system (Yoshimura and Nakamura, 2008; von Aulock et al., 2017). The thickness of this skin scales with the diffusion length
The second gas loss mechanism is permeable gas flow through the crucible walls. We can rearrange Darcy’s law to estimate the time necessary to evacuate a half-bubble of radius R via porous flow through the ceramic wall as (see geometry of the problem in Figure 8A):
where the thickness of the ceramic crucible wall b = 3 mm, the viscosity of the gas

FIGURE 8. Time
4.2 Oscillating Experiments
The same processes of bubble nucleation, growth, coalescence and gas loss from the crucible occur during the oscillating experiments, but each of these may potentially be affected by pressure oscillations. The volume change curves (Figures 4, 5) are generally similar in the static and oscillating cases, suggesting that the effects of oscillations tested here remain moderate. Nonetheless, the expansion curves for the oscillating experiments lie systematically below those for static experiments (Figures 4, 5). This is observed regardless of the duration and frequency of pressure oscillations across the range tested, but depends on the oscillation amplitude, with higher amplitudes yielding more reduced volumes compared with the static case (Figure 5). These relationships are preliminary and need to be explored and confirmed by more experiments, ideally accompanied by a quantification of gas loss from the system, and an analysis of its potential influence on vesiculation.
Textural evidence (Figure 6A) shows that bubbles in the sample cores are of similar size, shape and present in similar amounts in static vs oscillating tests, but that the amount of bubbles located on the rim is lower in oscillation experiments (Figure 6B). We propose that these observations can be explained by either: 1) reduced bubble formation (nucleation and/or growth), 2) increased gas loss, or 3) a combination of the two. Below, we explore how pressure oscillations may impact the different processes occurring during an experiment.
4.2.1 Bubble Nucleation
Bubble nucleation events do not produce a significant volume change and thus cannot be monitored directly with our experimental setup. We can nevertheless interrogate the classical nucleation theory (CNT) to assess the effects of pressure oscillations on the phenomenon, and build a hypothesis to be tested in future work (see Gonnermann and Gardner (2013) and Shea (2017) for shortcomings of the CNT for magmatic liquids). According to the CNT, bubbles nucleate from clusters of water molecules. CNT defines a cluster critical (minimum) radius
where
For the experiments presented in Figure 4,
In general,
where
We can then use Eq. 6 to evaluate how the critical radius changes during pressure oscillations (Figure 9). While the pressure oscillations
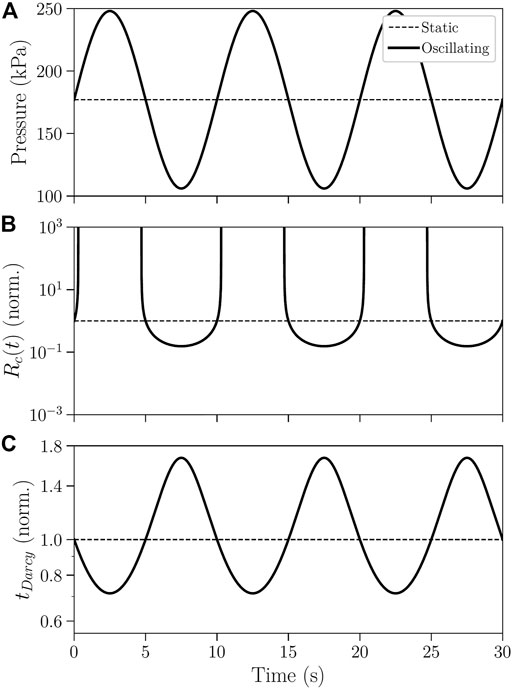
FIGURE 9. (A) Pressure, (B) critical radius for bubble nucleation
4.2.2 Bubble Growth and Coalescence
Bubble growth is a complex, non-linear phenomenon and it is not, a priori, evident how pressure oscillations should influence it. It is important to note that, in our experiments, we monitor the whole sample volume change, which depends upon, but differs from, the growth rates of the individual bubbles. In general, for a given set of initial conditions, bubble growth rate (and thereby the whole sample expansion rate) is primarily governed by the melt viscosity and/or the diffusivity of water (e.g., Sparks, 1978; Bagdassarov et al., 1996; Proussevitch and Sahagian, 1998; Blower et al., 2001; Lensky et al., 2004). Here, the initial conditions refer to the initial degree of supersaturation and bubble number density (BND), which have been shown to exert significant controls on the resulting growth rate (e.g., Liu and Zhang, 2000; L’Heureux, 2007; Coumans et al., 2020). The effects of parameters such as temperature or composition of the melt are factored into the viscosity, diffusivity and degree of supersaturation (e.g., higher temperatures correspond to lower viscosities, higher degrees of supersaturation and higher diffusivities).
Water diffusivity scales inversely with pressure, but in our case the pressure oscillations (with amplitude ∆P = 71 kPa) result in water diffusivity changes of <0.1% (using the model of Zhang and Ni, 2010). Additionally, melt viscosity is not significantly, nor systematically, influenced by pressure (e.g., Ardia et al., 2008). We therefore anticipate that the effect of pressure oscillations on water diffusivity and melt viscosity in our tests can be neglected.
Pressure oscillations could however significantly impact the degree of supersaturation and, potentially, the bubble number density. Concerning the latter, as discussed in Section 4.2.1, pressure oscillations may reduce the number of bubble nuclei. One of the consequences would be an overall reduction in bubble number density, and thus a reduced sample expansion rate (though not necessarily reduced individual bubble growth rates; e.g., Proussevitch and Sahagian, 1998; Coumans et al., 2020). Additionally, we saw that the pressure oscillations constantly change the degree of water supersaturation in the melt (see Figure 2 and previous section). The supersaturation increases in the low-pressure part of the cycle, but, in the high pressure part the degree of supersaturation decreases and eventually vanishes as the sample is driven into undersaturated conditions. In general, higher degrees of supersaturation produce faster bubble growth rates (e.g., Proussevitch and Sahagian, 1998; L’Heureux, 2007), yet previous research efforts have generally focused on either constant or continuously increasing degrees of supersaturation (e.g., Nowak et al., 2011). Therefore, bubble growth potentially accelerates when pressure is reduced, and decelerates when pressure is increased and bubble growth stops when the pressure increases past the saturation pressure and the sample becomes undersaturated. Bubbles may then start resorbing (e.g., McIntosh et al., 2014) but on a timescale beyond that explored in this study. As for the case of bubble nucleation then, it is probable that even symmetrical pressure oscillations lead to asymmetrical effects on bubble growth. If bubble growth cyclically stops as the melt becomes undersaturated, and if this effect is not counterbalanced by the bubble growth acceleration when pressure is decreased, then this mechanism may contribute to the observed reduced sample expansion rates (Figure 4). The importance of this mechanism remains to be fully evaluated. We note that for our experiments the diffusion length over a half-period of oscillation is only 2 µm. Hence it is possible that our pressure oscillations occur too fast compared to the diffusion of water, and thus bubble growth would remain unaffected.
Bubble growth may further be affected by rectified diffusion, if the sizes of the bubbles oscillate with pressure (Brodsky et al., 1998; Ichihara and Brodsky, 2006). The necessary timescale for a bubble to expand and contract in response to pressure perturbations can be estimated, after Ichihara and Nishimura (2009), as:
In our experiments,
Finally, most coalescence processes directly depend on the BND and the individual bubble growth rates, with higher BND and growth rates generally leading to faster coalescence (Castro et al., 2012). Section 4.2.1 showed that pressure oscillations may reduce bubble nucleation, hence the resulting BND will be lower, and pressure oscillations potentially reduce bubble growth rates. Therefore, if pressure oscillations reduce both BND and growth rates, then the rate of coalescence should also decrease.
4.2.3 Gas Loss
The last processes that may potentially be affected by pressure oscillations are related to gas loss to the surrounding furnace atmosphere; namely, via direct diffusion through cracks between the plunger and the crucible, and via gas filtration through the crucible wall. While the former is likely to be negligible (see Section 4.1), the latter could be significant, contingent upon the ceramic material having a high enough permeability (k > 10−20 m2, see Section 4.1 and Figure 8). In order to evaluate
where
assuming that
4.3 Limitations and Future Work
The experiments presented in this contribution are exploratory and in this sense very much in the spirit of other attempts to understand how melt behaves under disequilibrium conditions (e.g., Arzilli and Carroll, 2013; Masotta and Keppler, 2017; Kolzenburg et al., 2018). As such, further work will be needed to constrain and confirm the results presented here. Below, we highlight some current limitations and prospects for future work.
Firstly, our observations rely on a small number of experiments (14 on hydrous samples). While we strived for a reasonable level of reproducibility, the validity of our results is pending replication. Future experiments should also aim to explore saturation states more carefully by investigating smaller steps in temperature. Similarly, the role of the different oscillation parameters (amplitude, frequency and duration) needs to be more closely examined. While we have highlighted the importance of bubbles, in particular at the margin of the samples, observation of these processes is currently limited both in time and space. We only observe a snapshot of the bubble textures, in 2D, after quenching the sample at the end of an experiment. A crucial future step would be to have better temporal resolution, for example by monitoring bubble textures continuously during in-situ experiments, using X-ray tomography techniques for instance. Furthermore, as bubbles grow in the sample, the compressibility of the sample increases, which has been neglected in our analysis. We tried to mitigate this issue by focusing on short experiments, with low (<10%) exsolved phase volumes, but this could constitute an avenue for further work. Finally, we examined the importance of gas loss through the crucible walls. An accurate characterization of the permeability of the ceramic material used will be a critical step to constrain this mechanism further. Alternatively, a different material could be used for the crucible. For instance, Gottsmann et al. (1999) use containers made of Ni metal.
4.4 Geological Implications
Our experiments investigate the influence of pressure oscillations on bubble growth in magma. Magma may experience pressure fluctuations in a range of natural scenarios, in particular in the case of incoming seismic waves (Hill et al., 2002; Manga and Brodsky, 2006; Seropian et al., 2021). Although the conclusions from our experiments remain preliminary, we describe below the conditions for which our findings would be relevant, in order to guide future applications.
Seismic waves are a common source for pressure oscillations on magma bodies. Typical frequencies for seismic waves are in the range 0.1–10 Hz, though frequencies as low as 0.01 Hz could be attained for very large earthquakes (Manga and Brodsky, 2006). The amplitude of the stress perturbation depends on many parameters, including the earthquakes’ magnitude, distance to the epicentre, focal mechanism and local crustal structure. Nonetheless typical values lie between 103 and 104 kPa in the near-field (<100–500 km, depending on magnitude), and reduce to <100 kPa for distances >1,000 km from the epicentre (e.g., Manga and Brodsky, 2006; Walter et al., 2007, 2009; Avouris et al., 2017; Farías and Basualto, 2020). Hence the pressure oscillations in our experiments (f = 0.01–0.1 Hz and ∆P = 71 kPa) are representative of natural seismic waves following a large distant or moderate local earthquake. Importantly, in our experiments, pressure oscillations last for 15–110 min, whereas typical seismic waves will produce oscillations for <5 min. Figure 5C suggests that sample expansion is reduced, even in the case of short pressure oscillations, but further work should aim at reducing this discrepancy between experimental and natural oscillation durations, to facilitate application.
The low confinement pressure (177 kPa), low water content (0.11 wt%) and composition of our experiments correspond to a very shallow or surficial silicic magma. This is one end-member of the spectrum of silicic magmas as they are generally stored at higher confining pressures (100–250 MPa, e.g., Huber et al., 2019), contain more dissolved water (typically 2–6 wt% in subduction zones, e.g., Wallace et al., 1995), and are likely to already contain bubbles. Nonetheless, we surmise that the asymmetrical response, and effective reduction of bubble nucleation would remain similar, provided that pressure oscillations drive the system in and out of water saturation. It is the pressure relative to the saturation pressure, rather than the absolute pressure that dictates how bubble nucleation will respond to pressure oscillations.
At higher water contents, however, melt viscosity will be significantly reduced. For instance, our rhyolitic melt, in equilibrium at 150 MPa and 775°C would contain 5.14 wt% H2O (Liu et al., 2005), and its viscosity would be 105 Pa s (Giordano et al., 2008). The bubble expansion timescale
It is commonly assumed that seismic waves may induce bubble nucleation in magma, increasing magma overpressure, and potentially leading to unrest or an eruptive episode (e.g., Manga and Brodsky, 2006; Rothery et al., 2007; Cannata et al., 2010; Hamling and Kilgour, 2020; Seropian et al., 2021), yet this mechanism has never been validated experimentally. We did not observe any evidence suggesting that pressure oscillations triggered bubble nucleation in our experiments. Our analysis of bubble nucleation suggests that the opposite could occur, that is pressure oscillations could hamper bubble nucleation. We emphasize that the lack of evidence for increased nucleation at our experimental conditions does not mean that seismic waves cannot nucleate bubbles in magma in general; our experiments featured high-viscosity, crystal-poor, low water content rhyolite, all of which may limit bubble nucleation processes (Shea, 2017). Hamling and Kilgour (2020) showed that the necessary P-T and water content conditions for seismic waves to promote bubble nucleation form a very tight window, with the optimal case being partially crystallized basalt. Therefore seismically-enhanced bubble nucleation remains to be experimentally tested as a viable mechanism to trigger eruptions and our experimental data indicate that degree of supersaturation of the melt is an essential parameter to constrain for oscillating vesiculating experiments.
5 Conclusion
In this contribution we report a series of high-temperature experiments investigating the effects of pressure oscillations on magma vesiculation. We designed a novel experimental setup where melt is contained within a cylindrical ceramic crucible and pressurized with a piston-style plunger actuated in a thermo-mechanical analyzer; then vesiculation is studied in two types of experiments: static (where pressure is maintained) and oscillating (where pressure fluctuates). We carefully chose P-T conditions so that the samples would be slightly oversaturated in water and volatiles would slowly exsolve during an experiment. The experiments show that vesicles are mostly present near the sample edge in all cases, with very few vesicles in the sample core, irrespective of testing conditions. We observe that both sample expansion and the amount of bubbles present at the outer margin are reduced when pressure oscillates, compared to the static case. The oscillation amplitude exerts the strongest control on this effect. The observed reduced volumes in oscillating experiments can be explained by reduced vesiculation and/or increased gas loss. We evaluated different processes which may occur in the samples during the experiments, and discuss how they would be affected by oscillatory pressures. This preliminary analysis suggests that bubble formation could be hindered by pressure fluctuations if the melt oscillates between over- and undersaturated conditions. This work highlights the number of interacting processes happening as magma vesiculates, each of which is susceptible to modulation by external pressure perturbations. These processes are particularly relevant to the study of earthquake-volcano interactions, where a magma body sits close to volatile saturation and responds to pressure fluctuations.
Data Availability Statement
The original contributions presented in the study are included in the article/Supplementary Material, further inquiries can be directed to the corresponding author.
Author Contributions
GS, BK, JK, YL and FW conceptualized models and designed the experiments. GS performed the experiments with the help of FvA, DD, K-UH, AL, JS and JV. GS and AN carried out H2O analysis. GS performed SEM imaging and drafted the figures. Numerical calculations were performed by GS and JV. All authors contributed to the interpretation of the data and the writing of the final version of the paper.
Funding
GS and BK acknowledge the Royal Society Te Apārangi Marsden grant “Shaking magma to trigger eruptions”. GS was also supported by a DAAD fellowship. JK was funded by an Early Career Fellowship of the Leverhulme Trust (ECF-2016-325). YL, FBW and AL acknowledge the support of a NERC standard grant (NE/T007796/1). YL was supported by a Research Fellowship of the Leverhulme Trust (RF-2019–526\4). JV and DD acknowledge the support of ERC 2018 ADV Grant 834225 (EAVESDROP).
Conflict of Interest
The authors declare that the research was conducted in the absence of any commercial or financial relationships that could be construed as a potential conflict of interest.
The reviewer SB declared a past co-authorship with the authors to the handling editor.
Publisher’s Note
All claims expressed in this article are solely those of the authors and do not necessarily represent those of their affiliated organizations, or those of the publisher, the editors and the reviewers. Any product that may be evaluated in this article, or claim that may be made by its manufacturer, is not guaranteed or endorsed by the publisher.
Acknowledgments
We thank Rob Spiers for his help preparing samples, Shaun Mucalo for his help with SEM observation.
Supplementary Material
The Supplementary Material for this article can be found online at: https://www.frontiersin.org/articles/10.3389/feart.2022.812311/full#supplementary-material
References
Ardia, P., Giordano, D., and Schmidt, M. W. (2008). A Model for the Viscosity of Rhyolite as a Function of H2O-Content and Pressure: A Calibration Based on Centrifuge Piston cylinder Experiments. Geochimica et Cosmochimica Acta 72 (24), 6103–6123. doi:10.1016/j.gca.2008.08.025
Arzilli, F., and Carroll, M. R. (2013). Crystallization Kinetics of Alkali Feldspars in Cooling and Decompression-Induced Crystallization Experiments in Trachytic Melt. Contrib. Mineral. Petrol. 166 (4), 1011–1027. doi:10.1007/s00410-013-0906-1
Avouris, D. M., Carn, S. A., and Waite, G. P. (2017). Triggering of Volcanic Degassing by Large Earthquakes. Geology 45 (8), 715–718. doi:10.1130/g39074.1
Bagdassarov, N., Dorfman, A., and Dingwell, D. B. (2000). Effect of Alkalis, Phosphorus, and Water on the Surface Tension of Haplogranite Melt. Am. Mineral. 85, 33–40. doi:10.2138/am-2000-0105
Bagdassarov, N. S., Dingwell, D. B., and Wilding, M. C. (1996). Rhyolite Magma Degassing: An Experimental Study of Melt Vesiculation. Bull. Volcanology 57 (8), 587–601. doi:10.1007/s004450050114
Bai, L., Baker, D. R., and Rivers, M. (2008). Experimental Study of Bubble Growth in Stromboli basalt Melts at 1 Atm. Earth Planet. Sci. Lett. 267 (3-4), 533–547. doi:10.1016/j.epsl.2007.11.063
Baker, D. R., Brun, F., O'Shaughnessy, C., Mancini, L., Fife, J. L., and Rivers, M. (2012). A Four-Dimensional X-ray Tomographic Microscopy Study of Bubble Growth in Basaltic Foam. Nat. Commun. 3, 1135. doi:10.1038/ncomms2134
Blower, J. D., Mader, H. M., and Wilson, S. D. R. (2001). Coupling of Viscous and Diffusive Controls on Bubble Growth during Explosive Volcanic Eruptions. Earth Planet. Sci. Lett. 193, 47–56. doi:10.1016/s0012-821x(01)00488-5
Brodsky, E. E., Sturtevant, B., and Kanamori, H. (1998). Earthquakes, Volcanoes, and Rectified Diffusion. J. Geophys. Res. 103 (B10), 23827–23838. doi:10.1029/98jb02130
Cáceres, F., Wadsworth, F. B., Scheu, B., Colombier, M., Madonna, C., Cimarelli, C., et al. (2020). Can Nanolites Enhance Eruption Explosivity? Geology 48 (10), 997–1001.
Cannata, A., Di Grazia, G., Montalto, P., Aliotta, M., Patanè, D., and Boschi, E. (2010). Response of Mount Etna to Dynamic Stresses from Distant Earthquakes. J. Geophys. Res. Solid Earth 115 (12), 1–18. doi:10.1029/2010jb007487
Castro, J. M., Burgisser, A., Schipper, C. I., and Mancini, S. (2012). Mechanisms of Bubble Coalescence in Silicic Magmas. Bull. Volcanol 74 (10), 2339–2352. doi:10.1007/s00445-012-0666-1
Chouet, B. A. (1996). Long-period Volcano Seismicity: Its Source and Use in Eruption Forecasting. Nature 380 (6572), 309–316. doi:10.1038/380309a0
Cichy, S. B., Botcharnikov, R. E., Holtz, F., and Behrens, H. (2011). Vesiculation and Microlite Crystallization Induced by Decompression: A Case Study of the 1991-1995 Mt Unzen Eruption (Japan). J. Pet. 52 (7-8), 1469–1492. doi:10.1093/petrology/egq072
Cluzel, N., Laporte, D., Provost, A., and Kannewischer, I. (2008). Kinetics of Heterogeneous Bubble Nucleation in Rhyolitic Melts: Implications for the Number Density of Bubbles in Volcanic Conduits and for Pumice Textures. Contrib. Mineral. Petrol. 156 (6), 745–763. doi:10.1007/s00410-008-0313-1
Coumans, J. P., Llewellin, E. W., Wadsworth, F. B., Humphreys, M. C. S., Mathias, S. A., Yelverton, B. M., et al. (2020). An Experimentally Validated Numerical Model for Bubble Growth in Magma. J. Volcanology Geothermal Res. 402, 107002. doi:10.1016/j.jvolgeores.2020.107002
De Corato, M., Dimakopoulos, Y., and Tsamopoulos, J. (2019). The Rising Velocity of a Slowly Pulsating Bubble in a Shear-Thinning Fluid. Phys. Fluids 31 (8), 083103. doi:10.1063/1.5108812
Dingwell, D., and Webb, S. (1989). Structural Relaxation in Silicate Melts and Non-newtonian Melt Rheology in Geologic Processes. Phys. Chem. Minerals 16 (5), 508–516. doi:10.1007/bf00197020
Eggert, S., and Walter, T. R. (2009). Volcanic Activity before and after Large Tectonic Earthquakes: Observations and Statistical Significance. Tectonophysics 471 (1-2), 14–26. doi:10.1016/j.tecto.2008.10.003
Farías, C., and Basualto, D. (2020). Reactivating and Calming Volcanoes: The 2015 MW 8.3 Illapel Megathrust Strike. Geophys. Res. Lett. 47 (16), 1–10.
Fiege, A., and Cichy, S. B. (2015). Experimental Constraints on Bubble Formation and Growth during Magma Ascent: A Review. Am. Mineral. 100 (11-12), 2426–2442. doi:10.2138/am-2015-5296
Fiege, A., Holtz, F., and Cichy, S. B. (2014). Bubble Formation during Decompression of Andesitic Melts. Am. Mineral. 99 (5-6), 1052–1062. doi:10.2138/am.2014.4719
Fife, J. L., Rappaz, M., Pistone, M., Celcer, T., Mikuljan, G., and Stampanoni, M. (2012). Development of a Laser-Based Heating System Forin Situsynchrotron-Based X-ray Tomographic Microscopy. J. Synchrotron Radiat. 19 (3), 352–358. doi:10.1107/s0909049512003287
Gardner, J. E. (2007). Bubble Coalescence in Rhyolitic Melts during Decompression from High Pressure. J. Volcanology Geothermal Res. 166 (3-4), 161–176. doi:10.1016/j.jvolgeores.2007.07.006
Gardner, J. E., and Denis, M.-H. (2004). Heterogeneous Bubble Nucleation on Fe-Ti Oxide Crystals in High-Silica Rhyolitic Melts. Geochimica et Cosmochimica Acta 68 (17), 3587–3597. doi:10.1016/j.gca.2004.02.021
Gardner, J. E., Hajimirza, S., Webster, J. D., and Gonnermann, H. M. (2018). The Impact of Dissolved Fluorine on Bubble Nucleation in Hydrous Rhyolite Melts. Geochimica et Cosmochimica Acta 226, 174–181. doi:10.1016/j.gca.2018.02.013
Gardner, J. E., Hilton, M., and Carroll, M. R. (1999). Experimental Constraints on Degassing of Magma: Isothermal Bubble Growth during Continuous Decompression from High Pressure. Earth Planet. Sci. Lett. 168 (1-2), 201–218. doi:10.1016/s0012-821x(99)00051-5
Giachetti, T., Gonnermann, H. M., Gardner, J. E., Burgisser, A., Hajimirza, S., Earley, T. C., et al. (2019). Bubble Coalescence and Percolation Threshold in Expanding Rhyolitic Magma. Geochem. Geophys. Geosyst. 20 (2), 1054–1074. doi:10.1029/2018gc008006
Giordano, D., Russell, J. K., and Dingwell, D. B. (2008). Viscosity of Magmatic Liquids: A Model. Earth Planet. Sci. Lett. 271 (1-4), 123–134. doi:10.1016/j.epsl.2008.03.038
Girona, T., Huber, C., and Caudron, C. (2018). Sensitivity to Lunar Cycles Prior to the 2007 Eruption of Ruapehu Volcano. Sci. Rep. 8 (1), 1476. doi:10.1038/s41598-018-19307-z
Gondé, C., Martel, C., Pichavant, M., and Bureau, H. (2011). In Situ bubble Vesiculation in Silicic Magmas. Am. Mineral. 96, 111–124.
Gonnermann, H. M., and Gardner, J. E. (2013). Homogeneous Bubble Nucleation in Rhyolitic Melt: Experiments and Nonclassical Theory. Geochem. Geophys. Geosyst. 14 (11), 4758–4773. doi:10.1002/ggge.20281
Gonnermann, H. M., and Manga, M. (2007). The Fluid Mechanics inside a Volcano. Annu. Rev. Fluid Mech. 39, 321–356. doi:10.1146/annurev.fluid.39.050905.110207
Gottsmann, J., Dingwell, D. B., and Gennaro, C. (1999). Thermal Expansion of Silicate Liquids: Direct Determination Using Container-Based Dilatometry. Am. Mineral. 84 (7-8), 1176–1180. doi:10.2138/am-1999-7-821
Hajimirza, S., Gonnermann, H. M., Gardner, J. E., and Giachetti, T. (2019). Predicting Homogeneous Bubble Nucleation in Rhyolite. J. Geophys. Res. Solid Earth 124 (3), 2395–2416. doi:10.1029/2018jb015891
Hamada, M., Laporte, D., Cluzel, N., Koga, K. T., and Kawamoto, T. (2010). Simulating Bubble Number Density of Rhyolitic Pumices from Plinian Eruptions: Constraints from Fast Decompression Experiments. Bull. Volcanol 72 (6), 735–746. doi:10.1007/s00445-010-0353-z
Hamling, I. J., and Kilgour, G. (2020). Goldilocks Conditions Required for Earthquakes to Trigger Basaltic Eruptions: Evidence from the 2015 Ambrym Eruption. Sci. Adv. 6 (14), eaaz5261. doi:10.1126/sciadv.aaz5261
Hill, D. P., Pollitz, F., and Newhall, C. (2002). Earthquake-Volcano Interactions. Phys. Today 55 (11), 41–47. doi:10.1063/1.1535006
Huber, C., Townsend, M., Degruyter, W., and Bachmann, O. (2019). Optimal Depth of Subvolcanic Magma Chamber Growth Controlled by Volatiles and Crust Rheology. Nat. Geosci. 12 (9), 762–768. doi:10.1038/s41561-019-0415-6
Hurwitz, S., and Navon, O. (1994). Bubble Nucleation in Rhyolitic Melts: Experiments at High Pressure, Temperature, and Water Content. Earth Planet. Sci. Lett. 122, 267–280. doi:10.1016/0012-821x(94)90001-9
Ichihara, M., and Brodsky, E. E. (2006). A Limit on the Effect of Rectified Diffusion in Volcanic Systems. Geophys. Res. Lett. 33 (2), L02316. doi:10.1029/2005gl024753
Ichihara, M., and Nishimura, T. (2009). “Pressure Impulses Generated by Bubbles Interacting with Ambient Perturbation,” in Extreme Environmental Events: Complexity in Forecasting and Early Warning (New York: Springer), 731–752. doi:10.1007/978-0-387-30440-3_415
Igualada-Villodre, E., Medina-Palomo, A., Vega-Martínez, P., and Rodríguez-Rodríguez, J. (2018). Transient Effects in the Translation of Bubbles Insonated with Acoustic Pulses of Finite Duration. J. Fluid Mech. 836, 649–693. doi:10.1017/jfm.2017.799
Iwata, S., Yamada, Y., Takashima, T., and Mori, H. (2008). Pressure-oscillation Defoaming for Viscoelastic Fluid. J. Non-Newtonian Fluid Mech. 151 (1-3), 30–37. doi:10.1016/j.jnnfm.2007.12.001
Jaupart, C., and Allègre, C. J. (1991). Gas Content, Eruption Rate and Instabilities of Eruption Regime in Silicic Volcanoes. Earth Planet. Sci. Lett. 102 (3-4), 413–429. doi:10.1016/0012-821x(91)90032-d
Kolzenburg, S., Giordano, D., Hess, K. U., and Dingwell, D. B. (2018). Shear Rate-dependent Disequilibrium Rheology and Dynamics of Basalt Solidification. Geophys. Res. Lett. 45, 6466–6475. doi:10.1029/2018gl077799
Lautze, N. C., Sisson, T. W., Mangan, M. T., and Grove, T. L. (2011). Segregating Gas from Melt: an Experimental Study of the Ostwald Ripening of Vapor Bubbles in Magmas. Contrib. Mineral. Petrol. 161 (2), 331–347. doi:10.1007/s00410-010-0535-x
Lensky, N. G., Navon, O., and Lyakhovsky, V. (2004). Bubble Growth during Decompression of Magma: Experimental and Theoretical Investigation. J. Volcanology Geothermal Res. 129 (1-3), 7–22. doi:10.1016/s0377-0273(03)00229-4
L’Heureux, I. (2007). A New Model of Volatile Bubble Growth in a Magmatic System: Isobaric Case. J. Geophys. Res. Solid Earth 112 (12), 1–14.
Liu, Y., Zhang, Y., and Behrens, H. (2005). Solubility of H2O in Rhyolitic Melts at Low Pressures and a New Empirical Model for Mixed H2O-CO2 Solubility in Rhyolitic Melts. J. Volcanology Geothermal Res. 143 (1-3), 219–235. doi:10.1016/j.jvolgeores.2004.09.019
Liu, Y., and Zhang, Y. (2000). Bubble Growth in Rhyolitic Melt. Earth Planet. Sci. Lett. 181 (1-2), 251–264. doi:10.1016/s0012-821x(00)00197-7
Long, W., and Friedman, I. (1968). The Refractive Index of Experimentally Hydrated Rhyolite Glass. Am. Mineral. 53, 1754–1756.
Longo, A., Papale, P., Vassalli, M., Saccorotti, G., Montagna, C. P., Cassioli, A., et al. (2012). Magma Convection and Mixing Dynamics as a Source of Ultra-long-period Oscillations. Bull. Volcanol 74 (4), 873–880. doi:10.1007/s00445-011-0570-0
Lyakhovsky, V., Hurwitz, S., and Navon, O. (1996). Bubble Growth in Rhyolitic Melts: Experimental and Numerical Investigation. Bull. Volcanology 58 (1), 19–32. doi:10.1007/s004450050122
Manga, M., and Brodsky, E. (2006). Seismic Triggering of Eruptions in the Far Field: Volcanoes and Geysers. Annu. Rev. Earth Planet. Sci. 34 (1), 263–291. doi:10.1146/annurev.earth.34.031405.125125
Mangan, M., Mastin, L., and Sisson, T. (2004a). Gas Evolution in Eruptive Conduits: Combining Insights from High Temperature and Pressure Decompression Experiments with Steady-State Flow Modeling. J. Volcanology Geothermal Res. 129 (1-3), 23–36. doi:10.1016/s0377-0273(03)00230-0
Mangan, M., and Sisson, T. (2000). Delayed, Disequilibrium Degassing in Rhyolite Magma: Decompression Experiments and Implications for Explosive Volcanism. Earth Planet. Sci. Lett. 183 (3-4), 441–455. doi:10.1016/s0012-821x(00)00299-5
Mangan, M., and Sisson, T. (2005). Evolution of Melt-Vapor Surface Tension in Silicic Volcanic Systems: Experiments with Hydrous Melts. J. Geophys. Res. Solid Earth 110 (1), 1–9. doi:10.1029/2004jb003215
Mangan, M. T., Sisson, T. W., and Hankins, W. B. (2004b). Decompression Experiments Identify Kinetic Controls on Explosive Silicic Eruptions. Geophys. Res. Lett. 31 (8), 1–5. doi:10.1029/2004gl019509
Martel, C., and Bureau, H. (2001). In Situ high-pressure and High-Temperature Bubble Growth in Silicic Melts. Earth Planet. Sci. Lett. 191 (1-2), 115–127. doi:10.1016/s0012-821x(01)00407-1
Martel, C., and Iacono-Marziano, G. (2015). Timescales of Bubble Coalescence, Outgassing, and Foam Collapse in Decompressed Rhyolitic Melts. Earth Planet. Sci. Lett. 412, 173–185. doi:10.1016/j.epsl.2014.12.010
Masotta, M., and Keppler, H. (2017). A New Hydrothermal Moissanite Cell Apparatus for Optical In-Situ Observations at High Pressure and High Temperature, with Applications to Bubble Nucleation in Silicate Melts. Am. Mineral. 102 (10), 2022–2031. doi:10.2138/am-2017-6093
Masotta, M., Ni, H., and Keppler, H. (2014). In Situ observations of Bubble Growth in Basaltic, Andesitic and Rhyodacitic Melts. Contrib. Mineralogy Pet. 167 (2), 1–14. doi:10.1007/s00410-014-0976-8
McIntosh, I. M., Llewellin, E. W., Humphreys, M. C. S., Nichols, A. R. L., Burgisser, A., Schipper, C. I., et al. (2014). Distribution of Dissolved Water in Magmatic Glass Records Growth and Resorption of Bubbles. Earth Planet. Sci. Lett. 401, 1–11. doi:10.1016/j.epsl.2014.05.037
Mourtada-Bonnefoi, C. C., and Laporte, D. (1999). Experimental Study of Homogeneous Bubble Nucleation in Rhyolitic Magmas. Geophys. Res. Lett. 26 (23), 3505–3508. doi:10.1029/1999gl008368
Mourtada-Bonnefoi, C. C., and Laporte, D. (2004). Kinetics of Bubble Nucleation in a Rhyolitic Melt: An Experimental Study of the Effect of Ascent Rate. Earth Planet. Sci. Lett. 218 (3-4), 521–537. doi:10.1016/s0012-821x(03)00684-8
Mourtada-Bonnefoi, C. C., and Mader, H. M. (2001). On the Development of Highly-Viscous Skins of Liquid Around Bubbles during Magmatic Degassing. Geophys. Res. Lett. 28 (8), 1647–1650. doi:10.1029/2000gl012331
Mourtada-Bonnefoi, C., and Laporte, D. (2002). Homogeneous Bubble Nucleation in Rhyolitic Magmas: An Experimental Study of the Effect of H2O and CO2. J. Geophys. Res. Solid Earth 107 (B4), 2066. doi:10.1029/2001jb000290
Murase, T., and McBirney, A. R. (1973). Properties of Some Common Igneous Rocks and Their Melts at High Temperatures. Geol. Soc. America Bull. 84 (11), 3563–3592. doi:10.1130/0016-7606(1973)84<3563:poscir>2.0.co;2
Newman, S., Stolper, E. M., and Epstein, S. (1986). Measurement of Water in Rhyolitic Glasses: Calibration of an Infrared Spectroscopic Technique. Am. Mineral. 71 (11-12), 1527–1541.
Nowak, M., Cichy, S. B., Botcharnikov, R. E., Walker, N., and Hurkuck, W. (2011). A New Type of High-Pressure Low-Flow Metering Valve for Continuous Decompression: First Experimental Results on Degassing of Rhyodacitic Melts. Am. Mineral. 96 (8-9), 1373–1380. doi:10.2138/am.2011.3786
Pichavant, M., Di Carlo, I., Rotolo, S. G., Scaillet, B., Burgisser, A., Le Gall, N., et al. (2013). Generation of CO2-rich Melts during basalt Magma Ascent and Degassing. Contrib. Mineral. Petrol. 166 (2), 545–561. doi:10.1007/s00410-013-0890-5
Pistone, M., Caricchi, L., Fife, J. L., Mader, K., and Ulmer, P. (2015). In Situ X-ray Tomographic Microscopy Observations of Vesiculation of Bubble-free and Bubble-Bearing Magmas. Bull. Volcanology 77 (12), 1–15. doi:10.1007/s00445-015-0992-1
Pleše, P., Higgins, M. D., Mancini, L., Lanzafame, G., Brun, F., Fife, J. L., et al. (2018). Dynamic Observations of Vesiculation Reveal the Role of Silicate Crystals in Bubble Nucleation and Growth in Andesitic Magmas. Lithos 296-299, 532–546.
Proussevitch, A. A., and Sahagian, D. L. (1998). Dynamics and Energetics of Bubble Growth in Magmas: Analytical Formulation and Numerical Modeling. J. Geophys. Res. 103 (B8), 18223–18251. doi:10.1029/98jb00906
Rothery, D. A., Sumner, J. M., Spieler, O., and Dingwell, D. B. (2007). Impact Vesiculation – a New Trigger for Volcanic Bubble Growth and Degassing. Eearth Discuss. 2 (4), 151–167. doi:10.5194/eed-2-151-2007
Ryan, A. G., Russell, J. K., Hess, K. U., Phillion, A. B., and Dingwell, D. B. (2015). Vesiculation in Rhyolite at Low H 2 O Contents: A Thermodynamic Model. Geochem. Geophys. Geosyst. 16, 4292–4310. doi:10.1002/2015gc006024
Sawi, T. M., and Manga, M. (2018). Revisiting Short-Term Earthquake Triggered Volcanism. Bull. Volcanol 80 (7), 57. doi:10.1007/s00445-018-1232-2
Seropian, G., Kennedy, B. M., Walter, T. R., Ichihara, M., and Jolly, A. D. (2021). A Review Framework of How Earthquakes Trigger Volcanic Eruptions. Nat. Commun. 12 (1), 1004. doi:10.1038/s41467-021-21166-8
Shea, T. (2017). Bubble Nucleation in Magmas: A Dominantly Heterogeneous Process? J. Volcanology Geothermal Res. 343, 155–170. doi:10.1016/j.jvolgeores.2017.06.025
Sparks, R. S. J. (1978). The Dynamics of Bubble Formation and Growth in Magmas: A Review and Analysis. J. Volcanology Geothermal Res. 3, 1–37. doi:10.1016/0377-0273(78)90002-1
Stevenson, R., Bagdassarov, N., and Romano, C. (1997). Vesiculation Processes in a Water-Rich Calc-Alkaline Obsidian. Earth Planet. Sci. Lett. 146 (3-4), 555–571. doi:10.1016/s0012-821x(96)00236-1
Tuffen, H., and Castro, J. M. (2009). The Emplacement of an Obsidian Dyke through Thin Ice: Hrafntinnuhryggur, Krafla Iceland. J. Volcanology Geothermal Res. 185 (4), 352–366. doi:10.1016/j.jvolgeores.2008.10.021
von Aulock, F. W., Kennedy, B. M., Maksimenko, A., Wadsworth, F. B., and Lavallée, Y. (2017). Outgassing from Open and Closed Magma Foams. Front. Earth Sci. 5 (June), 1–7. doi:10.3389/feart.2017.00046
von Aulock, F. W., Kennedy, B. M., Schipper, C. I., Castro, J. M., E. Martin, D. D., Oze, C., et al. (2014). Advances in Fourier Transform Infrared Spectroscopy of Natural Glasses: From Sample Preparation to Data Analysis. Lithos 206-207 (1), 52–64. doi:10.1016/j.lithos.2014.07.017
Wadsworth, F. B., Witcher, T., Vossen, C. E. J., Hess, K. U., Unwin, H. E., Scheu, B., et al. (2018). Combined Effusive-Explosive Silicic Volcanism Straddles the Multiphase Viscous-To-Brittle Transition. Nat. Commun. 9 (1), 4696–4698. doi:10.1038/s41467-018-07187-w
Wallace, P. J., Anderson, A. T., and Davis, A. M. (1995). Quantification of Pre-eruptive Exsolved Gas Contents in Silicic Magmas. Nature 377, 612–616. doi:10.1038/377612a0
Walter, T. R., Wang, R., Acocella, V., Neri, M., Grosser, H., and Zschau, J. (2009). Simultaneous Magma and Gas Eruptions at Three Volcanoes in Southern Italy: An Earthquake Trigger? Geology 37 (3), 251–254. doi:10.1130/g25396a
Walter, T. R., Wang, R., Zimmer, M., Grosser, H., Lühr, B., and Ratdomopurbo, A. (2007). Volcanic Activity Influenced by Tectonic Earthquakes: Static and Dynamic Stress Triggering at Mt. Merapi. Geophys. Res. Lett. 34 (5), L05304. doi:10.1029/2006gl028710
Wiesmaier, S., Morgavi, D., Renggli, C. J., Perugini, D., De Campos, C. P., Hess, K.-U., et al. (2015). Magma Mixing Enhanced by Bubble Segregation. Solid Earth 6 (3), 1007–1023. doi:10.5194/se-6-1007-2015
Wylie, J. J., Voight, B., and Whitehead, J. A. (1999). Instability of Magma Flow from Volatile-dependent Viscosity. Science 285 (5435), 1883–1885. doi:10.1126/science.285.5435.1883
Wysoczanski, R., and Tani, K. (2006). Spectroscopic FTIR Imaging of Water Species in Silicic Volcanic Glasses and Melt Inclusions: An Example from the Izu-Bonin Arc. J. Volcanology Geothermal Res. 156 (3-4), 302–314. doi:10.1016/j.jvolgeores.2006.03.024
Yamashita, S. (1999). Experimental Study of the Effect of Temperature on Water Solubility in Natural Rhyolite Melt to 100 MPa. J. Pet. 40 (10), 1497–1507. doi:10.1093/petroj/40.10.1497
Yoshimura, S., and Nakamura, M. (2008). Diffusive Dehydration and Bubble Resorption during Open-System Degassing of Rhyolitic Melts. J. Volcanology Geothermal Res. 178 (1), 72–80. doi:10.1016/j.jvolgeores.2008.01.017
Keywords: vesiculation, bubbles, pressure oscillations, rhyolite, high temperature, experimental
Citation: Seropian G, Kennedy BM, Kendrick JE, Lavallée Y, Nichols ARL, von Aulock FW, Dingwell DB, Hess K-U, Lamur A, Schauroth J, Vasseur J and Wadsworth FB (2022) Vesiculation of Rhyolitic Melts Under Oscillatory Pressure. Front. Earth Sci. 10:812311. doi: 10.3389/feart.2022.812311
Received: 10 November 2021; Accepted: 02 February 2022;
Published: 17 March 2022.
Edited by:
Finnigan Illsley-Kemp, Victoria University of Wellington, New ZealandReviewed by:
Simon James Barker, Victoria University of Wellington, New ZealandBenjamin James Andrews, Smithsonian Institution, United States
Copyright © 2022 Seropian, Kennedy, Kendrick, Lavallée, Nichols, von Aulock, Dingwell, Hess, Lamur, Schauroth, Vasseur and Wadsworth. This is an open-access article distributed under the terms of the Creative Commons Attribution License (CC BY). The use, distribution or reproduction in other forums is permitted, provided the original author(s) and the copyright owner(s) are credited and that the original publication in this journal is cited, in accordance with accepted academic practice. No use, distribution or reproduction is permitted which does not comply with these terms.
*Correspondence: Gilles Seropian, gse33@uclive.ac.nz