Assessment of Landslide Hazard in Jiangxi Using Geo-information Technology
 Penghui Ou1
  Weicheng Wu1*
  Yaozu Qin1 Xiaoting Zhou1 Wenchao Huangfu1 Yang Zhang1 Lifeng Xie1 Xiaolan Huang1 Xiao Fu1 Jie Li1 Jingheng Jiang1 Ming Zhang1 Yixuan Liu1 Shanling Peng1 Chongjian Shao1 Yonghui Bai1 Xiaofeng Zhang2 Xiangtong Liu3 Wenheng Liu1
- 1Key Laboratory of Digital Lands and Resources and Faculty of Earth Sciences, East China University of Technology, Nanchang, China
- 2School of Geophysics and Measurement-Control Technology, East China University of Technology, Nanchang, China
- 3Faculty of Geomatics, East China University of Technology, Nanchang, China
Landslides constitute a severe environmental problem in Jiangxi, China. This research was aimed at conducting landslide hazard assessment to provide technical support for disaster reduction and prevention action in the province. Fourteen geo-environmental factors, e.g., slope, elevation, road, river, fault, lithology, rainfall, and land cover types, were selected for this study. A test was made in two cases: (1) only based on the main linear features, e.g., main rivers and roads, and (2) with detailed complete linear features including all levels of roads and rivers. After buffering of the linear features, an information value (IV) analysis was applied to quantify the distribution of the observed landslides for each subset of the 14 factors. The results were inputted into the binary logistic regression model (LRM) for landslide risk modeling, taking the known landslide points as a training set (70% of the total 9,525 points). The calculated probability of a landslide was further classified into five grades with an interval of 0.2 for hazard mapping: very high (3.70%), high (4.05%), moderate (18.72%), low (27.17%), and stable zones (46.36%). The accuracy was evaluated by AUC [the area under the receiver operating characteristic (ROC) curve] vs. the validation set (30%, the remaining landslides). The final results show that with increasing the completeness of the linear features, the modeling reliability also significantly increased. We hence concluded that the tested methodology is capable of achieving the landslide hazard prediction at regional scale, and the results may provide technical support for geohazard reduction and prevention in the studied province.
Introduction
Landslides are a worldwide natural hazard, especially in Southern and Southeastern Asia including South China, and cause huge damages to human life and property, e.g., destroying houses, farmland, roads, and various infrastructures; killing livestock; and even amplifying existing disasters (Wu and Ai, 1995; Nadim et al., 2006; Assilzadeh et al., 2010; Froude and Petley, 2018). It is of critical importance to conduct landslide risk prediction, zoning, and assessment to provide scientific advice and technical support for disaster prevention and early warning.
Actually, a large number of institutions and scientists have implemented projects or undertaken research to find solutions to the problem of landslide disasters, including landslide mechanism analysis, risk mapping, and assessment (Montgomery and Dietrich, 1994; Guzzetti et al., 1999; Aleotti and Chowdhury, 1999; Ayalew and Yamagishi, 2005; Ruff and Czurda, 2008; Fan et al., 2016; Arabameri et al., 2017; Zhang Y. et al., 2020)1. These authors have proposed different qualitative and quantitative assessment approaches by involving a set of indicators (Guzzetti et al., 1999; Corominas et al., 2014; Goetz et al., 2015; Furlani and Ninfo, 2015; Li et al., 2017; Zhu et al., 2019; Zhang Y. et al., 2020; see text footnote 1), and these studies laid a solid foundation for our landslide hazard assessment study in Jiangxi, which ranks number 2 in terms of geohazard occurrence frequency in China in 2019 (Zhang Y. et al., 2020).
Actually, landslides are the result of the interaction of multiple geo-environmental factors and human activity, including geological lithology, structure (e.g., fractural zones, faults, and joints), elevation, slope, aspect, river, regolith, soil, land cover, rainfall, roads, and housing development. Djukem et al. (2020) and Zhang Y. et al. (2020) have discussed and successfully applied these factors for landslide hazard assessment. Hence, these geo-environmental factors will be necessary and taken into account for achieving our purpose in this study.
Combining the knowledge of different disciplines can effectively improve the assessment accuracy of geohazards in practical applications (Kilburn and Pasuto, 2003). The assessment of landslide hazard refers to the prediction of the probability of its occurrence in a specific area by studying the combined effects of multiple geo-environmental factors (Tian et al., 2020; Zhang Y. et al., 2020; see text footnote 1). To achieve an assessment, two types of approaches, i.e., knowledge-driven and data-driven methods, are at present available. The knowledge-driven method relies on expert experience and knowledge. It is subject to certain subjectivity and uncertainty and suitable for areas with simple geo-environmental conditions or areas with limited data. This method is of limited assessment accuracy for areas with complex conditions and unknown landslide mechanisms. For the data-driven method, the landslide assessment factors are selected by quantitative analysis, and risk assessment is conducted by employing artificial intelligence approaches. Hence, theoretically and practically, the data-driven method seems to be more robust and reliable although more computing power is required (Zhang and Jiang, 2004; Zhang et al., 2017).
As a matter of fact, a number of scientists have made efforts on this research topic. For the time being, statistical analysis, especially machine learning (Wu et al., 2018), is the common approach for landslide hazard risk assessment, for example, the information value (IV) analysis (Gao et al., 2006; Chen et al., 2012; Sharma et al., 2015; Feng et al., 2016; Ren et al., 2018), the logistic regression model (LRM) (Carrara, 1983; Lee and Min, 2001; Ayalew and Yamagishi, 2005; Xing et al., 2004; Bai et al., 2010; Feng et al., 2016), artificial neural networks (ANNs) (Pradhan and Lee, 2007; Yilmaz, 2009; Lee et al., 2010; Feng et al., 2016; Kalantar et al., 2018), support vector machines (SVMs) (Yao et al., 2008; Peng et al., 2014; Kumar et al., 2017; Xia et al., 2018; Wang et al., 2019), and random forests (RFs) (Li et al., 2014; Kim et al., 2018; Dang et al., 2018; Zhang Y. et al., 2020; see text footnote 1). Recently, some authors have even attempted to employ a combination of LRM with IV analysis (Feng et al., 2016; Du et al., 2017; Fan et al., 2018; Zhang Q. et al., 2020) or LRM with certainty factor (CF) analysis (Yang et al., 2019; Zhang Q. et al., 2020) for achieving landslide risk assessment. Although these different techniques have been proven to be effective, there is no consensus on which technique and method are the best (Wang et al., 2005; Zhang, 2019). It can be seen from the above brief review that data-driven approaches, in particular, machine learning approaches, have great potential in geohazard risk prediction and assessment. Zhang (2019) and Zhao et al. (2019) noted that IV-based LRM is well capable of addressing the problem of binary variables (e.g., presence or absence of landslides) and has been applied to the assessment of landslide hazards.
In view of these, the objective of this study was to realize a landslide risk assessment by the combined approaches of IV and LRM in order to provide technical support for disaster reduction and prevention of the local authorities, taking Jiangxi, China, as an example. With more and more regional-scale studies on geohazard assessment being required to meet the need of Disaster Reduction and Prevention actions of governments, one may immediately think to use coarse-resolution data with major features of the geo-environmental factors for this purpose. Thus, one specific objective was to test the influence of data completeness and detailed extent on such regional-scale modeling and prediction and to check whether coarse-resolution data and major features alone are able to successfully achieve this task.
Materials and Methods
Study Area
Jiangxi is a province located in Southeast China, extending from 24°29′14″N to 30°04′41″N in latitude and from 113°34′36″E to 118°28′58″E in longitude, covering an area of 166,900 km2. Situated in the south of the middle reaches of the Yangtze River Watershed, the overall terrain of Jiangxi looks like a horseshoe-type or dustpan-type basin. The Poyang Lake basin is situated between the Yangtze River in the north and a series of NE- or NNE-striking mountain ranges such as Huaiyu and Baiji in the east, Wuyi in the southeast, Jiulian in the south, and Mufu, Jiuling, Wugong, Wangyang, and Zhuguang in the west. There are five main rivers, namely, Xinjiang and Raohe from the east, Fuhe and Ganjiang from the south, and Xiushui from the west, all flowing into the Poyang Lake and then joining the Yangtze River (Figure 1). Jiangxi belongs to the subtropical climate zone. Rainfall is abundant, and monsoon rain is predominant in spring and summer, in particular in June and July. The annual precipitation is more than 1,500 mm. The average annual temperature is about 16.3–19.5°C, generally increasing from 16.3 to 17.5°C in the north to 19.0–19.5°C in the south. The northwest wind prevails in winter, and it is relatively cold. In summer, it is humid and hot with an average temperature of 24–29°C (and the extreme maximum temperature is more than 40.0°C because of the Pacific subtropical monsoon).
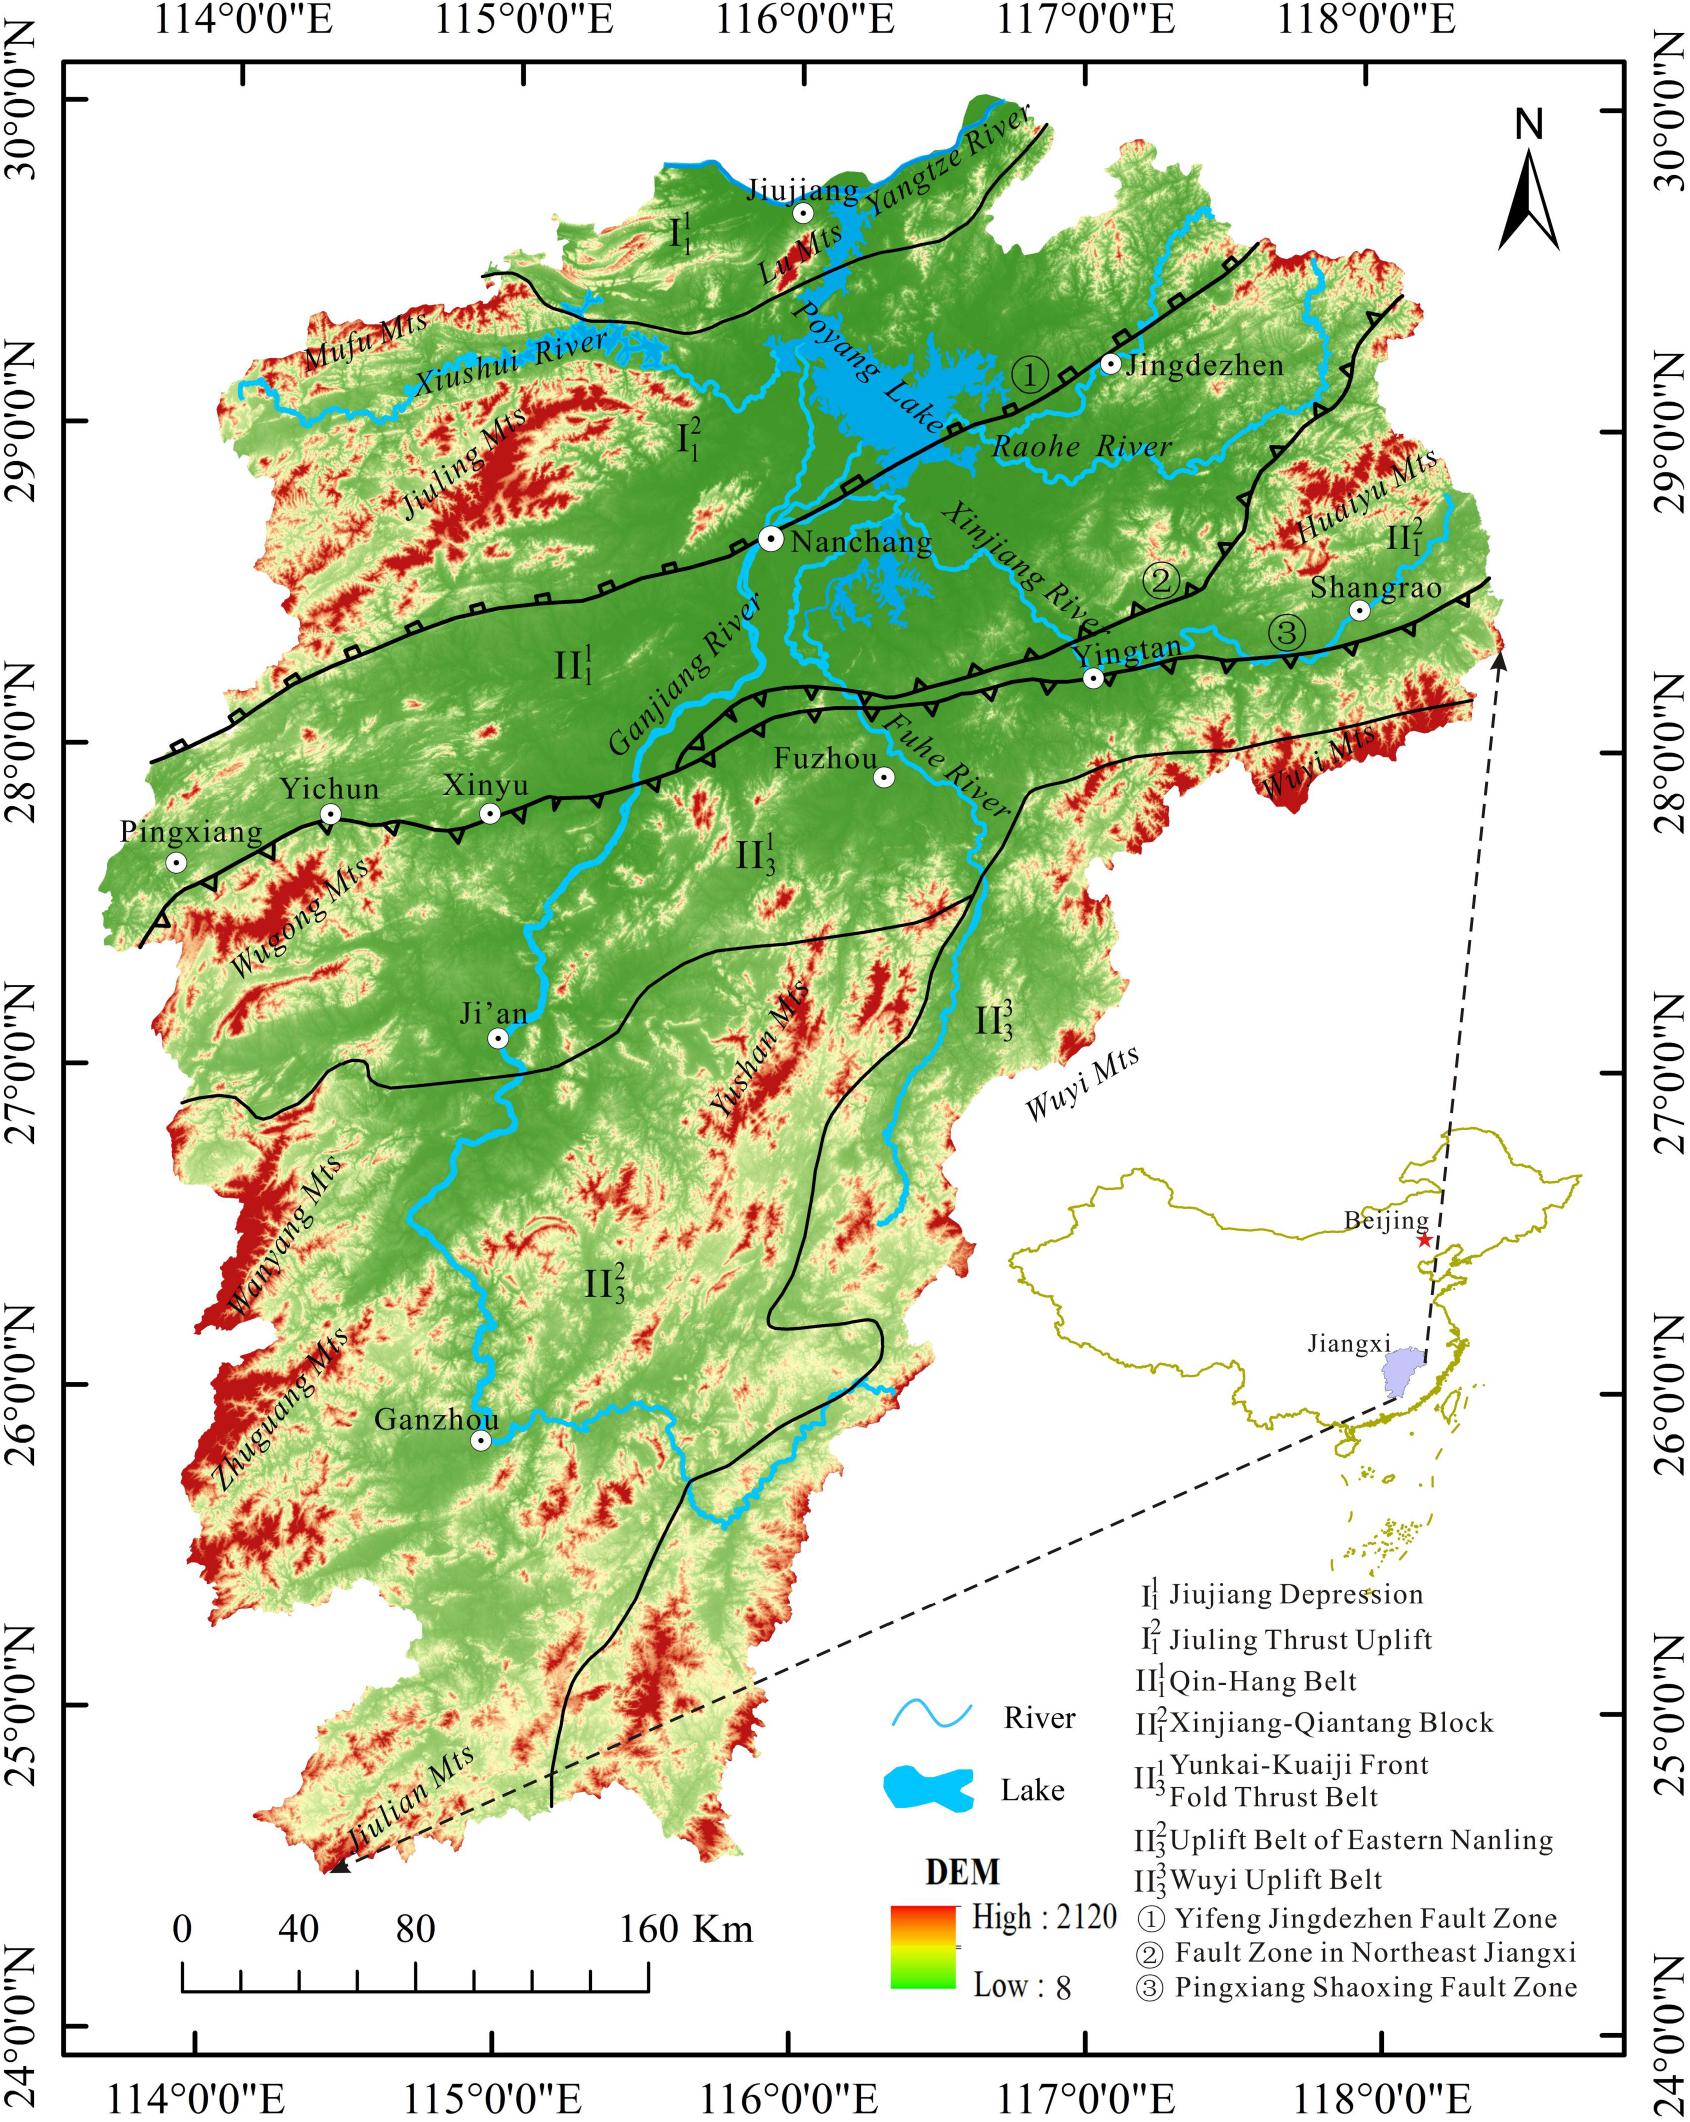
Figure 1. Location of the study area, Jiangxi Province, and its main geotectonic units (Source: Geological Book of Jiangxi, Jiangxi Bureau of Geology, 2017).
Geologically, as shown in Figure 1, Jiangxi crosses over two geotectonic units: Yangtze Plate in the north (I) and Cathaysia Massif (South China Plate) in the south (II3) where the Qian-Hang Tectonic Belt (II1) is the joint belt between the two plates (Yang, 2003). Though active faults are rarely observed nowadays, shaped by such geotectonic settings, the landform characterized by the mountains-basin pattern facilitates the occurrence of geohazards, especially landslides, in Jiangxi. Up to 2020, a total of 9,525 landslide taking place in the past decades were collected. The economic losses caused by geohazards are next to those by floods and droughts, and their casualties even exceed those of floods (Jiangxi Geological Disaster Emergency Center, 2014). Research on zoning of landslide susceptibility will hence help us understand the overall situation of landslide disasters and provide technical support for decision making in hazard prediction, prevention, and early warning in the province.
Data and Preprocessing
Landslide Inventory Data
Apart from the field survey by ourselves in July–October 2019 and August 2020, the majority of the landslide data in Jiangxi were obtained from the Environmental Science Data Center, Institute of Geographical Sciences and Natural Resources Research (IGSNRR) of the Chinese Academy of Sciences (CAS). A total of 9,525 landslide points were made available for this research. The spatial distribution of these landslides is shown in Figure 2.
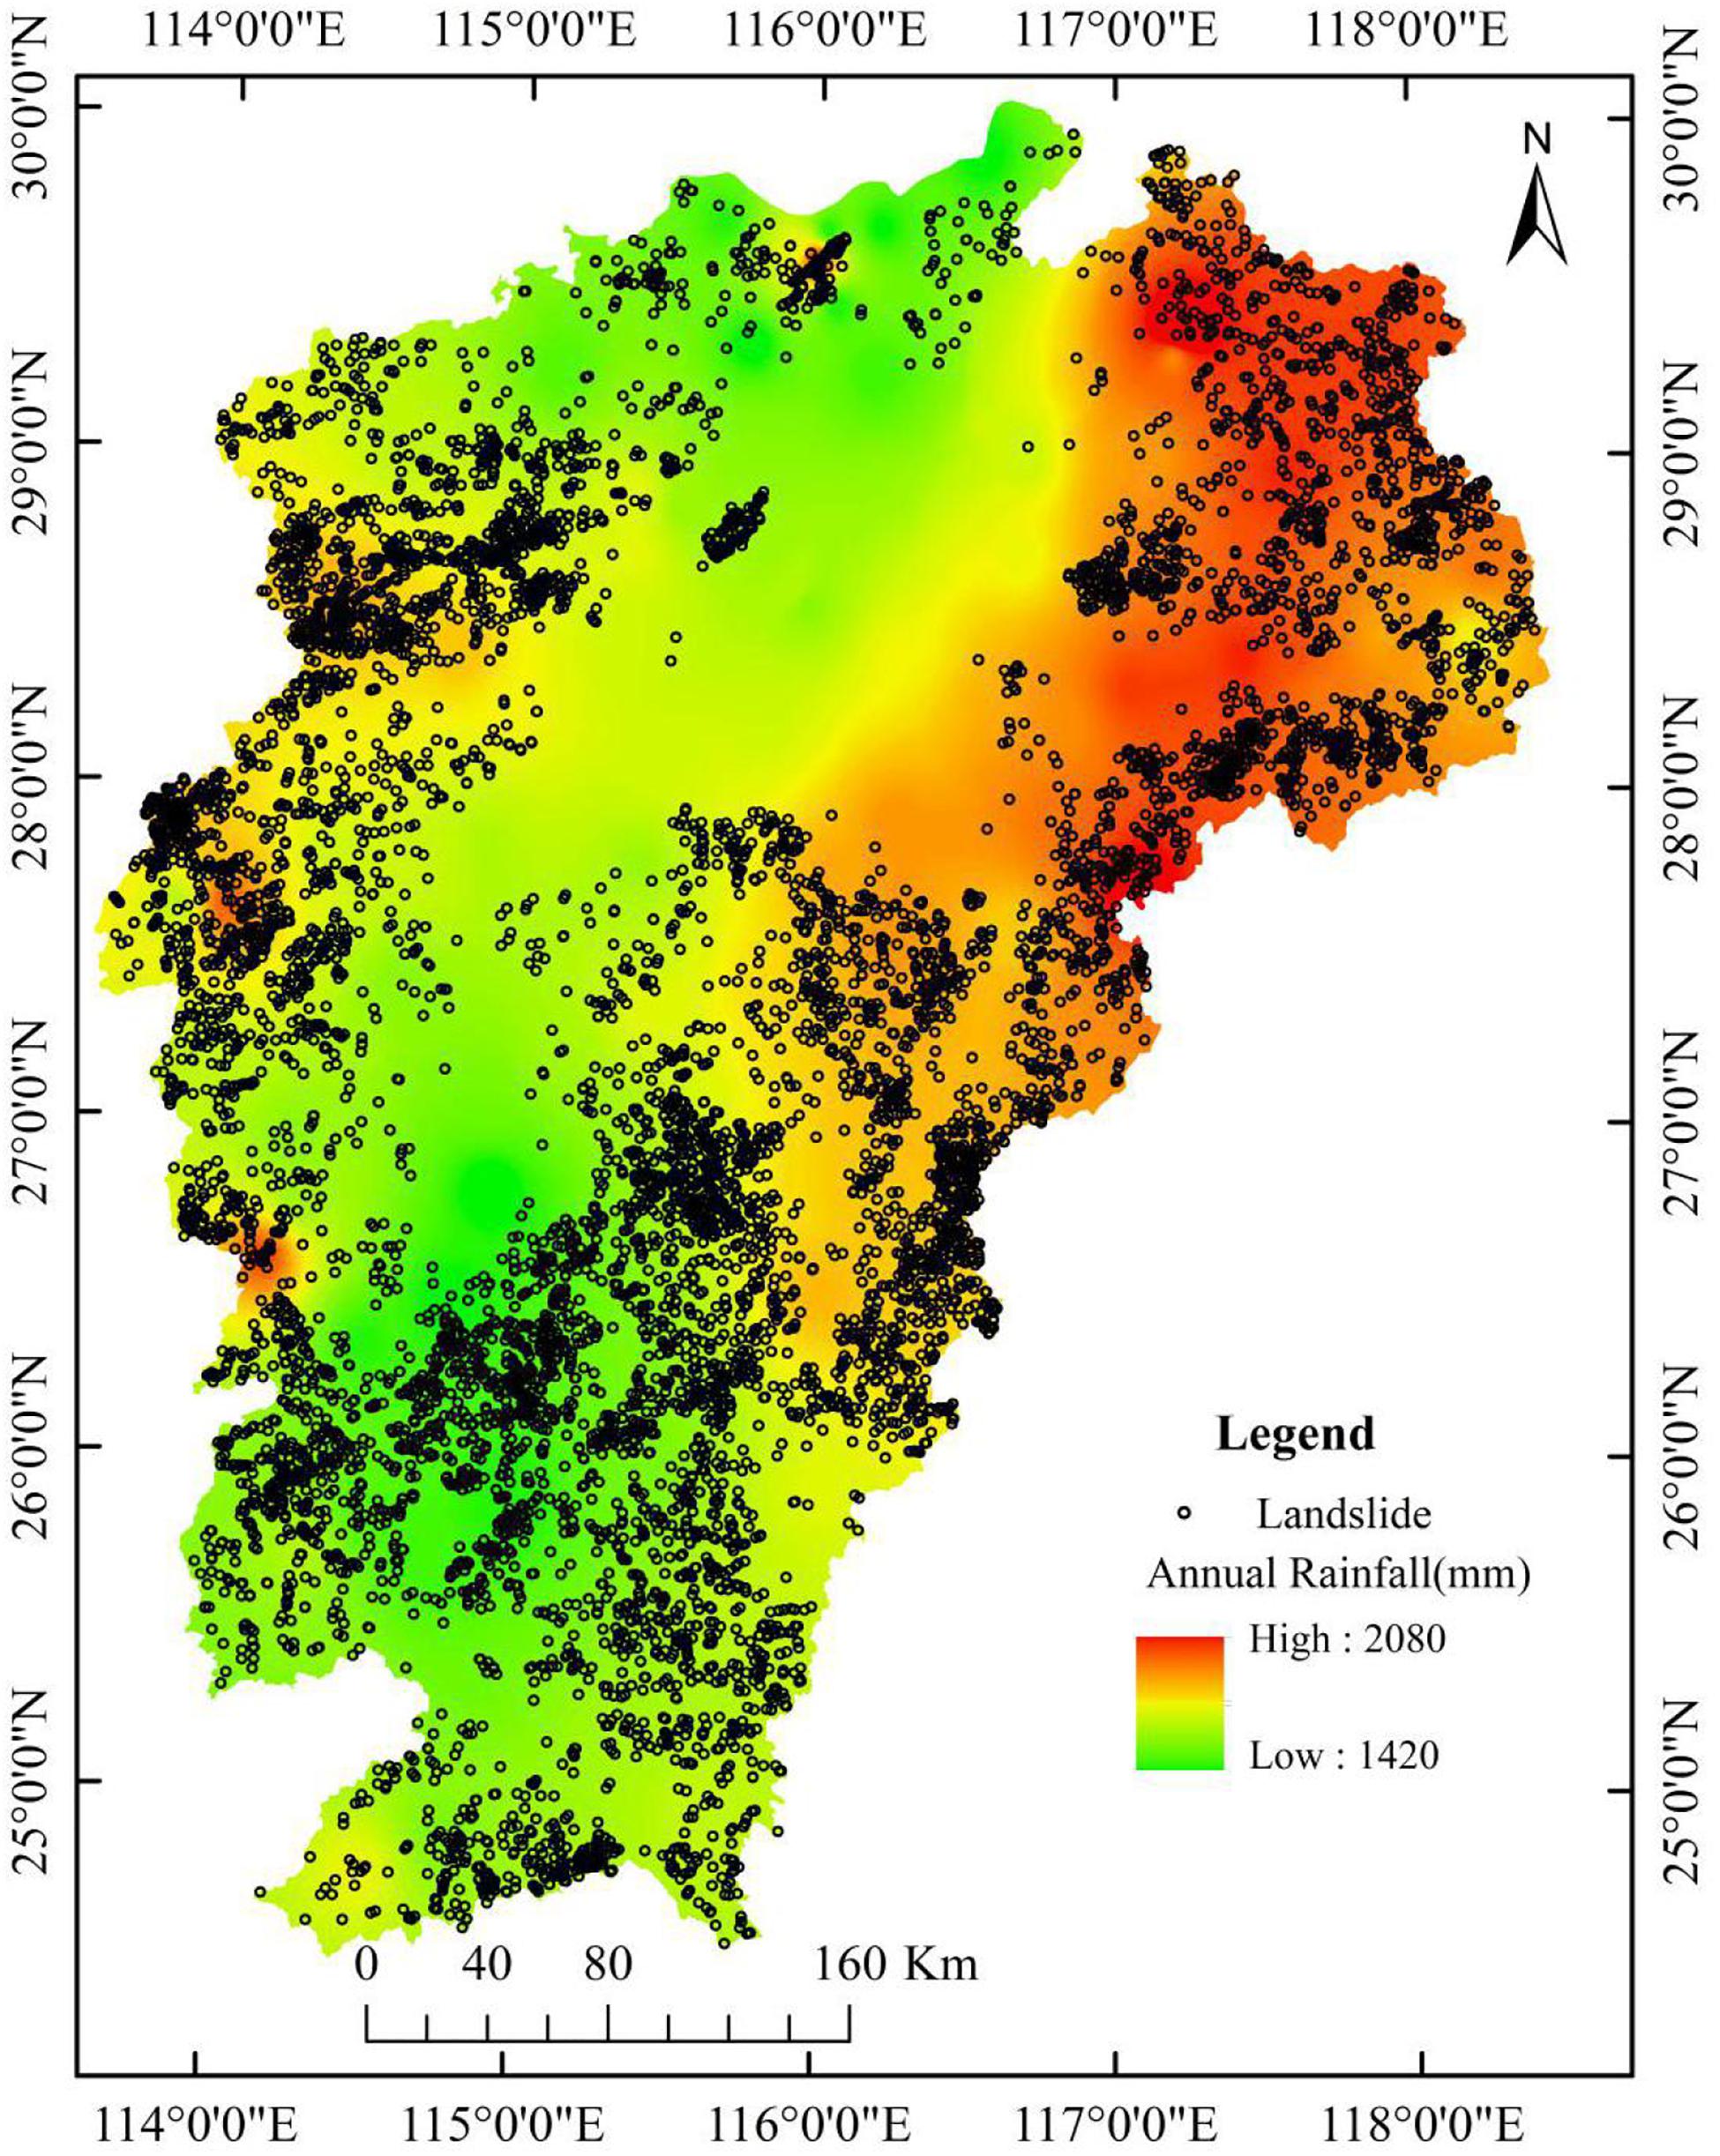
Figure 2. Distribution map of landslide in Jiangxi in the context of annual rainfall.
Geo-Environmental Factors
Based on the field survey and general understanding of the landslide mechanism, the following geo-environmental parameters were utilized for risk assessment, e.g., slope; aspect; elevation derived from the digital elevation model (DEM); rainfall including mean annual rainfall; accumulated monthly rainfall of March–July, March–June, and May–July; roads; rivers; faults; lithologies of strata; normalized difference vegetation index (NDVI); and land cover (Table 1). These factors include both continuous and discrete data and are described as follows.
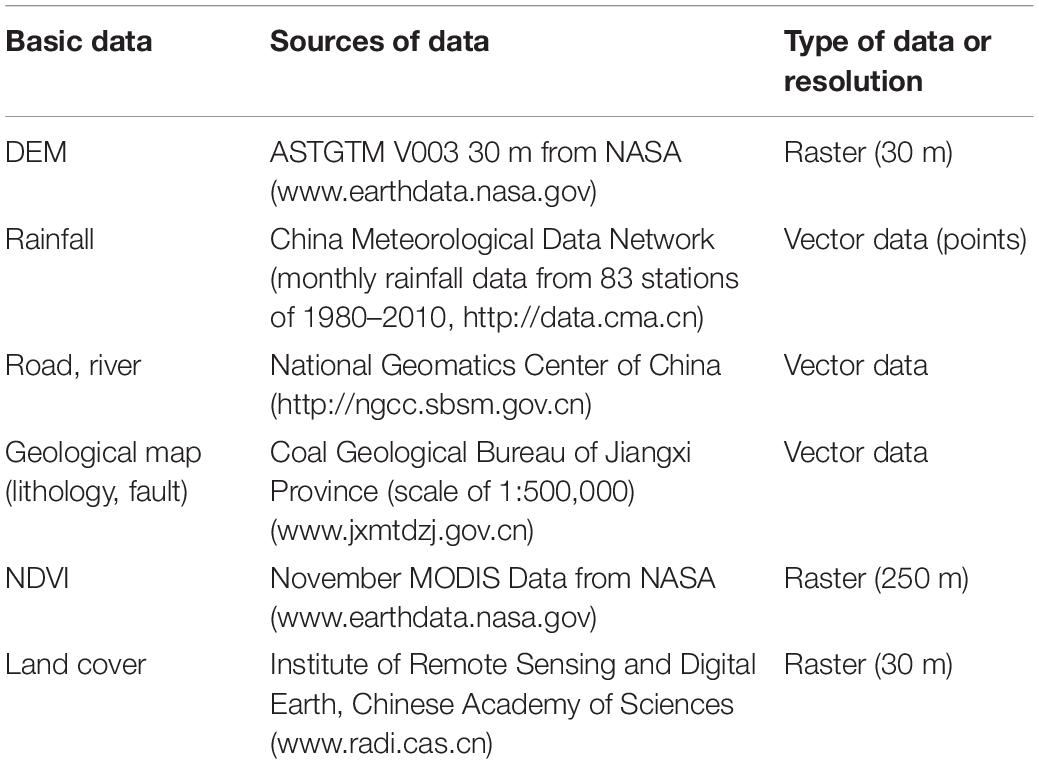
Table 1. Data sources and data types of assessment factors.
Slope
The slope is an important factor in the occurrence of landslides which take place only when the slope reaches a certain degree. The geometric characteristics of the slope determine the stress distribution and hence the stability of the slope (Lan et al., 2002). Human activity such as road construction reduces the slope resistance and exacerbates instability (Yu, 2003). Derived from the DEM product ASTGTM (V003, 30 m), slope ranges from 0° to 75° in Jiangxi and is presented in Figure 3A.
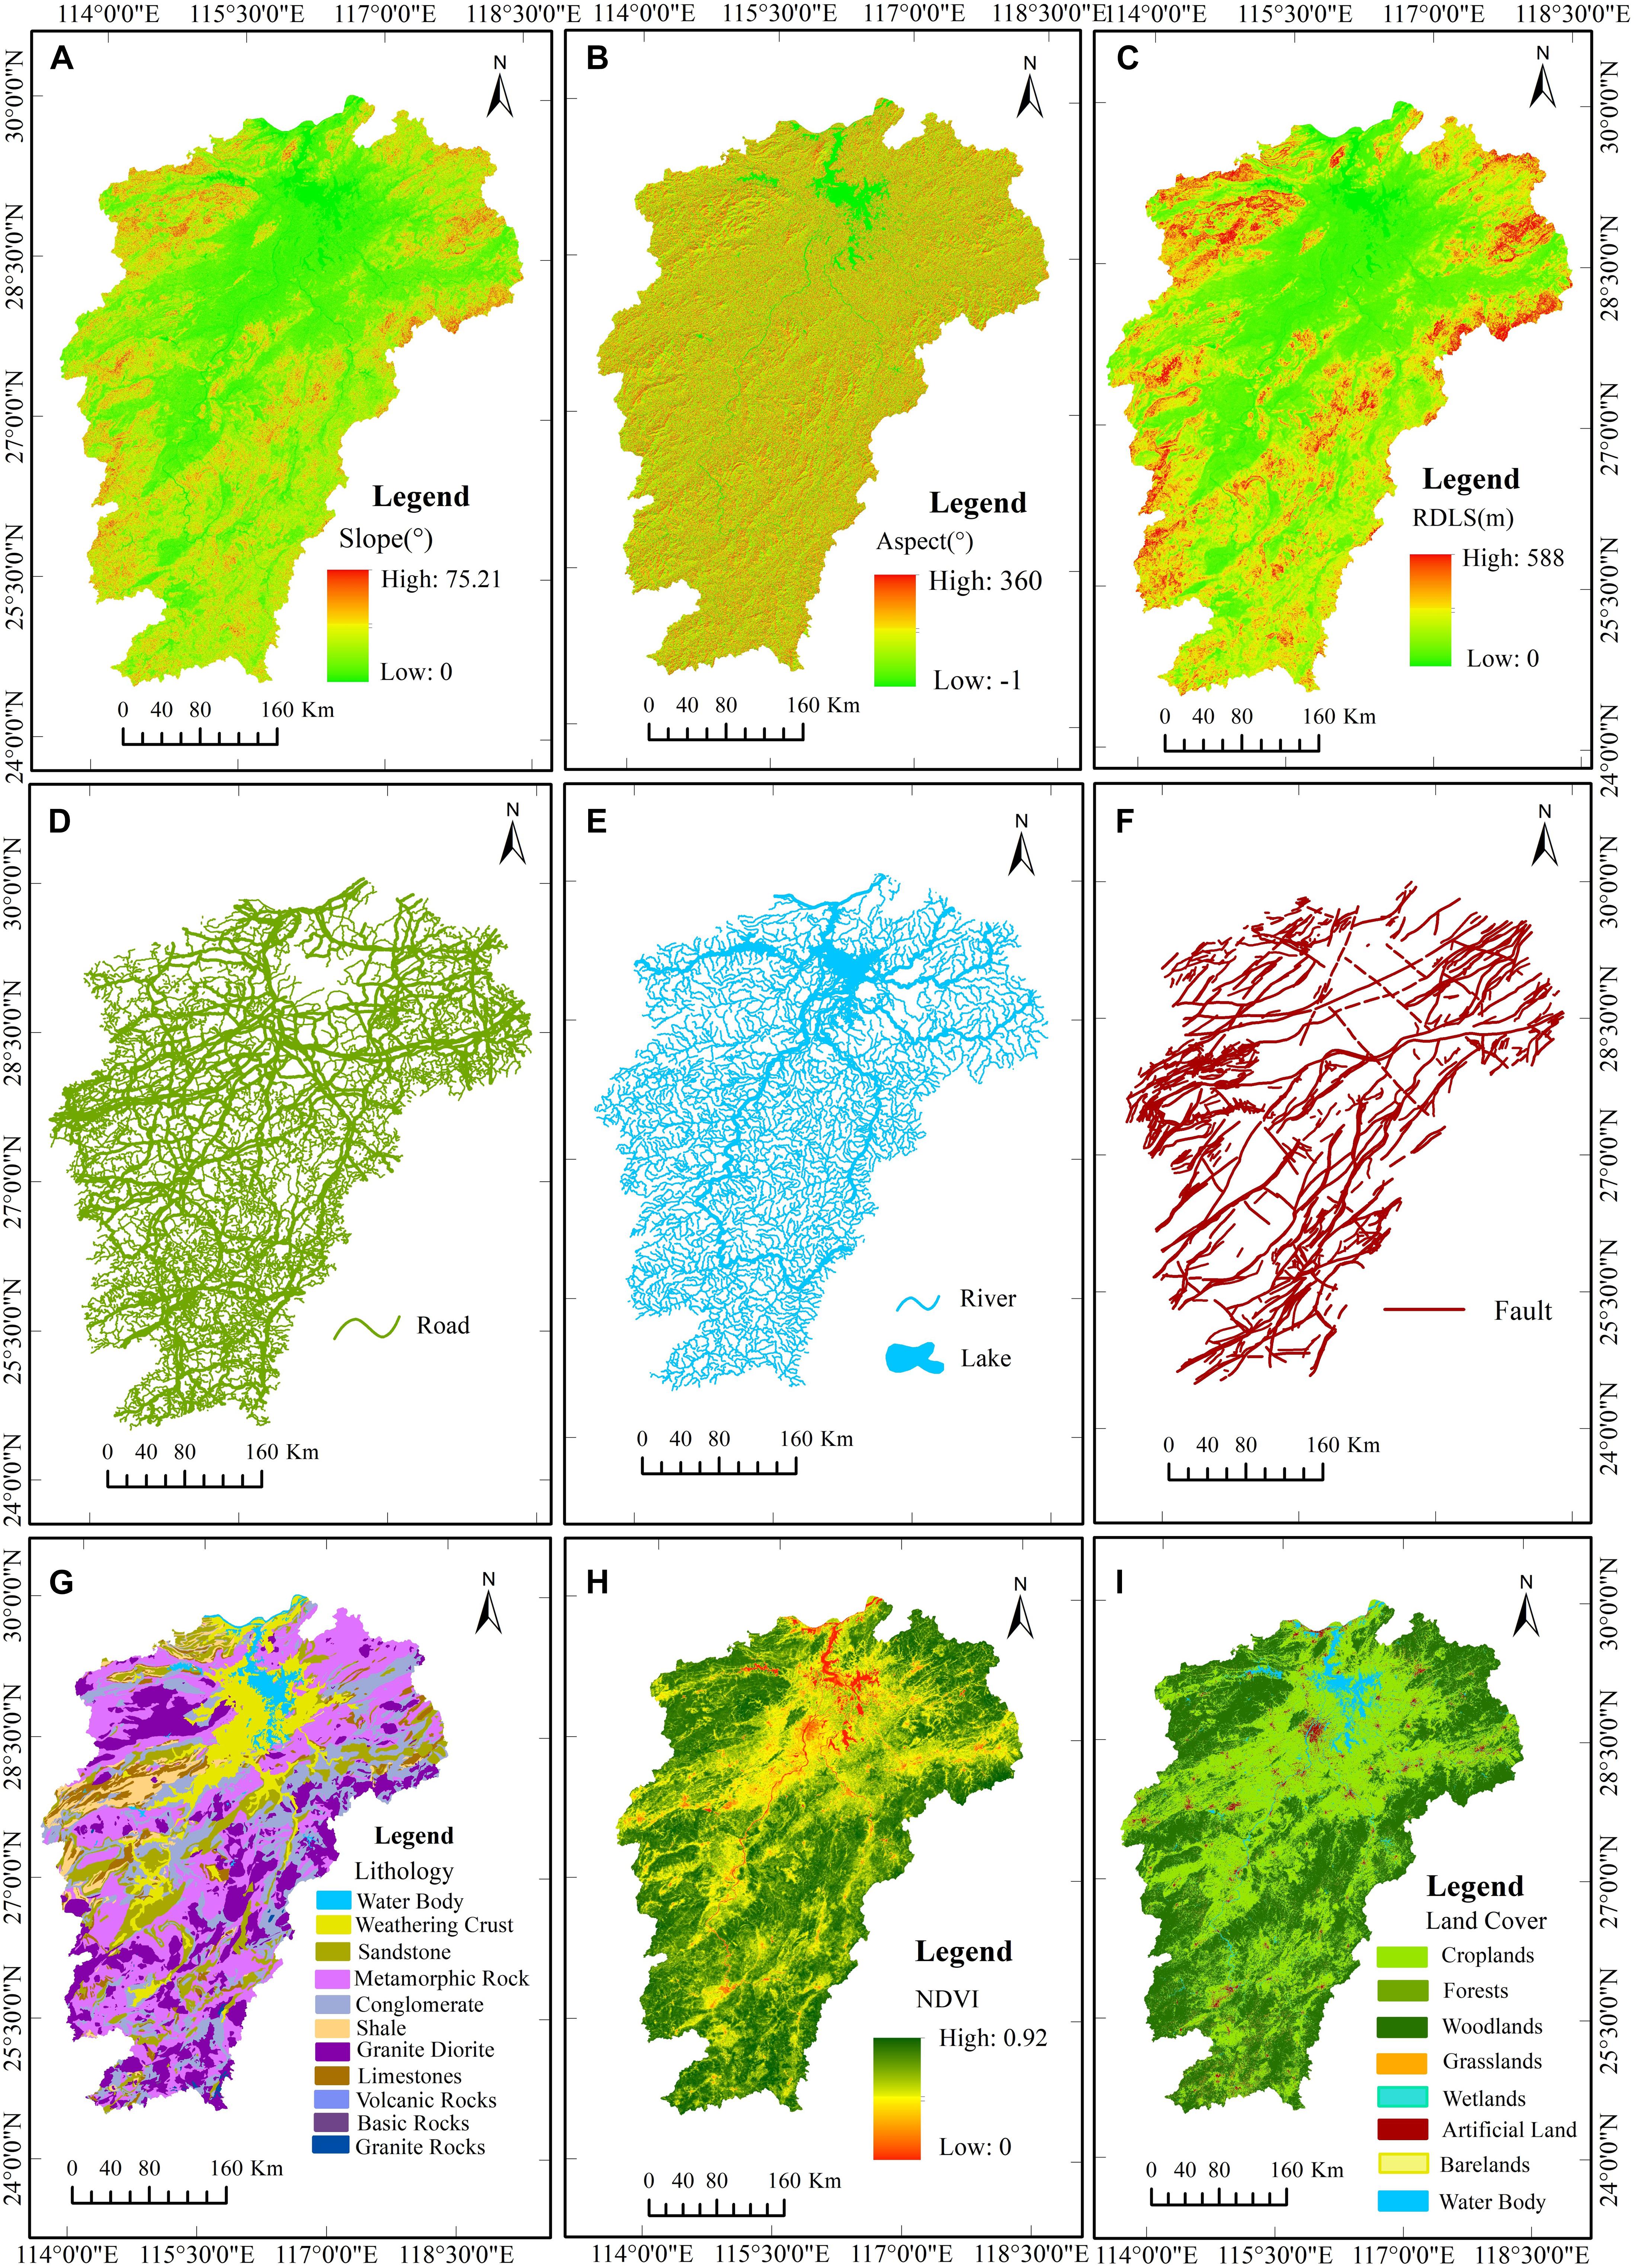
Figure 3. Landslide proneness factors used in this research, taking the following as an example: (A) slope, (B) aspect, (C) RDLS, (D) roads, (E) rivers, (F) faults, (G) lithology, (H) NDVI, and (I) land cover.
Aspect
The aspect is the normal direction of the slope surface projected on the horizontal plane. Jiangxi is situated to the north of the Tropic of Cancer. The southern slopes receive more solar radiation, leading to a higher temperature, bigger contrast in day–night temperature, and a stronger evapotranspiration than in the northern ones. Such difference in physiochemical conditions results in difference in vegetation development and weathering between the southern and northern slopes. Su (2006) noted that landslides occur more frequently in the southern slopes than in the northern ones. For this reason, the aspect information of Jiangxi was extracted from the DEM based on spatial analysis (Figure 3B) and used for landslide hazard assessment.
Relief Degree of Land Surface (RDLS)
The RDLS is a parameter to recount surface morphology, one of the most important factors to determine the topographic conditions and to characterize the potential energy of surface erosion and material movement of the slope (Yin et al., 2010; Su et al., 2017). It is useful for quantitative analysis of landform and erosion degree of the regional surface (Guo et al., 2008). Based on the spatial analysis, the RDLS is calculated from the DEM with values ranging from 0 to 588 m (Figure 3C).
Distance From the Linear Features: Roads, Rivers, and Faults
The study area is situated in the south of the Yangtze River, composed a series of hills and mountains (see section “Study Area”), leading to the development of the five important rivers and their tributaries and subtributaries. They have been modifying the landscape and breaking up the rocks and, at the same time, generating instability of slopes and landslides. Generally, the closer to the river, the higher the slope instability and risk of landslide.
Faults are geological structures in which the rock blocks of the two sides are displaced against each other along the fractural surface, destroying the integrity of the rock formations. The development degree of joints of the geological bodies is often controlled by faulting. The occurrence of several geohazards is closely associated with faults, especially active faults (Huang and Li, 2009).
Road construction and other housing development engineering have led to slope cutting and destruction of the stability of slopes composed of rocks and soils. Hence, road networks and slope housing are a landslide indicator as well (Xu, 2005; Meten et al., 2015; Zhang Y. et al., 2020; see text footnote 1).
Linear features like roads (Figure 3D), rivers (Figure 3E), and faults (Figure 3F) have the same proximity effect; that is, the closer the slope to the linear feature, the higher the risk of landslide it may have. Moreover, scale may also play a role as the larger the scale of the faults, roads, and rivers, the stronger their impacts on the stability of the slope.
With a specific purpose to test the impacts of completeness of roads and rivers, we set up two groups of these two linear features for modeling: (1) main roads (highways and railways) and big rivers and their major tributaries and (2) main roads, secondary roads (provincial and county levels) and countryside roads, and big rivers with their major tributaries, subtributaries, and streams.
According to the field investigations undertaken in the period July–October 2019 and August 2020 and prior knowledge of experts, these features were largely divided into two scales: large and small. The large-scale main roads were categorized into buffers of 0–60, 60–120, 120–180, and >180 m, and the small secondary and countryside roads into 0–30, 30–60, 60–90, and >90 m. For the big rivers and faults (>10 km), buffer zones of 0–90, 90–180, 180–270, 270–360, 360–450, 450–540, and >540 m were derived, while for small rivers or subtributaries and faults (<10 km), smaller buffers of 0–30, 30–60, 90–120, 120–150, 150–180, and >180 m were generated.
Rainfall
Rainfall is a salient triggering factor for landslides as it constitutes slope runoff, leading to soil erosion and lubrication of potential sliding surfaces. Rainfall may increase the load of rock and soil and reduce the resistance from underlying rocks. Usually, after a continuous rainfall reaches a certain threshold, landslides take place (Guzzetti et al., 2008). The distribution of heavy rainfall affects the concentration of landslides (Shan et al., 2004). Because of the subtropical monsoon climate, Jiangxi receives abundant rainfall and frequent heavy rains, which strongly provoke the occurrence of landslides. The annual rainfall in Jiangxi ranges from 1,361.6 to 2,037.4 mm (Figure 2). As landslides occur mainly in spring and early summer from March to July, especially from June to July, the mean annual rainfall and the mean accumulated March–June, March–July, and May–July rainfall of the period 1981–2010 were produced for hazard analysis.
Lithology of Strata
Lithology plays a certain role in landslide events as it constitutes different resistances and degrees of propensity to this hazard (Yu, 2003). In addition, different lithologies may be weathered into different regoliths and soils. Lithological properties of the study area can be largely divided into weathering crust (including soil), sandstone, metamorphic rocks, conglomerate, shale, granodiorite, limestone, volcanic rocks, basic rocks, and granitic rocks (Figure 3G).
NDVI
The NDVI reflects the growth status and coverage of vegetation (Tucker, 1979). It is a widely used vegetation index for land cover characterization (Tucker, 1979; Huete et al., 1997; Walsh et al., 2001; Wu, 2014; Wu et al., 2016). The soil and water conservation effect of vegetation reduces surface runoff and soil erosion. At the same time, the biological weathering of vegetation also causes certain damage to rocks and soils (e.g., rock breakup process by plant rooting). Though it is not absolute, slopes with more abundant vegetation are more resistant to landslide than bare soils. Therefore, the occurrence of landslides is often related to vegetation coverage. The NDVI value was calculated from the November MODIS data from 2005 to 2010, and that below 0 (mostly water-bodies) was replaced by zero, and finally, its value ranges from 0 to 0.92 (Figure 3H).
Land Cover
Different types of land cover have different vegetation properties and different effects on surface water and soil conservation, which are associated with the slope surface stability, enforcing to a certain extent impacts on the occurrence of landslides. The main land cover types are croplands, grasslands, forests, woodlands, wetlands, artificial lands, barelands, and water bodies (Figure 3I).
Methods
IV Analysis
IV was used in the fields of geology and mineral prospecting in early times, converting the measured values reflecting various influencing factors into the IV. Later, some scholars transformed it into a bivariate statistical analysis, which can combine the subjective estimation of experts with objective data. The IV analysis is to analyze the possibility of landslides under similar conditions by counting the information of past landslides. Hence, Gao et al. (2006), Sharma et al. (2015), and Ren et al. (2018) considered that this IV represents regional stability.
Landslide information is calculated by the IV in each subset of the selected indicator. The IV of each factor is overlaid on each other to calculate the possibility of landslides in the study area. The greater the IV, the higher the possibility of a landslide or vice versa (Dai, 2013). The possibility of landslides can be evaluated by the amount of information or IV in the prediction process. The formula of the information model is shown as follows:
where I is the IV, P is the probability of landslide hazard occurrence for each evaluated indicator, and P(y) denotes the probability of landslide occurrence in the normalized treatment area; x1, x2, x3,… xn are the influencing factors of geohazards. Actually, the final form of Equation 1 can be further simplified and presented as follows:
where N is the total number of landslides (points or sites) in the study area; Ni is the number of landslides in each subset of the given factor; S is the total pixel number of assessment units in the study area; Si is the total pixel number of each subset of the given factor; and I(y, x1x2x3 … xi) is the IV of each factor contributing to the landslide hazard. IV can be both positive (favorable) and negative (unfavorable). Taking the geo-environmental factor slope as an example, we consider that a slope of <3° is stable and is selected for non-risk sampling, subsetting started with 3° upward by an interval of 5° up to >38°, and IV was calculated using Equation 2 and is shown in Table 2.
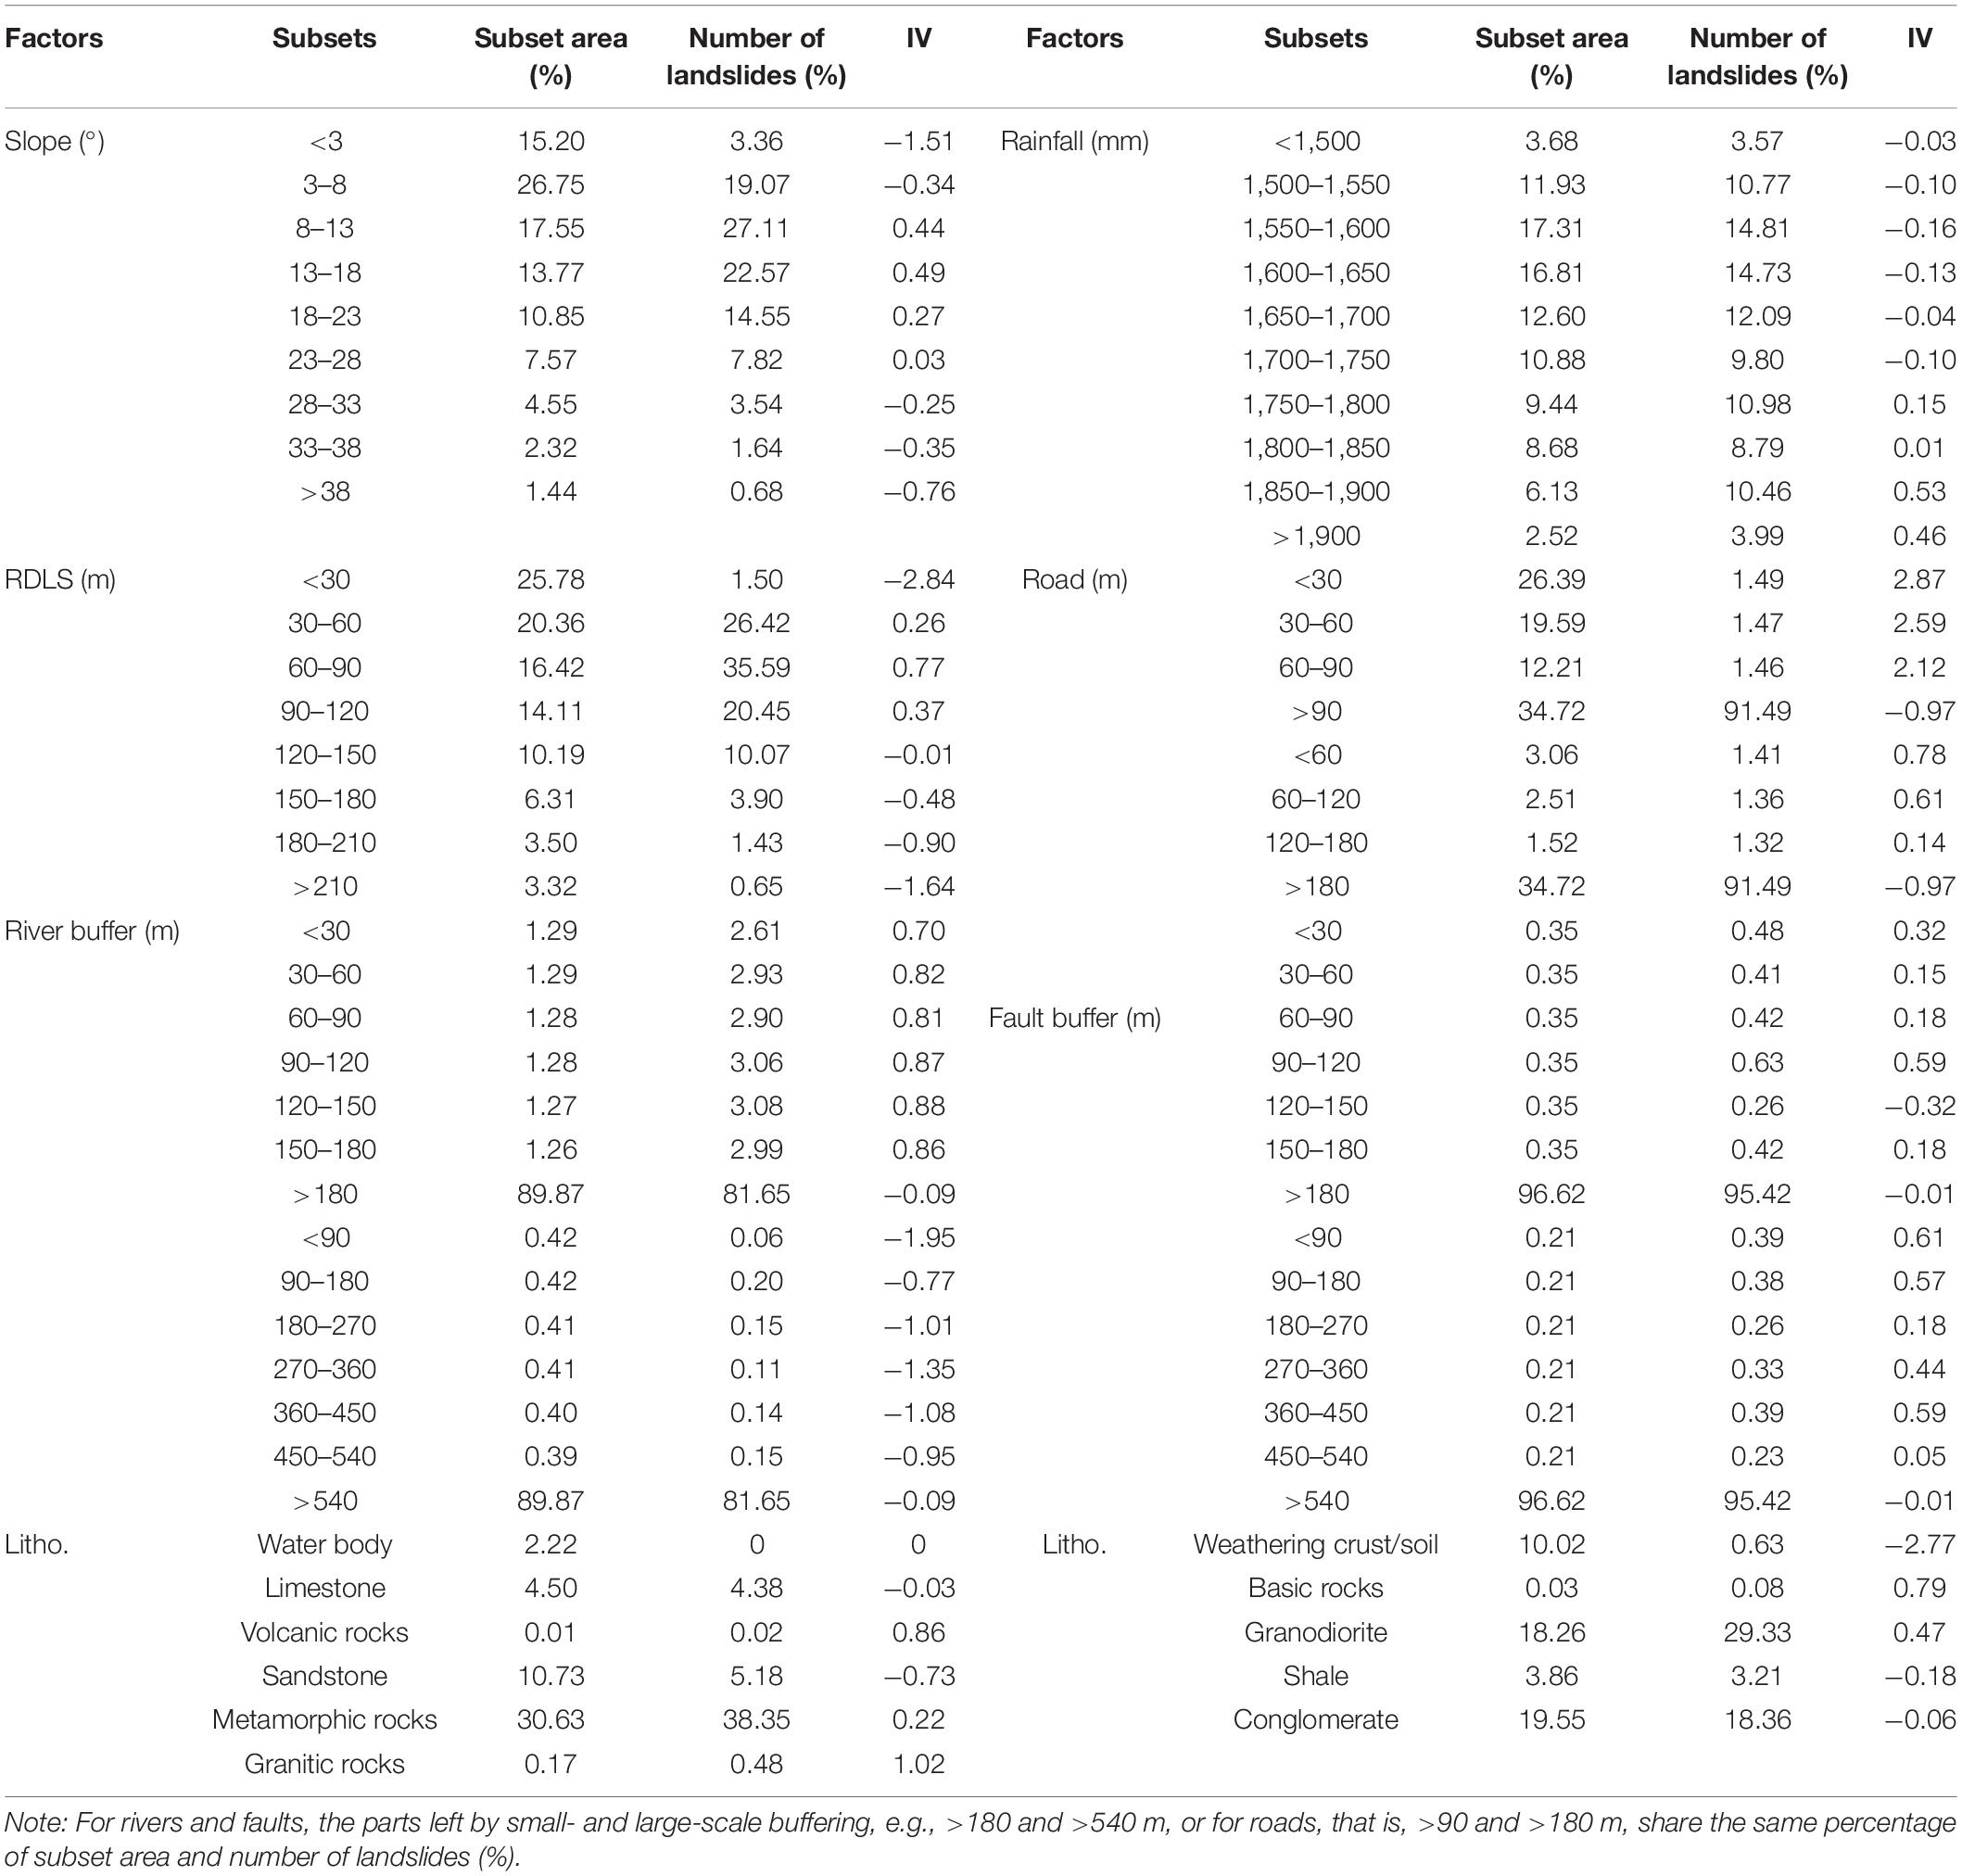
Table 2. Information values (IVs) of different subsets of the geo-environmental factors contributing to landslides.
LRM
LRM is a non-linear statistical model in which the variables can be either continuous or discrete. In the assessment of geological hazards, the data combined with continuous and discrete variables are to be comprehensively processed (Nandi and Shakoor, 2010; Zhao et al., 2019). LRM has been widely used in land cover change estimation (Mertens and Lambin, 2000; Serneels and Lambin, 2001; Wu, 2003) and disaster prediction (Nandi and Shakoor, 2010; Zhao et al., 2019) and is able to reveal the relationship between the dependent variable, i.e., change or disaster occurrence (with 1 indicating that an event occurred and 0 indicating that no event occurred), and multiple independent variables, i.e., spatial determinants or hazard factors.
When the probability of an event is P with a value range of (0, 1), the probability of the event not occurring is 1−P. If P is close to 0 or 1, it is difficult to capture its value, and thus, it is necessary to transform it into a logarithm function, i.e., ln(P) = ln(P/1 − P), which is called a logit transformation, in which
where
where P is the probability of an event occurrence, e the natural logarithm, α the intercept (a constant), and βi (i = 1, 2, 3, …, n) the regression coefficient corresponding to the independent variable xi (i = 1, 2, 3, …, n). In our case, since the IV was calculated based on the subsets of each geo-environmental factor, hence, for the ith factor (i = 1, 2, 3, …, k) and jth subset (j = 1, 2, …, n), Equation 5 can be further specified as follows:
where P is the probability of landslide occurrence and βij the regression coefficient of the variable xij (i = 1, 2, …, n, factor number; j = 1, 2, …, k, the subset number of factor i), i.e., the IV of subset ij.
It is seen that the LRM is actually coupled with the IV analysis. This modeling is able to solve the problem of determining the weight of assessment factors and integrating different types of factor data. This may also reduce the influence of subjectiveness of a single model. The specific operation of model coupling is to get the IV of each subset of the geo-environmental factor through the IV analysis and then to input them into the LRM as independent variables to establish the regression equation in which the regression coefficient of each assessment factor is to be calculated (Zhang Q. et al., 2020).
Modeling and Prediction of Landslide Hazard
For assessing the landslide hazards in Jiangxi, 14 geo-environmental factors were selected. The 9,525 landslide disaster points collected were randomly divided into a training set (TS) and a validation set (VS) at a ratio of 7:3. Also non-landslide points were chosen from the relatively flat areas (such as cultivated land and urban areas) with a slope of <3° in terms of Miao et al. (2016) and Zhang Y. et al. (2020), and they were integrated into the TS and VS. The raster calculator within the spatial analysis tool of GIS was used to realize the superposition and calculation of IV for each geo-environmental factor.
Calculation of the IVs
The landslides in the study area are mostly small and expressed in the form of points. The attribute values of the geo-environmental factors corresponding to each landslide point were extracted. In combination with division of the subsets, the IV of different subsets of each factor was calculated using Equation 2 as mentioned above, and the results are presented in Table 2, taking a part of factors as an example.
Correlation Test of the Assessment Factors
To avoid the collinearity of the geo-environmental factors, a correlation analysis was performed. As shown in Table 3, the correlation among all the factors is less than 0.3, indicating that these factors and their division subsets are reasonable.
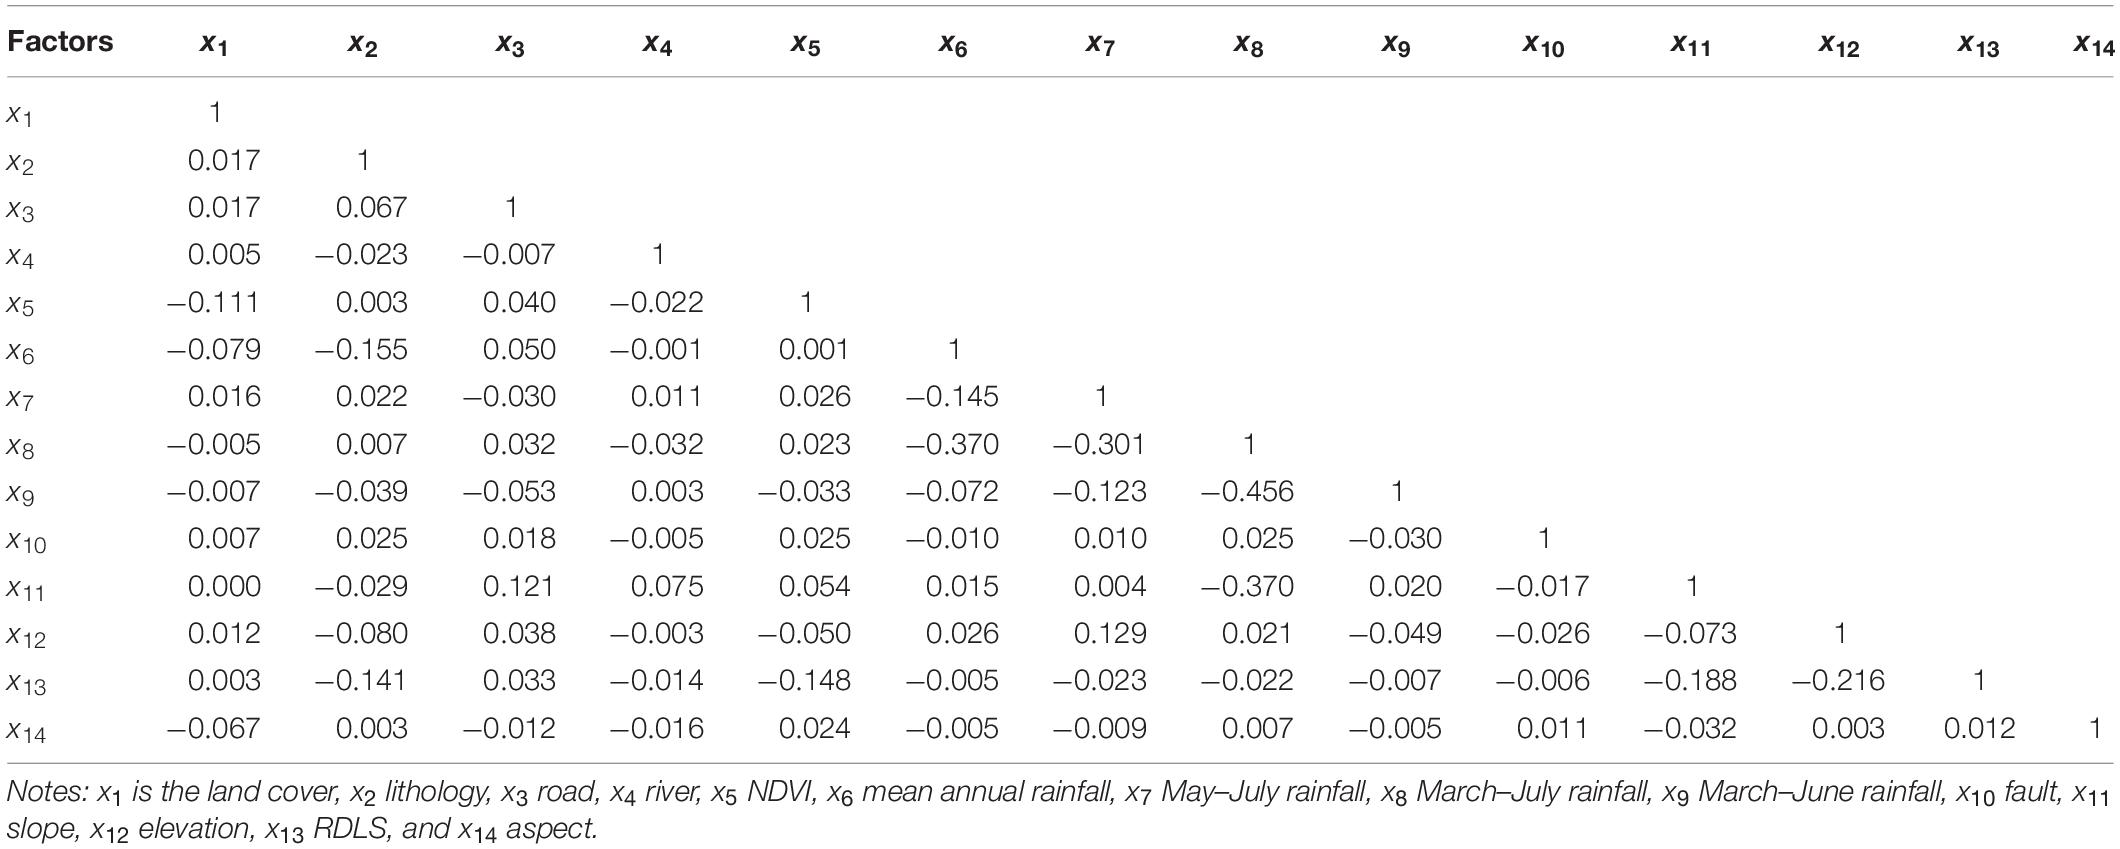
Table 3. Correlation matrix of 14 geo-environmental factors.
LRM
All IVs of subsets of each geo-environmental factor were outputted in DBF format and then converted into an Excel file. Taking the attributes of landslides and non-landslide points in the TS as dependent variables and all predictive factors as independent variables, the binary LRM was realized within SPSS 25, a software package for statistical analysis.
Modeling was conducted in two cases: one with only the major linear features, e.g., big rivers, roads, and faults, and the other with both major and minor scales of linear features including also subtributaries of big rivers and streams, small roads (county level and commune level), and faults. The modeling results are presented in Tables 4, 5.
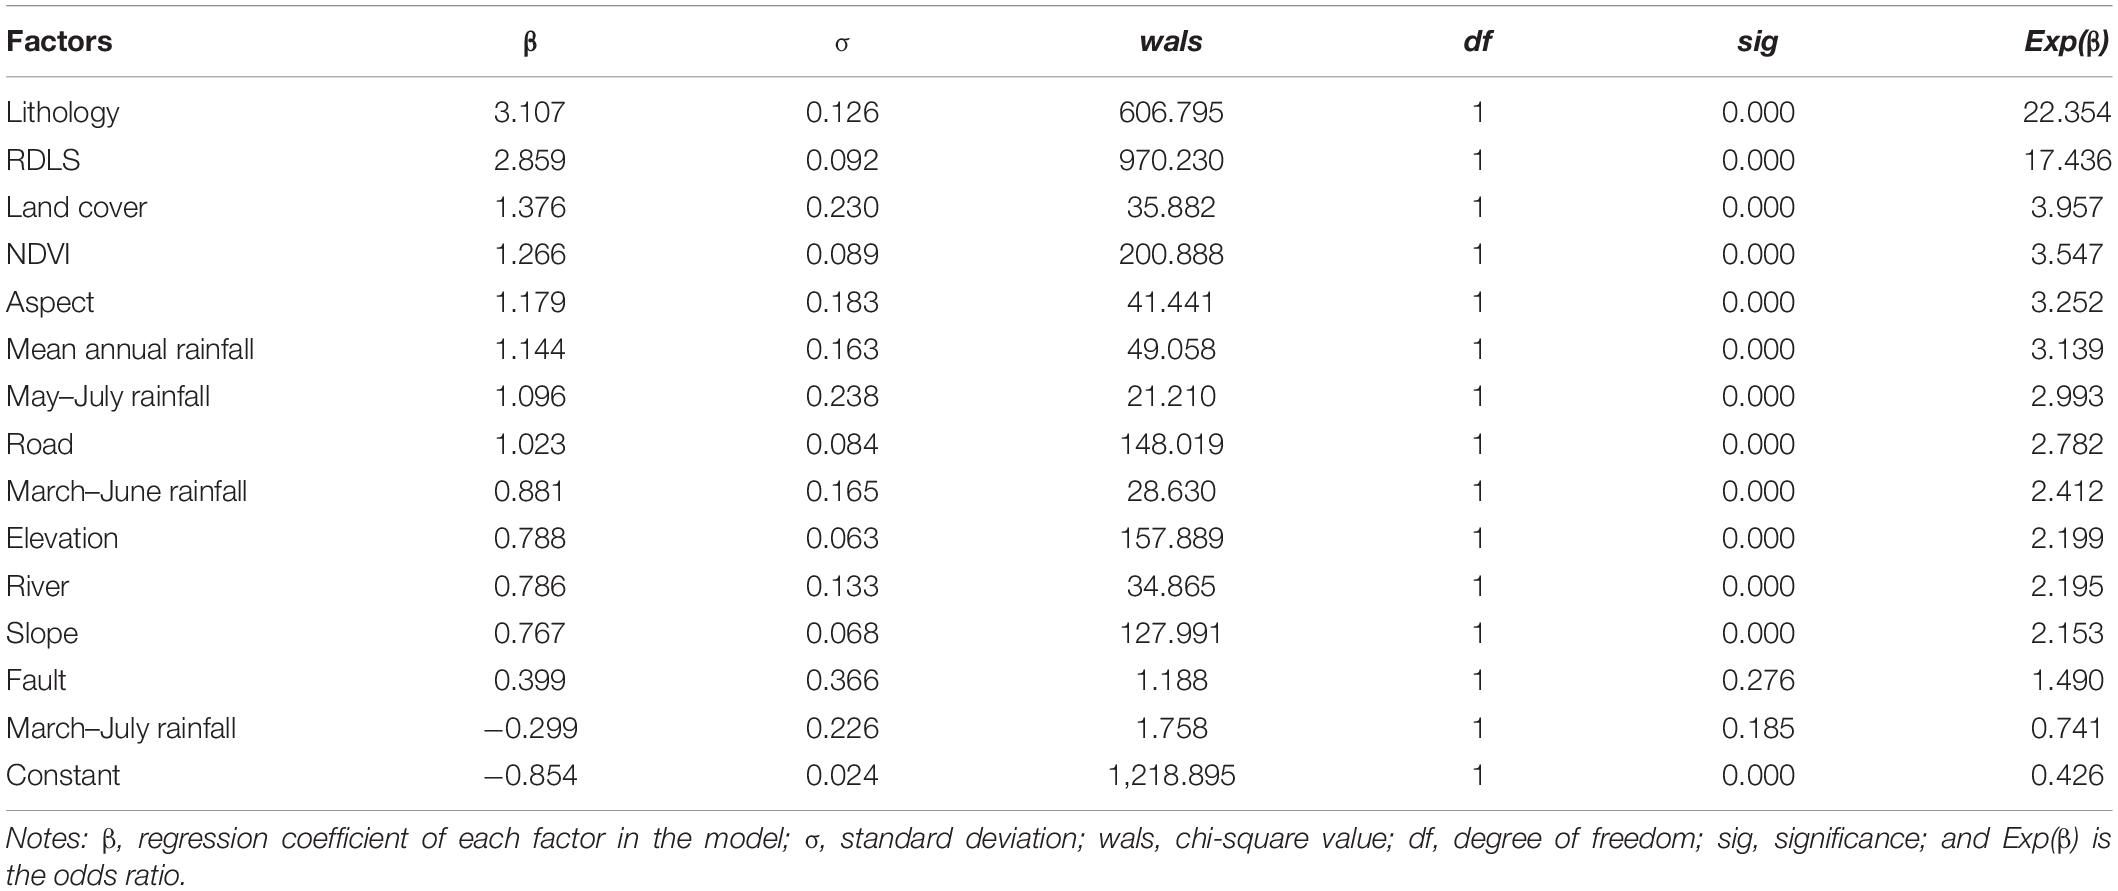
Table 4. Results of logistic regression modeling only with main linear features (Model 1).
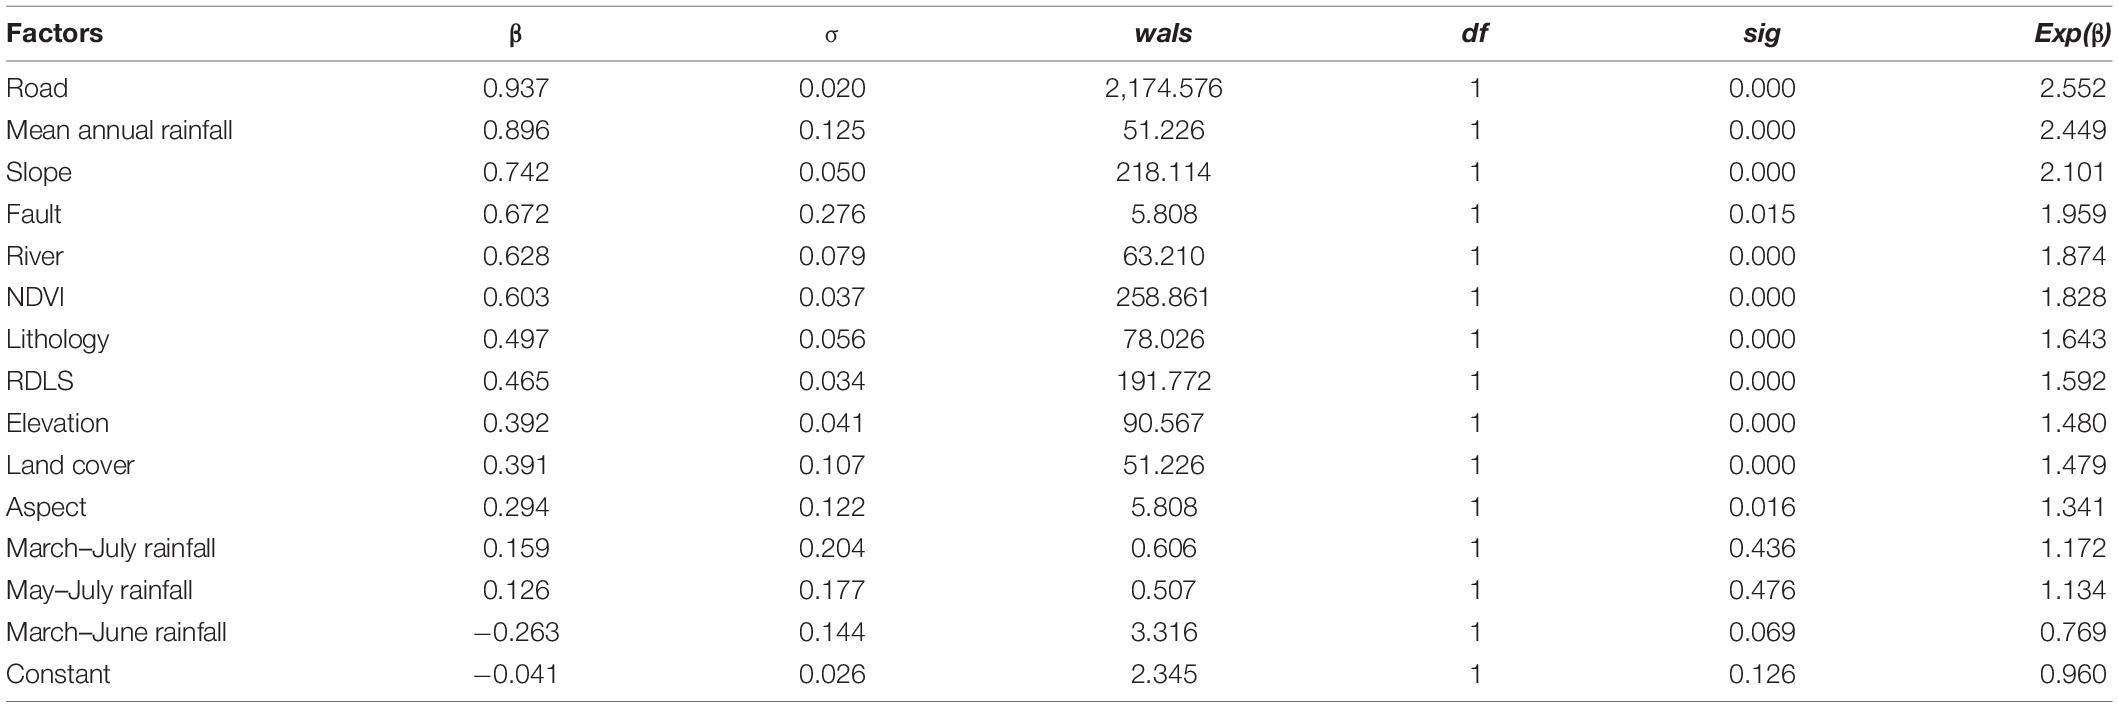
Table 5. Results of logistic regression modeling with complete linear features (Model 2).
Calculation of Landslide Risk
The calculated regression coefficients (β) were inputted into Equation 5 to get the LRM:
where x1 is the IVs of land cover, x2 of lithology, x3 of road, x4 of river, x5 of NDVI, x6 of the mean annual rainfall, x7 of May–July rainfall, x8 of March–July rainfall, x9 of March–June rainfall, x10 of fault, x11 of slope, x12 of elevation, x13 of RDLS, and x14 of aspect. P is the probability of landslide occurrence, with a value of 0–1. With the use of the raster calculator tool within GIS and Equation 5, the probability of landslide hazard in the study area was obtained.
Landslide Hazard Mapping and Reliability Analysis
The obtained probability of the whole study area was divided into five hazard levels, i.e., stable (0–0.2), low (0.2–0.4), moderate (0.4–0.6), high (0.6–0.8), and very high (0.8–1).
Different approaches were used to analyze and compare the results of landslide hazard modeling. One was to check the rationality of the number distribution of the actual disaster points of each risk grades; the second was to assess the accuracy of hazard zoning through the receiver operating characteristic (ROC) curve, in which the latter is an effective method to assess the performance of classification algorithms. The area under the ROC curve (AUC) is the area between the ROC curve and the horizontal axis. The larger the AUC value, the better the prediction accuracy (Wang, 2013).
Results
Based on the above analysis and modeling, the results obtained are presented in this section.
Landslide Hazard Models and Maps
Tables 4, 5 show the results of LRM for landslide hazard and the related coefficients of each geo-environmental factor. The β value represents the weight of each factor in a landslide event. The significance of each factor is judged by comparing the value of wals or sig. The larger the value of wals or the smaller the value of sig, the higher the significance (Liang and Cui, 2010). Clearly, in comparison with Table 5, the LRM of Table 4 is something not logical as the roles of lithologies and RDLS are exaggerated and those of roads, rivers, and slopes are underestimated. There is more detail in the discussion.
The probability-based hazard zoning map based on the results from Table 5 is shown in Figure 4, and from the statistics, it is known that stable, low, moderate, high, and very high hazardous areas take up respectively 76,282.21 km2 (46.36%), 44,713.33 km2 (27.17%), 30,802.22 km2 (18.72%), 6,659.40 km2 (4.05%), and 6,091.74 km2 (3.70%).
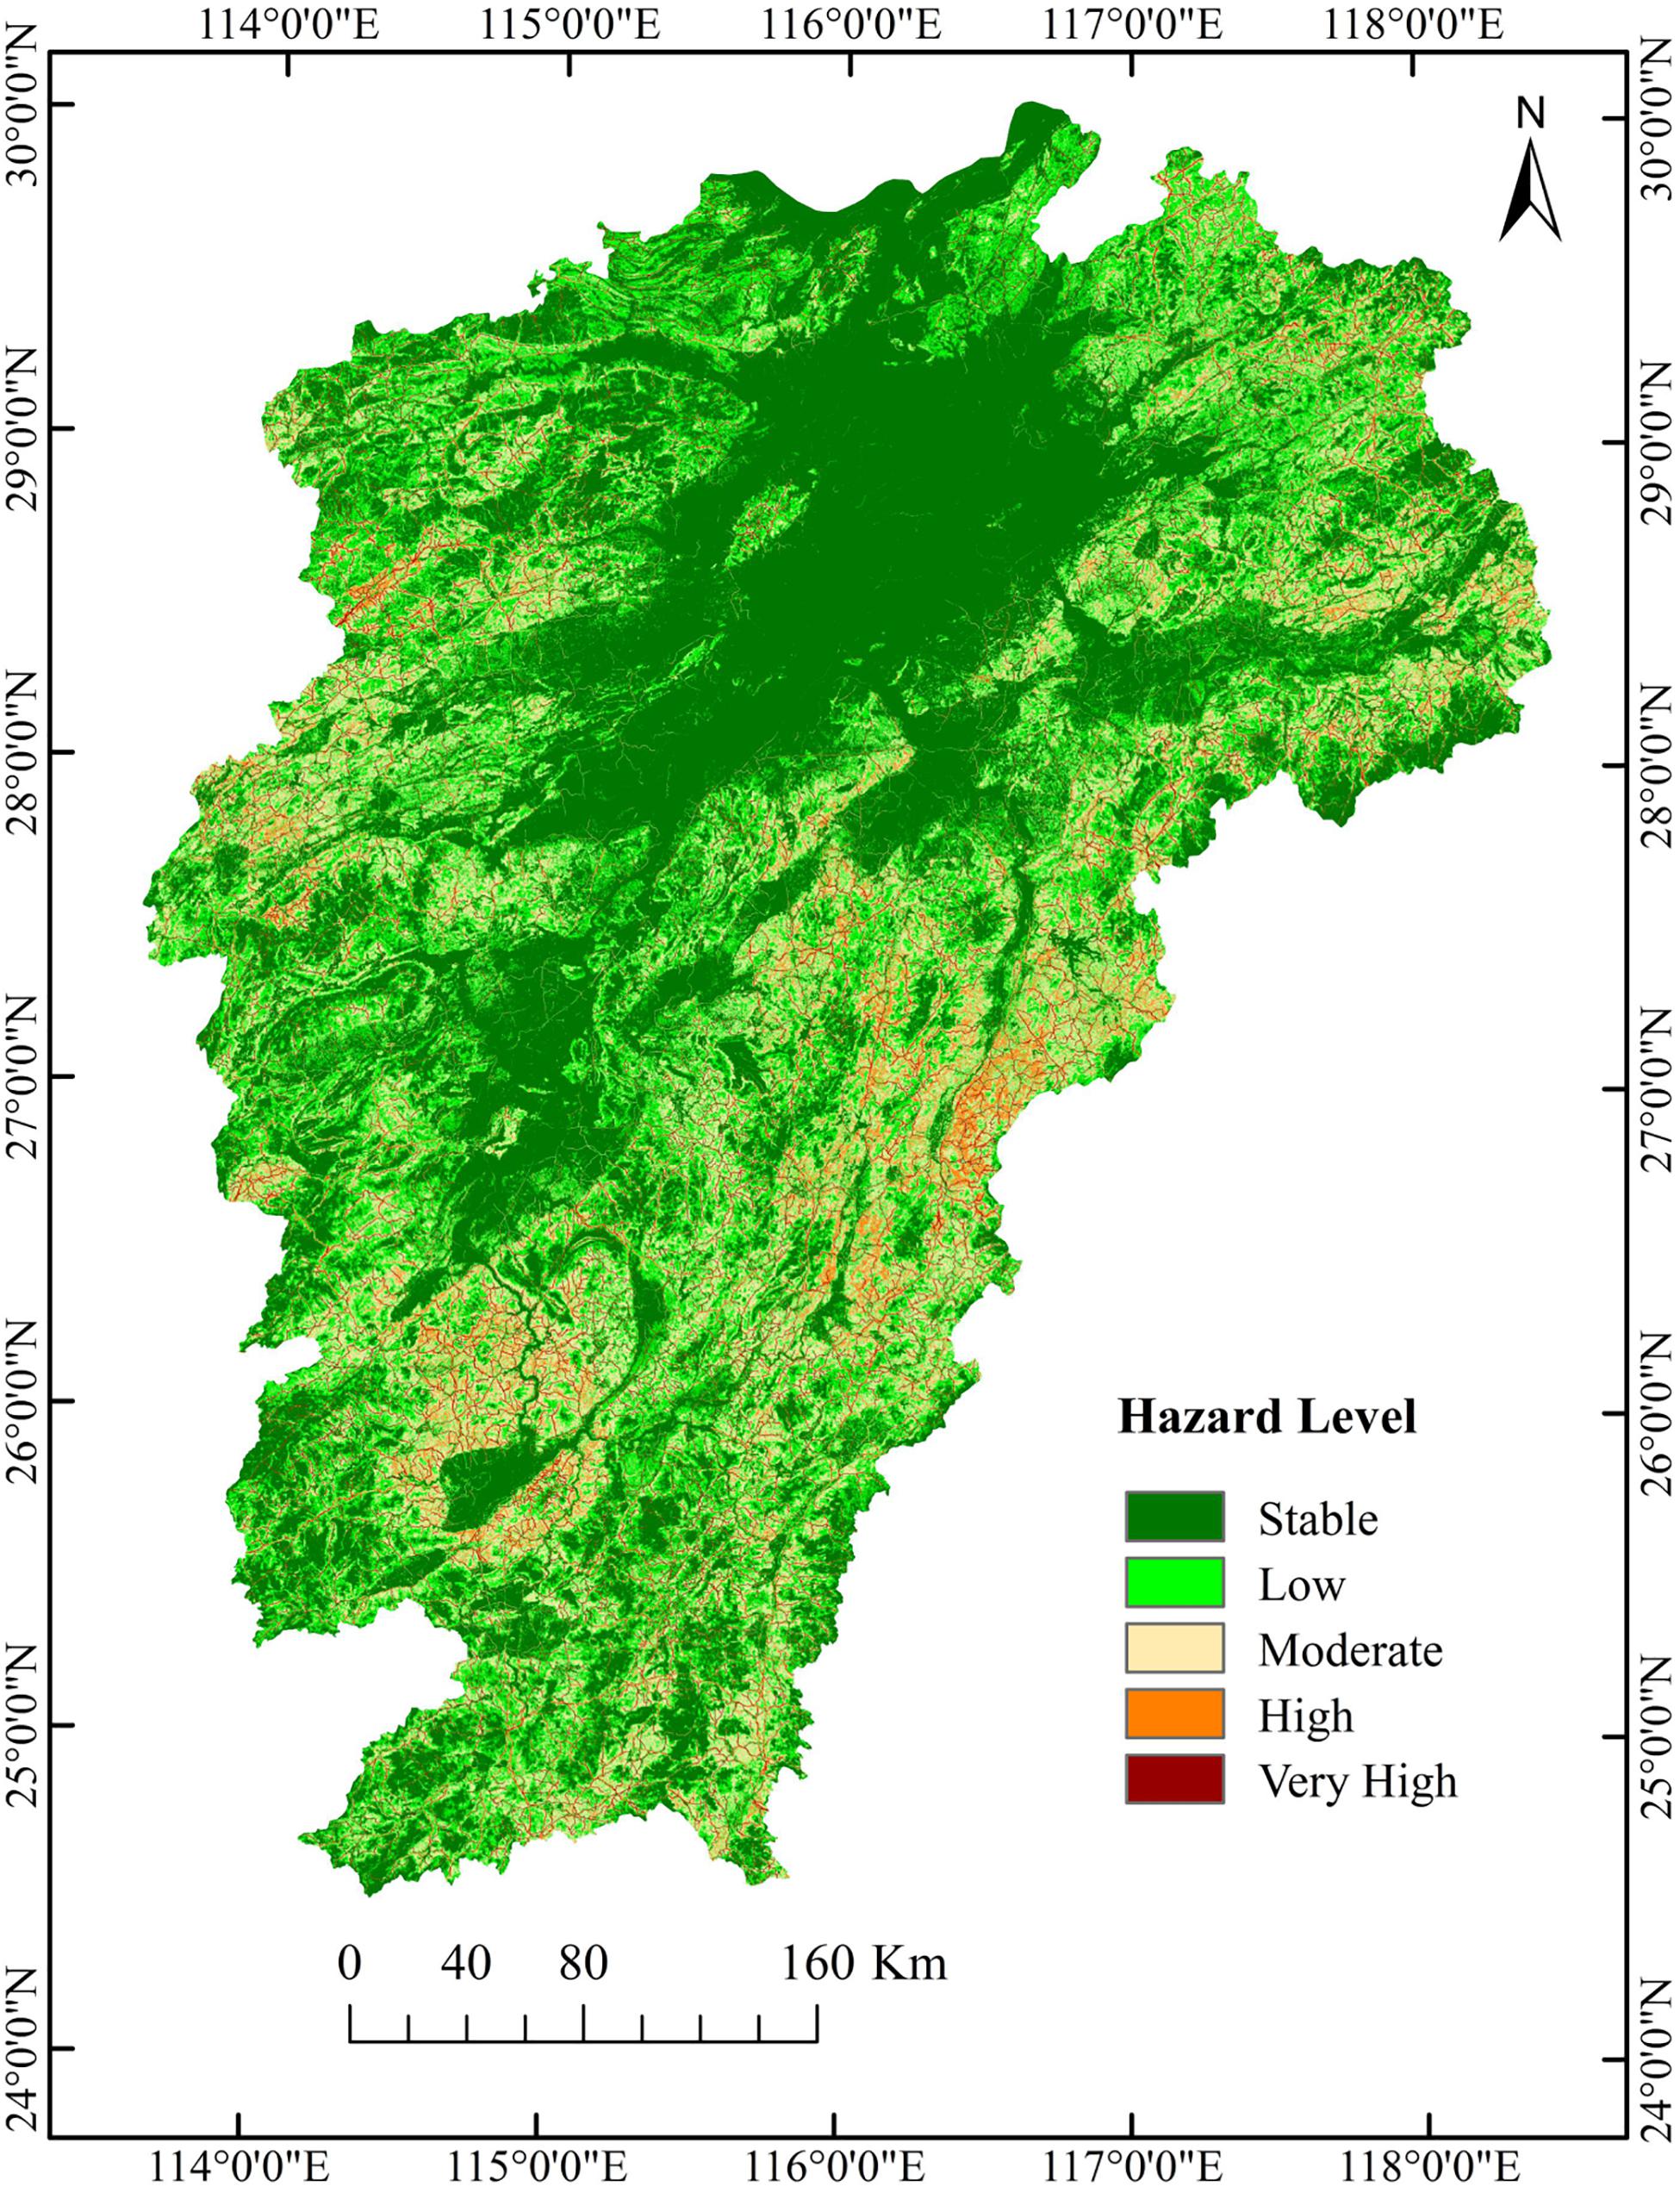
Figure 4. Landslide hazard map of Jiangxi derived from a logistic regression model with complete linear features (Table 5).
From this risk map, we get to know that areas prone to landslide are those with a slope of 12–23°, within the scope of 150 m from the rivers and 100 m from the road and with an RDLS of 60–140 m, where annual rainfall is greater than 1,700 mm. In addition, landslides occur more frequently in low-altitude areas of mountainous and hilly slopes, where human activities are relatively intense.
Reliability of the Risk Map
(1) Assessment of the risk maps from the LRM of Tables 4, 5 vs. the VS (field points not used for training) demonstrates a significant difference in prediction of the very high and high risk zones (Tables 6, 7). These two zones from the LRM of Table 4 (33.15%) are much larger than those from the LRM of Table 5 (7.75%).
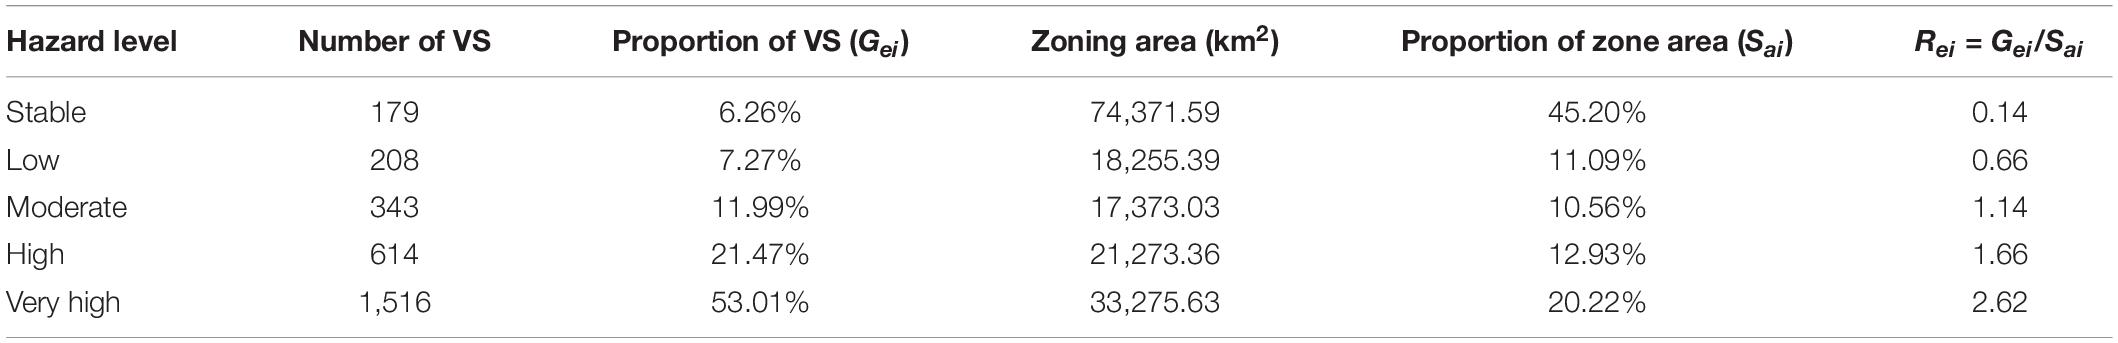
Table 6. Distribution of the VS landslides in different hazard zones derived from Model 1 (Table 4).
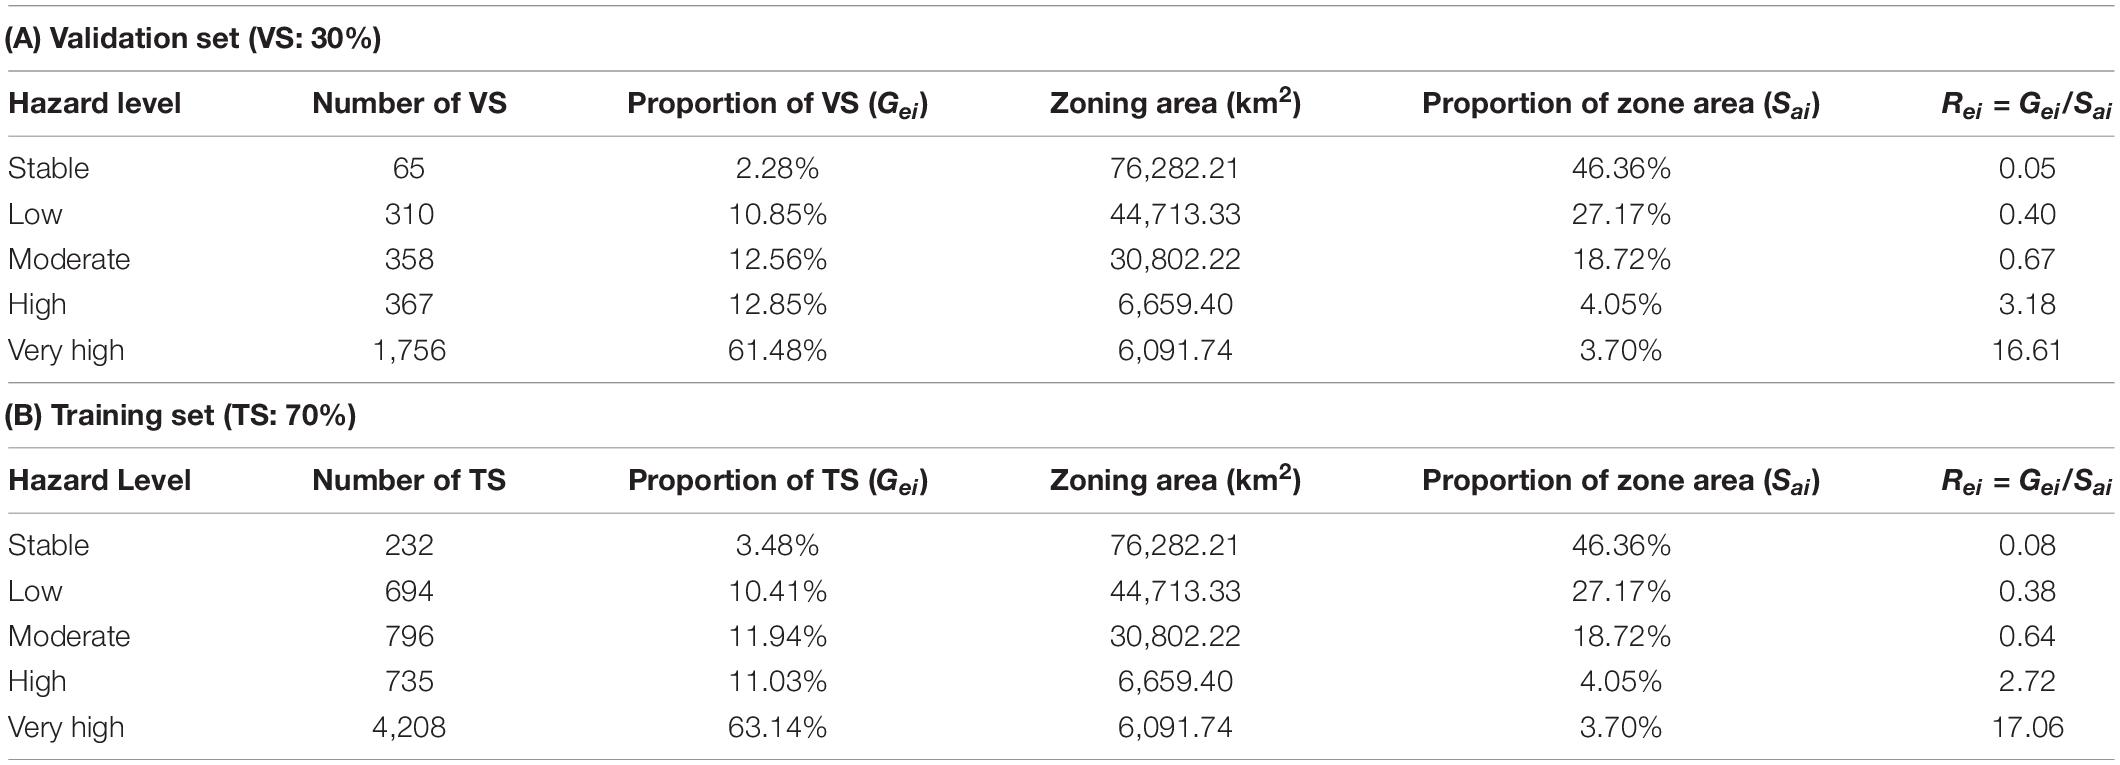
Table 7. Distribution of the landslides in different hazard zones derived from Model 2 (Table 5).
The observed VS landslide points were projected into the different risk zones, and we found that a large proportion falls in the very high and high hazardous zones and that the stable zone has a little percentage. The corresponding ratio (Rei) between the percentage of landslide points of the VS falling in each grade (Gei) and the percentage of the area of each grade to the entire study area (Sai) should have a clear increase (Tian et al., 2016) if the prediction is reliable. From the calculation results (Tables 6, 7A), Rei(I) < Rei(II) < Rei(III) < Rei(IV) < Rei(V) meets these requirements, but Table 7 from the LRM with complete linear features seems much better as very high and high risk zones are much narrower or, rather, more accurate than those from Table 6.
(2) The ROC curve is an efficient approach to assess the performance of classification algorithms. According to a series of different dichotomous methods, the curve is drawn with sensitivity as ordinate and 1 - specificity as abscissa, reflecting the restrictive relationship between sensitivity and 1 - specificity (Tian et al., 2016). The AUC is a standard used to measure the quality of the classification model. The AUC value is the area between the ROC curve and the horizontal axis. The larger the AUC value, the better the prediction accuracy (Wang, 2013). Based on the GIS interface, the landslide hazard map was sampled corresponding to the points in the VS, and the ROC curve and AUC value of the model are shown in Figure 5.
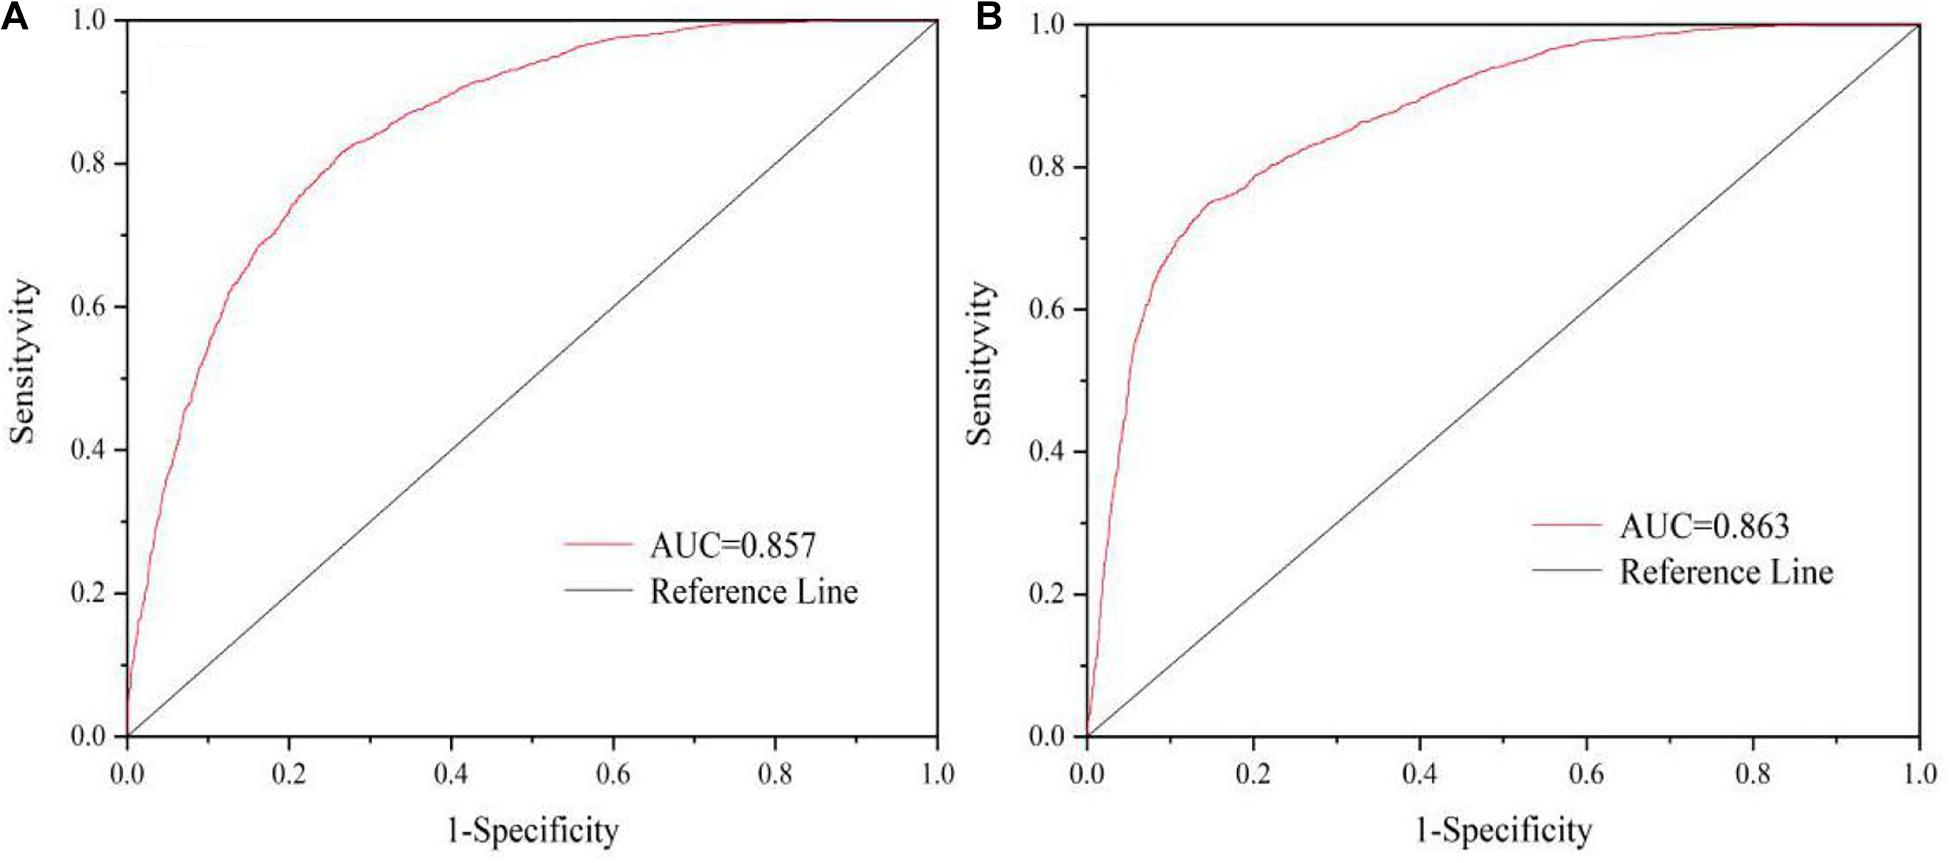
Figure 5. Receiver operating characteristic (ROC) curve of the information value (IV)-based logistic regression (LR) modeling results: (A) with main linear features and (B) with complete linear features.
The AUC from LRM of Table 5 is 0.863. The accuracy of the model is more than 86%, indicating that the IV-based LR modeling for landslide risk prediction and zoning allows us to achieve satisfactory results of high reliability, in particular with complete linear features.
Discussion
Rationality of the IV-Based LRM Approach
The above research shows that the results of risk zoning are basically consistent with the distribution of the regional historical landslides. With a rather complete inventory of the landslide data, our approaches composed of IV analysis and LRM with complete linear features allowed us to achieve landslide risk prediction with high reliability with an accuracy of >86% against the VS. Actually, Du et al. (2017); Fan et al. (2018), Tian et al. (2020), and Zhang Q. et al. (2020) have conducted landslide susceptibility assessment at the local scale using similar approaches but with an accuracy of about 79–84%. We hence believe that the proposed methodology has improved the reasonableness for regional-scale studies, and it shall be extendable to other similar provincial and regional landslide risk assessments.
Actually, Tian et al. (2016) and Zhang (2019) have, respectively, employed CF-based LRM for landslide risk analysis in Guangdong and Shaanxi. Their results show that 57.99 and 60% of the field-observed landslides fall in the very high risk areas (22.15% of the total area, with an AUC of 0.782, and 10.03% of the total area with an AUC of 0.890, respectively). However, our analysis revealed that 74.33% of the landslides of the VS are located in the high and extremely high risk zones (7.75% of the total study area). This indicates that our analysis provides a more accurate prediction in locality of the potential hazards as we have used more geo-environmental factors and a better sampling scheme, e.g., division of the subsets, and used a higher-resolution DEM with more detailed factors.
Though rational weight assignment in terms of the propensity to landslide as applied by Chu (2012), Wang and Wang (2017), Zhang Y. et al. (2020), and see text footnote 1, appears plausible, a significant advantage of our approach lies in the fact that the combination of expert knowledge-driven and data-driven approaches avoids the subjective weight assignment to the geological strata and linear features after buffering. At the same time, the prior knowledge of experts obtained in the field is also considered important to achieve modeling and prediction with higher reasonableness.
Importance of the Predictive Variables
The six most important independent variables revealed by LRM with complete linear features are roads, annual rainfall, slope, faults, river, and NDVI. These variables are more or less similar to those obtained by Zhang Y. et al. (2020) and see text footnote 1. For both local and provincial landslide hazard predictions, roads, rainfall, and slope are always the most important factors.
Findings and Existing Difficulties
As previously expected, one finding is that given the same condition of other planar factors, the completeness of the linear features will be beneficial for a reliable prediction of landslide hazard. It is essential to use complete linear features, or rather, to use linear features that are as detailed as possible even for regional- and provincial-scale assessments. Coarse-resolution and major feature-based modeling and prediction may lead to a strong bias and even failure. This would be helpful for implementing the disaster reduction and prevention measures of governments.
Another surprising finding is that the slope of the most probable landslide occurrence in Jiangxi is low, about 3–23°, in which 83.3% of the total landslides have taken place (Table 2), much lower than the threshold of 28–35°, proposed for natural landslides by Fan et al. (2016). Zhang Y. et al. (2020) and (see text footnote 1) have also discovered a similar result. This may be due to (1) the uniformization of the realistic relief by the moderate resolution of DEM, 30 m, and the DEM-derived slope that is lower than the real one and (2) human activity, especially the development of the road network and urbanization through slope cutting, which has led to slope failure and reduced landslide slope threshold.
It is worth noting that while conducting IV analysis, we noted that area with a slope of < 3° is also distributed with 3.36% of the total landslides (Table 2). This may result from the slope homogenization as mentioned above. Thence, for regional- and even national-scale landslide hazard assessments, coarser-resolution DEM (such as SRTM, 90 m) data are not recommended as they may hide most of the small-scale landslides (e.g., several tens to several hundreds of square meters in surface area).
Another problematic issue arising in our study is the utilization of the MODIS NDVI, with 250 m of resolution. This factor is not as important as DEM but clearly not ideal for representation of the greenness and coverage, in particular of forests and woodlands because of their heterogeneity. Nevertheless, for an often cloudy province, it is extremely difficult to obtain cloud-free November Landsat images of a 5-year period for such a large area. Hence, to use the MODIS NDVI was the only choice.
Comparative Verification
Zhang Y. et al. (2020) and see text footnote 1 have taken advantage of the RF algorithm to assess the landslides in Guixi and Ruijin in Jiangxi, respectively. We compared our provincial/regional-scale IV-based LR modeling results with the local risk maps of Guixi and Ruijin and found a good agreement between the percentages of the observed landslides falling in the predicted high and very high risk zones. In Guixi, 81.69% of the total landslide points and 79.27% of the VS are distributed in the very high and high risk area (Zhang Y. et al., 2020), whereas see text footnote 1 illustrated that 92.67% of the total landslide points and 86.59% of the VS fall in these two zones in Ruijin. This means our risk modeling and prediction results for the Jiangxi Province are reliable and of practical value to provide technical support for disaster reduction and prevention in this province.
Conclusion
In this paper, IV-based LRM for regional-scale landslide hazard mapping was applied to a complex disaster development and occurrence environment, namely the Jiangxi Province. The reliable results may provide technical support for landslide hazard reduction and prevention action at local- and provincial-scales.
One may think that it is enough to use large scale and the main linear features for regional-scale landslide risk modeling. However, this study reveals that it is essential to employ factors of all scales or as detailed as possible to achieve a reliable and accurate prediction.
From both local and regional/provincial-scale studies, it is uncovered that slope instability is mainly caused by road construction and housing development through slope cutting and triggered by rainfall. Hence, it is particularly important for engineers to select sites of stable geological and environmental conditions for road system development and urban planning to minimize the landslide risk. This is the precondition for a holistic and optimal design of infrastructures and urban planning, which is necessary for regional- or provincial-scale socioeconomic development.
Data Availability Statement
The raw data supporting the conclusions of this article will be made available upon reasonable request to the corresponding author (WW: wuwch@ecut.edu.cn), without undue reservation.
Author Contributions
PO, WW, and YQ: methodology. WW: software, validation, data curation, visualization, funding acquisition, supervision, and project dministration. PO, YQ, XZ, WH, and YZ: formal analysis. PO, XTZ, WH, YZ, JL, XF, JJ, MZ, and SP: investigation. PO, WW, YQ, CS, XZ, WH, YZ, LX, JL, XF, JJ, MZ, and XH: resources. PO, XTZ, WH, YZ, XL, YB, XFZ, and WL: writing—original draft preparation. PO and WW: writing—review and editing. All authors have read and agreed to the published version of the manuscript.
Funding
This research was supported by the Start-up Fund for Scientific Research of the East China University of Technology (Grant No. DHTP2018001) and Jiangxi Talent Program (Grant No. 900/2120800004) granted to WW.
Conflict of Interest
The authors declare that the research was conducted in the absence of any commercial or financial relationships that could be construed as a potential conflict of interest.
Acknowledgments
A part of the landslide inventory data was obtained from the Environmental Science Data Center, CAS, and the Geological Map of Jiangxi on the Scale of 1/500,000 was provided by the Coal Geological Bureau of Jiangxi Province. DEM (ASTGTMV003, 30 m) and MODIS NDVI data were obtained from NASA (www.earthdata.nasa.gov).
Footnotes
- ^ Zhou, X., Wu, W., Lin, Z., Zhang, G., Chen, R., Song, Y., et al. (under review). Zonation of landslide susceptibility in Ruijin, Jiangxi, China. Int. J. Environ. Res. Public Health (2nd round review).
References
Aleotti, P., and Chowdhury, R. (1999). Landslide hazard assessment: summary review and new perspectives. Bull. Eng. Geol. Environ. 58, 21–44. doi: 10.1007/s100640050066
Arabameri, A., Pourghasemi, H. R., and Yamani, M. (2017). Applying different scenarios for landslide spatial modeling using computational intelligence methods. Environ. Earth Sci. 76:832. doi: 10.1007/s12665-017-7177-5
Assilzadeh, H., Levy, J. K., and Wang, X. (2010). Landslide catastrophes and disaster risk reduction: a GIS framework for landslide prevention and management. Rem. Sens. 2, 2259–2273. doi: 10.3390/rs2092259
Ayalew, L., and Yamagishi, H. (2005). The application of GIS-based logistic regression for landslide susceptibility mapping in the Kakuda-Yahiko Mountains, Central Japan. Geomorphology 65, 15–31. doi: 10.1016/j.geomorph.2004.06.010
Bai, S., Wang, J., Lue, G., Zhou, P., Hou, S., and Xu, S. (2010). GIS-based logistic regression for landslide susceptibility mapping of the Zhongxian segment in the Three Gorges area, China. Geomorphology 115, 23–31. doi: 10.1016/j.geomorph.2009.09.025
Carrara, A. (1983). Multivariate models for landslide hazard evaluation. J. Int. Assoc. Math. Geol. 15, 403–426. doi: 10.1007/BF01031290
Chen, V., Kervyn, M., Suh, C. E., Fontijn, K., Ernst, G. G. J., Marmol, M. A. D., et al. (2012). Ladslide susceptibility assessment in Limbe (SW Cameroon): a field calibrated seed cell and information value method. Catena 92, 83–98. doi: 10.1016/j.catena.2011.11.014
Chu, S. M. (2012). The Weathering Factor Study on the Formation of Gully—type Debris flow—take Wenchuan earthquake as an Example(In Chinese with English abstract). Master dissertation. Chengdu: Chengdu University of Technology.
Corominas, J., Westen, C. V., Frattini, P., Cascini, L., Malet, J. P., and Smith, J. T. (2014). Recommendations for the quantitative analysis of landslide risk. Bull. Eng. Geol. Environ. 73, 209–263. doi: 10.1007/s10064-013-0538-8
Dai, Y. (2013). Study on the Method of Regional early Warning of Landslide in Three Gorges area Based on Information Model(In Chinese with English abstract). Master dissertation. Beijing: Tsinghua University.
Dang, V. H., Dieu, T. B., Tran, X. L., and Hoang, N. D. (2018). Enhancing the accuracy of rainfall-induced landslide prediction along mountain roads with a gis-based random forest classifier. Bull. Eng. Geol. Environ. 78, 2835–2849. doi: 10.1007/s10064-018-1273-y
Djukem, W., Braun, A., Wouatong, A., Guedjeo, C., Dohmen, K., Wotchoko, P., et al. (2020). Effect of soil Geomechanical properties and Geo-environmental factors on landslide predisposition at mount Oku, Cameroon. Int. J. Environ. Res. Public Health 17:6795. doi: 10.3390/ijerph17186795
Du, G., Zhang, Y., Iqbai, J., Yang, Z., and Yao, X. (2017). Landslide susceptibility mapping using an integrated model of information value method and logistic regression in the Bailongjiang watershed, Gansu Province, China. J. Mountain Sci. 14, 249–268. doi: 10.1007/s11629-016-4126-9
Fan, L., Lehmann, P., and Or, D. (2016). Effects of soil spatial variability at the hillslope and catchment scales on characteristics of rainfall-induced landslides. Water Resour. Res. 52, 1781–1799. doi: 10.1002/2015WR017758
Fan, Z., Gou, X., Qin, M., Fan, Q., Yu, J., and Zhao, J. (2018). Information and logistic regression models based coupling analysis for susceptibility of geological hazards(In Chinese with English abstract). J. Eng. Geol. 26, 340–347. doi: 10.13544/j.cnki.jeg.2017-052
Feng, H., Zhou, A., Yu, J., Tang, X., Zheng, J., Chen, X., et al. (2016). A comparative study on plum-rain-triggered landslide susceptibility assessment models in west Zhejiang province(In Chinese with English abstract). Earth Sci. 41, 403–415. doi: 10.3799/dqkx.2016.032
Froude, M., and Petley, D. (2018). Global fatal landslide occurrence from 2004 to 2016. Nat. Hazards Earth Syst. Sci. 18, 2161–2181. doi: 10.5194/nhess-18-2161-2018
Furlani, S., and Ninfo, A. (2015). Is the present the key to the future? Earth Sci. Rev. 142, 38–46. doi: 10.1016/j.earscirev.2014.12.005
Gao, K., Cui, P., Zhao, C., Wei, F., and Gao, K. (2006). Landslide hazard evaluation of Wanzhou based on GIS information value method in the three gorges reservoir(In Chinese with English abstract). Chin. J. Rock Mech. Eng. 25, 991–996.
Goetz, J., Brenning, A., Petschko, H., and Leopold, P. (2015). Evaluating machine learning and statistical prediction techniques for landslide susceptibility modeling. Comput. Geosci. 81, 1–11. doi: 10.1016/j.cageo.2015.04.007
Guo, F., Yang, N., Meng, H., Zhang, Y., and Ye, B. (2008). Application of the relief amplitude and slope analysis to regional landslide hazard assessments(In Chinese with English abstract). Geol. China 35, 131–141.
Guzzetti, F., Carrara, A., Cardinali, M., and Reichenbach, P. (1999). Landslide hazard evaluation: a review of current techniques and their application in a multi-scale study, Central Italy. Geomorphology 31, 181–216. doi: 10.1016/S0169-555x(99)00078-1
Guzzetti, F., Peruccacci, S., Rossi, M., and Stark, C. P. (2008). The rainfall intensity-duration control of shallow landslides and debris flows:an update. Landslides 5, 3–17. doi: 10.1007/s10346-007-0112-1
Huang, R., and Li, W. (2009). Fault effect analysis of geo-hazard triggered by Wenchuan earthquake(In Chinese with English abstract). J. Eng. Geol. 17, 19–27.
Huete, A. R., Liu, H. Q., Batchily, K., and Leeuwen, W. V. A. (1997). A comparison of vegetation indices over a global set of TM images for EOS-MODIS. Rem. Sens. Environ. 59, 440–451. doi: 10.1016/S0034-4257(96)00112-5
Jiangxi Geological Disaster Emergency Center (2014). “Reportage on geohazard,” in Jiangxi Available online at: http://district.ce.cn/newarea/roll/201501/20/t20150120_4386022.shtml [in Chinese]
Kalantar, B., Pradhan, B., Naghibi, S. A., Motevalli, A., and Mansor, S. (2018). Assessment of the effects of training data selection on the landslide susceptibility mapping: a comparison between support vector machine (SVM), logistic regression (LR) and artificial neural networks (ANN). Geomat. Nat. Hazards Risk 9, 49–69. doi: 10.1080/19475705.2017.1407368
Kilburn, C. R. J., and Pasuto, A. (2003). Major risk from rapid, large - volume landslide in Europe(EU Project RUNOUT). Geomorphology 54, 3–9. doi: 10.1016/S0169-555X(03)00050-3
Kim, J. C., Lee, S. M., Jung, H. S., and Lee, S. (2018). Landslide susceptibility mapping using random forest and boosted tree models in pyeong-chang, Korea. Geocarto Int. 33, 1000–1015. doi: 10.1080/10106049.2017.1323964
Kumar, D., Thakur, M., Dubey, C. S., and Shukla, D. P. (2017). Landslide susceptibility mapping & prediction using support vector machine for mandakini river basin, garhwal himalaya, india. Geomorphology 295, 115–125. doi: 10.1016/j.geomorph.2017.06.013
Lan, H., Wu, F., Zhou, C., and Wang, S. (2002). Analysis on susceptibility of GIS based landslide triggering factors in Yunnan Xiaojiang watershed(In Chinese with English abstract). Chin. J. Rock Mech. Eng. 21, 1500–1506. doi: 10.1007/s11769-002-0042-8
Lee, S., and Min, K. (2001). Statistical analysis of landslide susceptibility at Yongin, Korea. Environ. Geol. 40, 1095–1113. doi: 10.1007/s002540100310
Lee, S., Ryu, J. Y., Min, K., and Won, J. (2010). Landslide susceptibility analysis using GIS and artificial neural network. Earth Surf. Process. Landforms 28, 1361–1376. doi: 10.1002/esp.593
Liang, Y., and Cui, X. (2010). SPSS15.0 Statistical Analysis and Practical Application. Beijing: China Rail- way Press, 141–148.
Li, L., Lan, H., Guo, C., Zhang, Y., Li, Q., and Wu, Y. (2017). A modified frequency ratio method for landslide susceptibility assessment. Landslides 14, 727–741. doi: 10.1007/s10346-016-0771-x
Li, T., Tian, Y., Wu, L., and Liu, L. (2014). Landslide susceptibility mapping using Random Forest(In Chinese with English abstract). Geogr. Geo Inform. Sci. 30, 25–30.
Mertens, B., and Lambin, E. F. (2000). Land cover change trajectories in Southern Cameroon, Annals of the Association of American Geographers. Ann. Assoc. Am. 90, 467–494. doi: 10.1111/0004-5608.00205
Meten, M., Prakashbhandary, N., and Yatabe, R. (2015). Effect of landslide factor combinations on the prediction accuracy of landslide susceptibility maps in the Blue Nile Gorge of Central Ethiopia. Geoenviron. Disasters 2:9.
Miao, Y., Zhu, A., Yang, L., Bai, S., Liu, J., and Deng, Y. (2016). Sensitivity of BCS for sampling landslide absence data in landslide susceptibility assessment. Mountain Res. 34, 432–441.
Montgomery, D. R., and Dietrich, W. E. (1994). A physically based model for the topographic control on shallow landsliding. Water Resour. Res. 30, 1153–1171. doi: 10.1029/93wr02979
Nadim, F., Kjekstad, O., Peduzzi, P., Herold, C., and Jaedicke, C. (2006). Global landslide and avalanche hotspots. Landslides 3, 159–173. doi: 10.1007/s10346-006-0036-1
Nandi, A., and Shakoor, A. (2010). A GIS-based landslide susceptibility evaluation using bivariate and multivariate statistical analyses. Eng. Geol. 110, 11–20. doi: 10.1016/j.enggeo.2009.10.001
Peng, L., Niu, R., Huang, B., Wu, X., Zhao, Y., and Ye, R. (2014). Landslide susceptibility mapping based on rough set theory and support vector machines: a case of the three gorges area, China. Geomorphology 204, 287–301. doi: 10.1016/j.geomorph.2013.08.013
Pradhan, B., and Lee, S. (2007). Utilization of optical remote sensing data and GIS tools for regional landslide hazard analysis using an artificial neural network model. Earth Sci. Front. 14, 143-151. doi: 10.1016/S1872-5791(08)60008-1
Ren, J., Fan, X., Zhao, C., Li, Z., and Dou, X. (2018). Evaluation of the landslide vulnerability in Duyun of Gui- zhou Province(In Chinese with English abstract). Hyderogeol. Eng. Geol. 45, 165–172.
Ruff, M., and Czurda, K. (2008). Landslide susceptibility analysis with a heuristic approach in the Eastern Alps (Vorarlberg, Austria). Geomorphology 94, 314–324. doi: 10.1016/j.geomorph.2006.10.032
Serneels, S., and Lambin, E. F. (2001). Proximate cause of land-use change in Narok District, Kenya: a spatial statistical model. Agriculture. Ecosyst. Environ. 85, 65–81. doi: 10.1016/s0167-8809(01)00188-8
Shan, J., Liu, X., Wei, L., and Zhu, X. (2004). Rainfall characteristics analyses on landslide in Jiangxi Province. Meteorol. Monthly 30, 13–15. doi: 10.1117/12.528072
Sharma, L. P., Patel, N., Ghose, M. K., and Debnath, P. (2015). Development and application of Shannon’s entropy integrated information value model for landslide susceptibility assessment and zonation in Sikkim Himalayas in India. Nat. Hazards 75, 1555–1576. doi: 10.1007/s11069-014-1378-y
Su, Q. (2006). Research on Loess Landslide Hazard Zonation Based on DEM(In Chinese with English abstract). Doctoral dissertation (in Chinese). Beijing: China University of Geosciences.
Su, X., Wei, W., Guo, W., Wang, S., Wang, G., Wu, W., et al. (2017). Analyzing the impact of relief amplitude to loess landslides based on SRTM DEM in Tianshui Prefecture(In Chinese with English abstract). J. Nepal Geol. Soc. 23, 99–110.
Tian, C., Liu, X., and Wang, J. (2016). Geohazard susceptibility assessment based on CF model and logistic regression models in Guangdong(In Chinese with English abstract). Hydrogeol. Eng. Geol. 43, 154–161.
Tian, Q., Zhang, B., Guo, J., Liu, H., Chang, Z., Li, Y., et al. (2020). Landslide susceptibility assessment based on the coupling model of information value and logistic regression(In Chinese with English abstract). Sci. Technol. Eng. 20, 8460–8468.
Tucker, C. J. (1979). Red and photographic infrared linear combinations for monitoring vegetation. Rem. Sens. Environ. 8, 127–150. doi: 10.1016/0034-4257(79)90013-0
Walsh, S. J., Crawford, T. W., Welsh, W. F., and Crews-Meyer, K. A. (2001). A multiscale analysis of LULC and NDVI variation in Nang Rong district, Northeast Thailand. Agric. Ecosyst. Environ. 85, 47–64. doi: 10.1016/s0167-8809(01)00202-x
Wang, H., Wang, G., Liu, G., and Xu, W. (2005). GIS-based landslide hazard assessment: an overview. Prog. Phys. Geogr. 29, 548–567. doi: 10.1191/0309133305pp462ra
Wang, H. (2013). Interpolation algorithm for shallow foundations settlement based on compression and load settlement curves(In Chinese with English abstract). J. Geotechn. Eng. 35, 663–670.
Wang, N., Guo, Y., Liu, T., and Zhu, Q. (2019). Landslide susceptibility assessment based on support vector machine model(In Chinese with English abstract). Sci. Technol. Eng. 19, 70–79.
Wang, X., and Wang, J. (2017). Application of comprehensive graph weight method to landslide deformat- ion prediction(In Chinese with English abstract). J. Yangtze River Sci. Res. Inst. 34, 82–86.
Wu, W. (2003). Application de la Géomatique au Suivi de la Dynamique Environnementale en Zones Arides (in French). Ph. D dissertation. Paris: Université de Paris 1-Panthéon-Sorbonne.
Wu, W. (2014). The generalized difference vegetation index (GDVI) for dryland characterization. Rem. Sens. Environ. 6, 1211–1233. doi: 10.3390/rs6021211
Wu, W., and Ai, G. (1995). Risk assessment of natural disasters in the course of selection of nuclear waste disposal (in Chinese with English abstract). J. East China Geol. Inst. 18, 260–265.
Wu, W., Zucca, C., Karam, F., and Liu, G. (2016). Enhancing the performance of regional land cover mapping. Int. J. Appl. Earth Observ. Geoinform. 52, 422–432. doi: 10.1016/j.jag.2016.07.014
Wu, W., Zucca, C., Muhaimeed, A. S., Al-Shafie, W. M., Fadhil Al-Quraishi, A. M., Nangia, V., et al. (2018). Soil salinity prediction and mapping by machine learning regression in Central Mesopotamia, Iraq. Land Degr. Dev. 29, 4005–4014. doi: 10.1002/ldr.3148
Xia, H., Yin, K., Liang, X., and Ma, F. (2018). Landslide susceptibility assessment based on SVM-ANN models: a case study for Wushan County in the three gorges reservoir(In Chinese with English abstract). Chin. J. Geol. Hazard Control 29, 13–19.
Xing, Q., Zhao, C., Gao, K., and Guo, Y. (2004). Logical regression analysis on the hazard of landslide based on GIS(In Chinese with English abstract). Geogr. Geo Inform. Sci. 20, 49–51.
Xu, J. (2005). Study on the Mechanism of Deformation Disintegration Failure and the Stability of Debris Landslide(In Chinese with English abstract). Doctoral dissertation. Hangzhou: Zhejiang University.
Yang, G., Xu, P., Cao, C., Zhang, W., Lan, Z., Chen, J., et al. (2019). Assessment of regional landslide susceptibility based on combined model of certainty factor method(In Chinese with English abstract). J. Eng. Geol. 27, 1153–1163. doi: 10.13544/j.cnki.jeg.2019018
Yao, X., Tham, L., and Dai, F. (2008). Landslide susceptibility mapping based on support vector machine: a case study on natural slopes of hong kong, china. Geomorphology 101, 572–582. doi: 10.1016/j.geomorph.2008.02.011
Yilmaz, I. (2009). A case study from koyulhisar (sivas-turkey) for landslide susceptibility mapping by artificial neural networks. Bull. Eng. Geol. Environ. 68, 297–306. doi: 10.1007/s10064-009-0185-2
Yin, J., Chen, J., Xu, X., Wang, X., and Zheng, Y. (2010). The characteristics of the landslides triggered by the Wenchuan Ms 8.0 Earthquake from Anxian to Beichuan. J. Asian Earth Sci. 37, 452–458. doi: 10.1016/j.jseaes.2009.12.002
Yu, J. (2003). analysis of Excavation and Support of High Rock Slope(In Chinese with English abstract). Doctoral dissertation. Hangzhou: Zhejiang University.
Zhang, B., Tang, M., and Liu, R. (2017). Dynamic data driven multi-model coupled for analyzing the stability of landslide(In Chinese with English abstract). Geomat. Spatial Inform. Technol. 40, 142–147.
Zhang, L., and Jiang, S. (2004). Data driver model for regional landslide susceptibility assessment and its application(In Chinese with English abstract). Hydrogeol. Eng. Geol. 6, 33–35.
Zhang, Q., Ling, S., Li, X., Sun, C., Xu, J., and Huang, T. (2020). Comparison of landslide susceptibility mapping rapid assessment models in Jiuzhaigou County, Sichuan province, China(In Chinese with English abstract). Chin. J. Rock Mech. Eng. 39, 1595–1610.
Zhang, X. (2019). Hazard Assessment and Zoning Research of Landslide in Shanxi Province Based on GIS(In Chinese with English abstract). Master dissertation, Xi’an: Chang’an University.
Zhang, Y., Wu, W., Qi, Y., Lin, Z., Zhang, G., Chen, R., et al. (2020). Mapping landslide hazard risk using random forest algorithm in Guixi, Jiangxi, China. ISPRS Int. J. Geo Inform. 9:695. doi: 10.3390/ijgi9110695
Zhao, Y., Wang, R., Jiang, Y., Liu, H., and Wei, Z. (2019). GIS-based logistic regression for rainfall-induced landslide susceptibility mapping under different grid sizes in Yueqing, Southeastern China. Eng. Geol. 259:105147. doi: 10.1016/j.enggeo.2019.105147
Keywords: landslide, information value analysis, logistic regression model, risk zoning, Jiangxi province
Citation: Ou P, Wu W, Qin Y, Zhou X, Huangfu W, Zhang Y, Xie L, Huang X, Fu X, Li J, Jiang J, Zhang M, Liu Y, Peng S, Shao C, Bai Y, Zhang X, Liu X and Liu W (2021) Assessment of Landslide Hazard in Jiangxi Using Geo-information Technology. Front. Earth Sci. 9:648342. doi: 10.3389/feart.2021.648342
Received: 31 December 2020; Accepted: 26 February 2021;
Published: 27 April 2021.
Edited by:
Norifumi Hotta, The University of Tokyo, JapanReviewed by:
Qi Yao, China Earthquake Networks Center, ChinaJoern Lauterjung, Helmholtz Centre Potsdam, Germany
Copyright © 2021 Ou, Wu, Qin, Zhou, Huangfu, Zhang, Xie, Huang, Fu, Li, Jiang, Zhang, Liu, Peng, Shao, Bai, Zhang, Liu and Liu. This is an open-access article distributed under the terms of the Creative Commons Attribution License (CC BY). The use, distribution or reproduction in other forums is permitted, provided the original author(s) and the copyright owner(s) are credited and that the original publication in this journal is cited, in accordance with accepted academic practice. No use, distribution or reproduction is permitted which does not comply with these terms.
*Correspondence: Weicheng Wu, Wuwc030903@sina.com; wuwch@ecut.edu.cn