Upward Expansion of Supra-Glacial Debris Cover in the Hunza Valley, Karakoram, During 1990 ∼ 2019
 Fuming Xie1,2
  Shiyin Liu1,2,3* Kunpeng Wu1,2 Yu Zhu1,2 Yongpeng Gao1,2 Miaomiao Qi1,2 Shimei Duan1,2 Muhammad Saifullah2,4
  Adnan A. Tahir5
- 1Yunnan Key Laboratory of International Rivers and Transboundary Eco-Security, Yunnan University, Kunming, China
- 2Institute of International Rivers and Eco-Security, Yunnan University, Kunming, China
- 3State Key Laboratory of Cryospheric Sciences, Northwest Institute of Eco-Environment and Resources, Chinese Academy of Sciences, Lanzhou, China
- 4Department of Agricultural Engineering, Muhammad Nawaz Shareef University of Agriculture, Multan, Pakistan
- 5Department of Environmental Sciences, COMSATS University Islamabad, Abbottabad Campus, Abbottabad, Pakistan
Supra-glacial debris cover is key to glacier ablation through increasing (thin debris layer) or decreasing (thick debris layer) melt rates, thereby regulating the mass balance of a glacier and its meltwater runoff. The thickening or lateral expansion of supra-glacial debris cover correlates with a reduction of glacier ablation and, consequently, runoff generation, which is also considered to be an influential factor on the rheology and dynamics of a glacierized system. Studies on supra-glacial debris cover have recently attracted wide attention especially for glaciers in the Himalayas and Karakoram, where the glaciers have heterogeneously responded to climate change. In this study, we used 32 images from the Landsat Thematic Mapper, Enhanced Thematic Mapper Plus, and Operational Land Imager archive, going back to 1990, which are available on the Google Earth Engine cloud-computing platform, to map the supra-glacial debris cover in the Hunza Valley, Karakoram, Pakistan, based on a band ratio segmentation method (normalized difference snow index [NDSI] < 0.4), Otsu thresholding, and machine learning algorithms. Compared with manual digitization, the random forest (RF) model was found to have the greatest accuracy in identifying supra-glacial debris, with a Kappa coefficient of 0.94 ± 0.01 and an overall accuracy of 95.5 ± 0.9%. Overall, the supra-glacial debris cover in the study area showed an increasing trend, and the total area expanded by 8.1–21.3% for various glaciers from 1990 to 2019. The other two methods (Otsu thresholding and NDSI < 0.4) generally overestimated the supra-glacial debris covered area, by 36.3 and 18.8%, respectively, compared to that of the RF model. The supra-glacial debris cover has migrated upward on the glaciers, with intensive variation near the equilibrium-line altitude zone (4,500–5,500 m a.s.l.). The increase in ice or snow avalanche activity at high altitudes may be responsible for this upward expansion of supra-glacial debris cover in the Hunza Valley, which is attributed to the combined effect of temperature decrease and precipitation increase in the study area.
Introduction
Glaciers are not only a diminishing natural freshwater resource but also a sensitive indicator of global climate change (Yang, 1995; Kaab et al., 2012; Kraaijenbrink et al., 2017; Zemp et al., 2019). However, due to global warming, global glaciers are showing a trend of retreat and thinning. Recent studies on mass balance (Rowan et al., 2015; Lynch et al., 2016; Dehecq et al., 2018; Wu et al., 2018; Wang et al., 2019a; Wouters et al., 2019; Zemp et al., 2019), glacial area change (Paul et al., 2013; Patel et al., 2019; Reinthaler et al., 2019), surface velocity (Wang et al., 2018; Altena et al., 2019; Garg et al., 2019), glacio-hydrological modeling (Shrestha et al., 2015), and glaciers’ response to climate change (Scherler et al., 2011; Rowan et al., 2015) have revealed that changes in glaciers are exerting an impact on socioeconomic development in their downstream areas through changes in glacial water resources in High Mountain Asia (Immerzeel et al., 2010). Climate change may force geomorphological processes on high mountain slopes (Tipper et al., 2012; Cook et al., 2020) by accelerating the disintegration of rocks and increasing the accumulation of debris on glaciers and mountain slopes. As a result, the alpine glaciers widely distributed in the Pamir, Karakorum, Kunlun, Nyainqentangula, and Himalaya Mountains (Scherler et al., 2011; Khan et al., 2015; Zhang et al., 2016; Shukla and Garg, 2019) have widespread supra-glacial debris cover. Some studies have referred to glacier areas with sporadic debris cover as “dirty ice” (Robson et al., 2015; Fyffe et al., 2019a, b). The debris cover on glaciers affects the energy exchange at the ice surface and therefore has an impact on the surface mass balance of glaciers. It is therefore possible for glaciers to gain more heat from the environment, increasing the melt rate and causing the mass loss of glaciers.
Compared with clean ice or snow, the debris layer has a unique thermal process due to differences in physical properties such as reflectance, particle size, and color, which results in different ablation processes in the underlying ice (Østrem, 1959; Nicholson and Benn, 2006). Also, the differential ablation caused by an uneven distribution of debris thickness makes it easy for glaciers to form cliffs (Kindermann et al., 2008; Herreid and Pellicciotti, 2018) and ponds (Miles et al., 2016; Chand and Watanabe, 2019) in the ablation zone. Notably, these cliffs and ponds are not only factors that affect the hydrological process but also home to numerous glacial lakes, which can pose a serious threat to downstream communities and lead to catastrophic socioeconomic disasters in cases of glacial lake outburst flood (Benn et al., 2012; Dubey and Goyal, 2020). Therefore, obtaining information about the spatial distribution and temporal variation of supra-glacial debris cover would enhance the understanding of debris-covered glaciers and the glacial hydrological model. Some studies have shown that the area of debris cover is increasing as, overall, glaciers shrink and lose mass. For example, the supra-glacial debris cover in the Greater Caucasus increased from 48.3 ± 3.1 km2 in 1986 to 79.0 ± 4.9 km2 in 2014, based on Landsat and images from the years 1986, 2000, and 2014 (Tielidze et al., 2020). Furthermore, the glaciers in Pamir, Karakoram, and West Kunlun have moved forward or backward, either in equilibrium or showing an increase in mass (“Karakoram anomaly”) in recent years (Salerno et al., 2017; Farinotti et al., 2020; Gao et al., 2020), and it is of great interest to know whether this debris cover increase phenomenon exists for glaciers in anomaly areas, such as the Hunza Valley. Although some studies have mapped the spatial distribution of supra-glacial debris cover in this area (Khan et al., 2015, 2020; Mölg et al., 2018; Gao et al., 2020), they were limited to the extraction of spatial distribution information and lack any analysis on the temporal dynamic changes of supra-glacial debris.
Since the reflectance of supra-glacial debris is similar to that of non-glaciated slopes (Paul et al., 2004) and there is a lack of continuous, large-scale, high-quality cloud and shadow-free optical images, obtaining the long-term supra-glacial debris variations based on remote imagery is challenging. Previous studies have attempted to distinguish clean ice from debris-covered ice by using individual parameters such as the normalized difference vegetation index (NDVI), normalized difference snow index (NDSI), normalized difference water index (NDWI), and spectral band ratio thresholds [e.g., near-infrared (NIR)/short-wave infrared (SWIR)] or their combination from optical remote sensing images (Bolch et al., 2010; Alifu et al., 2015, 2016; Mölg et al., 2018). These methods can robustly delineate clean ice or snow, but they cannot accurately and automatically classify debris-covered ice as distinct from clean ice and the surrounding land surface (Robson et al., 2015). This has stimulated studies on the use of other parameters, such as geomorphic parameters derived from digital elevation models (DEMs) (Paul et al., 2004; Frey and Paul, 2012; Patel et al., 2019) and thermal characteristics from the infrared band (Singh and Goyal, 2018), as well as utilizing the coherence change between two successive synthetic aperture radar (SAR) images (Janke et al., 2015; Robson et al., 2015; Yang et al., 2016; Lippl et al., 2018), and the recognition accuracy was improved. However, complex preprocessing and severe terrain noise from SAR data make large-scale applications difficult. In conclusion, especially for the long-time series involved in debris monitoring, optical images, with decades of continuous observations, such as the Landsat archive, are more practical.
In recent years, machine-learning-based classification methods have been applied to mapping glacier facies (Racoviteanu and Williams, 2012; Shukla and Yousuf, 2016; Zhang et al., 2019; Yousuf et al., 2020). Studies have shown that machine learning has advantages in extracting land-surface information from remote sensing images, which can effectively improve the accuracy of object recognition (Lary et al., 2017; Maxwell et al., 2018). However, mining large-scale and time series land information from high spatiotemporal resolution remote sensing data was found to be a computationally intensive task, requiring powerful computing platforms for analysis. Fortunately, some geospatial cloud-computing platforms are emerging that meet this demand, such as Google Earth Engine GEE, Amazon Web Services, Earth Server, and the Earth Observation Data Centre (Guo et al., 2020). Among these, GEE has advantages because it is an open-source, cloud-based platform for planetary-scale geospatial analysis that integrates mainstream free satellite data, such as the Landsat archive, Sentinel series imagery, and other terrain products and climate data (Gorelick et al., 2017). It can remove the parts of cloud, cloud shadow, and terrain shadow that affect each scene at the pixel scale, compared with the local image processing and analysis software, which takes the scene as a processing unit. The GEE platform has been widely used for various high-impact societal issues such as forest resources (Hazel et al., 2016), water resources (Pekel et al., 2016; Wang et al., 2019b), and land-use classification (Dong et al., 2016; Midekisa et al., 2017; Hao et al., 2019_ENREF_18) and has achieved remarkable results.
The aim of this study was to develop an automatic algorithm to identify debris-covered ice and map its spatiotemporal distribution in order to explore the dynamic process of supra-glacial debris cover by combining glacier inventory data and remotely sensed images on the GEE geospatial analysis platform. The study focused on glaciers in the Hunza Valley in the Karakorum Mountains of Pakistan. Otsu’s method was utilized to optimize thresholds of NDSI, and three machine learning algorithms [random forest (RF), support vector machine (SVM), and classification and regression tree (CART)] were used to classify supra-glacial features, including debris-covered ice, at the pixel level. Raw spectral information, band ratios, and color-to-grayscale conversion from Landsat 5/8 optical satellite imagery and the topographical components derived from DEM products were extracted as feature variables in the machine learning models. The same scheme was used to generate a time series of the debris-covered and clean ice areas in the study area. Finally, the results were comprehensively analyzed and discussed together with other data derived at the same time.
Study Area
The Hunza Valley is an area measuring ∼11,000 km2, located in the western Karakoram, northern Pakistan (36°00′15′′ ∼ 37°05′23′′ N, 74°02′57′′ ∼ 75°46′48′′ E) (Figure 1). The topography across the Hunza Valley is characterized by large altitudinal variations, from 1,341 to 7,831 m above sea level (a.s.l.). The valley is home to glaciers with a total area of ∼3,600 km2 (1,878 glaciers, with ∼12% of them being larger than 0.5 km2) that accounts for ∼33% of the basin area based on the Randolph Glacier Inventory (RGI) 6.0 dataset (RGI Consortium, 2017). Most of the glaciers (e.g., Hispar, Batura, and Barpu) are debris-covered and in a state of surging and advancing (Bhambri et al., 2017). Debris-covered glaciers are potential factors driving glacial lake outburst floods (Bhambri et al., 2019), which represent a major threat to local people, their property, and infrastructure such as the Karakoram Highway in the Hunza Valley. Climatologically, the study area is arid to semi-arid, situated in the subtropical climate zone and experiences significant variations in precipitation and temperature (Immerzeel et al., 2012). Based on the Moderate Resolution Imaging Spectroradiometer (MODIS) 1-km land-surface temperature daily products, the mean land-surface temperature for the entire region is −12.9°C in January and 20.1°C in July. Precipitation is mainly controlled by Indian monsoons and the westerlies, and the average annual precipitation is between 180 and 690 mm (Qureshi et al., 2017). Snow cover occupies approximately 80% of the basin’s land surface in the winter, decreasing to 30% in the summer (Tahir et al., 2011). The types of land cover in the basin include forest (0.4%), shrubland (16.1%), farmland (0.7%), and barren land (82.8%). The main soil types include Leptosols (type LP), rock outcrop soil (type RK), and glaciated soil (type GG). The primary soil component in the region is highly active clay, followed by rock outcrops and glacial soil (Garee et al., 2017; Ali et al., 2018).
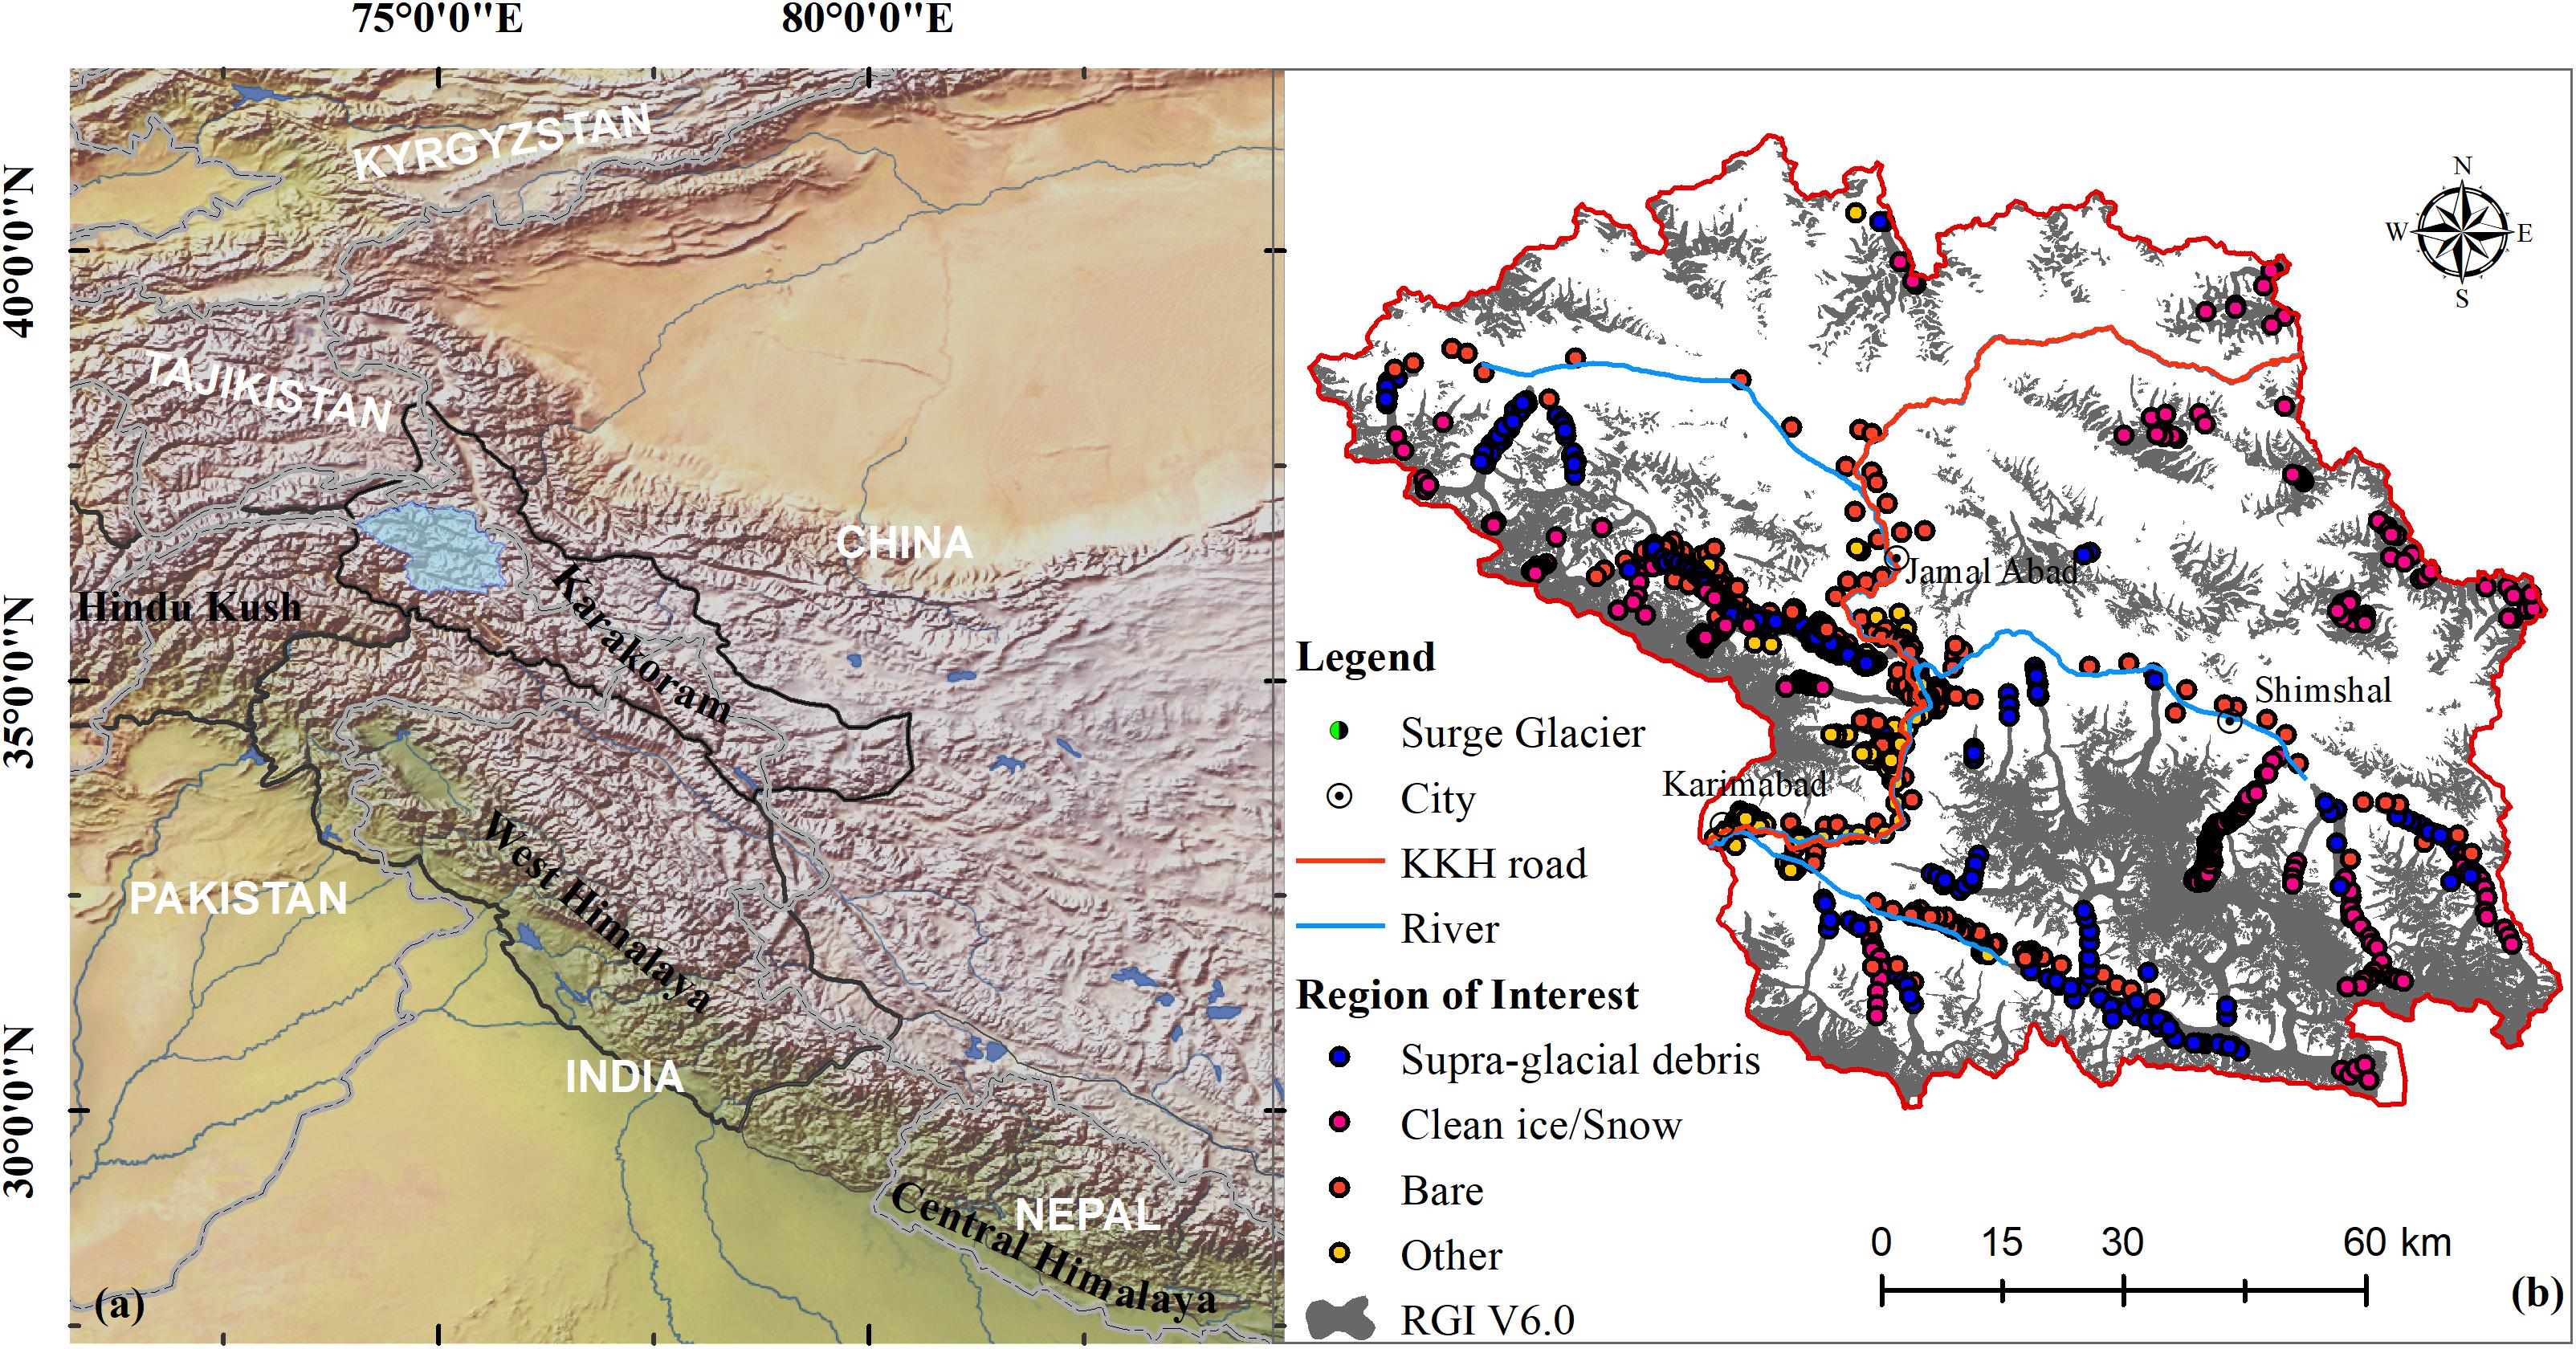
Figure 1. (a) Location of the Hunza Valley (blue area) in the Karakoram. (b) Major cities, rivers, and road (Karakoram Highway) in the Hunza Valley, RGI 6.0 glaciers, and region-of-interest sample sites for various land types used in the machine-learning classification model (2019).
Data and Methods
Landsat Imagery and Preprocessing
The Hunza Valley is covered by three WRS2 path/rows (149/034, 149/035, and 150/034) of Landsat images. We collected all the available standard level 1 terrain-corrected products of the Landsat raw scenes that were consistent in geometry and radiometry on the GEE platform, representing the years 1990–2019, including 10 Landsat TM images, four Landsat Enhanced Thematic Mapper Plus (ETM+) images, and 18 Landsat Operational Land Imager (OLI) images (see Table 1). The selection of images was constrained by the acquisition time during the ablation season (e.g., during July, or 200–270 days) when the images showed minimum snow cover, with little or no cloud cover. Mosaics of three path-row images within the same year in the research domain has been processed ready for debris extraction except for 2010 which were the mosaic from TM images acquired in 2008 (149/034), 2009 (149/035), and 2011 (150/034), respectively, due to wide snow cover of images in 2010. The Landsat 7 ETM+ data from 2000 only were used because of data gaps caused by scan line corrector failure since June 2003. Spectral bands with 30-m resolution were used in this study. All the data were publicly available, for free, on the United States Geological Survey (USGS) website.1 We applied a standard top-of-atmosphere calibration, which is available on the GEE platform, to all the USGS Landsat Raw Scenes, converting the pixel digital number values to top-of-atmosphere reflectance (Chandera et al., 2009). Then, we assigned a cloud score to each pixel, using the Landsat simple cloud score algorithm,2 which computes a simple cloud-likelihood score from 0 (not cloudy) to 100 (most cloudy), using a combination of brightness, temperature, and NDSI. We used a <10 threshold on the cloud score to mask cloudy pixels and took the per-band median values from the accepted pixels. Whole-image data preprocessing and the subsequent classification process were implemented by coding on the GEE platform.
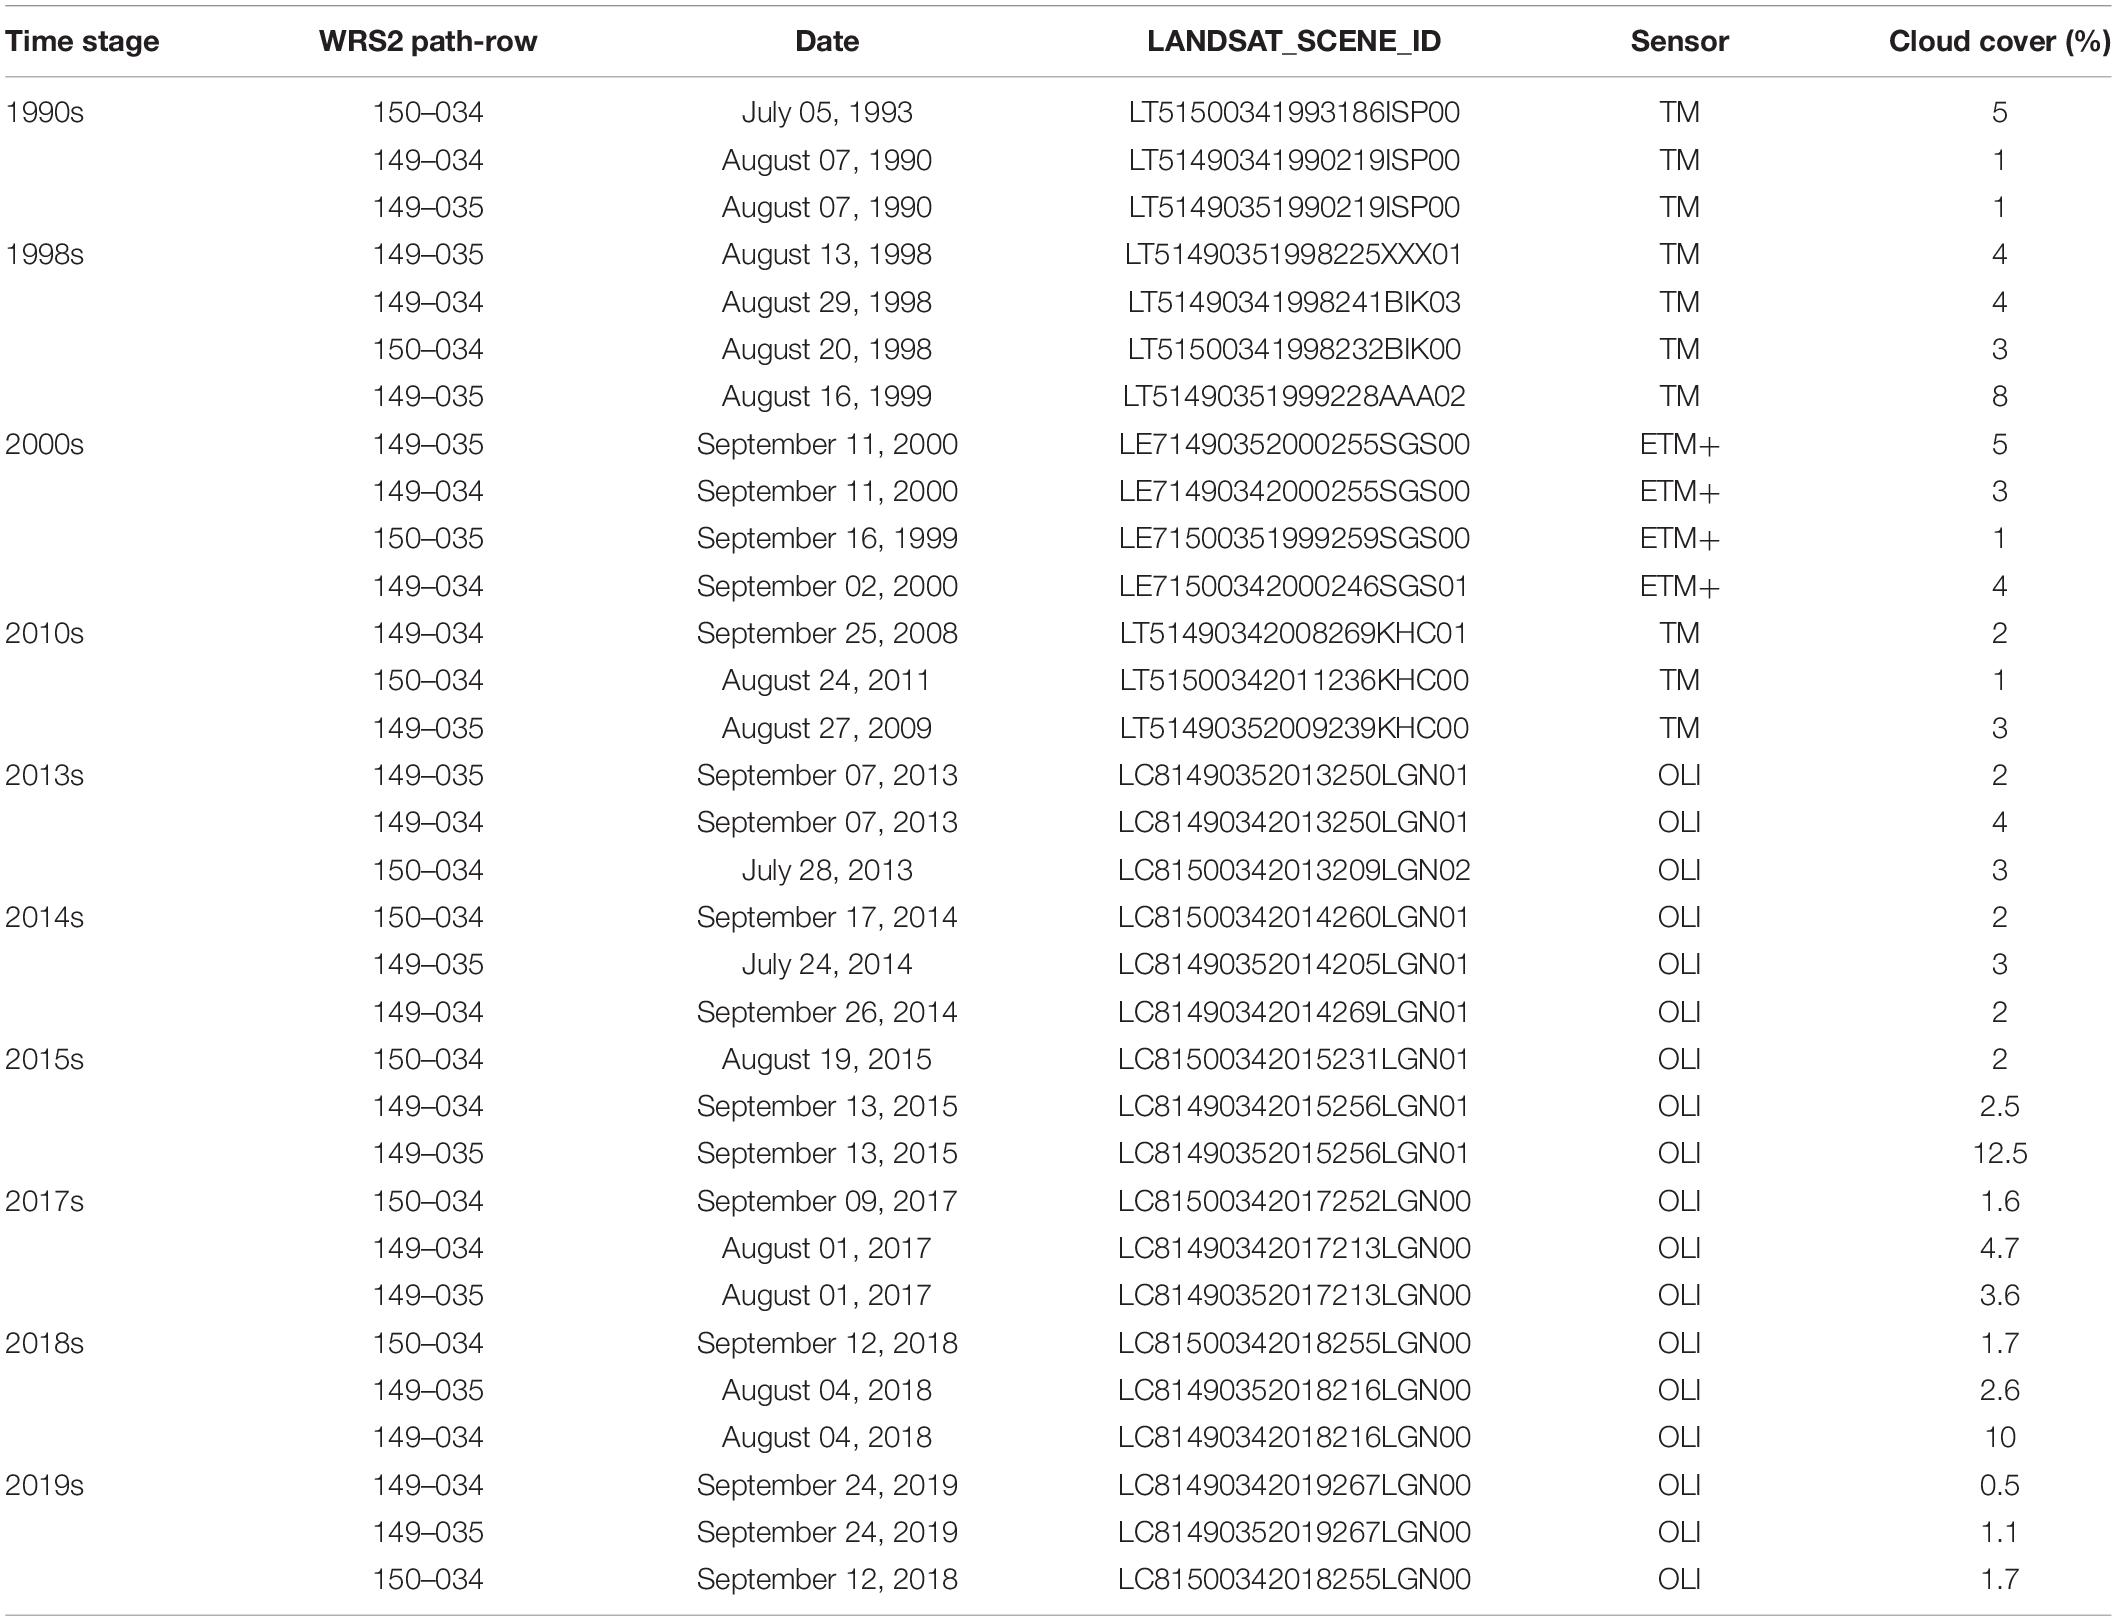
Table 1. List of Landsat scenes used to map the dynamics of supra-glacial debris.
Supra-Glacial Debris Extraction
Debris-Covered Ice Extraction
In this work, we used three algorithms to map the debris-covered outlines of glaciers. A detailed framework for debris-covered ice extraction is presented in Figure 2. The first algorithm was a machine-learning algorithm including SVM (Suykens and Vandewalle, 1999), RF (Liaw and Wiener, 2002), and CART (Breiman et al., 1984). Default parameters were used, but 500 trees were set for the RF classification model, and the kernel type of radial basis function that is suitable for the case of linear inseparability was applied in the SVM model. It is obvious that a single spectrum cannot fully solve the problem of the similarity of ice covered with debris to the surrounding terrain. We generated 14 feature variables: original spectrum (Band 1 ∼ 7); band ratios (NIR/SWIR1); NDVI ([NIR − Red]/[NIR + Red]); NDSI ([Green − SWIR1]/[Green + SWIR1]); NDWI ([Green − NIR]/[Green + NIR]); and luminance (0.3*Red + 0.59*Green + 0.11*Blue); and geomorphic parameters (slope and aspect). The training data were visually sampled, based on Landsat images at coincident times, combined with high-resolution images from Sentinel-2 and Google Maps. Samples in the regions of interest were divided into clean ice or snow, debris-covered ice (or supra-glacial debris), bare land, and other (e.g., vegetation, villages, rivers, lakes, and shadows), according to the land cover types pertaining to the Hunza Valley (Ali et al., 2018). For example, for 2019, 1,024 samples (shown in Figure 1) were selected, including 373 debris, 356 ice/snow, 270 bare land, and 205 other. The second method was a band ratio segmentation method (NDSI < 0.4) (Dozier, 1989) for eliminating the clean ice/snow part, under the restrictions of the RGI 6.0 outlines. However, a fixed NDSI threshold of 0.4 may not have been applicable to all periods. Therefore, we developed an optimization method based on Otsu algorithms to optimize the NDSI threshold to better distinguish between clean ice/snow and debris-covered ice in different periods. The Otsu algorithm is an automatic non-parametric and unsupervised method for thresholding that is used to automatically detect targets in computer vision and image-processing fields (Ng, 2006). It is a global threshold method, and its principles are the following: assume that the gray value of an image is 1 ∼ N, divide it into two groups at value k, G0 = [1∼k], and G1 = [k + 1∼N], and calculate the probability of the two groups, ω0 and ω1, the average values for each group (μ0 and μ1), and the entire image (μ). Then, the variance of the two groups can be calculated by the following equation:
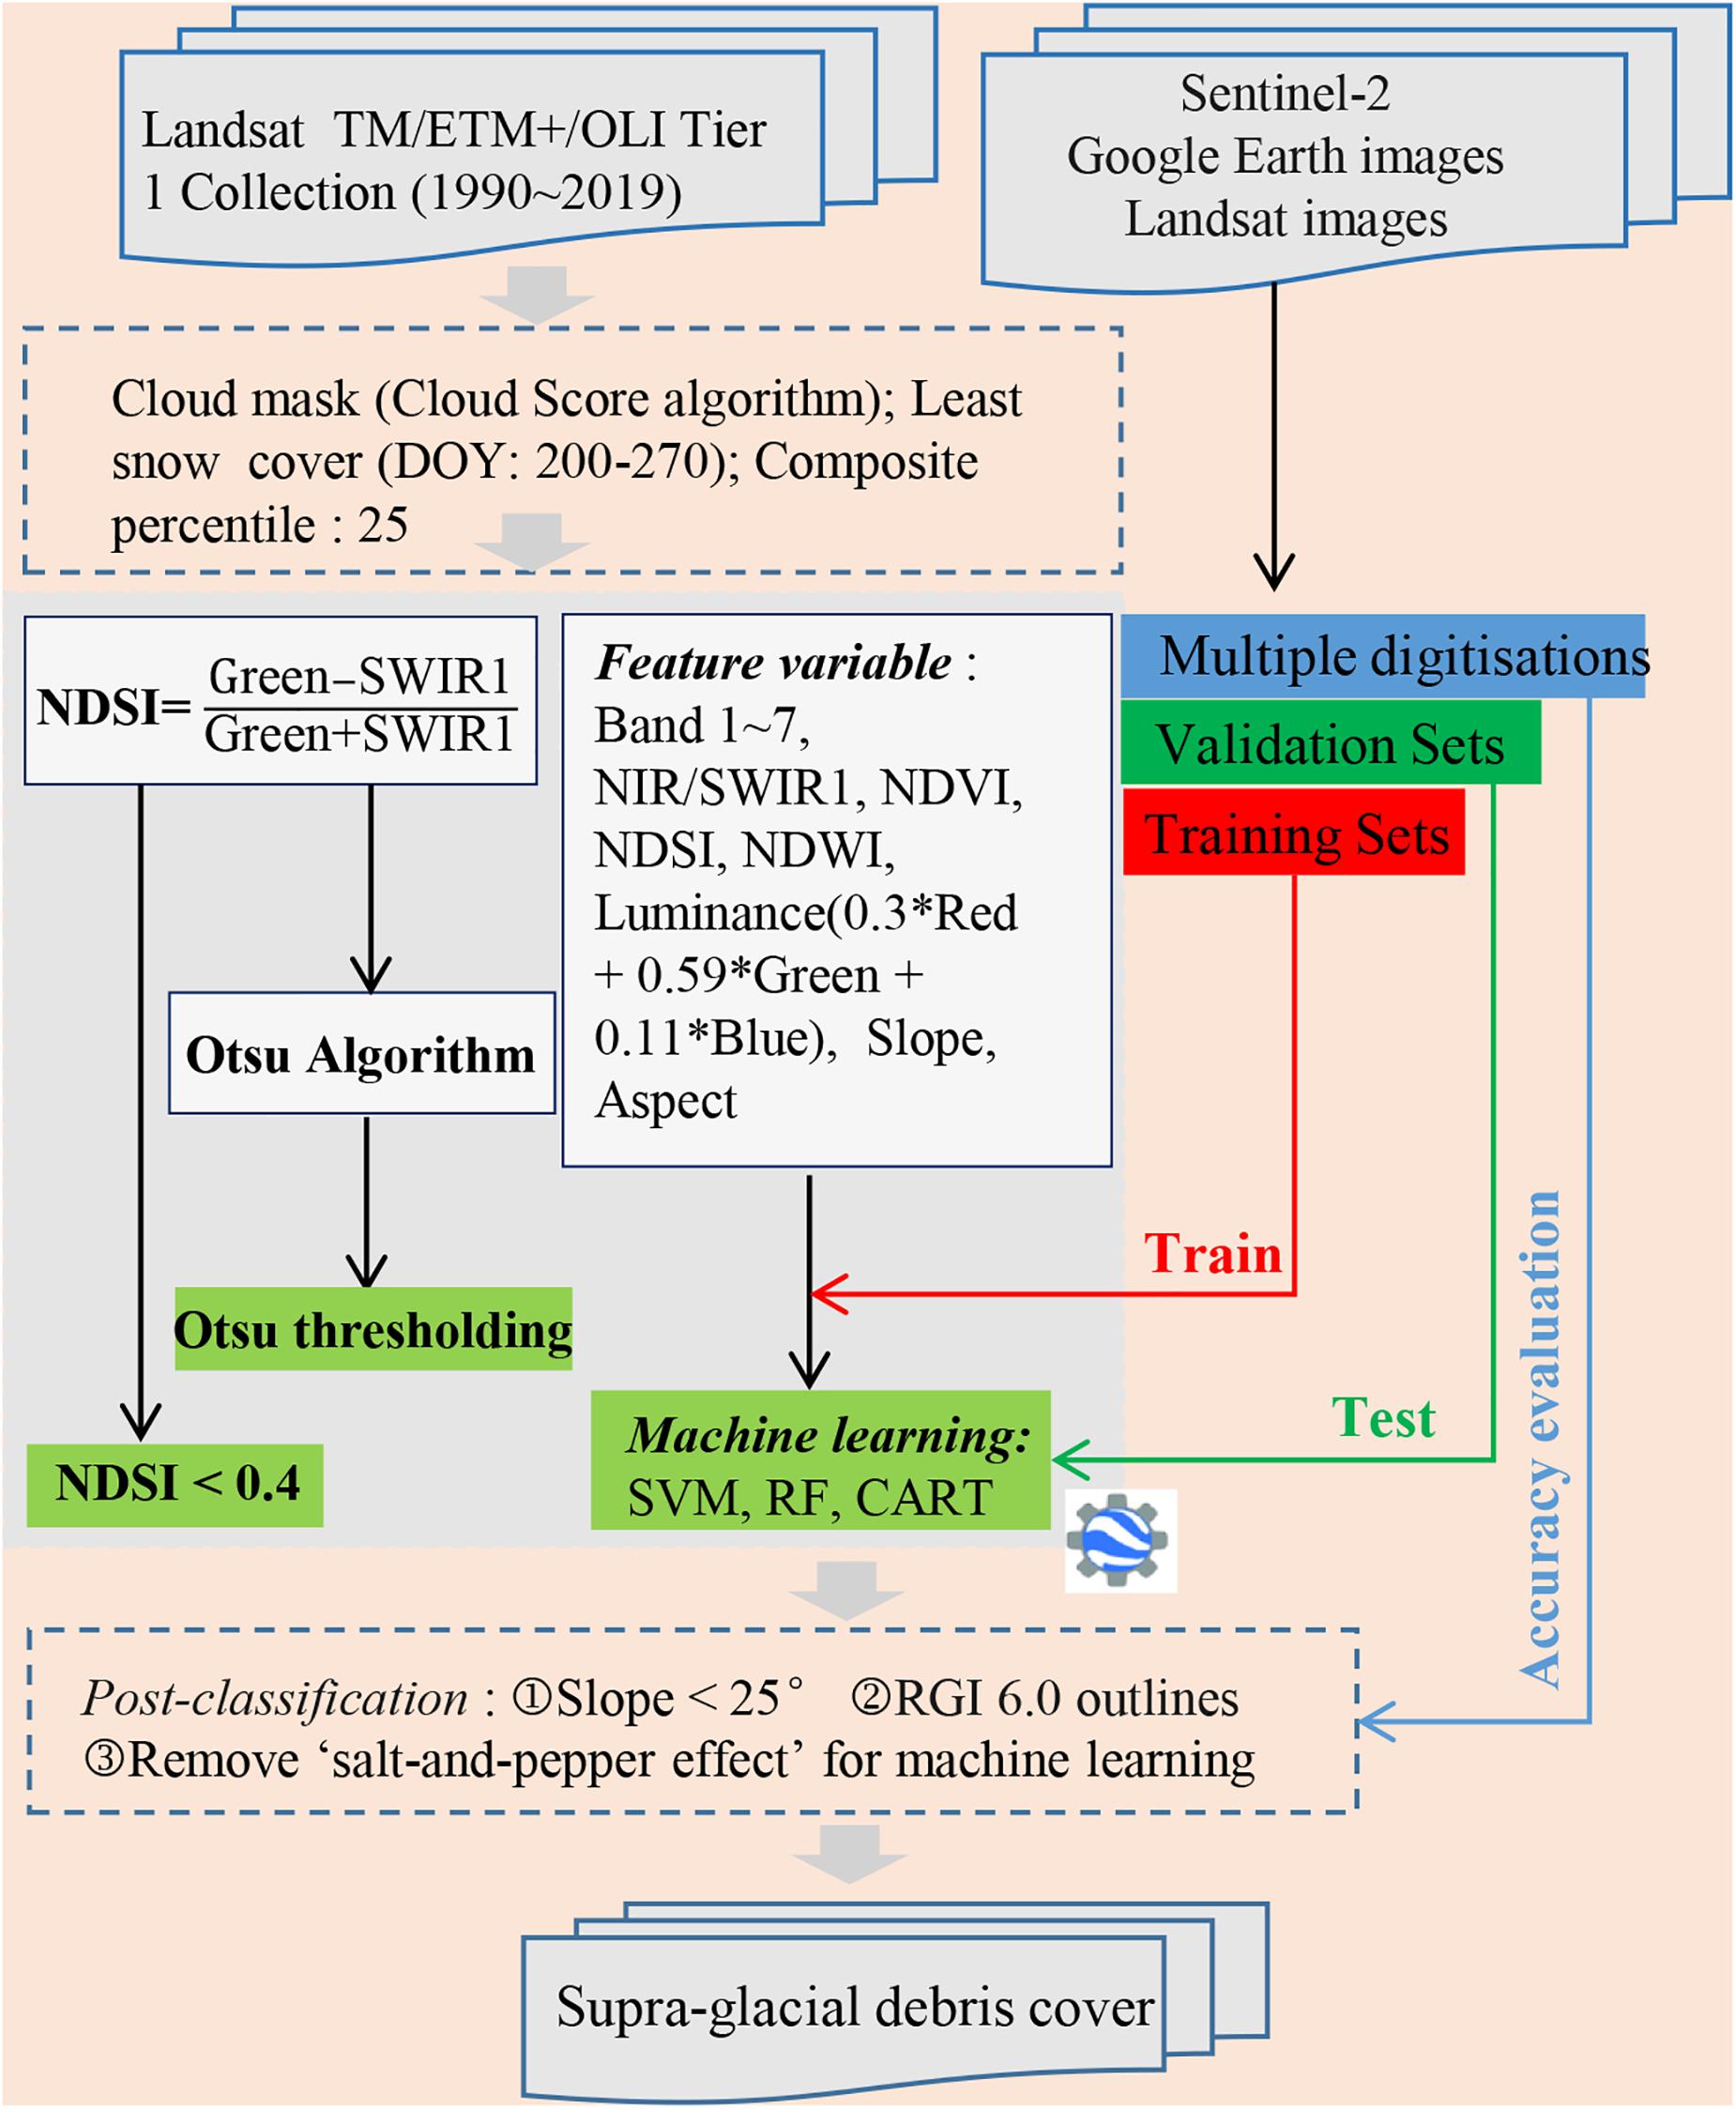
Figure 2. Framework used for mapping debris cover on the GEE platform.
where σ2(k) is a threshold selection function. By changing the k-value in 1 ∼ N, the k-value at which σ2(k) is maximized is the required threshold.
Slope Delimitation and “Salt and Pepper Effect” Removal
Topographic parameters are a key factor in delineating glacier areas with debris cover. The spatial distribution of supra-glacial debris depends on the geomorphology and elevation gradient (Paul et al., 2004). Thus, parameters such as slope, aspect, and plan curvature derived from DEM were applied to improve the accuracy of classification of the debris cover and clean ice on the glacier surfaces. Some previous studies proposed various thresholds for the slope; for example, a slope < 24° (Paul et al., 2004) or smaller values [<12° (Alifu et al., 2015) or <14 ∼ 16° (Robson et al., 2015)] were used to distinguish debris-covered glaciers from the surrounding terrain. We hypothesized that the slope threshold would show spatial heterogeneity for various glacierized mountains. We used the slope gradient derived from the Shuttle Radar Topography Mission DEM void-filled version, known as “SRTM Plus,” at a resolution of 1 arc-second (approximately 30 m), which was available from the National Aeronautics Space Administration Jet Propulsion Laboratory. To obtain a typical slope threshold for this region, we evenly selected 713 slope samples from the glacier areas covered by debris in the Hunza Valley using visual interpretation. Our statistical results indicated that slopes of <25° dominated 99% of the debris-covered glacier areas with an average slope of 6.7° (Figures 3A,B). Therefore, a slope threshold of 25°, which is consistent with suggestions in Paul et al. (2004), was used to distinguish the glacier debris areas from the surrounding debris areas.
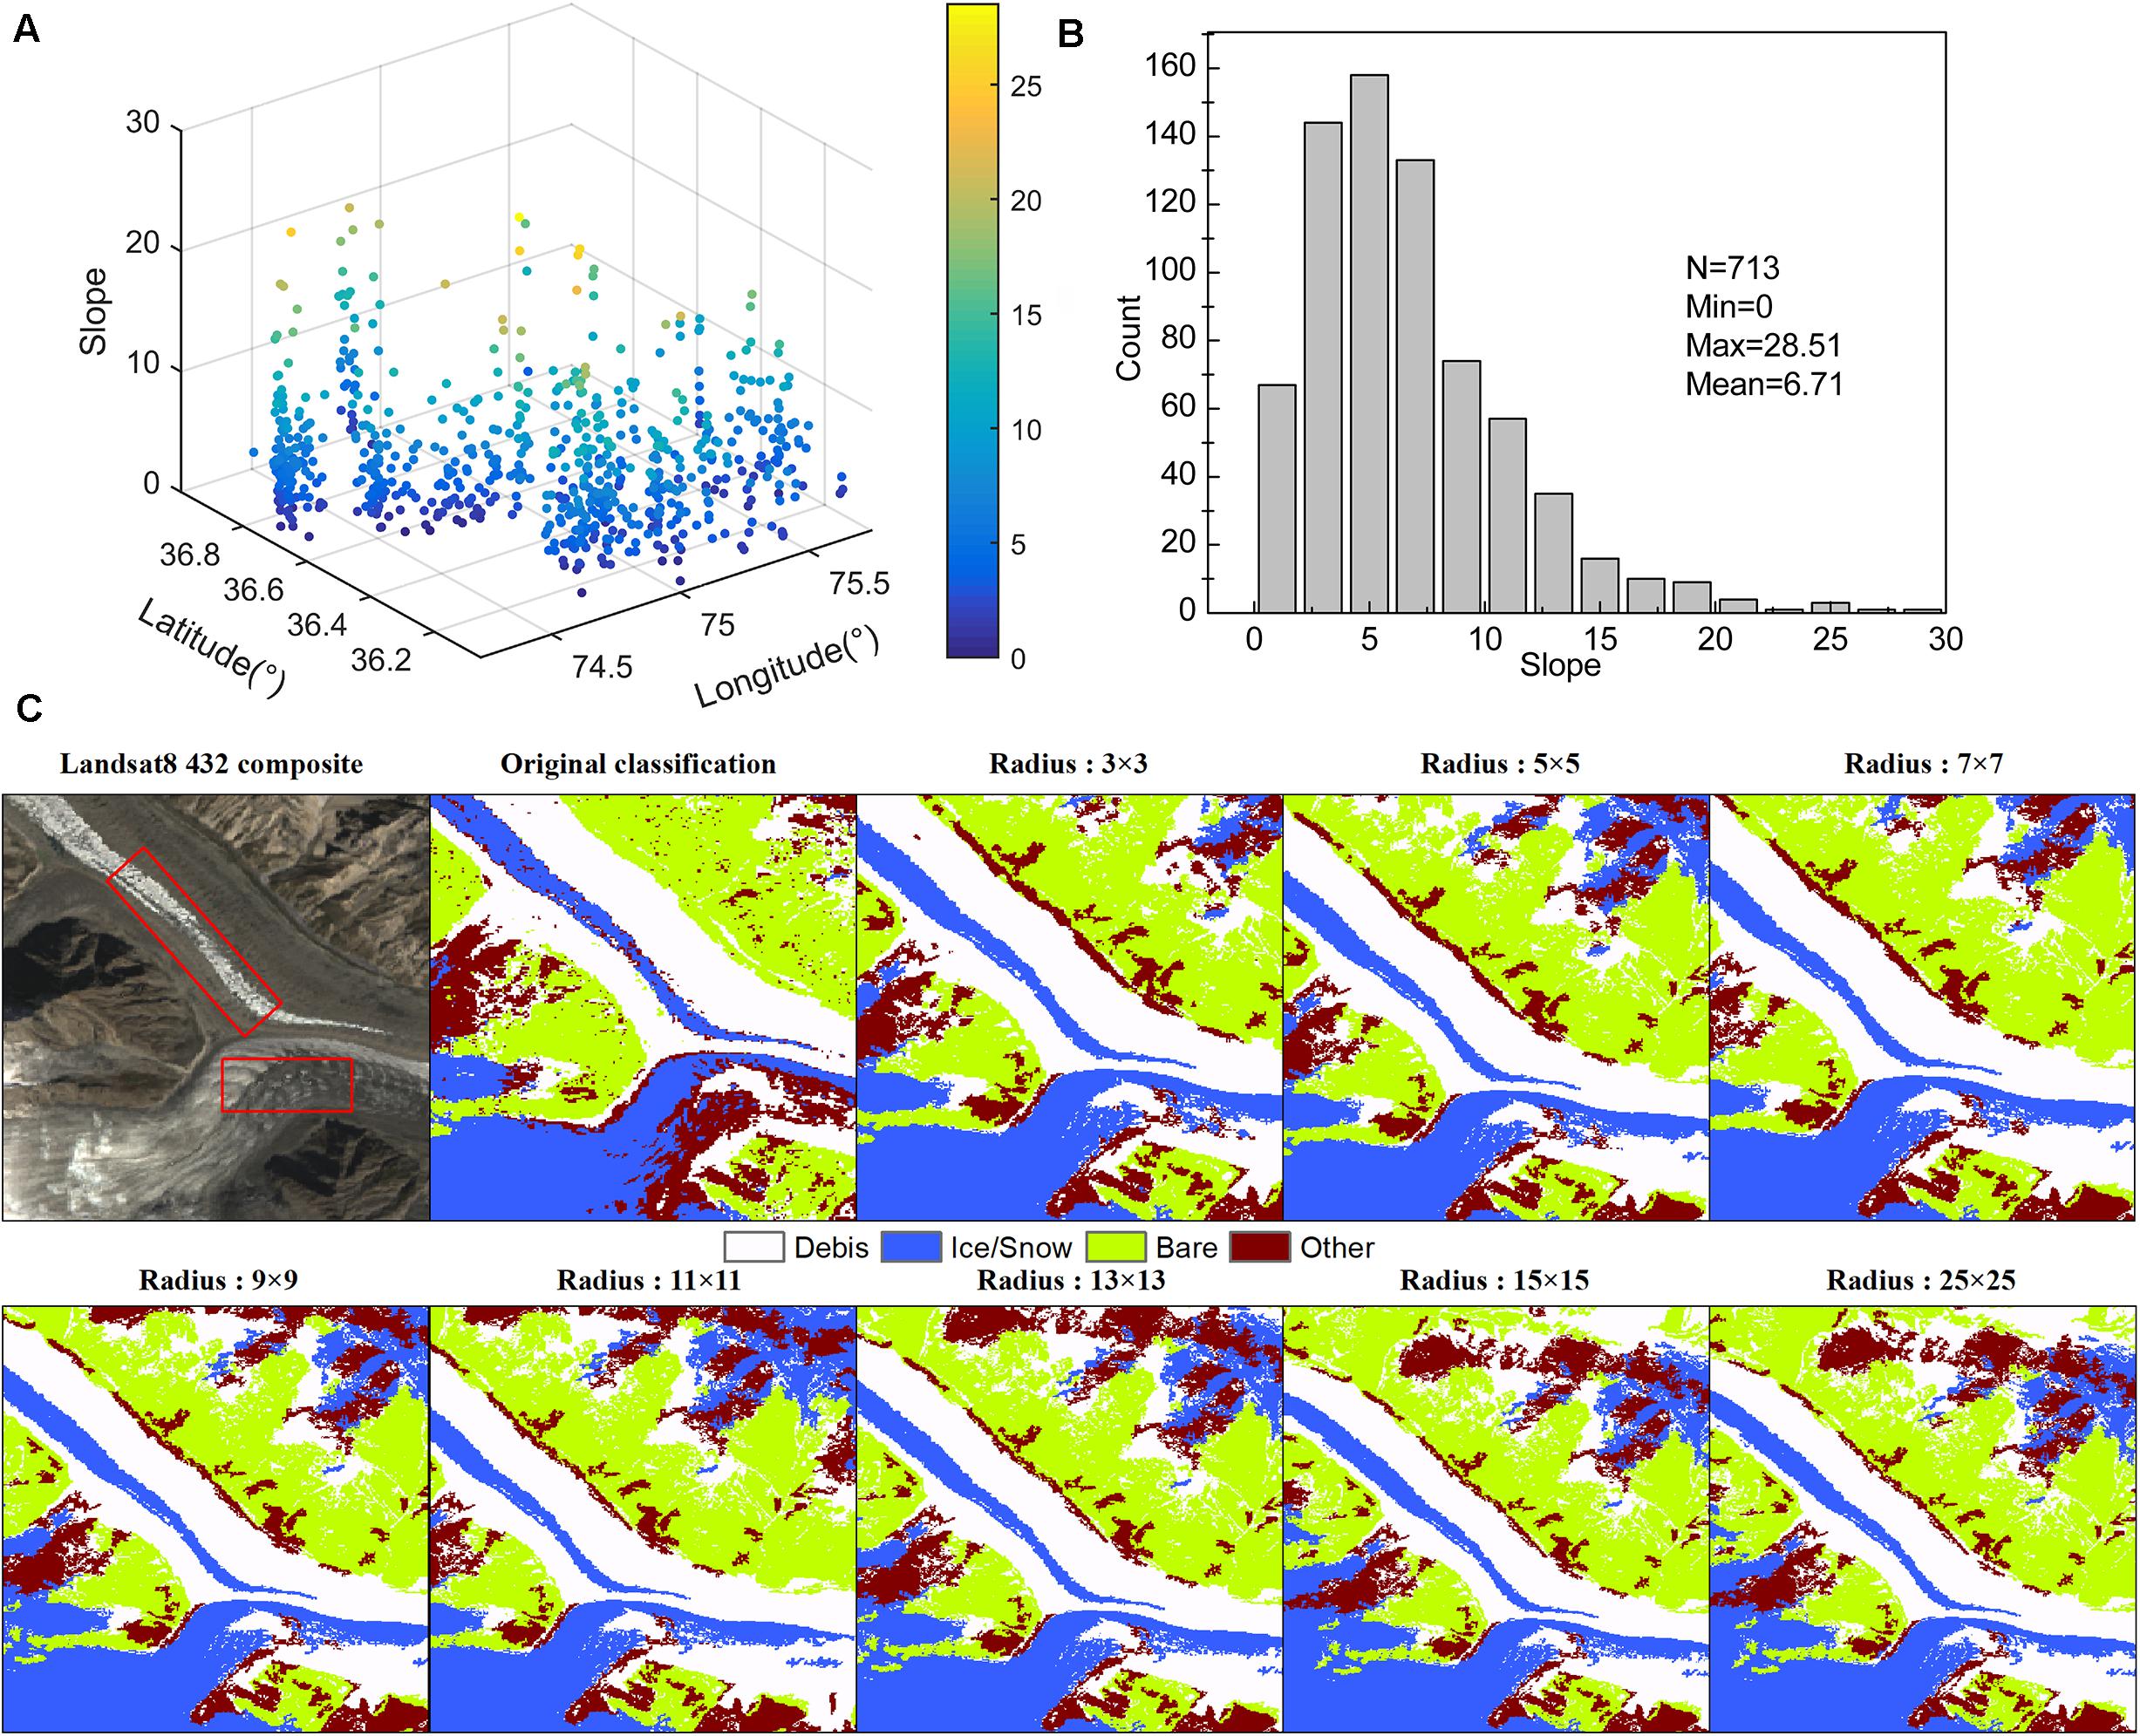
Figure 3. (A) 3D distribution of slopes in the debris-covered areas of the glaciers. (B) Histogram of slope statistics. (C) Comparison of removal effects (e.g., red rectangles) under different kernel radius and square kernel types. A 5 × 5 square type and 50 connected pixels were selected for this study.
The “salt-and-pepper” effect is a common noise problem in pixel-based remotely sensed imagery classification, occurring when the same features (adjacent pixels) on the image are divided into different categories. Usually, median or morphological filtering is considered as a method for noise reduction (Serra and Vincent, 1992; Jassim, 2013). To remove this noise (also known as island pixels), we applied a morphological reducer filter to classified images using a custom kernel. We found that a 5 × 5 square kernel, with 50 connected pixels, was the best format for removing this effect, after a comparison of different kernel sizes (kernel radii of 3 × 3, 5 × 5, 7 × 7, 9 × 9, 11 × 11, 13 × 13, 15 × 15, and 25 × 25) (Figure 3C) and types (square, circle, octagon, diamond, cross, and plus) and maximum number of connected pixels (5, 10, 20, 30, 40, 50, 100, 200, 300, 400, 500, and 1000).
Definition of Glacier Outlines
At present, there are several datasets defining glacier outlines of the world including Global Land Ice Measurements from Space (GLIMS) (Raup et al., 2007), RGI (Pfeffer et al., 2014), Glacier Area Mapping for Discharge from the Asian Mountains (GAMDAM) (Nuimura et al., 2015), and the Second Glacier Inventory of China (Liu et al., 2015). In our study, the glacier outlines consisted of clean ice and supra-glacial debris outlines. We automatically extracted the clean ice outlines robustly using the classification algorithm, while relying on the existing RGI 6.0 outlines for the supra-glacial debris outlines, as in previous studies (Mölg et al., 2018; Scherler et al., 2018; Tielidze et al., 2020). For terminus-advancing or retreating glaciers, however, it is not reasonable to use a fixed glacier outline in time series of supra-glacial debris mapping. Therefore, we manually improved the RGI 6.0 outlines by visually interpreting glacier boundaries based on historical images of Landsat, Sentinel-2, and Google Maps, especially for the surging glaciers proposed by Bhambri et al. (2017) (Figure 1) and debris-covered glaciers. A total of six glacial outlines were modified based on the historical images of 1990, 1998, 2014, 2018, and 2019. We found that although the Karakoram contains a large number of surge-type glaciers (Quincey et al., 2011; Bhambri et al., 2017), there were no significant terminus-advancing or retreating glaciers in our study area. Thus, we assumed that the limiting effect of RGI outlines did not affect the dynamic analysis of supra-glacial debris. Nevertheless, there were voids or missing data in the glacier outlines mapped by RF modeling, possibly due to some darker pixels on the glaciers being misclassified, with so much attention being paid to these in the process during “salt and pepper effect” removal. Also, we found that the clean ice/snow automatically mapped by NDSI < 0.4 and Otsu thresholding contained some water pixels located outside the glacier area, so the results were masked using a 500-m buffer of the RGI 6.0 outlines.
Evaluation of Classification Accuracy
We used two methods to assess the accuracy of the classification results. For machine learning, a cross-validation method was used, where the total sample was divided into two parts, and 70% of the sample points from each class were randomly selected to train the model while 30% were withheld to form a validation dataset. Using the validation dataset, a confusion matrix was generated to assess the accuracy of the predictions across the classes, and the overall accuracy through the Kappa coefficient. The confusion matrix prediction versus the validation data based on the RF model and 2019 Landsat 8 OLI image are shown in Table 2. The prediction accuracy of the RF model for different land types exceeded 89%, especially for clean ice/snow with user and producer accuracy of 100%. Therefore, for this study, we used the RF model because it had the greatest accuracy compared with the SVM and CART models. Another evaluation tool is the “round robin” method proposed by Paul et al. (2017), which is based on multiple manual digitizations. Based on high-resolution Sentinel-2 and Google Earth images, we selected three glaciers (Kukki Jerab, Virjerab, and Yashkuk Yaz) and performed manual digitization five times, using the average value for evaluating the automatically derived extent and standard deviation for digitization accuracy. Table 3 shows the debris-covered area on three debris-covered glaciers derived by machine learning algorithms and by manual digitization.
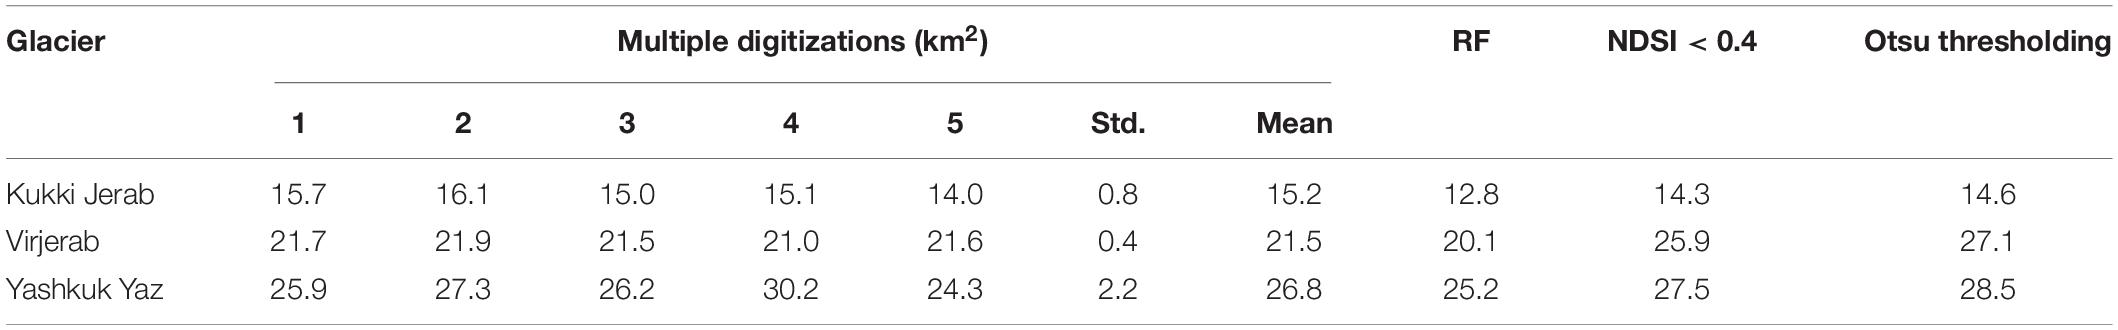
Table 2. Comparison of debris cover area values (2019) derived from automatic extraction algorithms and manual digitization.
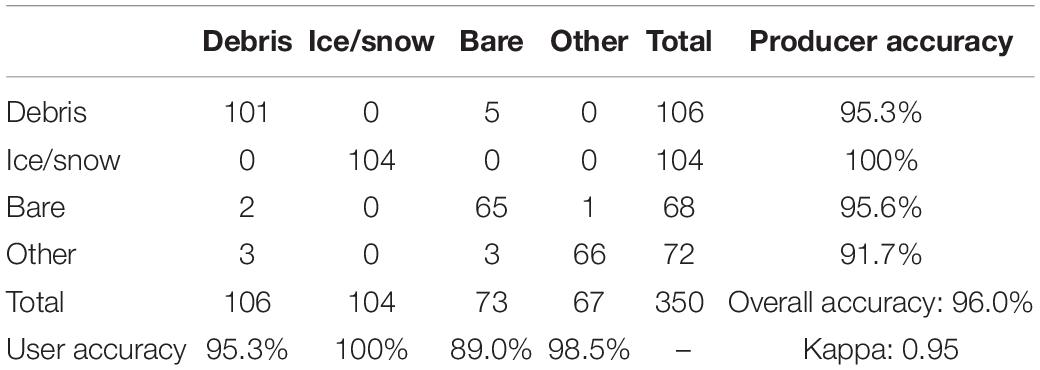
Table 3. Confusion matrix for random forest model classification in 2019 [model prediction (top) and validation data (left)].
Results
Changes in Supra-Glacial Debris Cover From 1990 to 2019
Overall, the supra-glacial debris-covered area in the Hunza Valley showed a trend of slowly increasing from 1990 to 2019. This increasing trend has been seen in other major glaciers during the same period, as indicated in Figure 4. Considering the accuracy of the RF model for satellite data acquired at different times, the Kappa coefficient of the RF model was within a range of 0.92–0.96 (0.94 ± 0.01), the overall accuracy was 95.5 ± 0.9, and the estimated debris coverage was 410.9 ± 25.9 km2. The debris cover estimated by the Otsu thresholding method was 559.1 ± 23.4 km2, with an optimized threshold of 0.53 ± 0.04. The NDSI < 0.4 method gives a value of 487.1 ± 16.9 km2. The detailed estimates of supra-glacial debris cover are shown in Table 4 and Figure 5. The total area of supra-glacial debris cover in the Hunza Valley has expanded by about 8.1–21.3% from 1990 to 2019. In comparing the estimated values from the three methods, we found that those based on Otsu thresholding were the largest, followed by the NDSI < 0.4 method and the RF model, while the estimated standard deviation based on the RF model was the largest, with a value of 25.9 km2. The results indicated that the supra-glacial debris cover in this region has been expanding slowly since the 1990s, due to an increasing number of clean ice areas being covered by impurities, such as rock and dust, which reduce the albedo, resulting in a debris-covered ice classification.
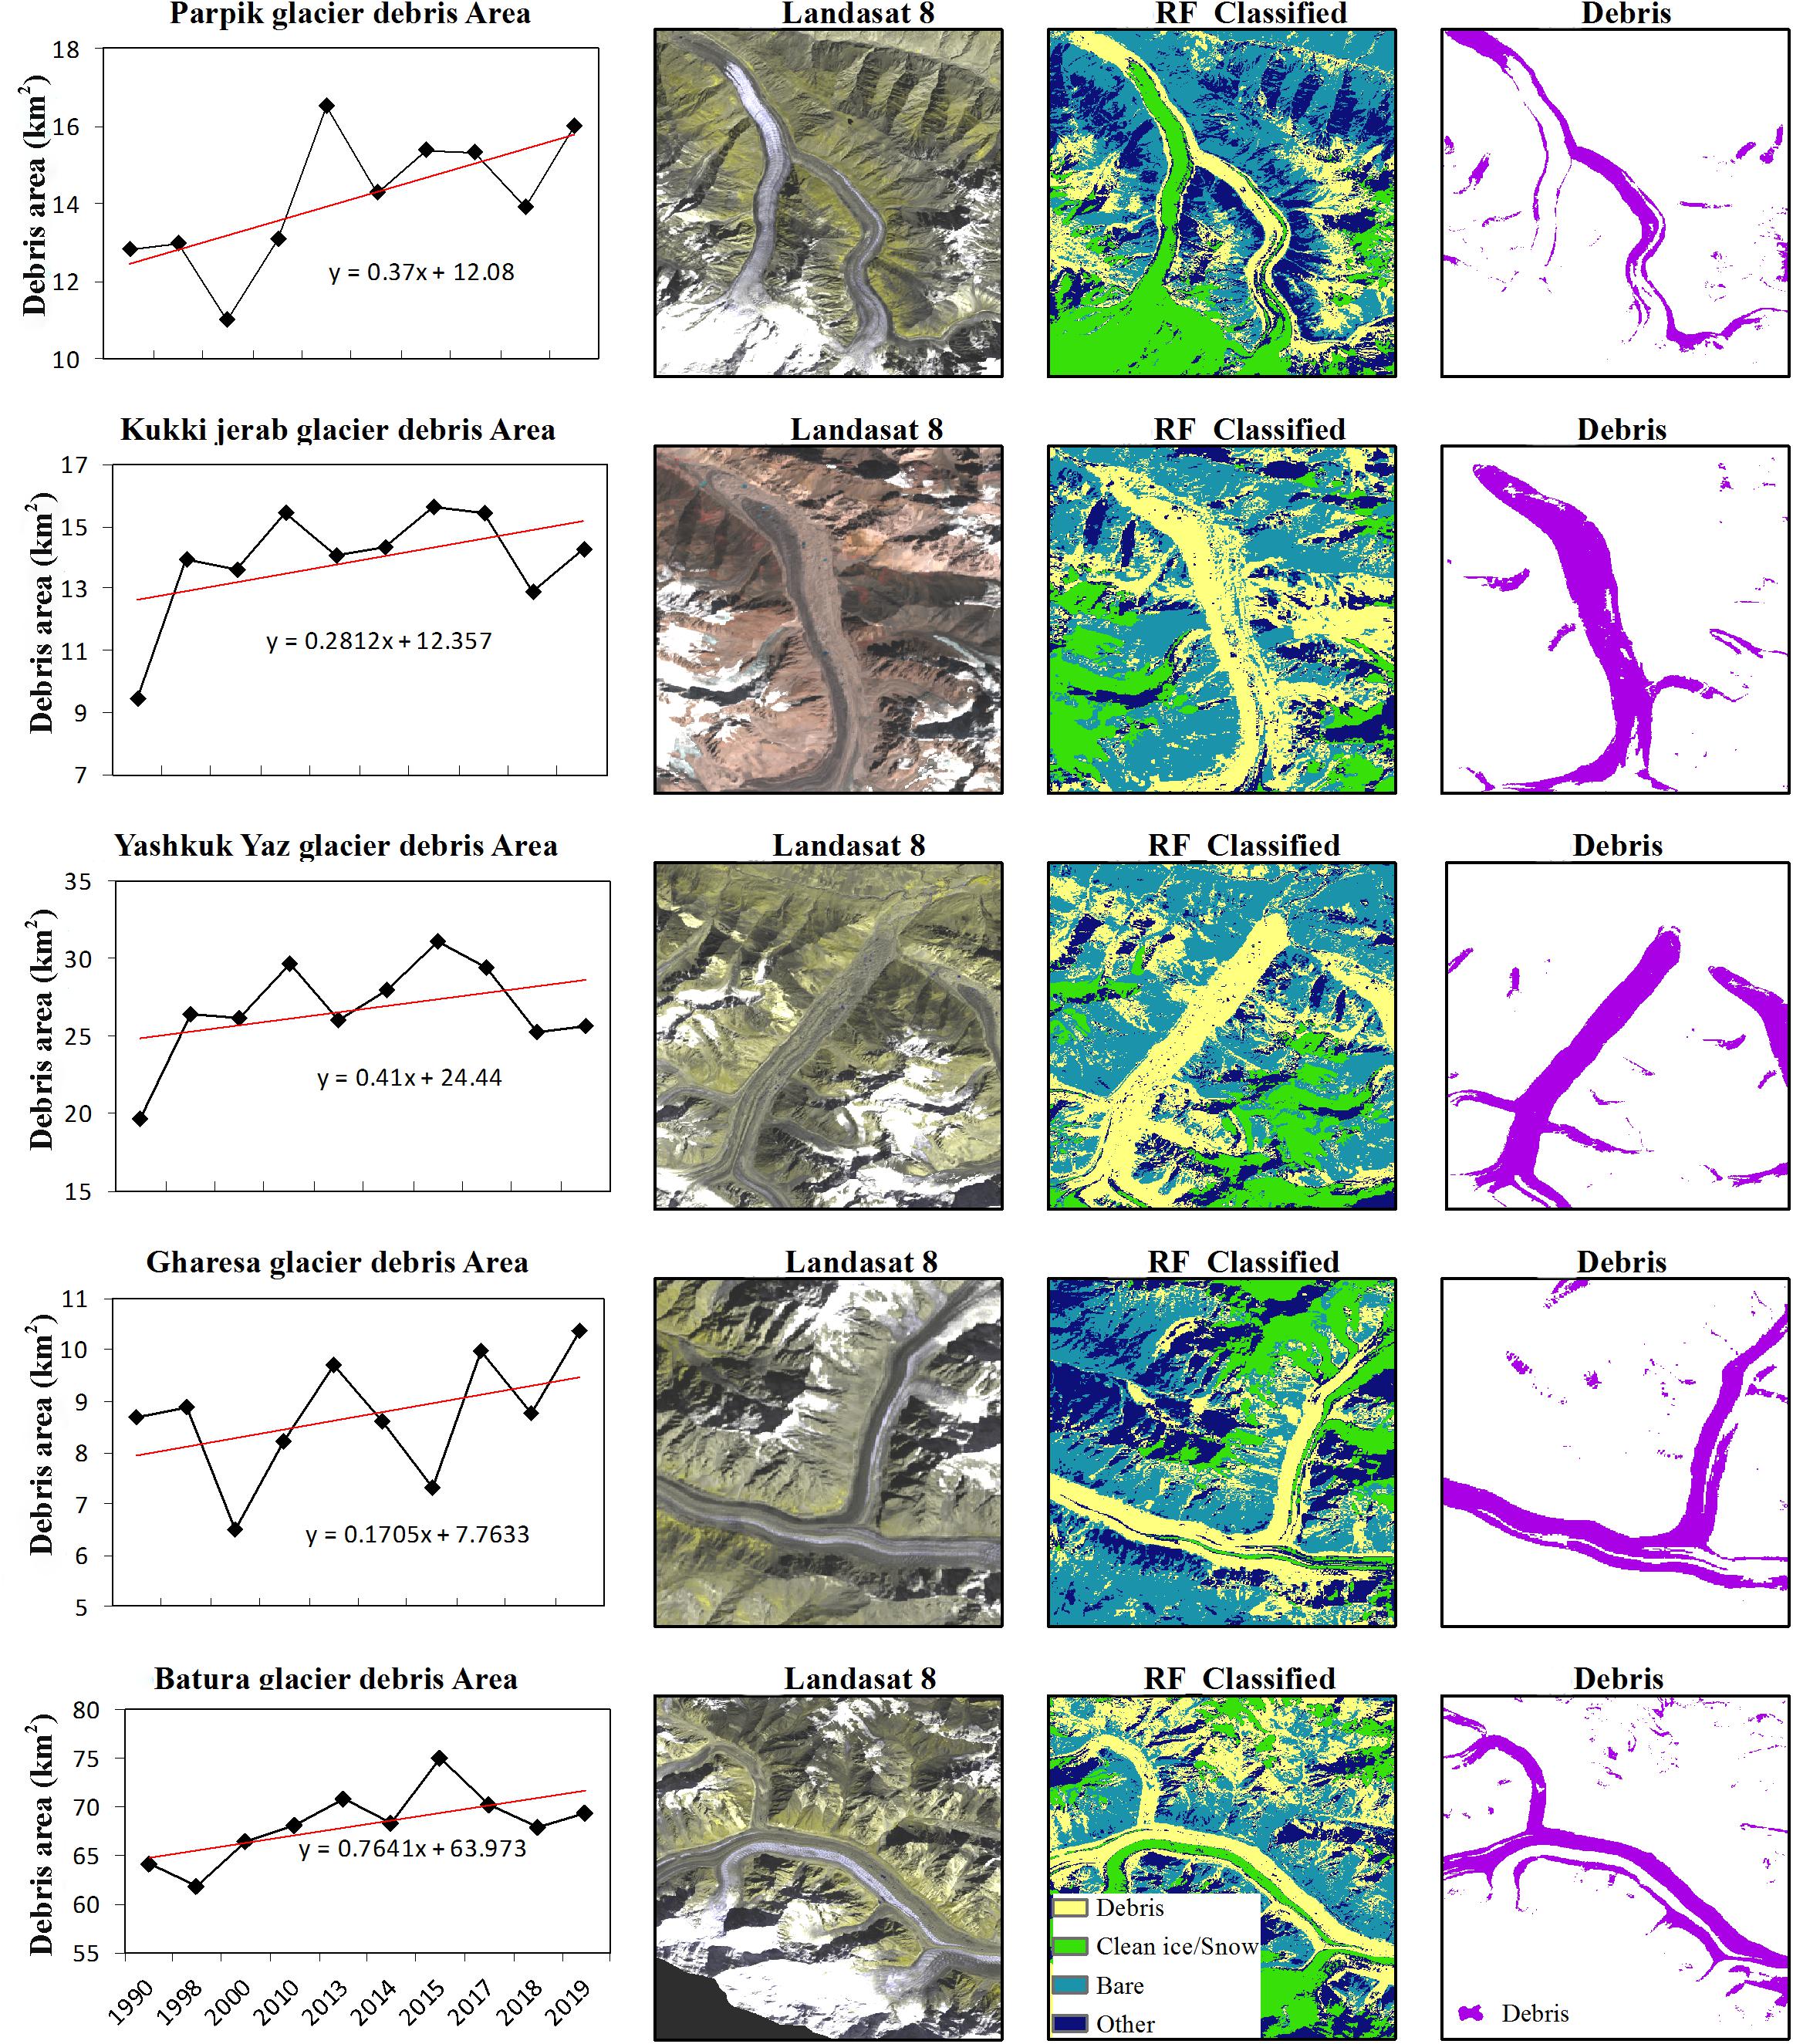
Figure 4. RF-classifier-based supra-glacial debris mapping of five typical debris-covered glaciers. Column 1 (left) illustrates the variation curves for the supra-glacial debris area, indicating the expansion of supra-glacial debris cover from 1990 to 2019. The next columns show examples of supra-glacial debris extraction for each glacier, including the Landsat 8 OLI image from 2019 (Column 2), the RF classified results (Column 3), and the debris extent passed through post-classification processing (Column 4).
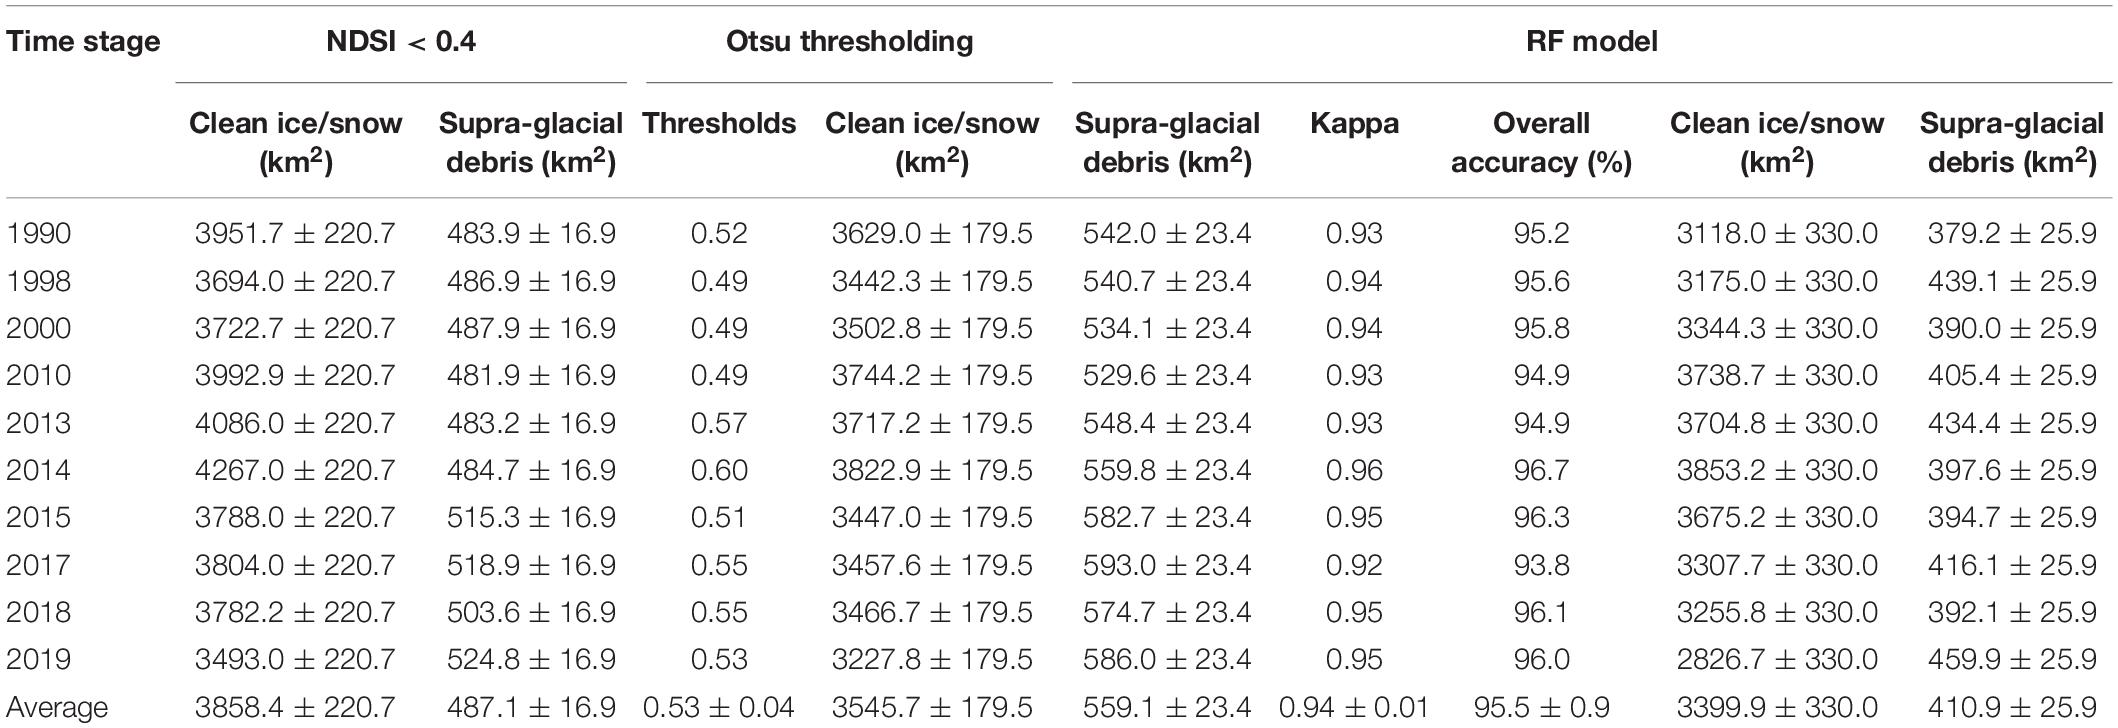
Table 4. Debris cover area change in Hunza valley between 1990 and 2019.
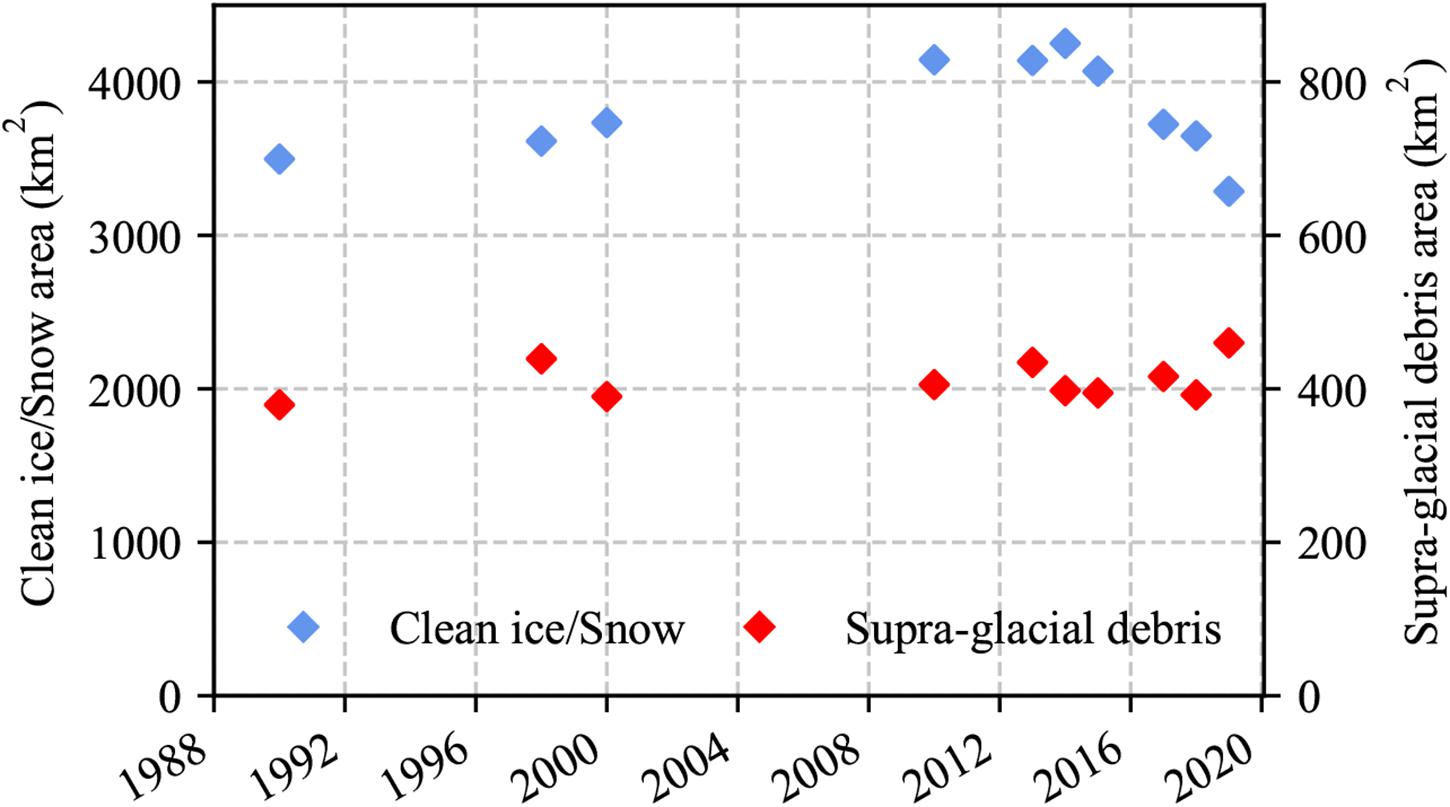
Figure 5. Time-varying trend of the clean ice/snow and supra-glacial debris area estimated by the random forest model.
In order to further explore the variations in supra-glacial debris cover, we drew the spatial distribution of supra-glacial debris in the Hunza Valley from 1990 to 2019 using spatial overlay analysis, as shown in Figure 6A. The supra-glacial debris has migrated up-glacier, and the main area of change is located in the middle and upper regions of the glacier, close to the altitude of the equilibrium line (4,500–5,500 m a.s.l.). The variation in debris on the slopes showed a normally skewed distribution, with ∼60% of the variation in coverage being located in the area below a slope of 10° (Figure 6B). The maximum variation in supra-glacial debris was at an altitude of 5,000 m a.s.l. (Figure 6C) and with a northeast aspect. Also, We mapped the distribution of supra-glacial debris and clean ice/snow cover in the Hunza Valley at elevation gradient and aspect based on the estimation results by RF model on images acquired in 2019. More than 78% of the clean ice/snow area lies higher than 5,500 m a.s.l., while about 80% of the debris-covered ice was distributed between 4,000 and 5,000 m a.s.l. The median elevations were approximately 5,365 m for clean ice/snow and 4,075 m for debris-covered ice (Figure 7A). The median elevation of glaciers is 5,230 m a.s.l., which is sometimes referred to as the equilibrium line altitude of glaciers in the Hunza basin (Qureshi et al., 2017). This means that supra-glacial debris is extensively distributed in the lower part of the ablation area of glaciers. Most glaciers have a north (N) and northeast (NE) aspect, accounting for 38.7% of the glaciers’ area, with only a few glaciers having a west-facing aspect (Figure 7B).
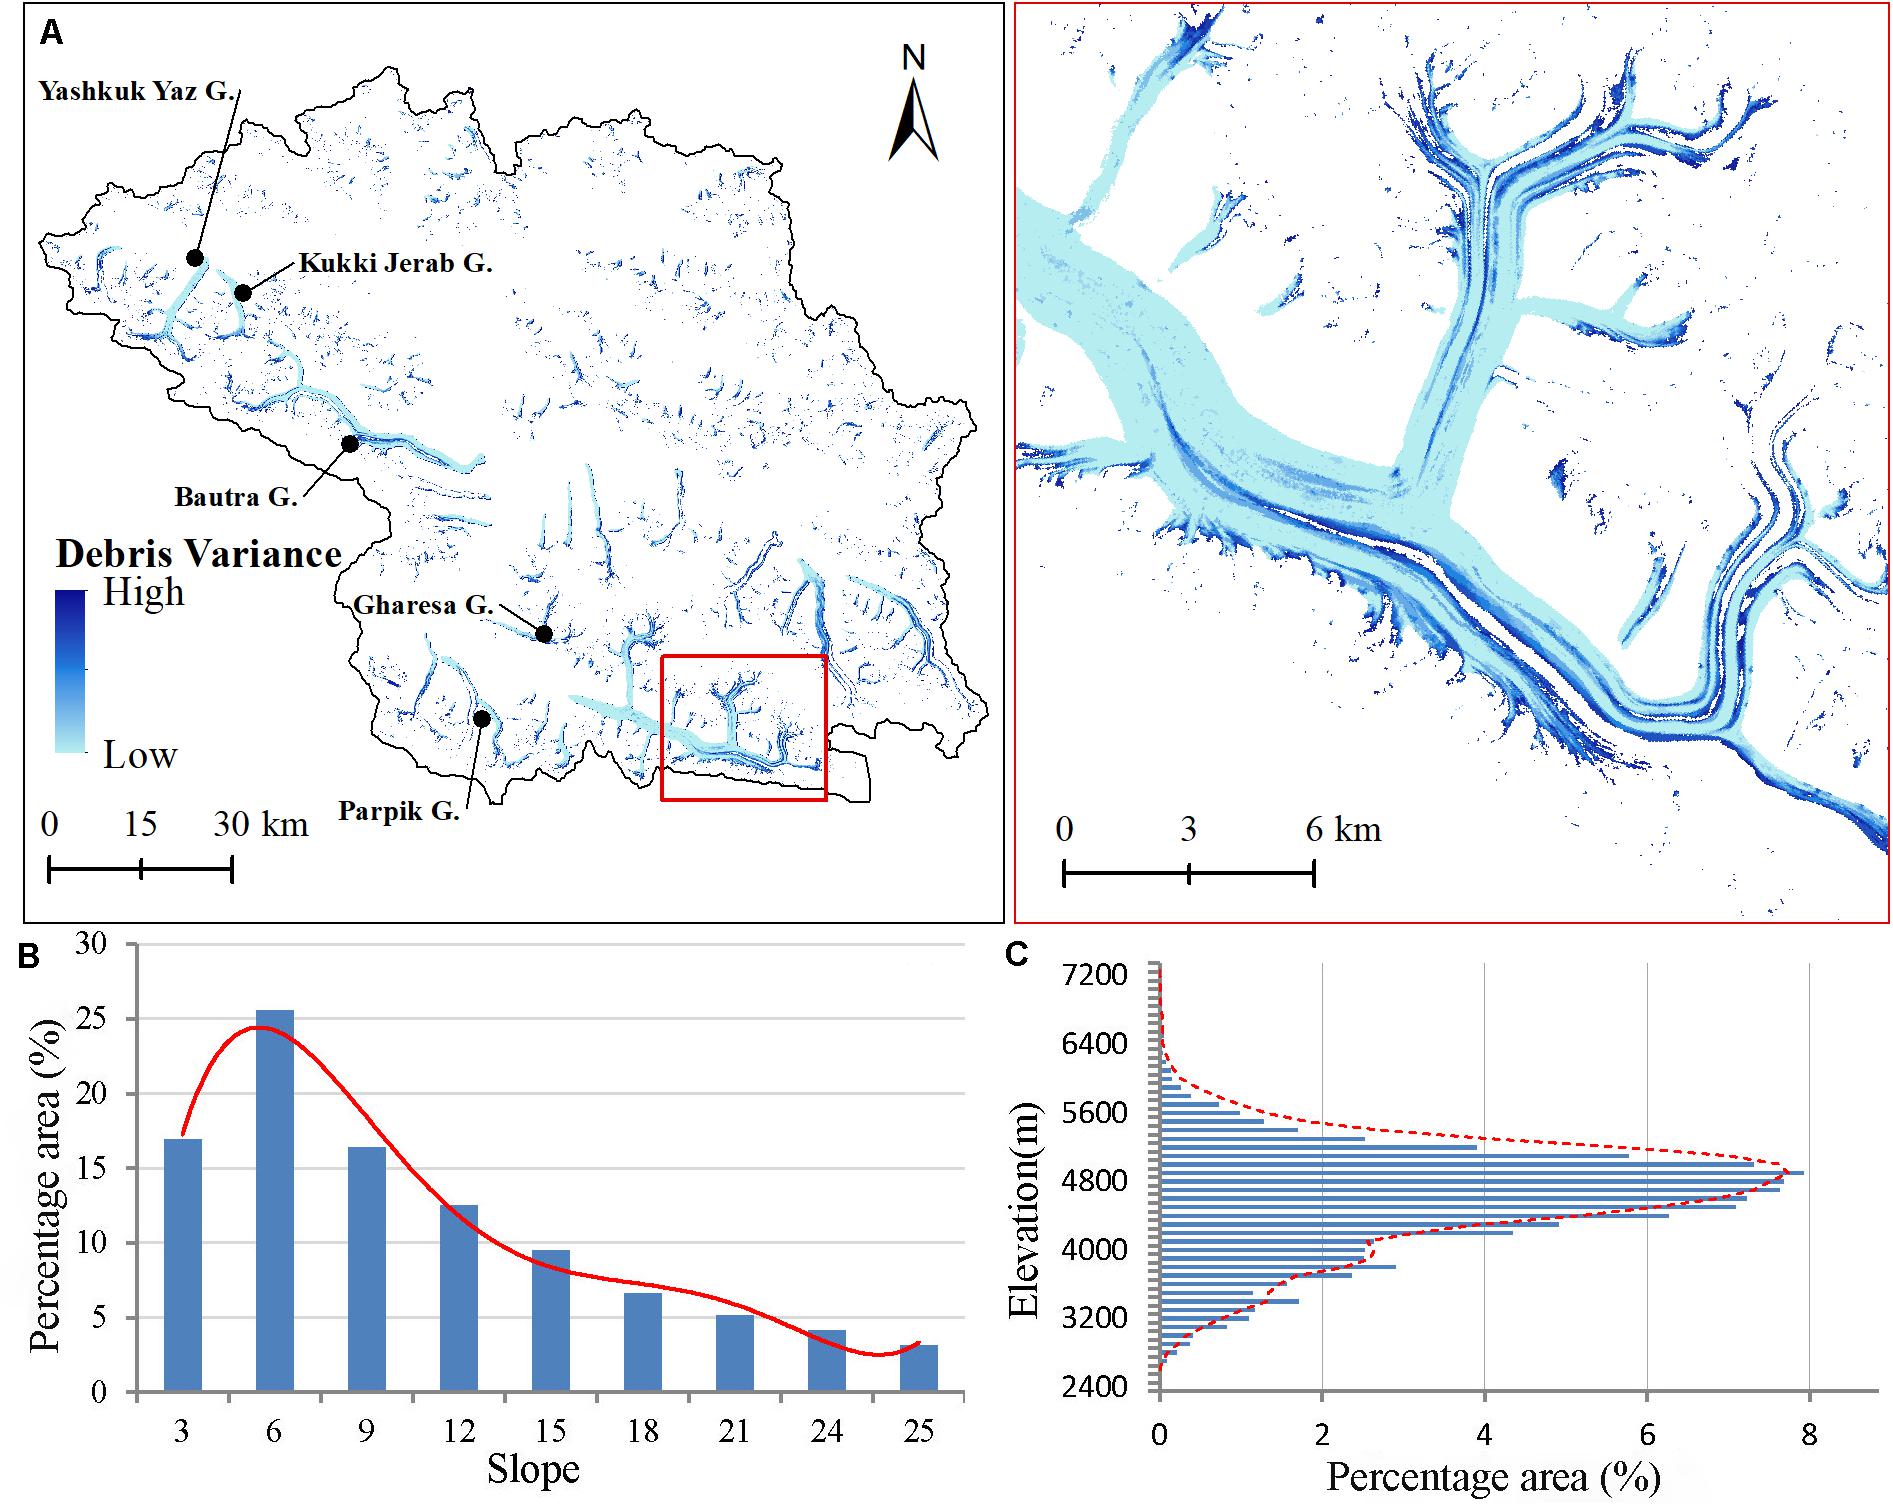
Figure 6. (A) Spatial distribution of supra-glacial debris cover variance from 1990 to 2019. (B,C) Variations in supra-glacial debris cover area (%) at different slopes and for different elevations, respectively.
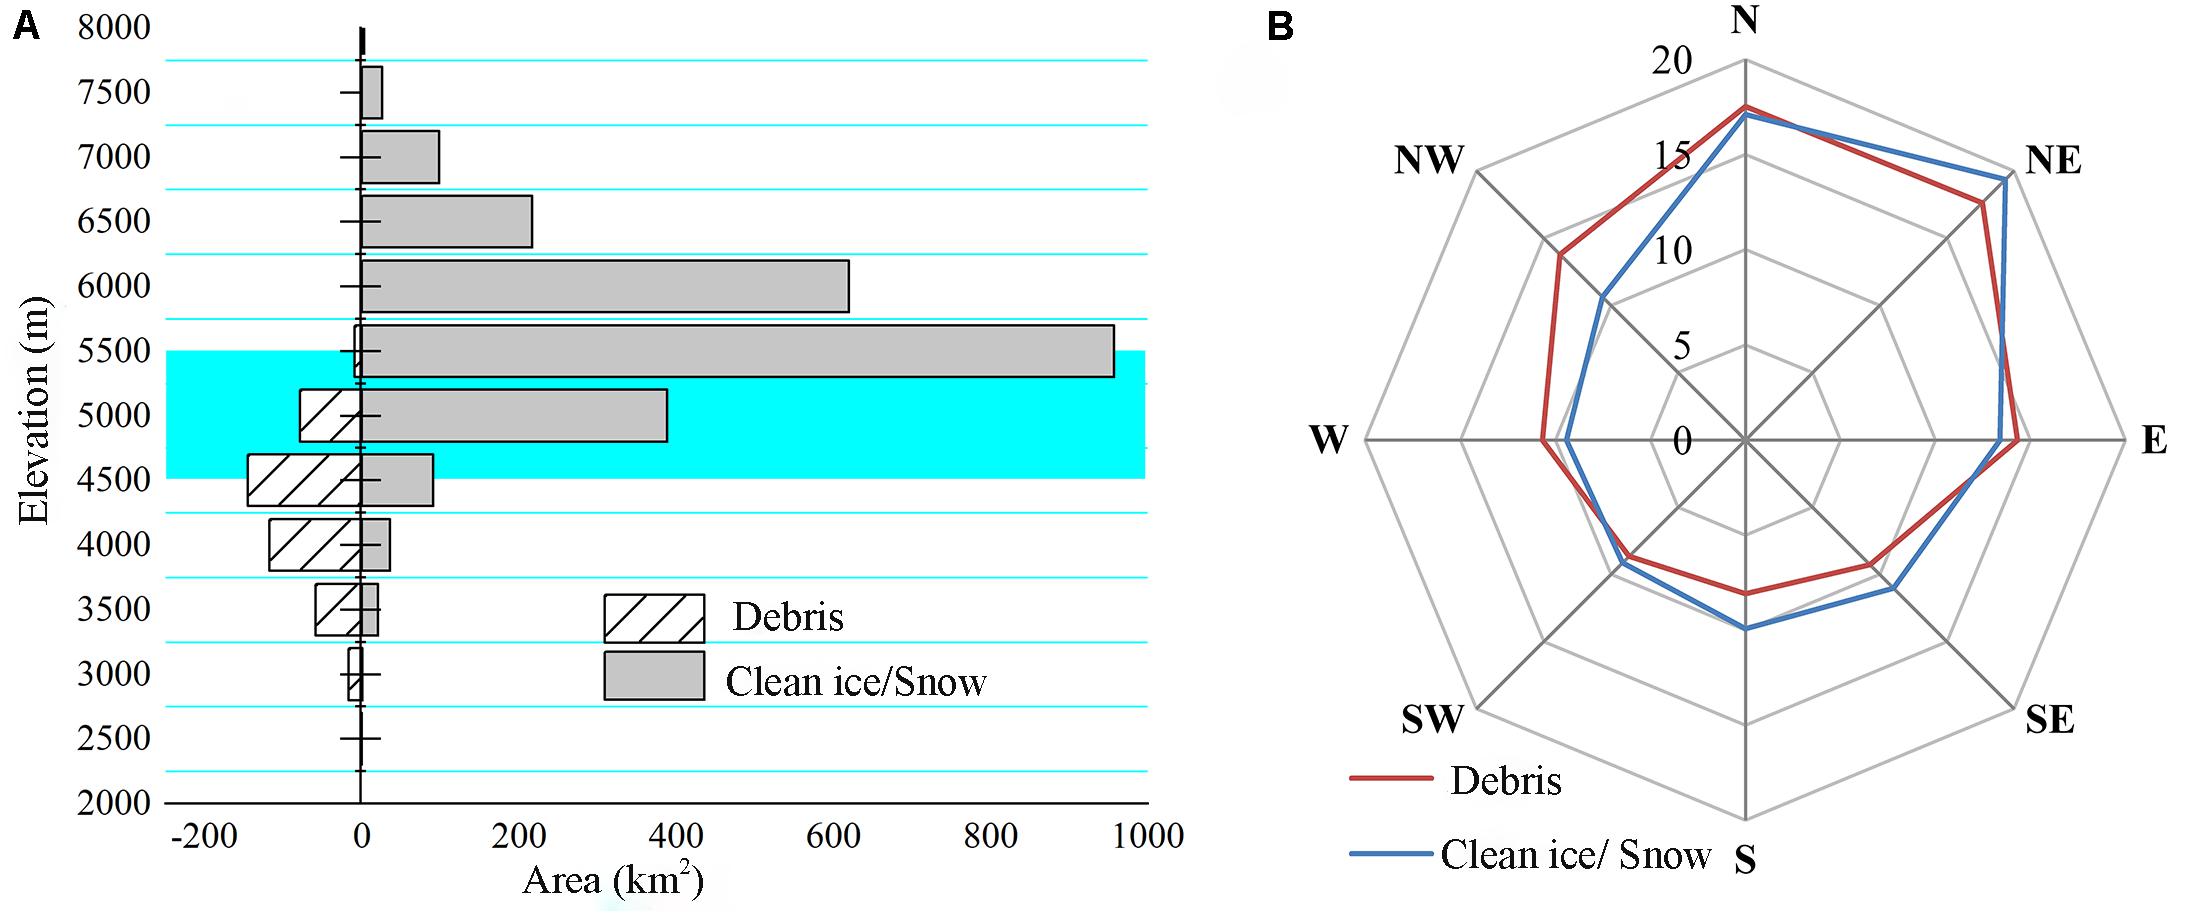
Figure 7. (A) Distribution of supra-glacial debris and clean ice/snow areas by altitude, based on the 2019 random forest model classified result. The light blue area represents the equilibrium-line altitude of glaciers in the Hunza Valley (4,500–5,500 m a.s.l.). (B) Percentage of supra-glacial debris and clean ice/snow distribution by aspect.
Status of Glaciers in the Hunza Valley
Over the past 30 years, the glacier area in the Hunza Valley has shown a downward trend. The glacier area estimated by the NDSI < 0.4, Otsu thresholding, and the RF model is 4,355.5 ± 210.2 km2, 4,104.8 ± 167.6 km2, and 3,810.8 ± 321.7 km2, respectively. The clean ice/snow and supra-glacial debris areas of the Hunza Valley for the years 1990, 1998, 2000, 2010, 2013, 2014, 2015, 2017, 2018, and 2019 are included in Table 4 and Figure 5. The results presented in this study indicate a 9.311.6% decrease in clean ice/snow area in this region between 1990 and 2019. This decrease may be due to the retreat of glaciers and the overall expansion of debris-covered areas on glaciers (8.1–21.3%). According to the estimates from the RF model, the total glacier area of the Hunza Valley was 3,497.1 km2 in 1990 and 3,286.6 km2 in 2019. Overall, there was a 6.0% decrease in glacier area from 1990 to 2019.
Discussion
Uncertainty Analysis
Uncertainty, including that stemming from measurement errors, models, and scale effects, is an important step in validating the mapping results of supra-glacial debris. In this study, the quality of the satellite imagery was the most important factor, as this directly determined the classification results, especially in the high mountain areas with clouds and steep terrain. To exclude the impact of fresh snow, images from previous and subsequent years were used for some periods when there were few cloud-free images, such as in 2010, and this may inevitably have added to the uncertainty. Besides, the uncertainty mainly stemmed from the ground observational data (such as the counts and spatial distribution of the samples for the machine learning model), the classification methods, including the model types, the selected feature variables, model parameters or thresholds, and the postprocessing process. We analyzed this uncertainty from the following two aspects.
Uncertainties in Mapping Glacier Outlines
Uncertainty of supra-glacial debris extraction is a major source of uncertainty in mapping glacier outlines compared with the uncertainty from the extraction of the clean ice/snow part. The mapping uncertainty for the clean-ice areas was mainly affected by the seasonal snow cover. Seasonal snow cover has a greater impact on small glaciers, and the uncertainty may exceed 50% or even more (Mölg et al., 2018). From 2010 to 2014, the clean ice/snow area estimated by the three methods was on the high side, which may be caused by seasonal snow cover. In addition, we compared the glacier area estimated by Mölg et al. (2018), hereafter called the Mölg dataset, with our inventory to determine the main differences between them. The RF-based classification accuracy for clean ice/snow was 100% with an estimated glacier area of 3,810.8 ± 321.7 km2, which is ∼6% larger than the Mölg dataset (3,617.1 km2). The glacier area estimated by NDSI < 0.4 and Otsu thresholding tended to be overestimated, being 738.4 km2 and 487.8 km2 higher than the Mölg dataset, respectively. Unfortunately, there were still voids or missing data in the glacier outlines mapped by the RF model, which also lead to the underestimation of glacier area in some years.
Uncertainties in Mapping Supra-Glacial Debris
Figure 8A shows that the results from the machine learning algorithms generally had high accuracy, with Kappa coefficients ranging from 0.82 to 0.95. In comparison, the classification accuracy for the SVM model was slightly lower than for the RF model, where the Kappa coefficient was 0.9 and the overall accuracy was 96.0%. The manual digitization for each glacier by five professionals showed decreasing standard deviations from the largest to the smallest glaciers, specifically Yashkuk Yaz (26.8 ± 2.2 km2), Kukki Jerab (15.2 ± 0.8 km2), and Virjerab (21.6 ± 0.4 km2) glaciers. The linear fit between the mean of the digitizations and the automatic estimates indicated that all the machine learning algorithms could produce results close to reality but that the RF model was better than the other two, in terms of the determination of an R2 coefficient of 0.99 for the RF model, 0.87 for the NDSI <0.4 method and 0.86 for the Otsu thresholding algorithm (Figure 8B).
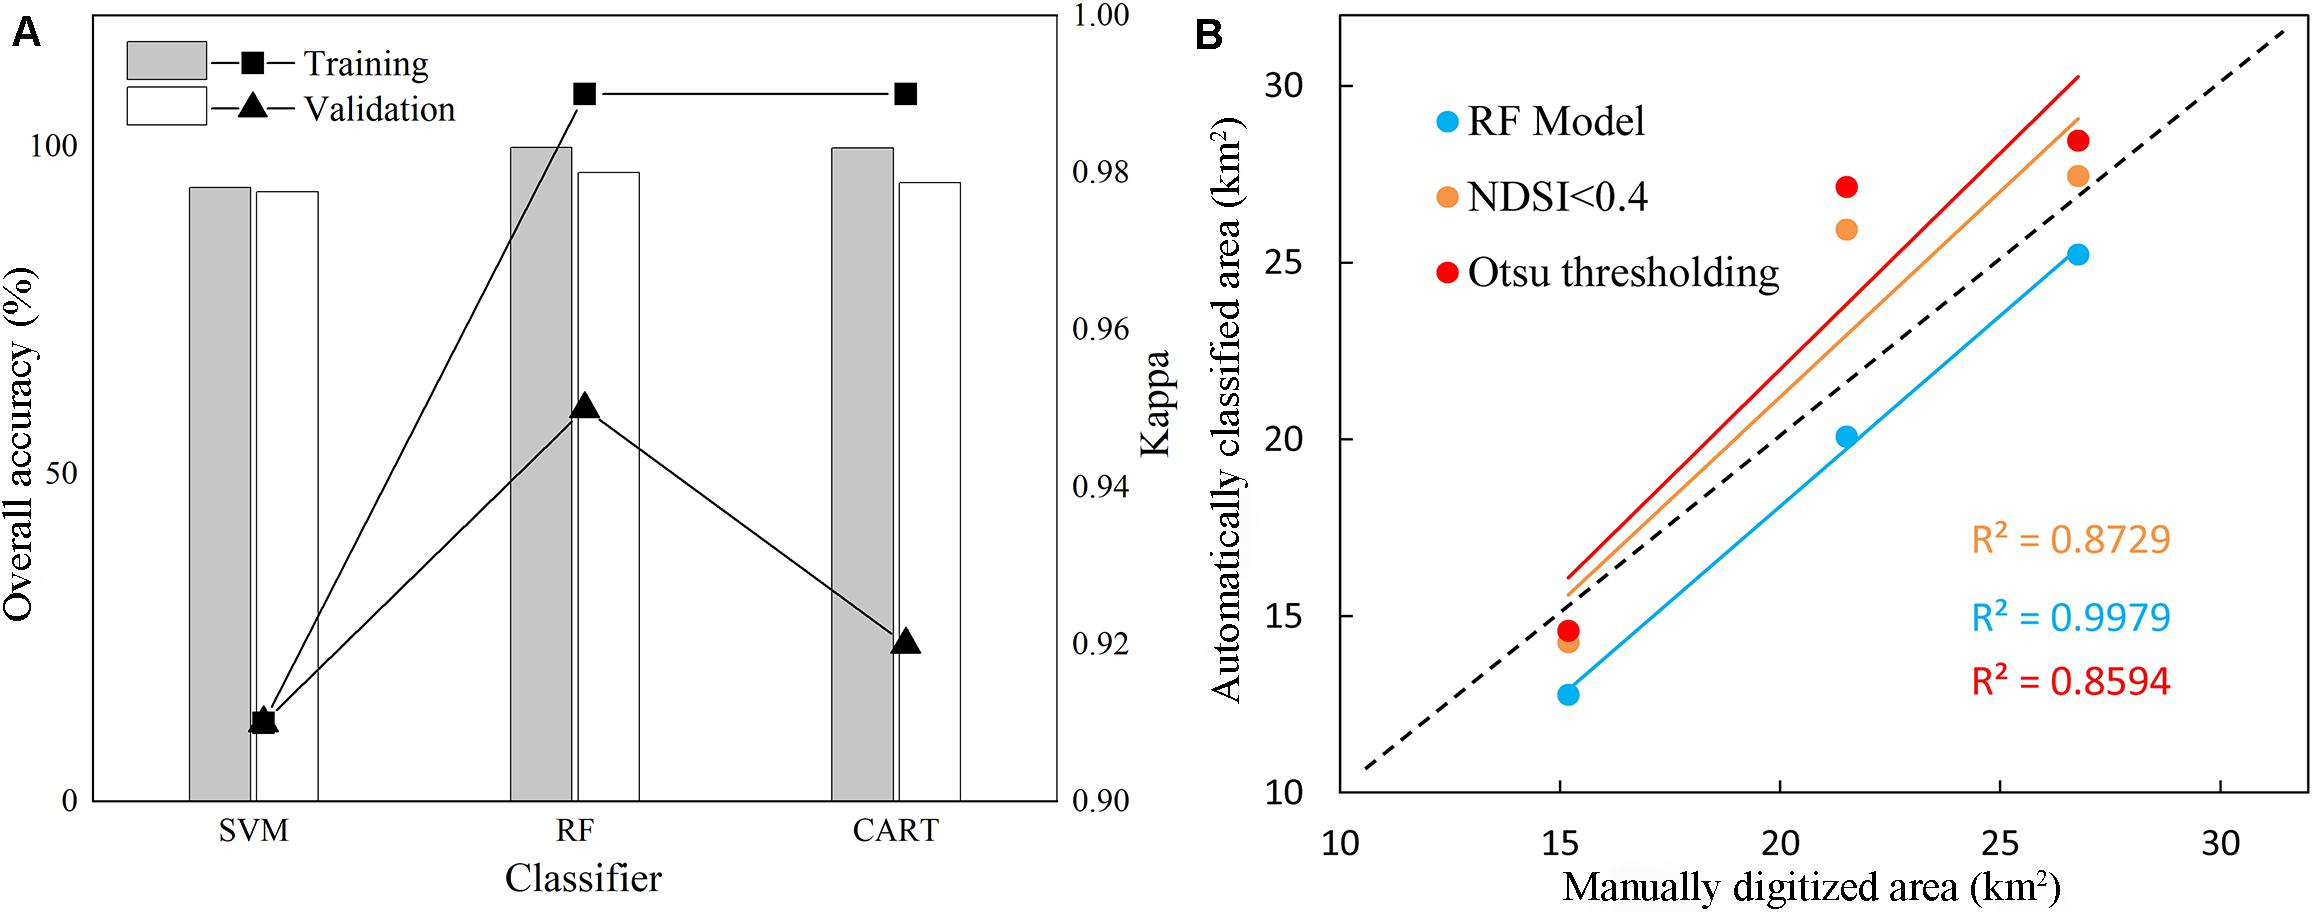
Figure 8. (A) Model accuracy of three machine-learning algorithms (the bar plot shows the overall accuracy; the lines link the Kappa coefficients). (B) Linear fit of estimated values to manually digitized values. The black dashed line represents the 1:1 line.
As shown in the results, there were differences in the supra-glacial debris cover area estimated by the three methods, with the Otsu thresholding tending to overestimate the debris coverage, while the RF model gave the smallest estimated value. To verify the reliability of these estimates, we compared the results with those from other works. For example, the supra-glacial debris area extracted from the 2007 and 2009 ALOS-1 PALSAR-1 coherence images in the Mölg dataset was 583.6 km2, which was larger than the debris area estimated by our study for 2010–481.9 km2 (NDSI < 0.4), 529.6 km2 (Otsu thresholding) and 405.4 km2 (RF model). Another comparative dataset is one obtained by extracting regions with NDSI < 0.4 and clipping them with RGI 6.0 outlines (Scherler et al., 2018), the same as method 2 of this study. In this work, the automatically extracted areas, using Landsat 8 composite images from 2013 to 2017 and Sentinel-2 composite images from 2015 to 2017, were 465.1 and 453.3 km2, respectively. For the same period, the estimated results from the RF model in this study were comparable (408.9 ± 22.2 and 405.4 ± 13.2 km2, respectively). However, the supra-glacial debris results for the NDSI < 0.4 and Otsu thresholding were higher than those of Scherler et al. (2018). It is difficult to evaluate the estimated results from this study in terms of previous results because they derive from different remote sensing data, and the methods used for data processing and classification are different; however, the supra-glacial debris-covered area falls within a reasonable range, in terms of magnitude.
Uncertainty from complex surfaces debris-covered glaciers, such as stagnant ice in glacier tongue areas, cliffs, and ponds on the surfaces of debris-covered areas, and boulders and dirty ice, have extensive effects on pixel-based classification. The supra-glacial ponds or lakes widely distributed on glaciers such as Batura, Hispar, Yashkuk Yaz, and Kukki Jerab frequently emerge or disappear, demonstrating obvious supra-glacial characteristics with time. We used salt-and-pepper-effect removal, as described above, to compare these effects. By comparison, we found that convolution kernel and maximum-connected pixel counts have to be properly decided in order to avoid the removal of correctly classified patches, or vice versa. In this study, a 5 × 5 kernel with 50 connected pixels was used, but this may not have been optimal. The problem of the salt-and-pepper effect is unavoidable in pixel-based classification. Although some studies have pointed out that the object-based classification method can effectively solve this problem and improve the accuracy (Rastner et al., 2014; Robson et al., 2015; Kraaijenbrink et al., 2016; Sahu and Gupta, 2018), its universality and operability on a large scale need to be further considered. Also, the stagnant ice at glacier tongues, such as the Batura and Hispar Glaciers, tend to have thick overlying debris layers with signs of vegetation (shrub) growth on their surfaces. Parts of these regions are classified as non-debris cover regions, which increases the uncertainty of estimating supra-glacial debris coverage, especially for RF models. Vezzola et al. (2016) showed that the number of debris-covered glaciers featuring supra-glacial trees is increasing globally as a response of the alpine environment to climate warming. They found supra-glacial trees present on the Miage Glacier when a debris thickness threshold (≥19 cm) was exceeded, and where there was a gentle slope (≤10°) and a low glacier surface velocity (≤7.0 m yr–1) and where the vertical changes due to glacier dynamics were positive.
Additionally, although the image acquisition time was limited to 200–270 days, there may still be snow cover at high altitude, which is one of the significant uncertainties in mapping debris-covered ice. Due to the annual difference in temperature and precipitation, the melting limits of seasonal snow on the upper part of glaciers in summer are different each year, which may lead to an underestimation of the supra-glacial debris area. Similarly, the effects of shadows and cloud coverage inevitably pose challenges to the mapping of supra-glacial debris.
Characteristics and Possible Causes for Supra-Glacial Debris Cover Changes
Overall, the supra-glacial debris cover migrated up-glacier. Similar patterns of up-glacier migration have also been described for the Zmutt Glacier, Swiss Alps (Mölg et al., 2019) and the Greater Caucasus (Tielidze et al., 2020). Variations in supra-glacial debris cover were mainly observed in the middle and upper parts of the glacier, while the distribution of supra-glacial debris from the lower part to the glacier tongue remained stable. In the middle of the glacier, the area showing the most intensive variation was at the junction between the clean ice and the debris-covered ice. We found that the expansion of debris-cover over clean ice was slow. Due to the characteristics of glacier movements, the spatial distribution of supra-glacial debris cover in the downstream part of the glacier changes with time, while the area changes slightly. This redistribution of the surface moraine is a key factor in the diversification of glacier surface types, and it also changes the debris coverage. Recycled material from lateral moraines may be the source of this debris. As the glacier lowers and the permafrost melts, the lateral moraines become unstable, causing moraine material to fall onto the glacier (Nakawo et al., 1986). Debris eroded from the glacier bed may also be entangled in the ice. The degree of under-ice entrainment mainly depends on the thermal conditions at the base of the glacier and the substrate erodibility.
Previous studies have indicated that the main sources of debris are mass movements such as rockfalls, rock avalanches, debris-laden ice, and snow avalanches from the surrounding slopes (Hambrey et al., 2008). These sudden and sometimes massive debris migration/relocation events are common in alpine areas. For example, between September 1999 and June 2000, a landslide occurred in the upper region of the Batura Glacier, possibly as a result of slope failure. The accumulated rock fragments covered the glacier surface and moved downstream with the glacier ice, following a dynamic change in their shapes and sizes (Figure 9). Such phenomena play a key role in the increase and fluctuation of supra-glacial debris-covered areas.
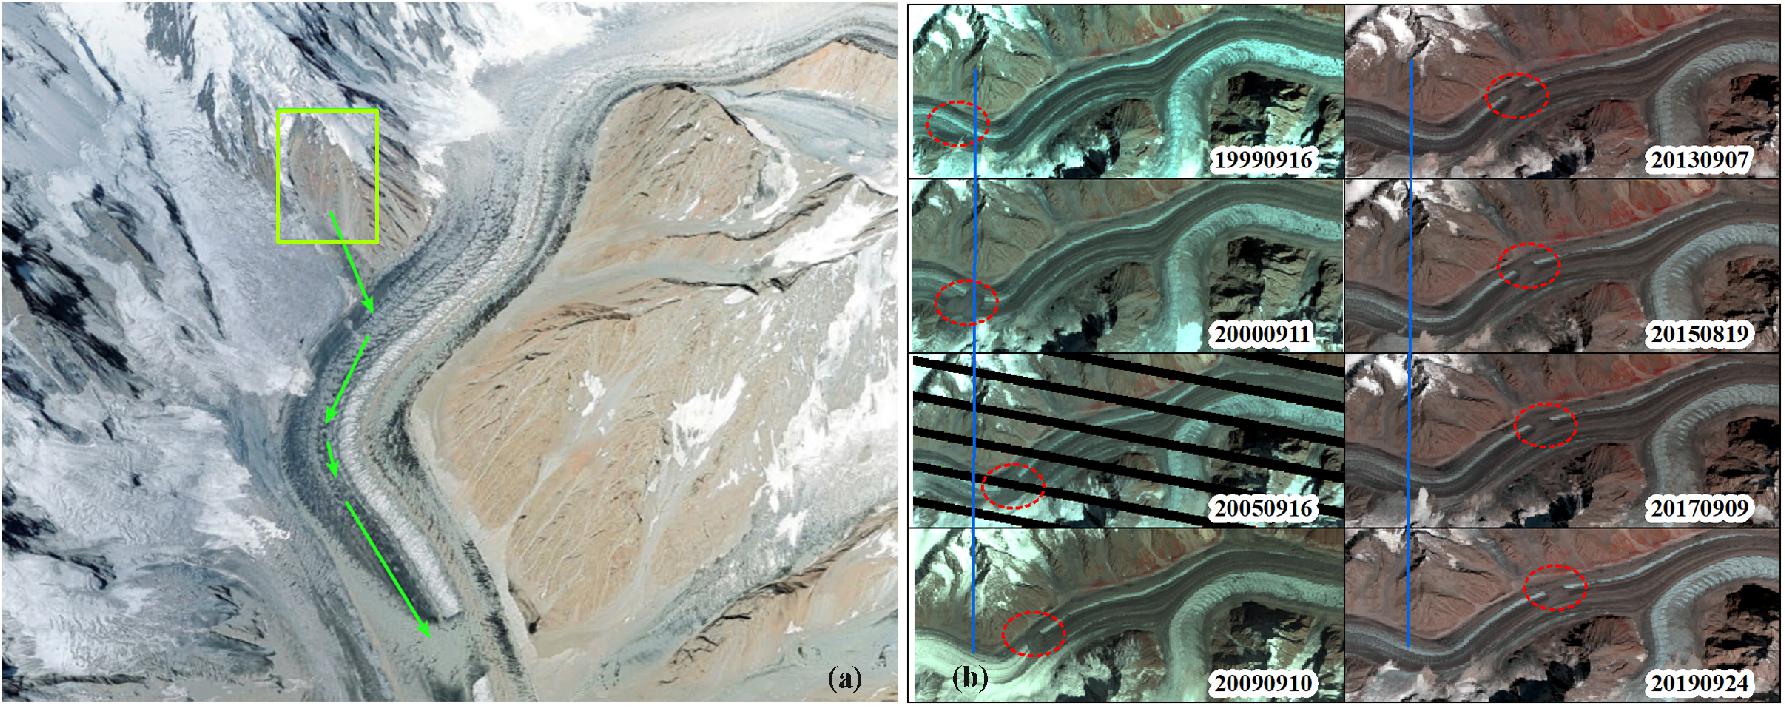
Figure 9. (a) Location of the landslide area (green rectangle), shown on Google Earth images. (b) Emergence of landslide sediments and its position changes on the glacier from 1999 to 2019. The base image is from the Landsat TM, ETM+ and OLI sensors.
Figure 10 shows the hypsometry of the supra-glacial debris coverage, and the five representative debris-covered glaciers, in 1990, 1998, 2010, 2014, and 2019. The zone at 4,500 ∼ 5,500 m a.s.l. displayed the greatest variation in supra-glacial debris (Figure 10A) and is within the altitude equilibrium line zone of glaciers in the Hunza Valley (Scherler et al., 2011; Kaab et al., 2012; Gardelle et al., 2013). These areas have steep topography and are prone to rockfalls and rock avalanches, in which there is an abundant release of supra-glacial debris. The amount of debris reaching a given glacier depends on the characteristics and extent of the catchment area, and especially its weathering and erosion rates (Haeberli et al., 2006). These are also affected by the lithology of the bedrock (Singh et al., 2011). Not all glaciers have experienced an increase in supra-glacial debris cover, with minor changes in supra-glacial debris having been recorded for the Batura, Parpik, and Gharesa glaciers (Figures 10B,C,E), which differ significantly from the obvious increases reported for the Kukki Jerab and Yashkuk Yaz glaciers (Figures 10D,F), especially between 1990 and 1998. In addition to subjective factors, the apparent increase in supra-glacial debris cover on Kukki Jerab and Yashkuk Yaz glaciers is mainly attributed to the evolution of ice ponds and cliffs and the upward expansion of surface moraines.
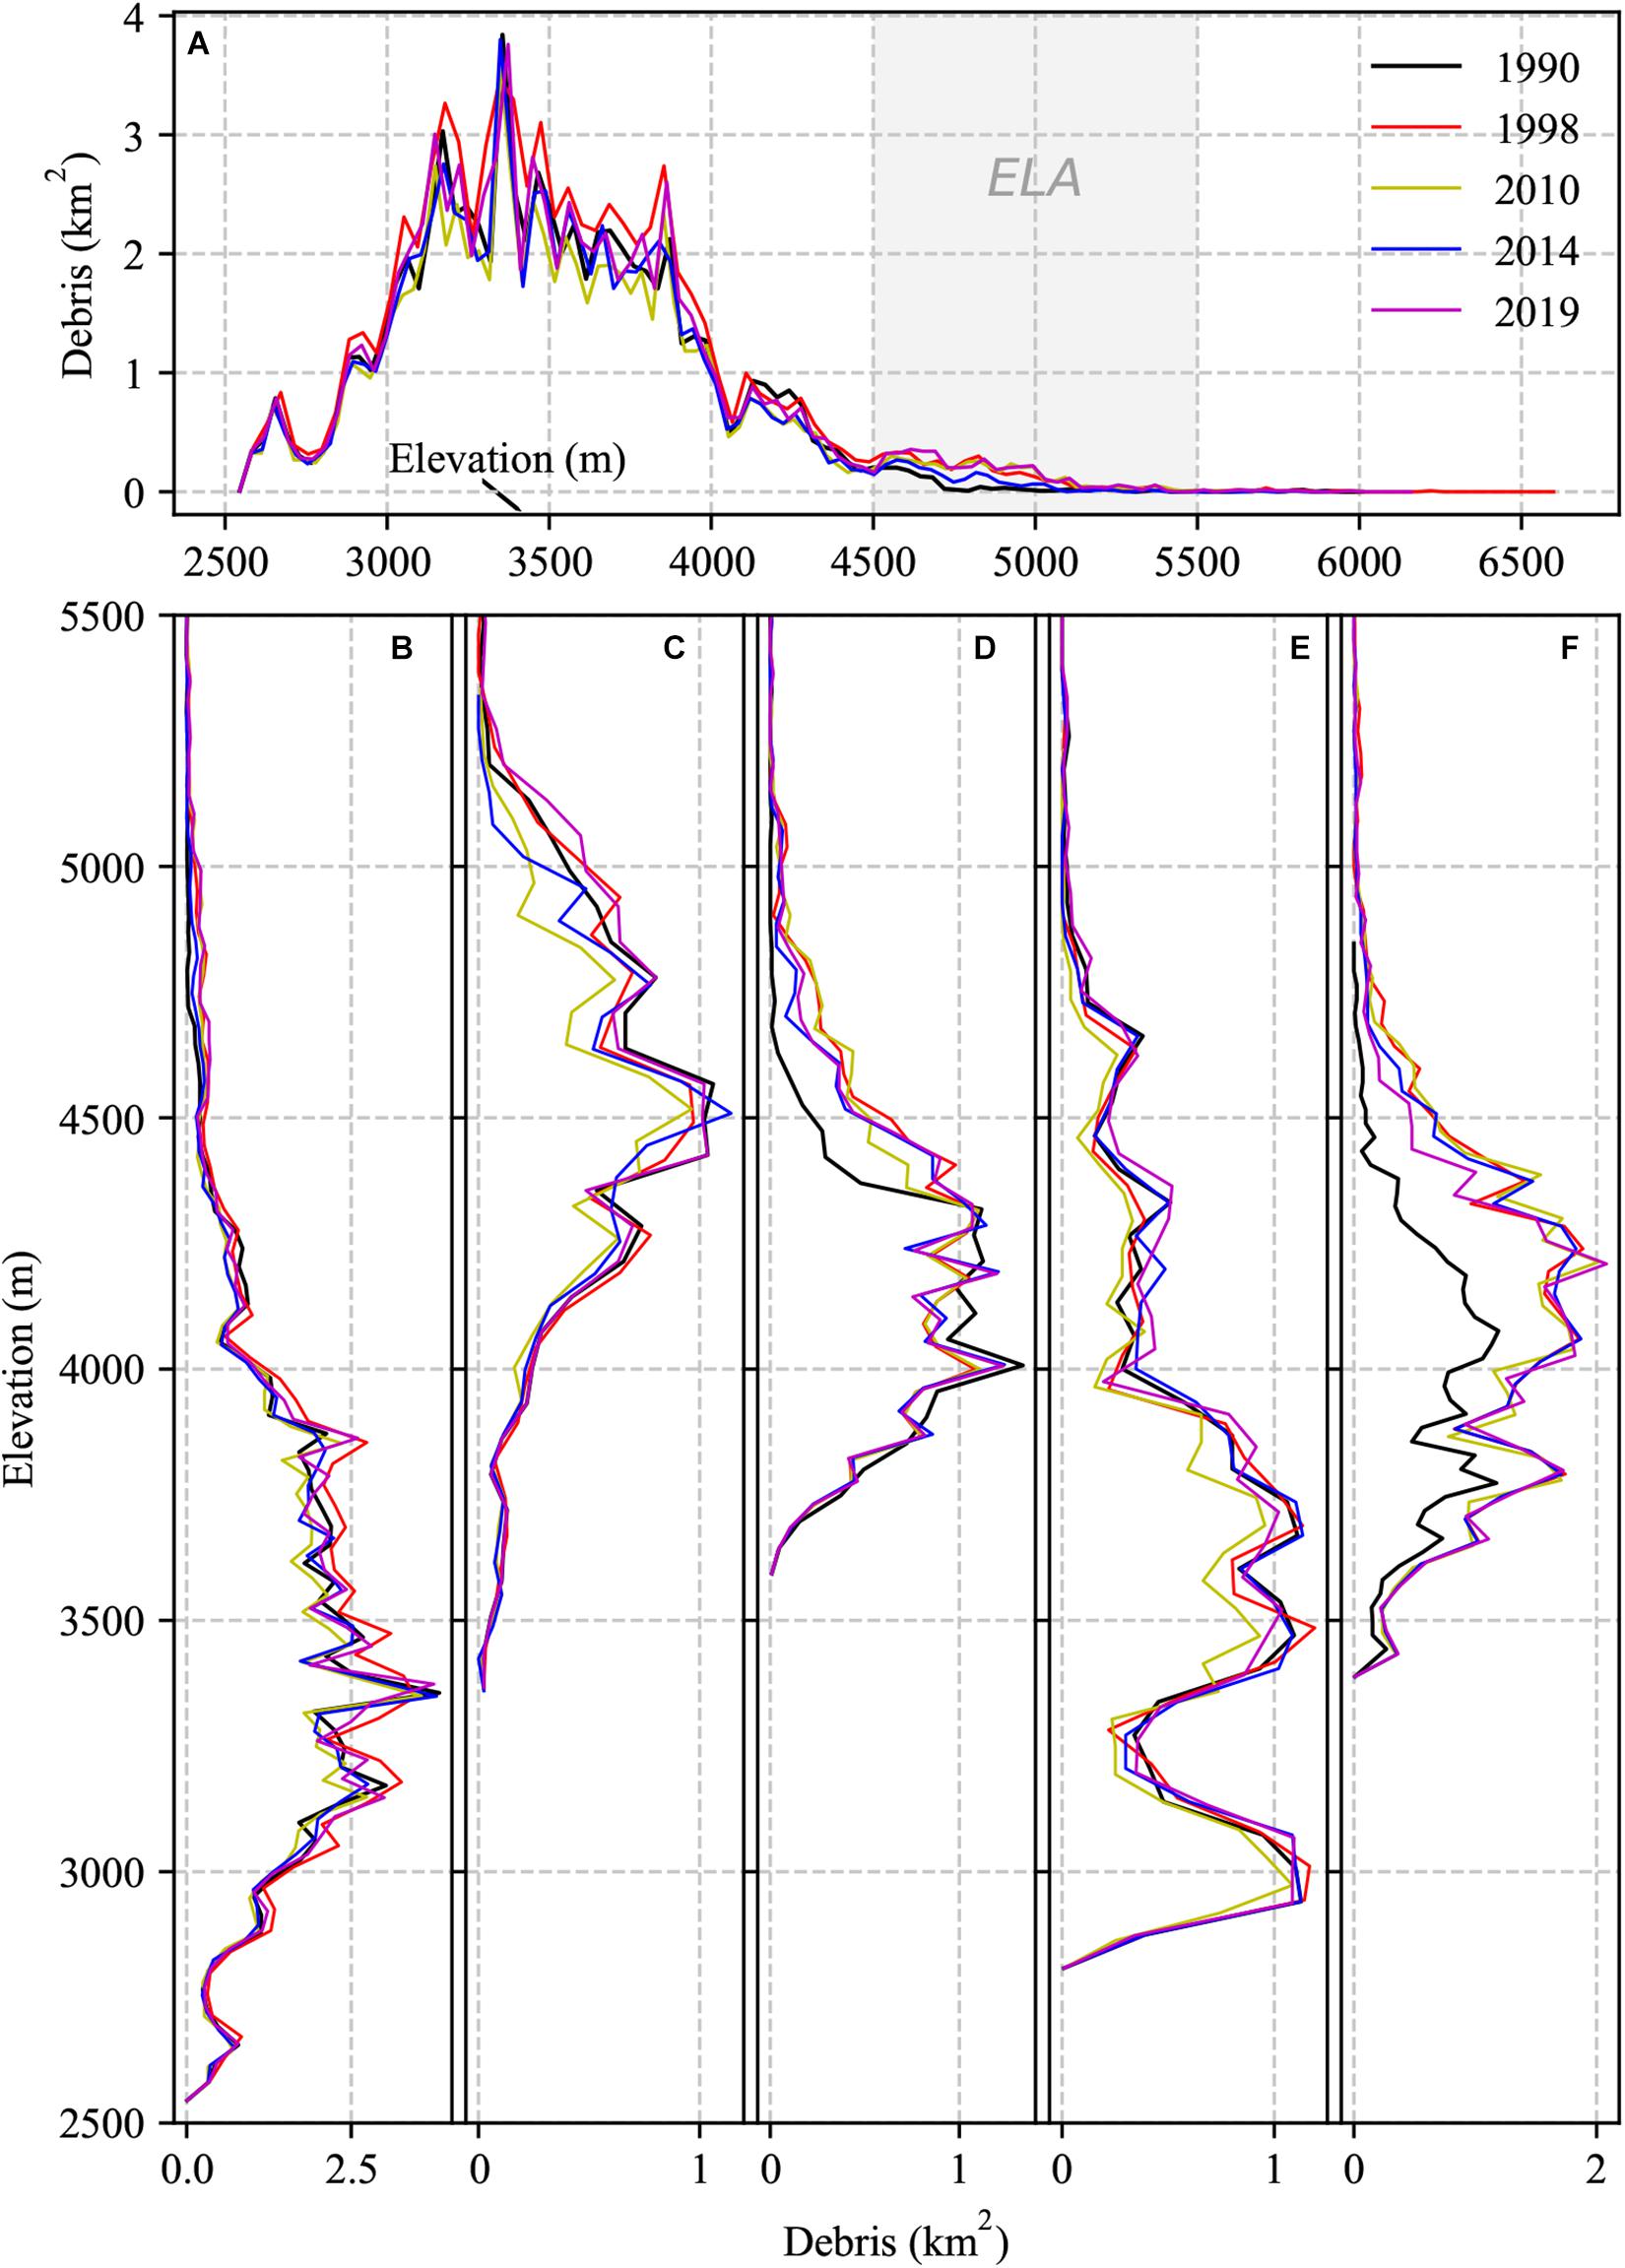
Figure 10. Hypsometry of the supra-glacial debris cover in the studied regions, alongside data from five typical debris-covered glaciers in 1990, 1998, 2010, 2014, and 2019. (A) Study area. (B) Batura Glacier. (C) Gharesa Glacier. (D) Kukki Jerab Glacier. (E) Parpik Glacier. (F) Yashkuk Yaz Glacier. The locations of the five glaciers are indicated in Figure 6A.
Impact of Climate Change
Thinning of glaciers and a warming atmosphere can lead to permafrost melting and slope instability at higher altitudes (Deline et al., 2015). Glacier changes in the Karakoram Mountains have been attributed to the dynamics of the Indian monsoon and the westerlies (Qureshi et al., 2017). To demonstrate the relationship between supra-glacial debris and climate change, we analyzed temperature, albedo, and precipitation datasets taken from MODIS products and Terra Climate Monthly3 and Climate Hazards Group InfraRed Precipitation with Station data (CHIRPS) products.4 The temporal changes in temperature, albedo, and precipitation derived from this data are shown in Figure 11. It is clear that warming and wetting have been a dominant phenomenon in the Hunza Valley in recent decades (Figures 11A,C,D). Temperature had a downward trend in 1990–1998; however, since 2000, the temperature derived from both MODIS and the Terra Climate products have shown a slight increase. Albedo on the ice surface is decreasing (Figure 11B)—-a sign of supra-glacial debris increase. The amount of absorbed solar radiation on a glacier’s surface increases where the ice is covered by supra-glacial debris or discontinuous debris (dirty ice); such debris causes an increase in glacier surface temperature and a decrease in albedo (Singh et al., 2011). As shown in Figures 11E,F, we also analyzed the relationships between temperature or precipitation and supra-glacial debris cover. Decreasing temperature and increasing precipitation have a positive relation with supra-glacial debris increase. This is particularly evident in the period 1990–1998. Global warming has accelerated the melting of glaciers resulting in changes in ice surface morphology and the redistribution of surface moraine material. A positive mass balance under decreasing temperatures and increasing precipitation may be caused by an increase in the production of material triggered by snow/ice avalanches or rockfalls.
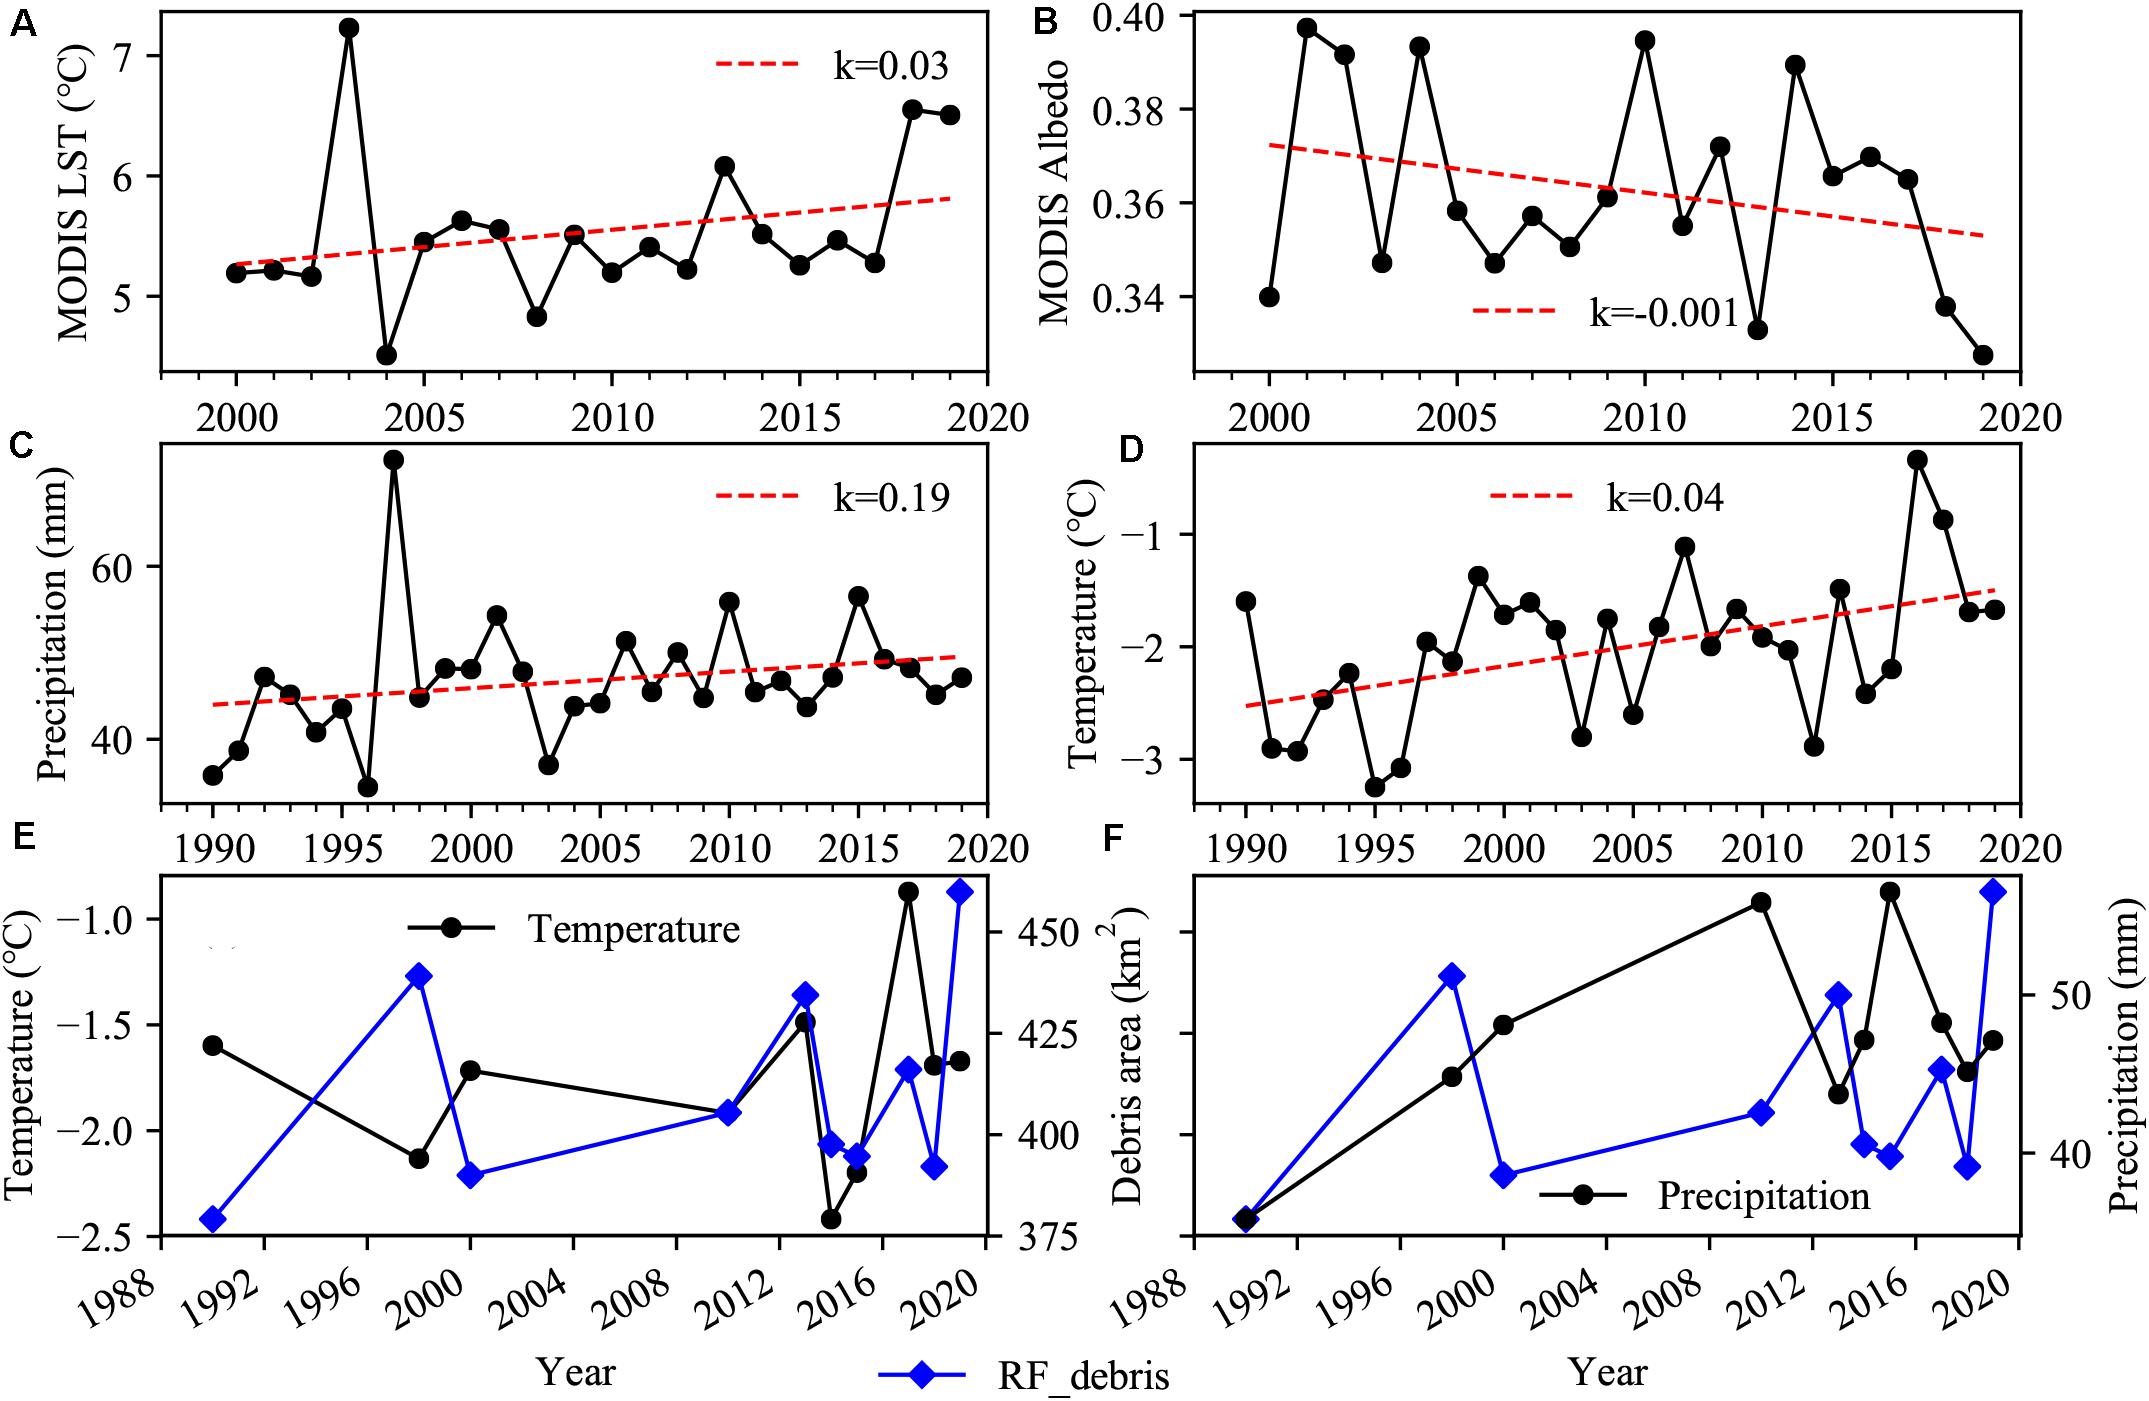
Figure 11. Average land-surface temperatures (A) and albedo (B) for 200 ∼ 270 days per year, derived from MODIS products (MOD11A2006 and MCD43A3006, respectively) in the glacier areas from 2000 to 2019 [k-value refers to the slope of the trend line (red dashed line), the same below]. (C) Precipitation for 200–270 days per year in the glacier area, generated from CHIRPS Pentad product data. (D) Trend map of average annual maximum temperatures in the Hunza River Basin, derived from the TerraClimate dataset, with a monthly temporal resolution and ∼4-km (1/24th of a degree) spatial resolution. Correlation of the supra-glacial debris area estimated by the RF model with temperature (E) and precipitation (F) [for a description of the data used, see (C,D)] in the Hunza Valley.
Conclusion
The expansion of supra-glacial debris and decrease of glacier surface albedo have been reported widely in several parts of the word (Ming et al., 2012; Jiang et al., 2018; Fugazza et al., 2019; Tielidze et al., 2020). In this study, we mapped the dynamics of supra-glacial debris cover in the Hunza Valley, using 34 Landsat images (10 TM, four ETM+, and 18 OLI) acquired from 1990 to 2019. Firstly, an image composite method was applied, and sequential Landsat images with less cloud and snow cover at the pixel level were used to generate annual images of supra-glacial debris on glaciers. Then, the Otsu algorithm was utilized to optimize thresholds of NDSI segmentation, and the supra-glacial features (e.g., clean ice/snow and debris-covered ice) were classified on the state-of-the-art GEE cloud computing platform together with three machine learning algorithms (RF, SVM, and CART). All the training and validation datasets were derived from the visual inspection of freely available, high-spatial-resolution satellite imagery (Landsat, Sentinel-2, and Google Earth). Among these, the RF model produced the best classification accuracy, with a Kappa coefficient of 0.94 ± 0.01 and an overall accuracy of 95.6 ± 0.9%. Based on these estimates, we found that significant increases in areal supra-glacial debris cover had occurred during the last 30 years. The total area of supra-glacial debris cover in the Hunza Valley has expanded by about 8.1–21.3% from 1990 to 2019. It has migrated up-glacier, and the main area of change is located in the middle and upper regions of the glacier, close to the altitude of the equilibrium line (4,500–5,500 m a.s.l.). We also found that the interannual temperature decrease and precipitation increase had positive relations with the supra-glacial debris increase. This supra-glacial debris areal change information can also be used in mass balance, glacier hydrology, glacier hazard, and glacier response to climate change models.
The identification of debris is a fundamental, and yet still challenging field in studying glacier change and water resources. With the effects of global warming, clean glaciers in the high mountains of Asia are increasingly changing into debris-covered glaciers, which leads to changed discharge in rivers mainly supplied by glacial meltwater, resulting in the water resources in basins, and their future trends, likely to be greatly affected. To explore the response of debris-covered glaciers to climate change, and their effect on hydrology and water resources, future work should focus on extracting information about debris thickness and other surface features (e.g., glacial ponds and cliffs) using high-resolution aerial or satellite imagery and deep-learning techniques.
Data Availability Statement
All datasets generated for this study are included in the article/supplementary material.
Author Contributions
The study was designed by SL and FX. FX ran models and performed the data analysis. FX and SL performed the analysis and drafted the first manuscript. KW, YZ, YG, MQ, SD, MS, and AT discussed and improved the manuscript. All authors contributed to the article and approved the submitted version.
Funding
This project has received funding from the National Natural Science Foundation of China (Grant Nos. 41761144075 and 41801031), the Second Tibetan Plateau Scientific Expedition and Research Program (STEP, Grant No. 2019QZKK0208), the Research Fund for Introducing Talents of Yunnan University (No. YJRC3201702), and the initiative for the promotion of Yunnan University in the development of a world-class university. FX was also supported by the Innovation Fund Designated for Graduate Students of Yunnan University (Grant No. 2019226).
Conflict of Interest
The authors declare that the research was conducted in the absence of any commercial or financial relationships that could be construed as a potential conflict of interest.
Acknowledgments
We thank the Google Earth Engine Science team for the freely available cloud-computing platform and USGS for Landsat imagery and SRTM DEM. We thank Sidou Zhang, Xinxin Qiang, and Ying Yi at the Institute of International Rivers and Eco-Security, Yunnan University, who involved in the conception of the manuscript. Finally, we thank the editor TZ and three reviewers for their constructive comments on the manuscript.
Footnotes
- ^ https://www.usgs.gov/land-resources/nli/landsat
- ^ https://developers.google.com/earth-engine/landsat
- ^ http://www.climatologylab.org
- ^ https://chc.ucsb.edu/data/chirps
References
Ali, A. F., Xiao, C., Zhang, X., Adnan, M., Iqbal, M., and Khan, G. (2018). Projection of future streamflow of the Hunza River Basin, Karakoram Range (Pakistan) using HBV hydrological model. J. Mt. Sci. 15, 2218–2235. doi: 10.1007/s11629-018-4907-4
Alifu, H., Johnson, B. A., and Tateishi, R. (2016). Delineation of debris-covered glaciers based on a combination of geomorphometric parameters and a TIR/NIR/SWIR band ratio. IEEE J. Sel. Top. Appl. Earth Observ. Remote Sens. 9, 781–792. doi: 10.1109/JSTARS.2015.2500906
Alifu, H., Tateishi, R., and Johnson, B. (2015). A new band ratio technique for mapping debris-covered glaciers using Landsat imagery and a digital elevation model. Int. J. Remote Sens. 36, 2063–2075. doi: 10.1080/2150704x.2015.1034886
Altena, B., Scambos, T., Fahnestock, M., and Kääb, A. (2019). Extracting recent short-term glacier velocity evolution over southern Alaska and the Yukon from a large collection of Landsat data. Cryosphere 13, 795–814. doi: 10.5194/tc-13-795-2019
Benn, D. I., Bolch, T., Hands, K., Gulley, J., Luckman, A., Nicholson, L. I., et al. (2012). Response of debris-covered glaciers in the Mount Everest region to recent warming, and implications for outburst flood hazards. Earth Sci. Rev. 114, 156–174. doi: 10.1016/j.earscirev.2012.03.008
Bhambri, R., Hewitt, K., Kawishwar, P., Kumar, A., Verma, A., Tiwari, S., et al. (2019). Ice-dams, outburst floods, and movement heterogeneity of glaciers, Karakoram. Glob. Planet. Change 180, 100–116. doi: 10.1016/j.gloplacha.2019.05.004
Bhambri, R., Hewitt, K., Kawishwar, P., and Pratap, B. (2017). Surge-type and surge-modified glaciers in the Karakoram. Sci. Rep. 7:15391. doi: 10.1038/s41598-017-15473-8
Bolch, T., Menounos, B., and Wheate, R. (2010). Landsat-based inventory of glaciers in western Canada, 1985–2005. Remote Sens. Environ. 114, 127–137. doi: 10.1016/j.rse.2009.08.015
Breiman, L., Friedman, J. H., Olshen, R. A., and Stone, C. J. (1984). Classification and Regression Trees. (Belmont, CA: Wadsworth Inc). doi: 10.1201/9781315139470
Chand, M. B., and Watanabe, T. (2019). Development of Supraglacial Ponds in the Everest Region, Nepal, between 1989 and 2018. Remote Sens. 11:1058. doi: 10.3390/rs11091058
Chandera, G., Markham, B. L., and Helder, D. L. (2009). Summary of current radiometric calibration coefficients for Landsat MSS, TM, ETM+, and EO-1 ALI Sensors. Remote Sens. Environ. 113, 893–903. doi: 10.1016/j.rse.2009.01.007
Cook, S. J., Swift, D. A., Kirkbride, M. P., Knight, P. G., and Waller, R. I. (2020). The empirical basis for modelling glacial erosion rates. Nat. Commun. 11:759. doi: 10.1038/s41467-020-14583-8
Dehecq, A., Gourmelen, N., Gardner, A. S., Brun, F., Goldberg, D., Nienow, P. W., et al. (2018). Twenty-first century glacier slowdown driven by mass loss in High Mountain Asia. Nat. Geosci. 12, 22–27. doi: 10.1038/s41561-018-0271-9
Deline, P., Gruber, S., Delaloye, R., Fischer, L., Geertsema, M., Giardino, M., et al. (2015). “Ice loss and slope stability in high-mountain regions, in Snow and Ice-Related Hazards, Risks and Disasters. eds W. Haeberli C. Whiteman (Amsterdam: Elsevier), 521–561. doi: 10.1016/b978-0-12-394849-6.00015-9
Dong, J., Xiao, X., Menarguez, M. A., Zhang, G., Qin, Y., Thau, D., et al. (2016). Mapping paddy rice planting area in northeastern Asia with Landsat 8 images, phenology-based algorithm and Google Earth Engine. Remote Sens. Environ. 185, 142–154. doi: 10.1016/j.rse.2016.02.016
Dozier, J. (1989). Spectral signature of Alpine snow cover from the Landsat thematic mapper. Remote Sens. Environ. 28, 9–22. doi: 10.1016/0034-4257(89)90101-6
Dubey, S., and Goyal, M. K. (2020). Glacial lake outburst flood hazard, downstream impact, and risk over the Indian Himalayas. Water Resour. Res. 56:e2019WR026533. doi: 10.1029/2019wr026533
Farinotti, D., Immerzeel, W. W., and Dehecq, A. (2020). Manifestations and mechanisms of the Karakoram glacier anomaly. Nat. Geosci. 13, 8–16. doi: 10.1038/s41561-019-0513-5
Frey, H., and Paul, F. (2012). On the suitability of the SRTM DEM and ASTER GDEM for the compilation of topographic parameters in glacier inventories. Int. J. Appl. Earth Obs. Geoinf. 18, 480–490. doi: 10.1016/j.jag.2011.09.020
Fugazza, D., Senese, A., Azzoni, R. S., Maugeri, M., Maragno, D., and Diolaiuti, G. A. (2019). New evidence of glacier darkening in the Ortles-Cevedale group from Landsat observations. Glob. Planet. Change 178, 35–45. doi: 10.1016/j.gloplacha.2019.04.014
Fyffe, C. L., Brock, B. W., Kirkbride, M. P., Black, A. R., Smiraglia, C., and Diolaiuti, G. (2019a). The impact of supraglacial debris on proglacial runoff and water chemistry. J. Hydrol. 576, 41–57. doi: 10.1016/j.jhydrol.2019.06.023
Fyffe, C. L., Brock, B. W., Kirkbride, M. P., Mair, D. W. F., Arnold, N. S., Smiraglia, C., et al. (2019b). Do debris-covered glaciers demonstrate distinctive hydrological behaviour compared to clean glaciers? J. Hydrol. 570, 584–597. doi: 10.1016/j.jhydrol.2018.12.069
Gao, H., Zou, X., Wu, J., Zhang, Y., Deng, X., Hussain, S., et al. (2020). Post-20(th) century near-steady state of Batura Glacier: observational evidence of Karakoram Anomaly. Sci. Rep. 10:987. doi: 10.1038/s41598-020-57660-0
Gardelle, J., Berthier, E., Arnaud, Y., and Kääb, A. (2013). Region-wide glacier mass balances over the Pamir-Karakoram-Himalaya during 1999-2011. Cryosphere 7, 1263–1286. doi: 10.5194/tc-7-1263-2013
Garee, K., Chen, X., Bao, A., Wang, Y., and Meng, F. (2017). Hydrological modeling of the upper Indus Basin: a case study from a high-altitude glacierized catchment Hunza. Water 9:17. doi: 10.3390/w9010017
Garg, P. K., Shukla, A., and Jasrotia, A. S. (2019). On the strongly imbalanced state of glaciers in the Sikkim, eastern Himalaya, India. Sci. Total Environ. 691, 16–35. doi: 10.1016/j.scitotenv.2019.07.086
Gorelick, N., Hancher, M., Dixon, M., Ilyushchenko, S., Thau, D., and Moore, R. (2017). Google Earth Engine: planetary-scale geospatial analysis for everyone. Remote Sens. Environ. 202, 18–27. doi: 10.1016/j.rse.2017.06.031
Guo, H., Goodchild, M. F., and Annoni, A. (2020). Manual of Digital Earth. Singapore: Springer. doi: 10.1007/978-981-32-9915-3
Haeberli, W., Hallet, B., Arenson, L., Elconin, R., Humlum, O., Kääb, A., et al. (2006). Permafrost creep and rock glacier dynamics. Permafr. Periglac. Process. 17, 189–214. doi: 10.1002/ppp.561
Hambrey, M. J., Quincey, D. J., Glasser, N. F., Reynolds, J. M., Richardson, S. J., and Clemmens, S. (2008). Sedimentological, geomorphological and dynamic context of debris-mantled glaciers, Mount Everest (Sagarmatha) region, Nepal. Quat. Sci. Rev. 27, 2361–2389. doi: 10.1016/j.quascirev.2008.08.010
Hao, B., Ma, M., Li, S., Li, Q., Hao, D., Huang, J., et al. (2019). Land use change and climate variation in the three gorges reservoir catchment from 2000 to 2015 based on the Google Earth Engine. Sensors 19:2118. doi: 10.3390/s19092118
Hazel, J., Krutkramelis, K., Mooney, P., Tomschik, M., Gerow, K., Oakey, J., et al. (2016). High-resolution global maps of 21st-century forest cover change. Science 342, 850–853. doi: 10.1126/science.1244693
Herreid, S., and Pellicciotti, F. (2018). Automated detection of ice cliffs within supraglacial debris cover. Cryosphere 12, 1811–1829. doi: 10.5194/tc-12-1811-2018
Immerzeel, W. W., Pellicciotti, F., and Shrestha, A. B. (2012). Glaciers as a proxy to quantify the spatial distribution of precipitation in the Hunza Basin. Mt. Res. Dev. 32, 30–38. doi: 10.1659/MRD-JOURNAL-D-11-00097.1
Immerzeel, W. W., van Beek, L. P., and Bierkens, M. F. (2010). Climate change will affect the Asian water towers. Science 328, 1382–1385. doi: 10.1126/science.1183188
Janke, J. R., Bellisario, A. C., and Ferrando, F. A. (2015). Classification of debris-covered glaciers and rock glaciers in the Andes of central Chile. Geomorphology 241, 98–121. doi: 10.1016/j.geomorph.2015.03.034
Jassim, F. A. (2013). Kriging interpolation filter to reduce high density salt and pepper noise. World Comput. Sci. Inf. Technol. J. 3, 8–14.
Jiang, S., Nie, Y., Liu, Q., Wang, J., Liu, L., Hassan, J., et al. (2018). Glacier change, supraglacial debris expansion and glacial lake evolution in the Gyirong river basin, Central Himalayas, between 1988 and 2015. Remote Sens. 10:986. doi: 10.3390/rs10070986
Kaab, A., Berthier, E., Nuth, C., Gardelle, J., and Arnaud, Y. (2012). Contrasting patterns of early twenty-first-century glacier mass change in the Himalayas. Nature 488, 495–498. doi: 10.1038/nature11324
Khan, A., Naz, B. S., and Bowling, L. C. (2015). Separating snow, clean and debris covered ice in the Upper Indus Basin, Hindukush-Karakoram-Himalayas, using Landsat images between 1998 and 2002. J. Hydrol. 521, 46–64. doi: 10.1016/j.jhydrol.2014.11.048
Khan, A. A., Jamil, A., Hussain, D., Taj, M., Jabeen, G. and Malik, M. K. (2020). Machine-learning algorithms for mapping debris-covered glaciers: the hunza basin case study. IEEE Access 8, 12725–12734. doi: 10.1109/access.2020.2965768
Kindermann, G. E., McCallum, I., Fritz, S., and Obersteiner, M. (2008). A global forest growing stock, biomass and carbon map based on FAO statistics. Silva Fenn. 42, 387–396. doi: 10.14214/sf.244
Kraaijenbrink, P. D. A., Bierkens, M. F. P., Lutz, A. F., and Immerzeel, W. W. (2017). Impact of a global temperature rise of 1.5 degrees celsius on Asia’s glaciers. Nature 549, 257–260. doi: 10.1038/nature23878
Kraaijenbrink, P. D. A., Shea, J. M., Pellicciotti, F., Jong, S. M. D., and Immerzeel, W. W. (2016). Object-based analysis of unmanned aerial vehicle imagery to map and characterise surface features on a debris-covered glacier. Remote Sens. Environ. 186, 581–595. doi: 10.1016/j.rse.2016.09.013
Lary, D. J., Alavi, A. H., Gandomi, A. H., and Walker, A. L. (2017). Machine learning in geosciences and remote sensing. Geosci. Front. 7, 3–10. doi: 10.1016/j.gsf.2015.07.003
Lippl, S., Vijay, S., and Braun, M. (2018). Automatic delineation of debris-covered glaciers using InSAR coherence derived from X-, C- and L-band radar data: a case study of Yazgyl Glacier. J. Glaciol. 64, 811–821. doi: 10.1017/jog.2018.70
Liu, S., Yao, X., Shangguan, D., Guo, W., Wei, J., Xu, J., et al. (2015). The contemporary glaciers in China based on the second Chinese glacier inventory. Acta Geogr. Sin. 70, 3–16. doi: 10.11821/dlxb201501001
Lynch, C. M., Barr, I. D., Mullan, D., and Ruffell, A. (2016). Rapid glacial retreat on the Kamchatka Peninsula during the early 21st century. Cryosphere 10, 1809–1821. doi: 10.5194/tc-10-1809-2016
Maxwell, A. E., Warner, T. A., and Fang, F. (2018). Implementation of machine-learning classification in remote sensing: an applied review. Int. J. Remote Sens. 39, 2784–2817. doi: 10.1080/01431161.2018.1433343
Midekisa, A., Holl, F., Savory, D. J., Andrade-Pacheco, R., Gething, P. W., Bennett, A., et al. (2017). Mapping land cover change over continental Africa using Landsat and Google Earth Engine cloud computing. PLoS One 12:e0184926. doi: 10.1371/journal.pone.0184926
Miles, E. S., Willis, I. C., Arnold, N. S., Steiner, J., and Pellicciotti, F. (2016). Spatial, seasonal and interannual variability of supraglacial ponds in the Langtang Valley of Nepal, 1999–2013. J. Glaciol. 63, 88–105. doi: 10.1017/jog.2016.120
Ming, J., Du, Z., Xiao, C., Xu, X., and Zhang, D. (2012). Darkening of the mid-Himalaya glaciers since 2000 and the potential causes. Environ. Res. Lett. 7:014021. doi: 10.1088/1748-9326/7/1/014021
Mölg, N., Bolch, T., Rastner, P., Strozzi, T., and Paul, F. (2018). A consistent glacier inventory for Karakoram and Pamir derived from Landsat data: distribution of debris cover and mapping challenges. Earth Syst. Sci. Data 10, 1807–1827. doi: 10.5194/essd-10-1807-2018
Mölg, N., Bolch, T., Walter, A., and Vieli, A. (2019). Unravelling the evolution of Zmuttgletscher and its debris cover since the end of the Little Ice Age. Cryosphere 13, 1889–1909. doi: 10.5194/tc-13-1889-2019
Nakawo, M., Iwata, S., Watanabe, O., and Yoshida, M. (1986). Processes which distribute supraglacial debris on the Khumbu glacier, Nepal Himalaya. Ann. Glaciol. 8, 129–131. doi: 10.3189/S0260305500001294
Ng, H.-F. (2006). Automatic thresholding for defect detection. Pattern Recognit. Lett. 27, 1644–1649. doi: 10.1016/j.patrec.2006.03.009
Nicholson, L., and Benn, D. I. (2006). Calculating ice melt beneath a debris layer using meteorological data. J. Glaciol. 52, 463–470. doi: 10.3189/172756506781828584
Nuimura, T., Sakai, A., Taniguchi, K., Nagai, H., Lamsal, D., Tsutaki, S., et al. (2015). The GAMDAM glacier inventory: a quality-controlled inventory of Asian glaciers. Cryosphere 9, 849–864. doi: 10.5194/tc-9-849-2015
Østrem, G. (1959). Ice melting under a thin layer of moraine, and the existence of ice cores in moraine ridges. Geogr. Ann. 41, 228–230. doi: 10.2307/4626805
Patel, A., Prajapati, R., Dharpure, J. K., Mani, S., and Chauhan, D. (2019). Mapping and monitoring of glacier areal changes using multispectral and elevation data: a case study over Chhota-Shigri glacier. Earth Sci. Inform. 12, 489–499. doi: 10.1007/s12145-019-00388-x
Paul, F., Barrand, N. E., Baumann, S., Berthier, E., Bolch, T., Casey, K., et al. (2017). On the accuracy of glacier outlines derived from remote-sensing data. Ann. Glaciol. 54, 171–182. doi: 10.3189/2013AoG63A296
Paul, F., Bolch, T., Kääb, A., Nagler, T., Nuth, C., Scharrer, K., et al. (2013). The glaciers climate change initiative: methods for creating glacier area, elevation change and velocity products. Remote Sens. Environ. 162, 408–426. doi: 10.1016/j.rse.2013.07.043
Paul, F., Huggel, C., and Kääb, A. (2004). Combining satellite multispectral image data and a digital elevation model for mapping debris-covered glaciers. Remote Sens. Environ. 89, 510–518. doi: 10.1016/j.rse.2003.11.007
Pekel, J. F., Cottam, A., Gorelick, N., and Belward, A. S. (2016). High-resolution mapping of global surface water and its long-term changes. Nature 540, 418–422. doi: 10.1038/nature20584
Pfeffer, W. T., Arendt, A. A., Bliss, A., Bolch, T., Cogley, J. G., Gardner, A. S., et al. (2014). The Randolph Glacier Inventory: a globally complete inventory of glaciers. J. Glaciol. 60, 537–552. doi: 10.3189/2014JoG13J176
Quincey, D. J., Braun, M., Glasser, N. F., Bishop, M. P., Hewitt, K., and Luckman, A. (2011). Karakoram glacier surge dynamics. Geophys. Res. Lett. 38:L18504. doi: 10.1029/2011gl049004
Qureshi, M. A., Yi, C., Xu, X., and Li, Y. (2017). Glacier status during the period 1973-2014 in the Hunza Basin, Western Karakoram. Quat. Int. 444, 125–136. doi: 10.1016/j.quaint.2016.08.029
Racoviteanu, A., and Williams, M. W. (2012). Decision tree and texture analysis for mapping debris-covered glaciers in the Kangchenjunga area, Eastern Himalaya. Remote Sens. 4, 3078–3109. doi: 10.3390/rs4103078
Rastner, P., Bolch, T., Notarnicola, C., and Paul, F. (2014). A comparison of pixel- and object-based glacier classification with optical satellite images. IEEE J. Sel. Top. Appl. Earth Observ. Remote Sens. 7, 853–862. doi: 10.1109/JSTARS.2013.2274668
Raup, B., Racoviteanu, A., Khalsa, S. J. S., Helm, C., Armstrong, R., and Arnaud, Y. (2007). The GLIMS geospatial glacier database: a new tool for studying glacier change. Glob. Planet. Change 56, 101–110. doi: 10.1016/j.gloplacha.2006.07.018
Reinthaler, J., Paul, F., Granados, H. D., Rivera, A., and Huggel, C. (2019). Area changes of glaciers on active volcanoes in Latin America between 1986 and 2015 observed from multi-temporal satellite imagery. J. Glaciol. 65, 542–556. doi: 10.1017/jog.2019.30
RGI Consortium (2017). Randolph Glacier Inventory – A Dataset of Global Glacier Outlines: Version 6.0: Technical Report, Global Land Ice Measurements from Space. Colorado: Digital Media.
Robson, B. A., Nuth, C., Dahl, S. O., Hölbling, D., Strozzi, T., and Nielsen, P. R. (2015). Automated classification of debris-covered glaciers combining optical, SAR and topographic data in an object-based environment. Remote Sens. Environ. 170, 372–387. doi: 10.1016/j.rse.2015.10.001
Rowan, A. V., Egholm, D. L., Quincey, D. J., and Glasser, N. F. (2015). Modelling the feedbacks between mass balance, ice flow and debris transport to predict the response to climate change of debris-covered glaciers in the Himalaya. Earth Planet. Sci. Lett. 430, 427–438. doi: 10.1016/j.epsl.2015.09.004
Sahu, R., and Gupta, R. D. (2018). Conceptual framework of combined pixel and object-based method for delineation of debris-covered glaciers. ISPRS Ann. Photogramm. Remote Sens. Spat. Inf. Sci. IV-5, 173–180. doi: 10.5194/isprs-annals-IV-5-173-2018
Salerno, F., Thakuri, S., Tartari, G., Nuimura, T., Sunako, S., Sakai, A., et al. (2017). Debris-covered glacier anomaly? Morphological factors controlling changes in the mass balance, surface area, terminus position, and snow line altitude of Himalayan glaciers. Earth Planet. Sci. Lett. 471, 19–31. doi: 10.1016/j.epsl.2017.04.039
Scherler, D., Bookhagen, B., and Strecker, M. R. (2011). Spatially variable response of Himalayan glaciers to climate change affected by debris cover. Nat. Geosci. 4, 156–159. doi: 10.1038/ngeo1068
Scherler, D., Wulf, H., and Gorelick, N. (2018). Global assessment of supraglacial debris-cover extents. Geophys. Res. Lett. 45, 798–11,805. doi: 10.1029/2018gl080158
Serra, J., and Vincent, L. (1992). An overview of morphological filtering. Circuits Syst. Signal Process. 11, 47–108. doi: 10.1007/bf01189221
Shrestha, M., Koike, T., Hirabayashi, Y., Xue, Y., Wang, L., Rasul, G., et al. (2015). Integrated simulation of snow and glacier melt in water and energy balance-based, distributed hydrological modeling framework at Hunza River Basin of Pakistan Karakoram region. J. Geophys. Res. Atmos. 120, 4889–4919. doi: 10.1002/2014jd022666
Shukla, A., and Garg, P. K. (2019). Evolution of a debris-covered glacier in the western Himalaya during the last four decades (1971–2016): a multiparametric assessment using remote sensing and field observations. Geomorphology 341, 1–14. doi: 10.1016/j.geomorph.2019.05.009
Shukla, A., and Yousuf, B. (2016). Evaluation of multisource data for glacier terrain mapping: a neural net approach. Geocarto Int. 32, 569–587. doi: 10.1080/10106049.2016.1161078
Singh, V., and Goyal, M. K. (2018). An improved coupled framework for Glacier classification: an integration of optical and thermal infrared remote-sensing bands. Int. J. Remote Sens. 39, 6864–6892. doi: 10.1080/01431161.2018.1468104
Singh, V. P., Singh, P., and Haritashya, U. K. (2011). Encyclopedia of Snow, Ice and Glaciers. Berlin: Springer. doi: 10.1007/978-90-481-2642-2
Suykens, J. A. K., and Vandewalle, J. (1999). Least squares support vector machine classifiers. Neural Process. Lett. 9, 293–300.
Tahir, A. A., Chevallier, P., Arnaud, Y., Neppel, L., and Ahmad, B. (2011). Modeling snowmelt-runoff under climate scenarios in the Hunza River basin, Karakoram Range, Northern Pakistan. J. Hydrol. 409, 104–117. doi: 10.1016/j.jhydrol.2011.08.035
Tielidze, L. G., Bolch, T., Wheate, R. D., Kutuzov, S. S., Lavrentiev, I. I., and Zemp, M. (2020). Supra-glacial debris cover changes in the Greater Caucasus from 1986 to 2014. Cryosphere 14, 585–598. doi: 10.5194/tc-14-585-2020
Tipper, E. T., Lemarchand, E., Hindshaw, R. S., Reynolds, B. C., and Bourdon, B. (2012). Seasonal sensitivity of weathering processes: hints from magnesium isotopes in a glacial stream. Chem. Geol. 312-313, 80–92. doi: 10.1016/j.chemgeo.2012.04.002
Vezzola, L. C., Diolaiuti, G. A., D’Agata, C., Smiraglia, C., and Pelfini, M. (2016). Assessing glacier features supporting supraglacial trees: a case study of the Miage debris-covered Glacier (Italian Alps). Holocene 26, 1138–1148. doi: 10.1177/0959683616632883
Wang, P., Li, Z., Li, H., Wang, W., Wu, L., Zhang, H., et al. (2018). Recent evolution in extent, thickness, and velocity of Haxilegen glacier no. 51, Kuytun River Basin, Eastern Tianshan Mountains. Arct. Antarct. Alp. Res. 48, 241–252. doi: 10.1657/aaar0014-079
Wang, R., Liu, S., Shangguan, D., Radić, V., and Zhang, Y. (2019a). Spatial heterogeneity in glacier mass-balance sensitivity across High Mountain Asia. Water 11:776. doi: 10.3390/w11040776
Wang, Y., Ma, J., Xiao, X., Wang, X., Dai, S., and Zhao, B. (2019b). Long-term dynamic of Poyang lake surface water: a mapping work based on the Google Earth Engine cloud platform. Remote Sens. 11:313. doi: 10.3390/rs11030313
Wouters, B., Gardner, A. S., and Moholdt, G. (2019). Global glacier mass loss during the GRACE satellite mission (2002-2016). Front. Earth Sci. 7:96. doi: 10.3389/feart.2019.00096
Wu, K., Liu, S., Jiang, Z., Xu, J., Wei, J., and Guo, W. (2018). Recent glacier mass balance and area changes in the Kangri Karpo Mountains from DEMs and glacier inventories. Cryosphere 12, 103–121. doi: 10.5194/tc-12-103-2018
Yang, Y., Li, Z., Huang, L., Tian, B., and Chen, Q. (2016). Extraction of glacier outlines and water-eroded stripes using high-resolution SAR imagery. Int. J. Remote Sens. 37, 1016–1034. doi: 10.1080/01431161.2016.1145365
Yang, Z. (1995). Glacier meltwater runoff in China and its nourishment to river. Chin. Geogr. Sci. 5, 66–76. doi: 10.1007/bf02664344
Yousuf, B., Shukla, A., Arora, M. K., Bindal, A., and Jasrotia, A. S. (2020). On drivers of subpixel classification accuracy—an example from glacier facies. IEEE J. Sel. Top. Appl. Earth Observ. Remote Sens. 13, 601–608. doi: 10.1109/jstars.2019.2955955
Zemp, M., Huss, M., Thibert, E., Eckert, N., McNabb, R., Huber, J., et al. (2019). Global glacier mass changes and their contributions to sea-level rise from 1961 to 2016. Nature 568, 382–386. doi: 10.1038/s41586-019-1071-0
Zhang, J., Jia, L., Menenti, M., and Hu, G. (2019). Glacier facies mapping using a machine-learning algorithm: the Parlung Zangbo basin case study. Remote Sens. 11:452. doi: 10.3390/rs11040452
Keywords: supra-glacial debris, Hunza Valley, machine learning, Otsu, Google Earth Engine
Citation: Xie F, Liu S, Wu K, Zhu Y, Gao Y, Qi M, Duan S, Saifullah M and Tahir AA (2020) Upward Expansion of Supra-Glacial Debris Cover in the Hunza Valley, Karakoram, During 1990 ∼ 2019. Front. Earth Sci. 8:308. doi: 10.3389/feart.2020.00308
Received: 17 January 2020; Accepted: 30 June 2020;
Published: 23 July 2020.
Edited by:
Tong Zhang, Los Alamos National Laboratory (DOE), United StatesReviewed by:
Leigh A. Stearns, The University of Kansas, United StatesAparna Shukla, Ministry of Earth Sciences, India
Takayuki Nuimura, Tokyo Denki University, Japan
Copyright © 2020 Xie, Liu, Wu, Zhu, Gao, Qi, Duan, Saifullah and Tahir. This is an open-access article distributed under the terms of the Creative Commons Attribution License (CC BY). The use, distribution or reproduction in other forums is permitted, provided the original author(s) and the copyright owner(s) are credited and that the original publication in this journal is cited, in accordance with accepted academic practice. No use, distribution or reproduction is permitted which does not comply with these terms.
*Correspondence: Shiyin Liu, shiyin.liu@ynu.edu.cn