Reconciling Svalbard Glacier Mass Balance
 Thomas V. Schuler1,2*
  Jack Kohler3
  Nelly Elagina4
  Jon Ove M. Hagen1
  Andrew J. Hodson5,6
  Jacek A. Jania7
  Andreas M. Kääb1
  Bartłomiej Luks8
  Jakub Małecki9
  Geir Moholdt3
  Veijo A. Pohjola10
  Ireneusz Sobota11
  Ward J. J. Van Pelt10
- 1Department of Geosciences, University of Oslo, Oslo, Norway
- 2Department of Arctic Geophysics, The University Centre in Svalbard (UNIS), Longyearbyen, Norway
- 3Norwegian Polar Institute, Fram Centre, Tromsø, Norway
- 4Institute of Geography, Russian Academy of Sciences, Moscow, Russia
- 5Department of Arctic Geology, The University Centre in Svalbard (UNIS), Longyearbyen, Norway
- 6Department of Environmental Sciences, Western Norway University of Applied Sciences, Sogndal, Norway
- 7Centre for Polar Studies, Institute of Earth Sciences, University of Silesia, Katowice, Poland
- 8Institute of Geophysics, Polish Academy of Sciences, Warsaw, Poland
- 9Institute of Geoecology and Geoinformation, Adam Mickiewicz University, Poznań, Poland
- 10Department of Earth Sciences, Uppsala University, Uppsala, Sweden
- 11Department of Hydrology and Water Management, Polar Research Center, Nicolaus Copernicus University, Toruń, Poland
Since the first estimates of Svalbard-wide glacier mass balance were made in the early 2000s, there has been great progress in remote sensing and modeling of mass balance, existing field records have been extended, field records at new locations have been added, and there has been considerable environmental change. There is a wide spread in the available estimates of both total mass balance and surface or climatic mass balance, but there is overall agreement that the glaciers on Svalbard have been losing mass since the 1960s, with a tendency toward more negative mass balance since 2000. We define criteria to select data that are representative and of high credibility; this subset shows a more coherent evolution and reduced spread. In addition, we combine individual field mass balance records collected by different groups into a single dataset that samples glaciers across Svalbard and a range of different size classes. We find a close relationship between measured specific surface mass balance and size of the glacier, in such a way that smaller glaciers experience more negative surface mass balances. A qualitatively similar relationship between the accumulation area ratio and glacier area is found for all glaciers in the Svalbard, suggesting that the relation derived from glaciological records is not only an artifact caused by the limited number of samples (n = 12). We apply this relation to upscale measured surface mass balance for a new estimate for all glaciers of Svalbard. Our reconciled estimates are −7 ± 4 Gt a–1 (2000–2019) for the climatic mass balance, and −8 ± 6 Gt a–1 for the total mass balance. The difference between the two represents the sum of frontal ablation and the combined uncertainty, which together amount to ca. −2 ± 7 Gt a–1. While this is consistent with a previous estimate of Svalbard-wide frontal ablation, the uncertainties are large. Furthermore, several large and long-lasting surges have had considerable and multi-year impact on the total mass balance, and in particular on calving rates, emphasizing the need for better-resolved and more frequently updated estimates of frontal ablation.
Introduction
Ongoing climate change alters the energy and mass balances of glaciers, which in turn have hydrological and ecological implications at the regional scale and which additionally drive global sea-level changes. For instance, the collective volume of water stored in Arctic glaciers has the potential to rise global sea level by ∼0.3 m if melted completely (AMAP, 2017). Although this is a much smaller volume than the sea-level equivalent of the ice sheets on Greenland and Antarctica, the contribution from Arctic glaciers (−213 ± 29 Gt a–1) currently accounts for about one third of the eustatic sea level change (IPCC, 2019) and is projected to be significant throughout the 21st century (Meier et al., 2007; Church et al., 2014; Hock et al., 2019). Meltwater released by the retreat of glaciers controls the hydrology of downstream systems, as well as influences terrestrial and marine ecosystems and fjord circulation. Moreover, glacier retreat leads to significant topographic changes, such as increased fjord length and glacier forefield area (Błaszczyk et al., 2013; Grabiec et al., 2018).
This paper reviews the current state of Svalbard glacier mass balance, and updates the previous assessments by Hagen et al. (2003a, 2003b), who used the data available at that time and different approaches to assess the Svalbard-wide total glacier mass balance. More than 15 years have passed since these previous works, during which measurements have been continued, new series from formerly under-represented areas have been initiated and new techniques have become available.
The surface mass balance (SMB) quantifies the mass fluxes between the atmosphere and the glacier at the surface, as well as within the current period’s snow layer. It comprises therefore also refreezing within the annual layer, whereas the climatic mass balance (CMB) additionally accounts for mass changes below the last summer surface. Total glacier mass balance is the sum of CMB, basal mass balance and frontal ablation, which in turn comprises calving and subaqueous melting (Cogley et al., 2011). Here, we assemble a dataset of directly measured SMB that has improved representativeness in terms of location and glacier size to derive a new estimate for Svalbard-wide SMB. Further, we discuss new technologies that have become available in the past 20 years. These include improved capability of satellite remote sensing for mass balance monitoring and meteorologically forced models to simulate climatic mass balance. Both techniques enable issues with temporal gaps and spatial representativeness of glaciological measurements to be overcome and to be linked optimally with adjacent disciplines in an Earth System perspective. Finally, we highlight important knowledge gaps and outline the future research needed to close them.
Svalbard Glaciers
Located between 75° and 82°N, at the junction of contrasting atmospheric and oceanic regimes and close to the fluctuating sea-ice edge, Svalbard is currently among the fastest warming regions on Earth (Maturilli et al., 2013; Nordli et al., 2014; Isaksen et al., 2016). Strong gradients characterize the climate of Svalbard, ranging from milder and more humid conditions in the south and west, to the colder and drier conditions in the northeast. These gradients are reflected in the spatial pattern of climatic mass balance, and therefore also in the distribution of glacier-covered area. The largest glaciers are found in the colder northeast, whereas glacier coverage is much less in the milder and drier area of central Spitsbergen, the main island.
About 34,000 km2, i.e., 57% of the ∼60,000 km2 land area of Svalbard are covered by glaciers (Nuth et al., 2013), corresponding to ∼10% of the glacier area in the Arctic, outside the Greenland ice sheet. The more than 1,000 individual glaciers larger than 1 km2 comprise a wide range of glacier types from small cirque glaciers and valley glaciers that mainly terminate on land to large ice fields and ice caps (up to ∼8,000 km2) each feeding several outlet glaciers. Adopting the methodology proposed by Parkes and Marzeion (2018), the area of uncharted, small glaciers is estimated to be 366 km2, about 1% of the area accounted for by the inventory (Supplementary Material S3). About 15% of all glaciers on Svalbard by number and as much as 60% by area (Błaszczyk et al., 2009) are tidewater glaciers, that terminate into fjord or ocean water. Tidewater glaciers introduce freshwater at depth into the marine waters, both from subglacial channels and submarine melting, as well as icebergs, which calve off of the glacier fronts. Svalbard’s total ice volume has been assessed using different methods, with estimates ranging from 4,000 to 9,600 km3, but most studies (Hagen et al., 1993; Martin-Espanol et al., 2015; Fürst et al., 2018) agree more closely on a value of ca. 6,200 km3, corresponding to a sea-level equivalent of 1.5 cm. Most Svalbard glaciers are polythermal (Hagen et al., 1993), i.e., they consist of both cold and temperate ice. Temperate ice is at the melting point, thus permitting the presence of liquid water in the glacier body even during the cold winter period.
Glacier Monitoring
Annual glaciological mass balance surveys of Svalbard glaciers have been conducted since 1966 (Hagen and Liestøl, 1990). Table 1 provides an overview of the glaciers currently being surveyed that have records of 5 years or longer, along with some of their characteristics. Regular measurements have been performed on glaciers in the vicinity of settlements (Ny-Ålesund, Hornsund, Longyearbyen, and Barentsburg, see Figure 1), due to their ease of access; even though these sites may not fully represent conditions across Svalbard. In addition, dedicated measurement campaigns have been conducted on the less accessible ice caps in the eastern parts of Svalbard (e.g., Ahlmann, 1933; Schytt, 1964; Pinglot et al., 2001). At some locations, these measurements have been maintained on a regular basis, and now provide invaluable data for assessing the climate-glacier interaction.
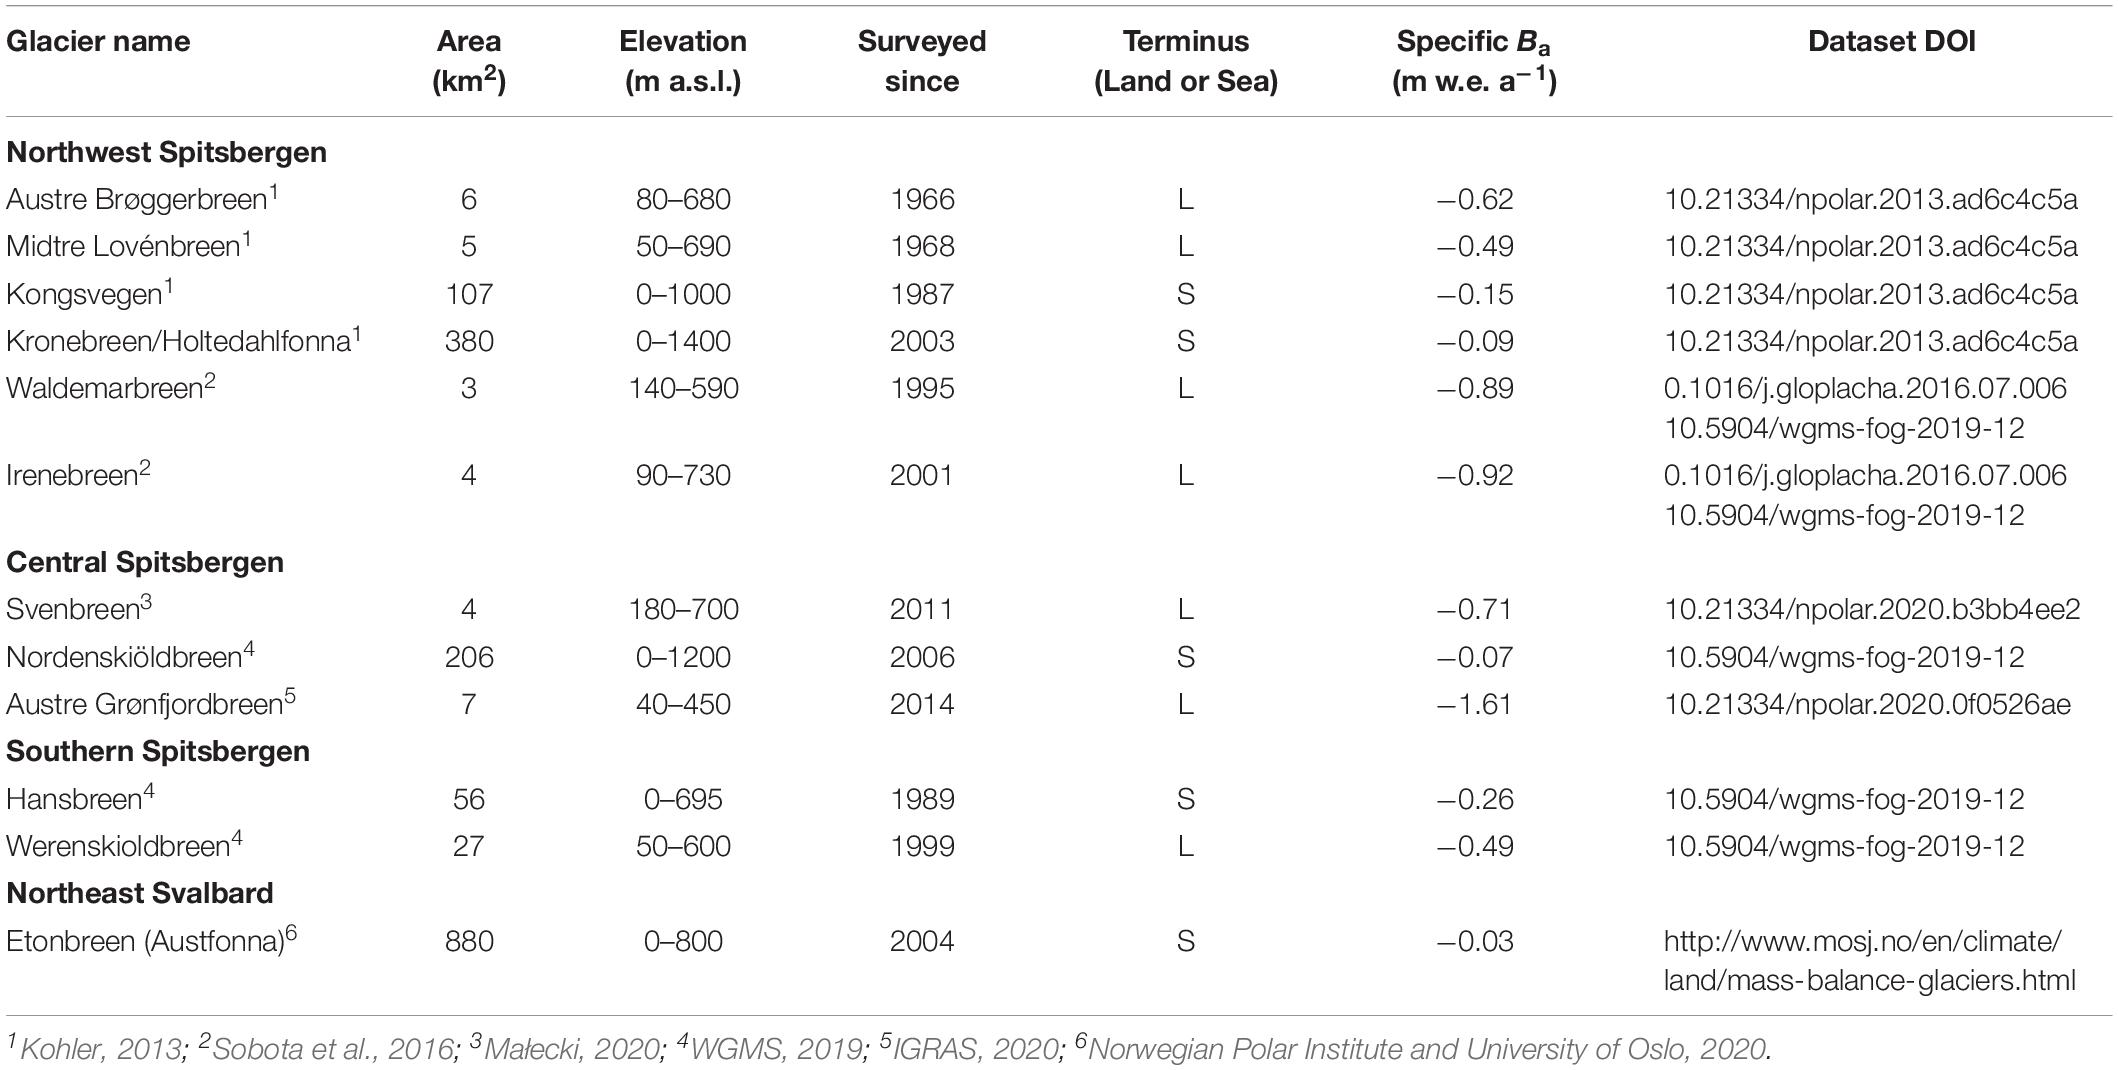
Table 1. List of currently surveyed glaciers with records of 5 years or longer, and their characteristics. Annual glacier mass balance Ba refers to the temporal average over 2000–2019.
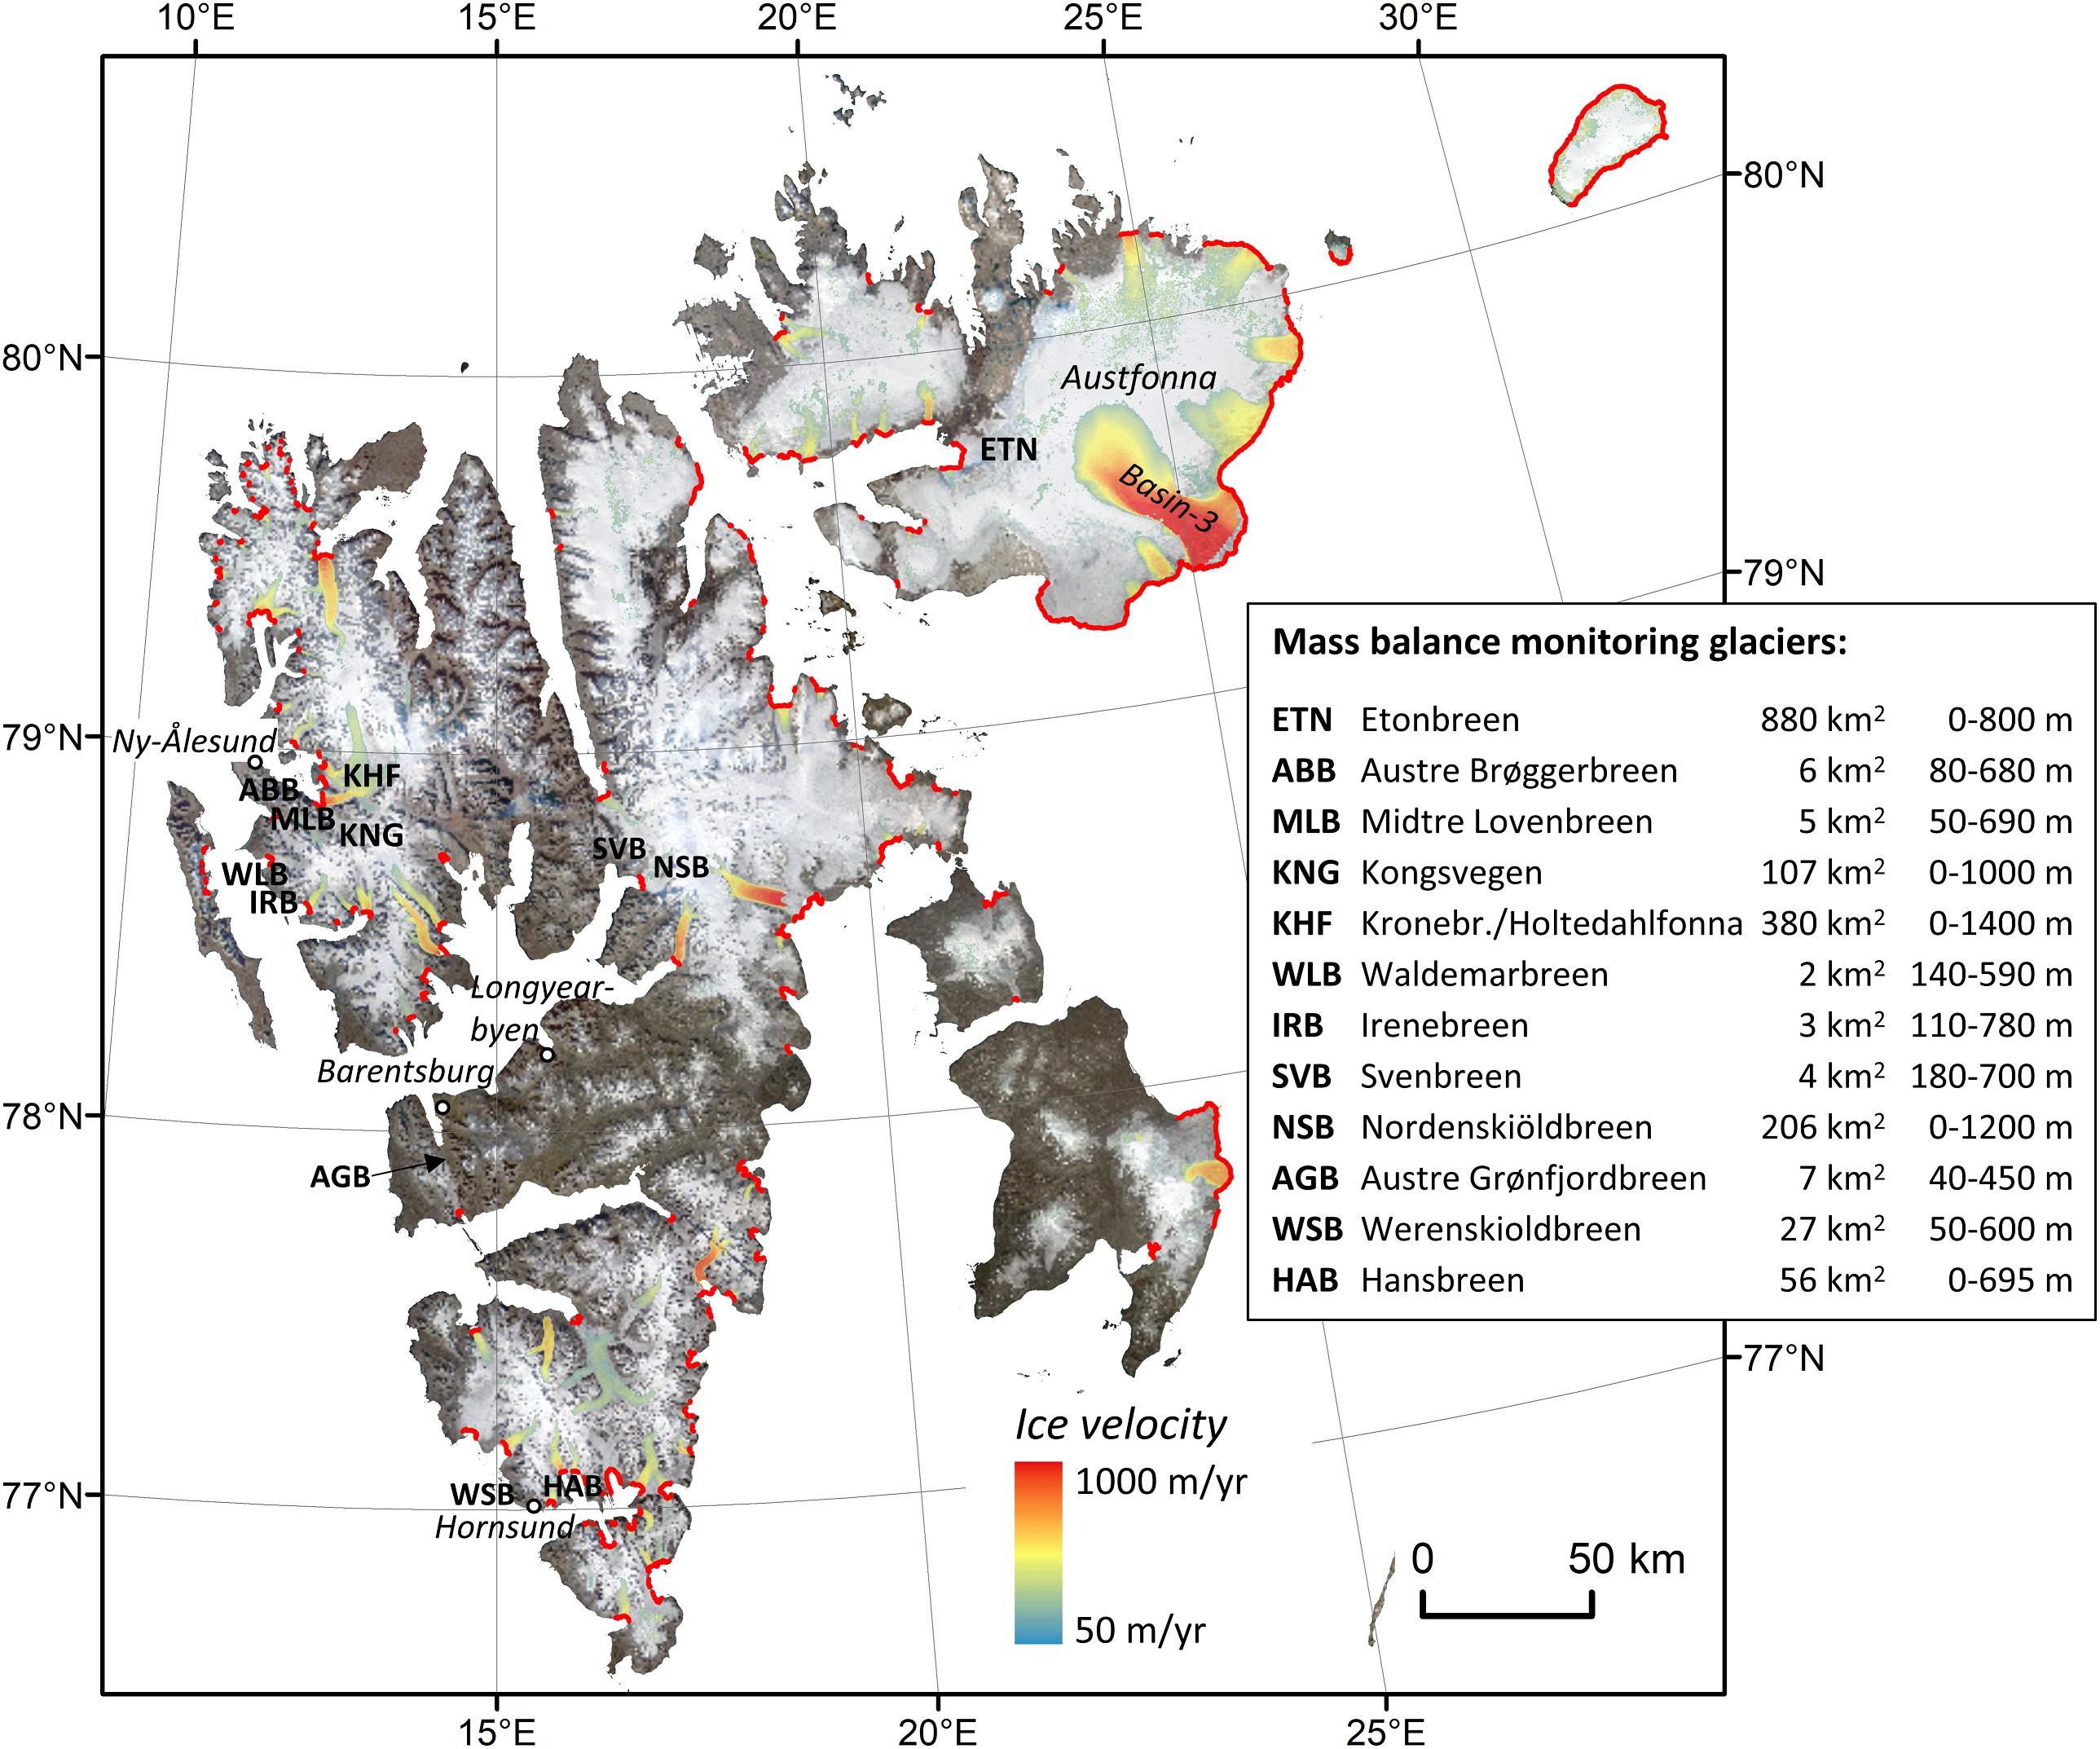
Figure 1. Overview map of Svalbard, showing glacier-covered areas (white) with color-shaded surface velocities for 2018 in cases where glaciers moved faster than 50 m a–1. Surface velocities have been retrieved from the NASA MEaSUREs ITS_LIVE project (Gardner et al., 2019). The red coastal lines show termini of tidewater glaciers from 2018. The background image is a Landsat-mosaic from toposvalbard.npolar.no. Abbreviated labels show the location of present glaciological mass balance monitoring glaciers on Svalbard, along with glacier area and elevation range.
Materials and Methods
Glaciological Mass Balance
The SMB refers to mass balance measured according to the glaciological method and is obtained from repeated field visits; it comprises end-of-winter snow-depth sounding, density measurements and repeated height readings of an array of stakes. Balance estimates are typically extrapolated over the entire glacier basin by determining the balance as function of elevation, and averaging them, applying weights determined from the distribution of glacier area as a function of elevation. This method quantifies the SMB, i.e., the mass changes at the surface of the glacier, exposed to the atmosphere, and within near-surface layers, but does not include internal mass changes below the last summer surface, frontal ablation due to calving and submarine melting at the front of tidewater glaciers (Cogley et al., 2011).
Although SMB has been measured at many glaciers, only a few records have been maintained for more than 10 years. Furthermore, many records have been held by the different institutions responsible for the programs, complicating representative assessments of a Svalbard-wide glacier mass balance. This situation has changed in recent years, with the increased focus on open access to the measurements, for instance through the World Glacier Monitoring Service1, the Svalbard-Jan Mayen Environmental Monitoring database2 or the SIOS data management system3.
Previous studies have used an average of available specific balance records and multiplied by the glacier-covered area to obtain estimates of climatic mass balance for all Svalbard glaciers (Hagen et al., 2003a; Dyurgerov and Meier, 2005; Ohmura, 2006; Radic and Hock, 2011). Radic and Hock (2011) used different size classes in their upscaling, while Zemp et al. (2019) used the more complete Randolph Glacier Inventory (Pfeffer et al., 2014). Marzeion et al. (2012, 2015) used glaciological mass balance records to calibrate a global model of climatic mass balance. All these approaches used the glaciological records that were then readily available, which were exclusively from smaller glaciers along the west coast of Svalbard; extrapolating these data to the entire archipelago is questionable. In an alternative approach, Hagen et al. (2003b) used climatic mass balance gradients for 13 different regions, each having a different equilibrium-line altitude, to derive a spatially distributed estimate, accounting for measurements and snowline observations from all parts of Svalbard.
Geodetic Mass Balance
The geodetic mass balance refers to the mass balance determined by geodetic methods. Differencing elevation data over the entire glacier area from two or more different times yields a volume change that is converted into a mass balance accounting for the bulk density of the volume change. Different studies have made different assumptions (e.g., Moholdt et al., 2010; Nuth et al., 2010) about the value of the bulk density, but all agree with the recommended value by Huss (2013) within the uncertainty range.
Elevation data can be from a variety of sources: surface surveys; contours from older maps; digital elevation models made photogrammetrically from aerial photographs or satellite imagery; or satellite altimeters. This balance estimate accounts for frontal ablation, hence represents the total mass balance.
The most striking change since the Hagen et al. (2003a, 2003b) assessments is the more widespread availability of different remote-sensing data. Since the 2000s, the number of sensor types and platforms has grown considerably, and the resolution, accuracy and frequency of measurements have increased. Access to these data has become easier for a growing number of glacier-relevant measurements, such as surface elevation changes, digital elevation models (DEM) as well as land-surface temperatures, albedo, and glacier facies (e.g., Moholdt et al., 2010; Nuth et al., 2010; Østby et al., 2014; Gray et al., 2015).
Digital elevation models differencing to estimate the glacier volume change of Svalbard glaciers is mainly based on DEMs from older aerial photographs from the 1930s onward (Nuth et al., 2007; Girod et al., 2018), and on various DEMs from satellite data, including both optical stereo and radar interferometry (Nuth et al., 2019). While these DEMs cover large parts of Svalbard, some DEMs are also available locally, such as from optical satellite stereo (Deschamps-Berger et al., 2019), airborne laser scanning, and opportunistic flights (Girod et al., 2017). In general, all these DEMs have improved over time in coverage and spatial resolution, and are currently quickly improving on temporal resolution, providing unprecedented views on regional variability. In contrast to other methods, geodetic mass balance includes frontal ablation by iceberg calving from marine-terminating glaciers. The number of large surges that have occurred since 2003 (e.g., Nathorstbreen, Austfonna Basin-3, Negribreen) underscores the need to capture these dynamic ice losses for volume change estimates, and thus the value of the DEM differencing method to compute Svalbard-wide total mass balance. While DEM differencing is typically performed over several years to decades, the increasing availability of optical and radar satellite imagery allows annual or even sub-seasonal glacier surface velocity fields, contributing to better constraints upon the magnitude and variability of calving fluxes (Dunse et al., 2015; Schellenberger et al., 2015). Despite the significantly improved possibility to estimate Svalbard’s geodetic mass balance, temporally and spatially consistent and unbiased DEMs are still rare. DEM differencing thus requires often advanced analysis to remove effects such as those caused by spatial shifts between DEMs, or to handle data gaps (Nuth and Kääb, 2011; McNabb et al., 2019).
ICES at laser altimetry provided a consistent set of elevations and elevation changes over 2003–2009 (Moholdt et al., 2010; Nuth et al., 2010). The follow-up mission ICES at-2, which was successfully launched in late 2018, is expected to provide improved data. The new instrument will yield elevation data at higher spatial density, coverage and accuracy than its predecessor (Abdalati et al., 2010). Laser altimetry requires clear sky conditions, but offers high elevation accuracy, typically better than 20 cm (Shuman et al., 2006). While ICES at elevation measurements had a relatively large spacing (>150 m along ground track, and >10 km across track), which required special schemes to extrapolate elevation changes to the entire region, ICES at-2 tracks are much denser (<1 m along track, <2 km across track) and will improve regional volume change estimates.
Radar altimetry (CryoSat-2) (McMillan et al., 2014; Gray et al., 2015) is independent of cloud coverage and has high spatial and temporal coverage. Radar backscatter is affected by signal penetration into snow and firn, and some effort is necessary to better understand and quantify this effect. The spatial coverage of radar returns and thus ground elevation measurements is highly variable and depends on topography as it is determined by the point of closest approach (POCA). Interferometric processing (SARin) enables a more complete coverage; known as SWATH processing, the analysis takes into account the entire swath illuminated by the satellite radar beam during one overpass (Gray et al., 2013; Foresta et al., 2016, 2018; Gourmelen et al., 2018).
Gravimetry
A direct method for estimating mass change by gravimetry comes from the GRACE (Gravity Recovery and Climate Experiment) satellites, which mapped the time-varying gravity field of the Earth over the period 2002–2017. Spaceborne gravimetry allows monitoring mass changes, which, if corrected for a range of other gravitational effects, can provide information on regional glacier-related mass changes at monthly resolution (Wouters et al., 2008, 2019; Mémin et al., 2011; Matsuo and Heki, 2013). However, the GRACE footprint is large, typically >100,000 km2 (Wouters et al., 2019), and so just a few points already cover a region the size of Svalbard. Furthermore, corrections must be made for ongoing and long-term isostatic rebound, as well as for unmixing the sea and land components of the combined gravimetric signal.
Modeling
Mass balance models, forced either by meteorological observations or output from regional climate models, evaluate the surface energy balance to compute the climatic mass balance. The most complete models contain a subsurface routine to account for the impact of water storage and refreezing on the mass and energy budgets. Field data are used to calibrate model parameters and to validate model output.
This approach typically requires two steps: the first is to derive meteorological input at appropriate spatial and temporal resolution and the second is to calculate CMB from this input.
Meteorological Forcing
As part of global glacier change estimates, some studies have either used globally gridded meteorological observations (Marzeion et al., 2012, 2015) or output from global climate models and reanalyses (Radic and Hock, 2011). These global products typically have coarse spatial resolution (0.5–1.0° or more), and therefore may be less representative for surface conditions in Svalbard. CMB processes vary at scales of a few km or less, due to orographic enhancement of precipitation, wind redistribution of snow, or topographically induced temperature variability. Models with global coverage typically do not resolve these scales.
Typically, Svalbard-specific studies have applied some refinement of reanalyses to adequately resolve these fines spatial scales. One way is to dynamically downscale global fields using a high-resolution, regional climate model. This method is computationally expensive and often compromises have to be made to keep the cost low, by limiting either the spatial resolution (Lang et al., 2015) or the modeling period (Aas et al., 2016).
Another approach is statistical downscaling: Möller et al. (2016) and Van Pelt et al. (2019) employed empirical relations to correct for the bias between intermediate-resolution regional climate model variables and corresponding local observations. The application of these methods to areas and periods not covered by observations implicitly assumes that the empirical relations are transferable in both space and time.
Finally, there is hybrid downscaling. Østby et al. (2017) employed simplified dynamical downscaling for some variables, whereas other variables were derived from spatio-temporal interpolation of coarsely resolved reanalysis data to the desired scale of the high-resolution grid used for CMB simulation (Schuler and Østby, 2020).
The performance of downscaling is usually assessed by comparison to meteorological measurements; however, there are only a few meteorological stations in Svalbard, and most of these located at low elevations in the more accessible fjords along the west coast of Spitsbergen. Therefore, the operational records are biased and are not representative for large parts of the mountainous archipelago. The CMB modeling studies make partial use of glaciological data from higher elevations and from eastern regions (Aas et al., 2016; Østby et al., 2017; Möller and Kohler, 2018; Van Pelt et al., 2019), not only to evaluate the performance of the CMB model but also to evaluate the downscaling of meteorological variables. In less rough topography, such as the smooth surface of the Austfonna ice cap, snow distribution on the surface is largely dominated by the spatial pattern of precipitation (Taurisano et al., 2007). Hence, measurements of snow accumulation at the end of the winter represent a little used opportunity to evaluate the performance of precipitation models on a seasonal timescale.
The availability of global atmospheric reanalysis data at improved spatial and temporal resolution, and improved consistency with available observations (e.g., Schuler and Østby, 2020), has sparked the application of gap-free meteorologically forced climatic mass balance models that cover the entire archipelago (e.g., Østby et al., 2017; Van Pelt et al., 2019). These models either directly incorporate local measurements or have been optimized to ensure agreement between simulated and observed values, and therefore play an important role in synthesizing the wealth of information that has become available.
Climatic Mass Balance (CMB) Models
A variety of different methods is available to compute CMB from meteorological forcing, ranging from simplified approaches that require extensive calibration, to physically based, coupled models of surface energy balance and snowpack evolution. Correspondingly, the output of physically based models provide a multitude of results that correspond to observable quantities. On the other hand, while the simplest models provide spatially and temporally integrated quantities like glacier-wide, annual climatic mass balance, they are potentially afflicted with considerable uncertainty due to compensating effects and biases.
The potential of using multiple and spatially distributed data sources for evaluating different aspects of model results has only been exploited in a few studies (e.g., Aas et al., 2016). Schuler et al. (2007) suggested that using multiple criteria was helpful in constraining parameter values for a temperature-index based CMB model of Austfonna. Rye et al. (2012) applied a formal procedure in multi-objective calibration of a CMB model of Midtre Lovenbreen, but used only different representations of the same underlying data as different objectives. Möller et al. (2011) directly used satellite-derived albedo and cloud cover in modeling. Østby et al. (2013) applied a Monte-Carlo scheme to determine a set of best-performing parameter combinations that render results within the uncertainties of measured CMB, land-surface temperature, albedo, and subsurface snow temperature distributions. Van Pelt et al. (2019) used a combination of stake and weather station data to calibrate the downscaling of precipitation, as well as energy balance parameters (Małecki, 2013). Małecki (2016) More sophisticated, formal data-assimilation methods, for instance Ensemble Kalman-filtering techniques (Małecki, 2020), have been applied in snow modeling with promising results (e.g., Aalstad et al., 2018), but this approach has not yet been adopted in glacier mass-balance modeling.
Frontal Ablation
Frontal ablation comprises both calving of ice at the glacier front as well as underwater melting. It is usually quantified by determining the mass flux through a gate close to the marine glacier terminus and considering mass changes down-glacier of this gate. This requires knowledge of the ice flow velocity, the cross-sectional area of the gate, as well as the advance or retreat of the glacier front and the CMB down-glacier from the gate. These quantities can be determined using satellite remote sensing, which provides information over large, often inaccessible areas. However, ice thickness along the flux gate is often not well determined, thus contributing to uncertainty in estimating frontal ablation.
Nuth et al. (2012) have determined the long-term mass change due to frontal ablation from the residual between the geodetic mass balance and simulated CMB. Their estimate applies to a single glacier, Kronebreen, but, in principle, this method could be extended to comprise all of Svalbard’s tidewater glaciers.
Combined Approaches
Finally, some studies fused Svalbard-wide estimates with glaciological records to obtain annual resolution estimates of geodetic mass balance (Box et al., 2018; Zemp et al., 2019) or to obtain spatial variability based on satellite-elevation differencing (Gardner et al., 2013; Wouters et al., 2019).
Results
Glaciological Mass Balance
Available long-term glaciological mass balance records (Figure 2) reveal a complex picture of different glacier evolution, with clear differences between small glaciers (<10 km2) that are rapidly losing mass (Austre Brøggerbreen, Midtre Lovénbreen, Waldemarbreen, Irenebreen, Svenbreen, and Austre Grønfjordbreen) and larger glaciers (>50 km2) like Kongsvegen, Kronebreen-Holtedahlfonna, Nordenskiöldbreen, Etonbreen, and Hansbreen, which are typically outlets from larger contiguous ice masses (ice fields and ice caps). The steeper slope of the cumulative mass balances shows that glaciers in southern and central Spitsbergen (Werenskioldbreen, Svenbreen, and Austre Grønfjordbreen) have more negative SMB than those located in NW Svalbard (Austre Brøggerbreen and Midtre Lovénbreen). Similarly, larger glaciers such as Hansbreen are losing mass more rapidly than at Kongsvegen, Kronebreen-Holtedahlfonna, Nordenskiöldbreen, or Etonbreen. The latter is an outlet from Austfonna and shows SMB conditions close to zero with little variability, although with a more negative trend after 2012.
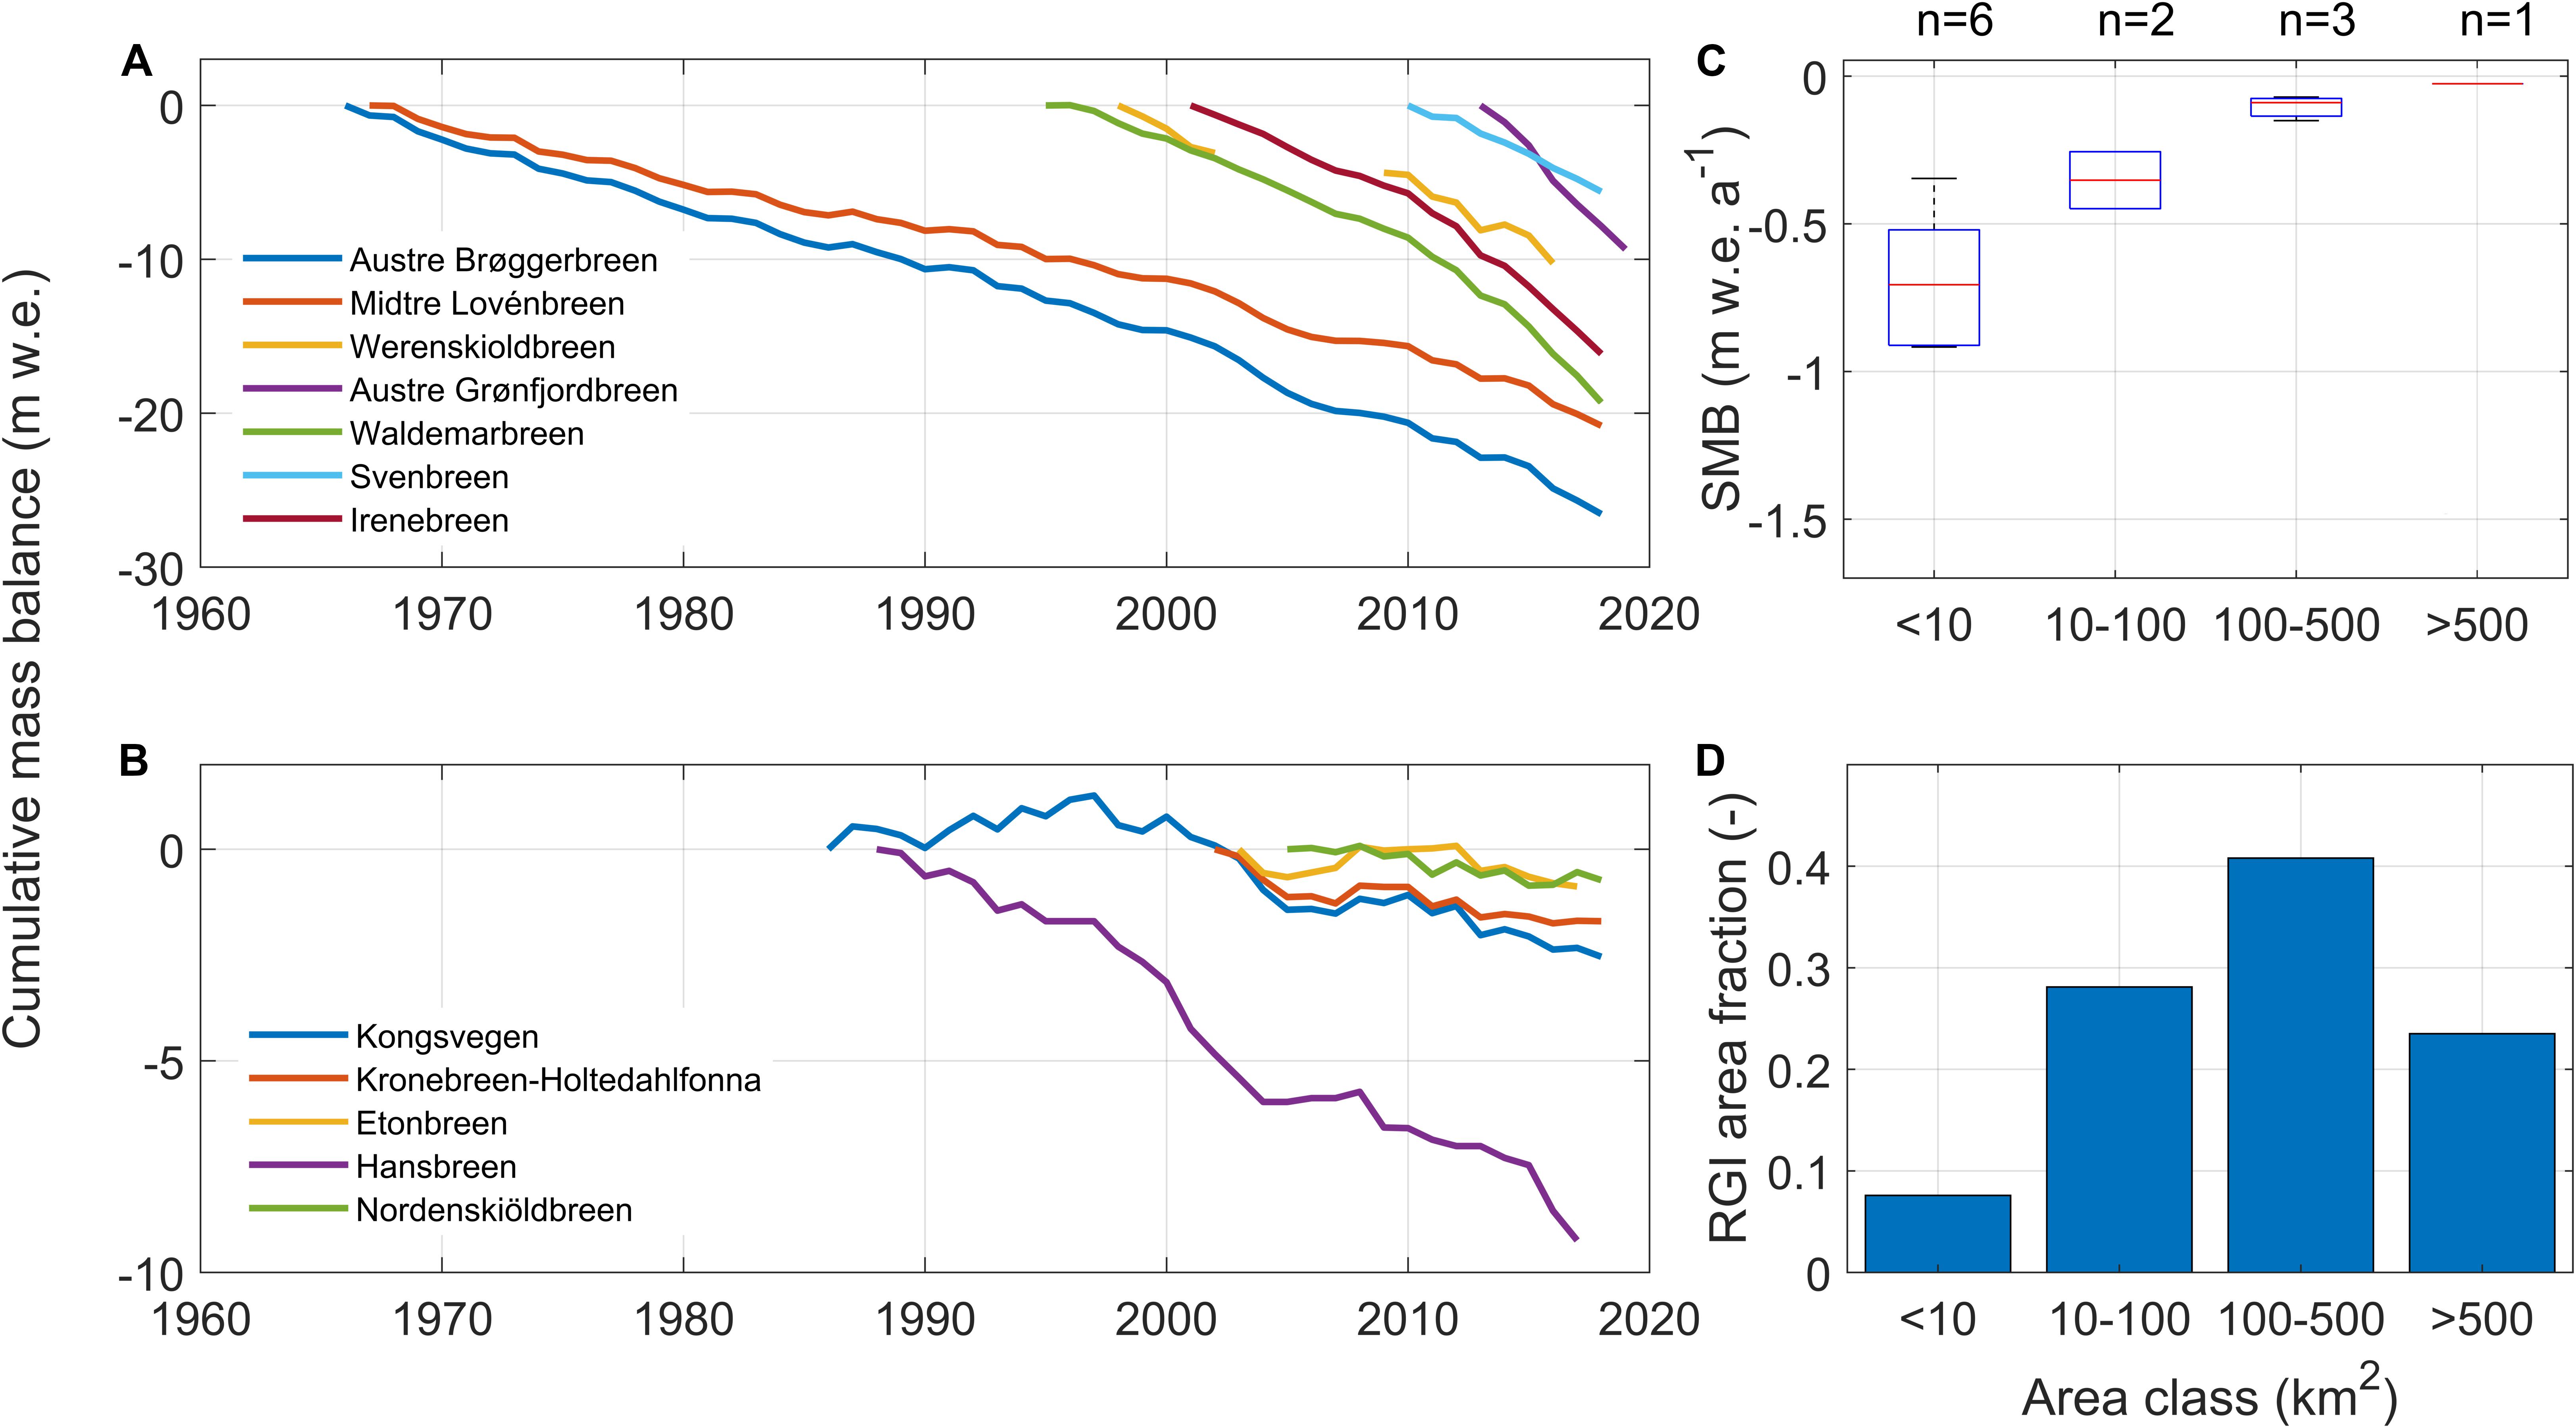
Figure 2. Cumulative specific, glaciological mass balance (excluding frontal ablation) from in situ measurements at selected Svalbard glaciers, for glaciers smaller (A) and larger (B) than 50 km2. Note the different scaling of the y-axes. (C) Boxplots of annual specific SMB averaged over the period since 2000 for four different area classes. (D) Fractions of glacier area occupied by glaciers in respective area classes, relative to the entire glacier area, for all Svalbard glaciers in the Randolph Glacier Inventory (Pfeffer et al., 2014); n indicates the number of surveyed glaciers in each area class.
Different slopes of the cumulative SMB in Figures 2A,B indicate a relationship between SMB and area of the respective glacier, which we illustrate in Figure 2C for four selected area classes. The relationship is such that smaller glaciers lose mass at much higher rates than larger glaciers due to their hypsometric distributions of area with elevation. A qualitatively similar relationship between the accumulation area ratio and glacier area is found for all glaciers in the Svalbard (see Supplementary Material S1), suggesting that the area-SMB relation is not only an artifact caused by the limited number of samples (n = 12). This area–SMB relation allows for upscaling of the 12 individual glaciological records to the entire glacier-covered area of Svalbard. In contrast to previous studies that have averaged all glaciological mass balance values and multiplied by the glacier area (either for all of Svalbard or sub-regions), we exploit the relationship between CMB and glacier size and apply it to each glacier of the Svalbard glacier database (Nuth et al., 2013; König et al., 2014) (Figure 2D). In this way, we obtain a new SMB estimate for Svalbard glaciers of −7 ± 2.1 Gt a–1 (2000–2019), the uncertainty of which has been derived from the 25 and 75 percentiles of the SMB distributions in each class (blue boxes in Figure 2C). The mass loss of the individual area classes amounts to −2.1, −3.3, −1.4, and −0.2 Gt a–1 for the >10, 10–100, 100–500, and <500 km2 classes, respectively. Interestingly, the number of surveyed glaciers for each area class demonstrates a bias of the monitoring programs toward logistically simpler, small glaciers. About half of the selected records are from glaciers smaller than 10 km2; glaciers of that size occupy less than 10% of the total glacier-covered area, whereas glaciers in the two largest area classes together comprise 65% of the glacier-covered area but are monitored by only one third of the glaciological mass balance programs. The longest records are from small glaciers, and so the representativeness issue may explain the bias of previous assessments that were based on upscaling measurements from small glaciers only (Supplementary Materials S1, S2).
Geodetic Mass Balance
Nuth et al. (2010) compared satellite altimetry data from the ICES at mission for the period 2003–2007 to older topographic maps and digital elevation models for different epochs (1965–1990). Because the ICES at tracks are relatively sparse, they extrapolated along-track changes to the larger regions using glacier hypsometry. Significant thinning was detected at the lower elevations of most glaciers, and either slight thinning or thickening in the accumulation areas, except for glaciers that surged during the observation period; these glaciers showed thickening in the ablation area and thinning in the accumulation areas. However, the overall balance was very negative at −0.36 m w.e. a–1, corresponding to −9.7 Gt a–1 (Table 2). As with the modeling results, the most negative geodetic balances are found in the south and the least negative balances in the northeast.
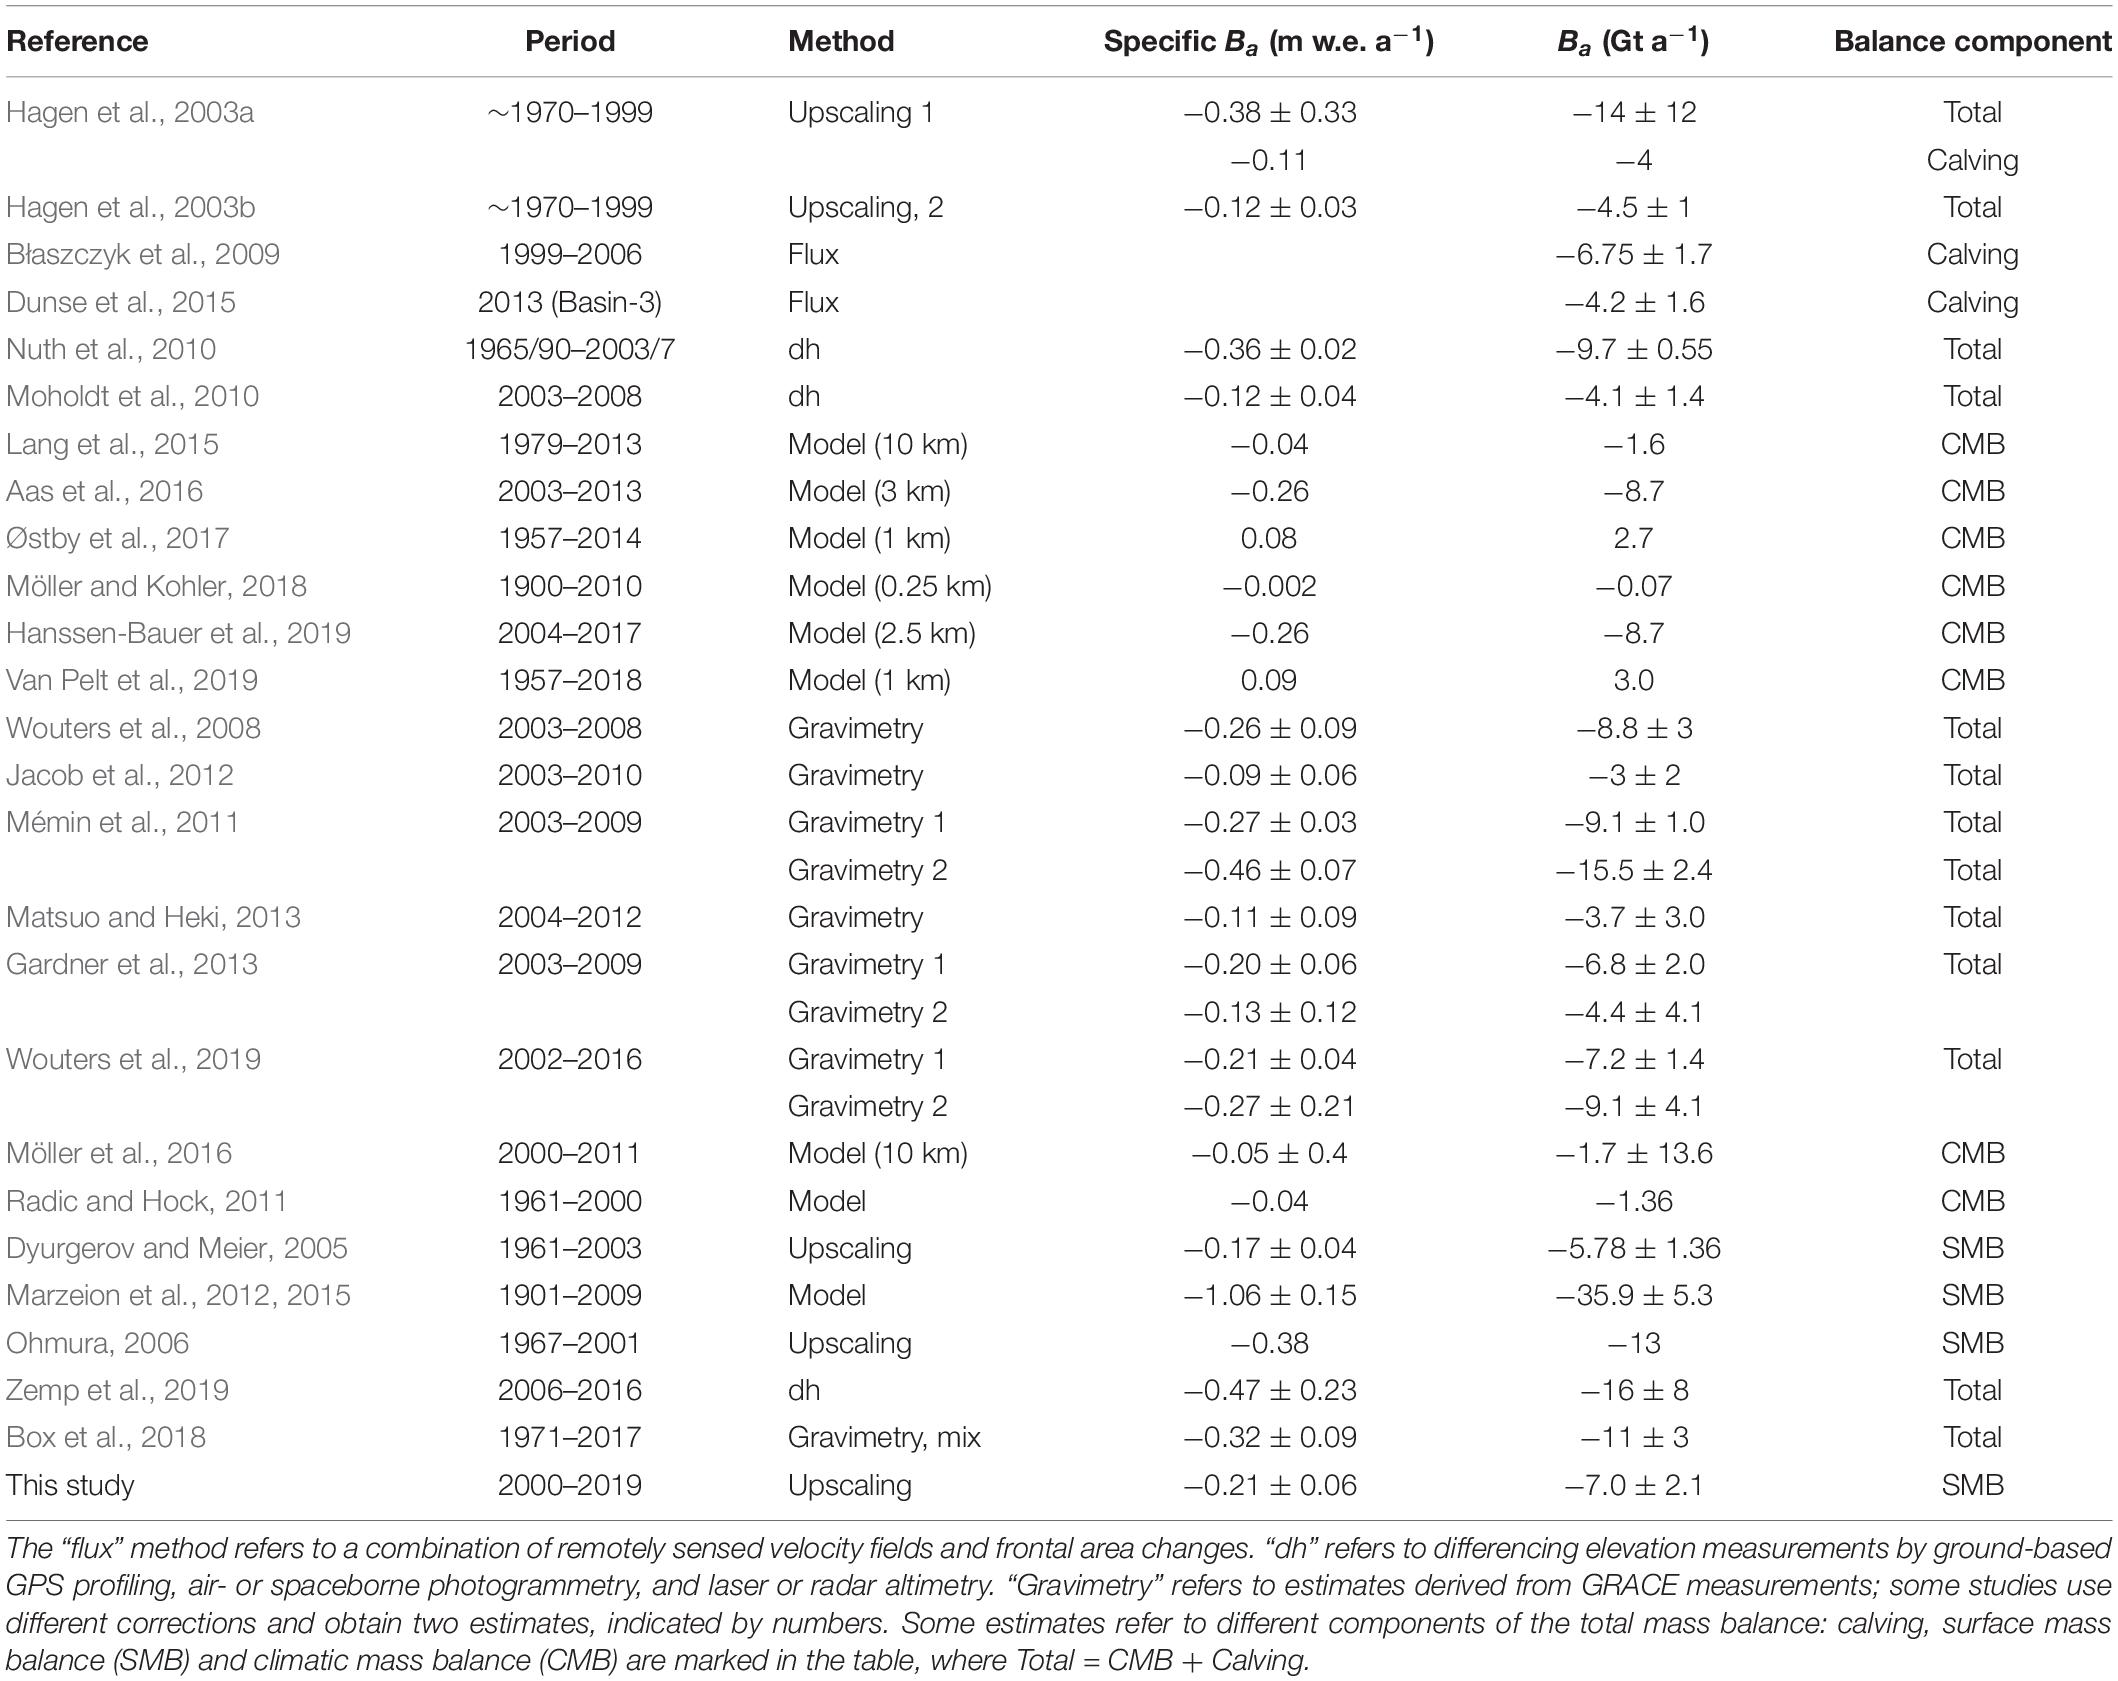
Table 2. Comparison of several Svalbard-wide estimates of annual glacier mass balance Ba using different methods.
Moholdt et al. (2010) determined elevation changes along the ICES at tracks for the period 2003–2008, extrapolating these changes to the remaining glacier area using the same hypsometric approach as Nuth et al. (2010) to yield a Svalbard-wide estimate of −0.12 m w.e. a–1, or −4.3 Gt a–1. They found that most regions experienced low-elevation thinning and high-elevation balance or thickening, and that the largest ice losses occurred in the west and south, while northeastern Spitsbergen and the Austfonna ice cap slightly gained mass. This general pattern, however, does not apply for central Spitsbergen, with its mostly small alpine glaciers. Małecki (2016) demonstrated that glacier thinning here has been occurring at all elevations up to 1,000 m asl, for the period 1990–2011.
Analysis of older maps and modern DEMs (Kohler et al., 2007) shows that mass loss rates at Midtre Lovénbreen and Slakbreen, appear to have accelerated. For Midtre Lovénbreen, thinning rates for 2003–2005, were more than four times larger than the average for the first measurement period 1936–1962. On Slakbreen, thinning rates for the period 1990–2003 were more than four times that of the period 1961–1977. James et al. (2012) and Małecki (2013) found a similar increase in thinning rates for other glaciers around Svalbard, particularly in high-elevation areas. More pronounced thinning has been noted for Hansbreen and Hornbreen for two recent periods (2011–2015 and 2015–2017), based on differencing elevations obtained by photogrammetry using high-resolution satellite images (Błaszczyk et al., 2019). The surge of Basin 3 of Austfonna led to significant mass loss that has been quantified by McMillan et al. (2014) using repeat altimetry. This increasingly negative mass balance trend is consistent with both worldwide glacier trends as well as developments in the Arctic (Kaser et al., 2006).
Gravimetry
While satellite gravimetry provides an absolute measure of the total mass change in the region, the spatial resolution of GRACE is typically in the order of 0.5–1.0° (Wouters et al., 2019) and so determination of glacier mass balance is challenging. A number of studies (Mémin et al., 2011; Jacob et al., 2012; Matsuo and Heki, 2013; Wouters et al., 2019) working with the same dataset but covering slightly different periods, and using different data filtering methods, obtain a range of values for the total mass loss (Table 1). However, the main conclusion one can reach from the body of GRACE analyses is that all find a negative total mass balance for the Svalbard archipelago, with values ranging from −0.46 to −0.09 m w.e. a–1, or −15.5 to −3.0 Gt a–1 (Table 2), even if the error range for some of the estimates extends them into the positive territory. Nevertheless, even though the reported range of absolute mass changes is large, gravimetry may still provide valuable information on the temporal evolution. The most recent regional estimate, covering the entire GRACE mission from 2002 to 2016, indicates an average total mass balance of −7.2 ± 1.4 Gt a–1 (Wouters et al., 2019).
Mass Balance Modeling
Compared to the first Svalbard-wide assessments (Hagen et al., 2003a, b), numerical modeling now plays an increasingly prominent role in glacier studies on Svalbard. Stimulated by the growing availability of observational data for model optimization, models have been increasingly used to simulate climatic mass balance (e.g., Lang et al., 2015; Aas et al., 2016; Østby et al., 2017; Möller and Kohler, 2018; Van Pelt et al., 2019) and ice flow (e.g., Dunse et al., 2011; Gladstone et al., 2014; Schäfer et al., 2014; Vallot et al., 2017; Gong et al., 2018). Modeled CMB is spatially complete and covers the entire glacierized area of Svalbard, providing information at relatively high temporal resolution (sub-daily to hourly), depending on the meteorological forcing. These products can therefore be understood as spatial-temporal interpolators, and have great potential to synthesize a large amount of individual measurements for regional assessments.
Climatic mass balance models have been used both inline, coupled to regional climate models (Lang et al., 2015; Aas et al., 2016), and offline, forced by downscaled meteorological variables. Offline applications have used an entire spectrum of downscaling procedures, ranging from statistical relations (Möller and Kohler, 2018), intermediately complex methods (Østby et al., 2017; Van Pelt et al., 2019), and dynamical downscaling (Hanssen-Bauer et al., 2019). Temporal coverage varies and is either limited by computational cost or by availability of atmospheric reanalysis data. For instance, ERA-interim (Dee et al., 2011) reanalysis data are available since 1979, ERA-40 (Uppala et al., 2005) start in 1957, allowing longer-term simulations (Østby et al., 2017; Van Pelt et al., 2019), and the ERA-20C reanalysis dataset (Poli et al., 2016) pushes the limit even back to 1900 (Möller and Kohler, 2018).
To various degrees, all model studies so far have used an extensive set of measurements from mass balance stakes, AWSs, and firn cores across Svalbard for calibration and validation. Table 2 provides an overview over the different applications, their temporal coverage as well as spatial resolution. All models reveal a distinctive pattern, ranging from negative CMB in southern Spitsbergen to more positive values in northeast Svalbard. This pattern reflects the gradient of air temperature (Hanssen-Bauer et al., 2019), and is also observed in the remotely sensed geodetic mass balance estimates (e.g., Nuth et al., 2010). Over the long-term (>50 years), all studies indicate a slightly positive CMB, but all show a clearly negative CMB for more recent periods, especially after 2000 (Figure 3). Although there is agreement on a tendency toward more negative CMB, trend analysis reveals its significance is largest in southern Svalbard, contributing to a Svalbard-wide trend of −0.06 m w.e. a–1 decade–1 (Van Pelt et al., 2019). The simulated time series support the view that most of the variability of annual CMB is largely due to variations in summer, whereas winter CMB is more stable. Both Østby et al. (2017) and Van Pelt et al. (2019) find that increased melt and reduced refreezing leads to doubling in glacier runoff over the simulation period. In addition, Østby et al. (2017) find a strong correlation between CMB and summer temperature.
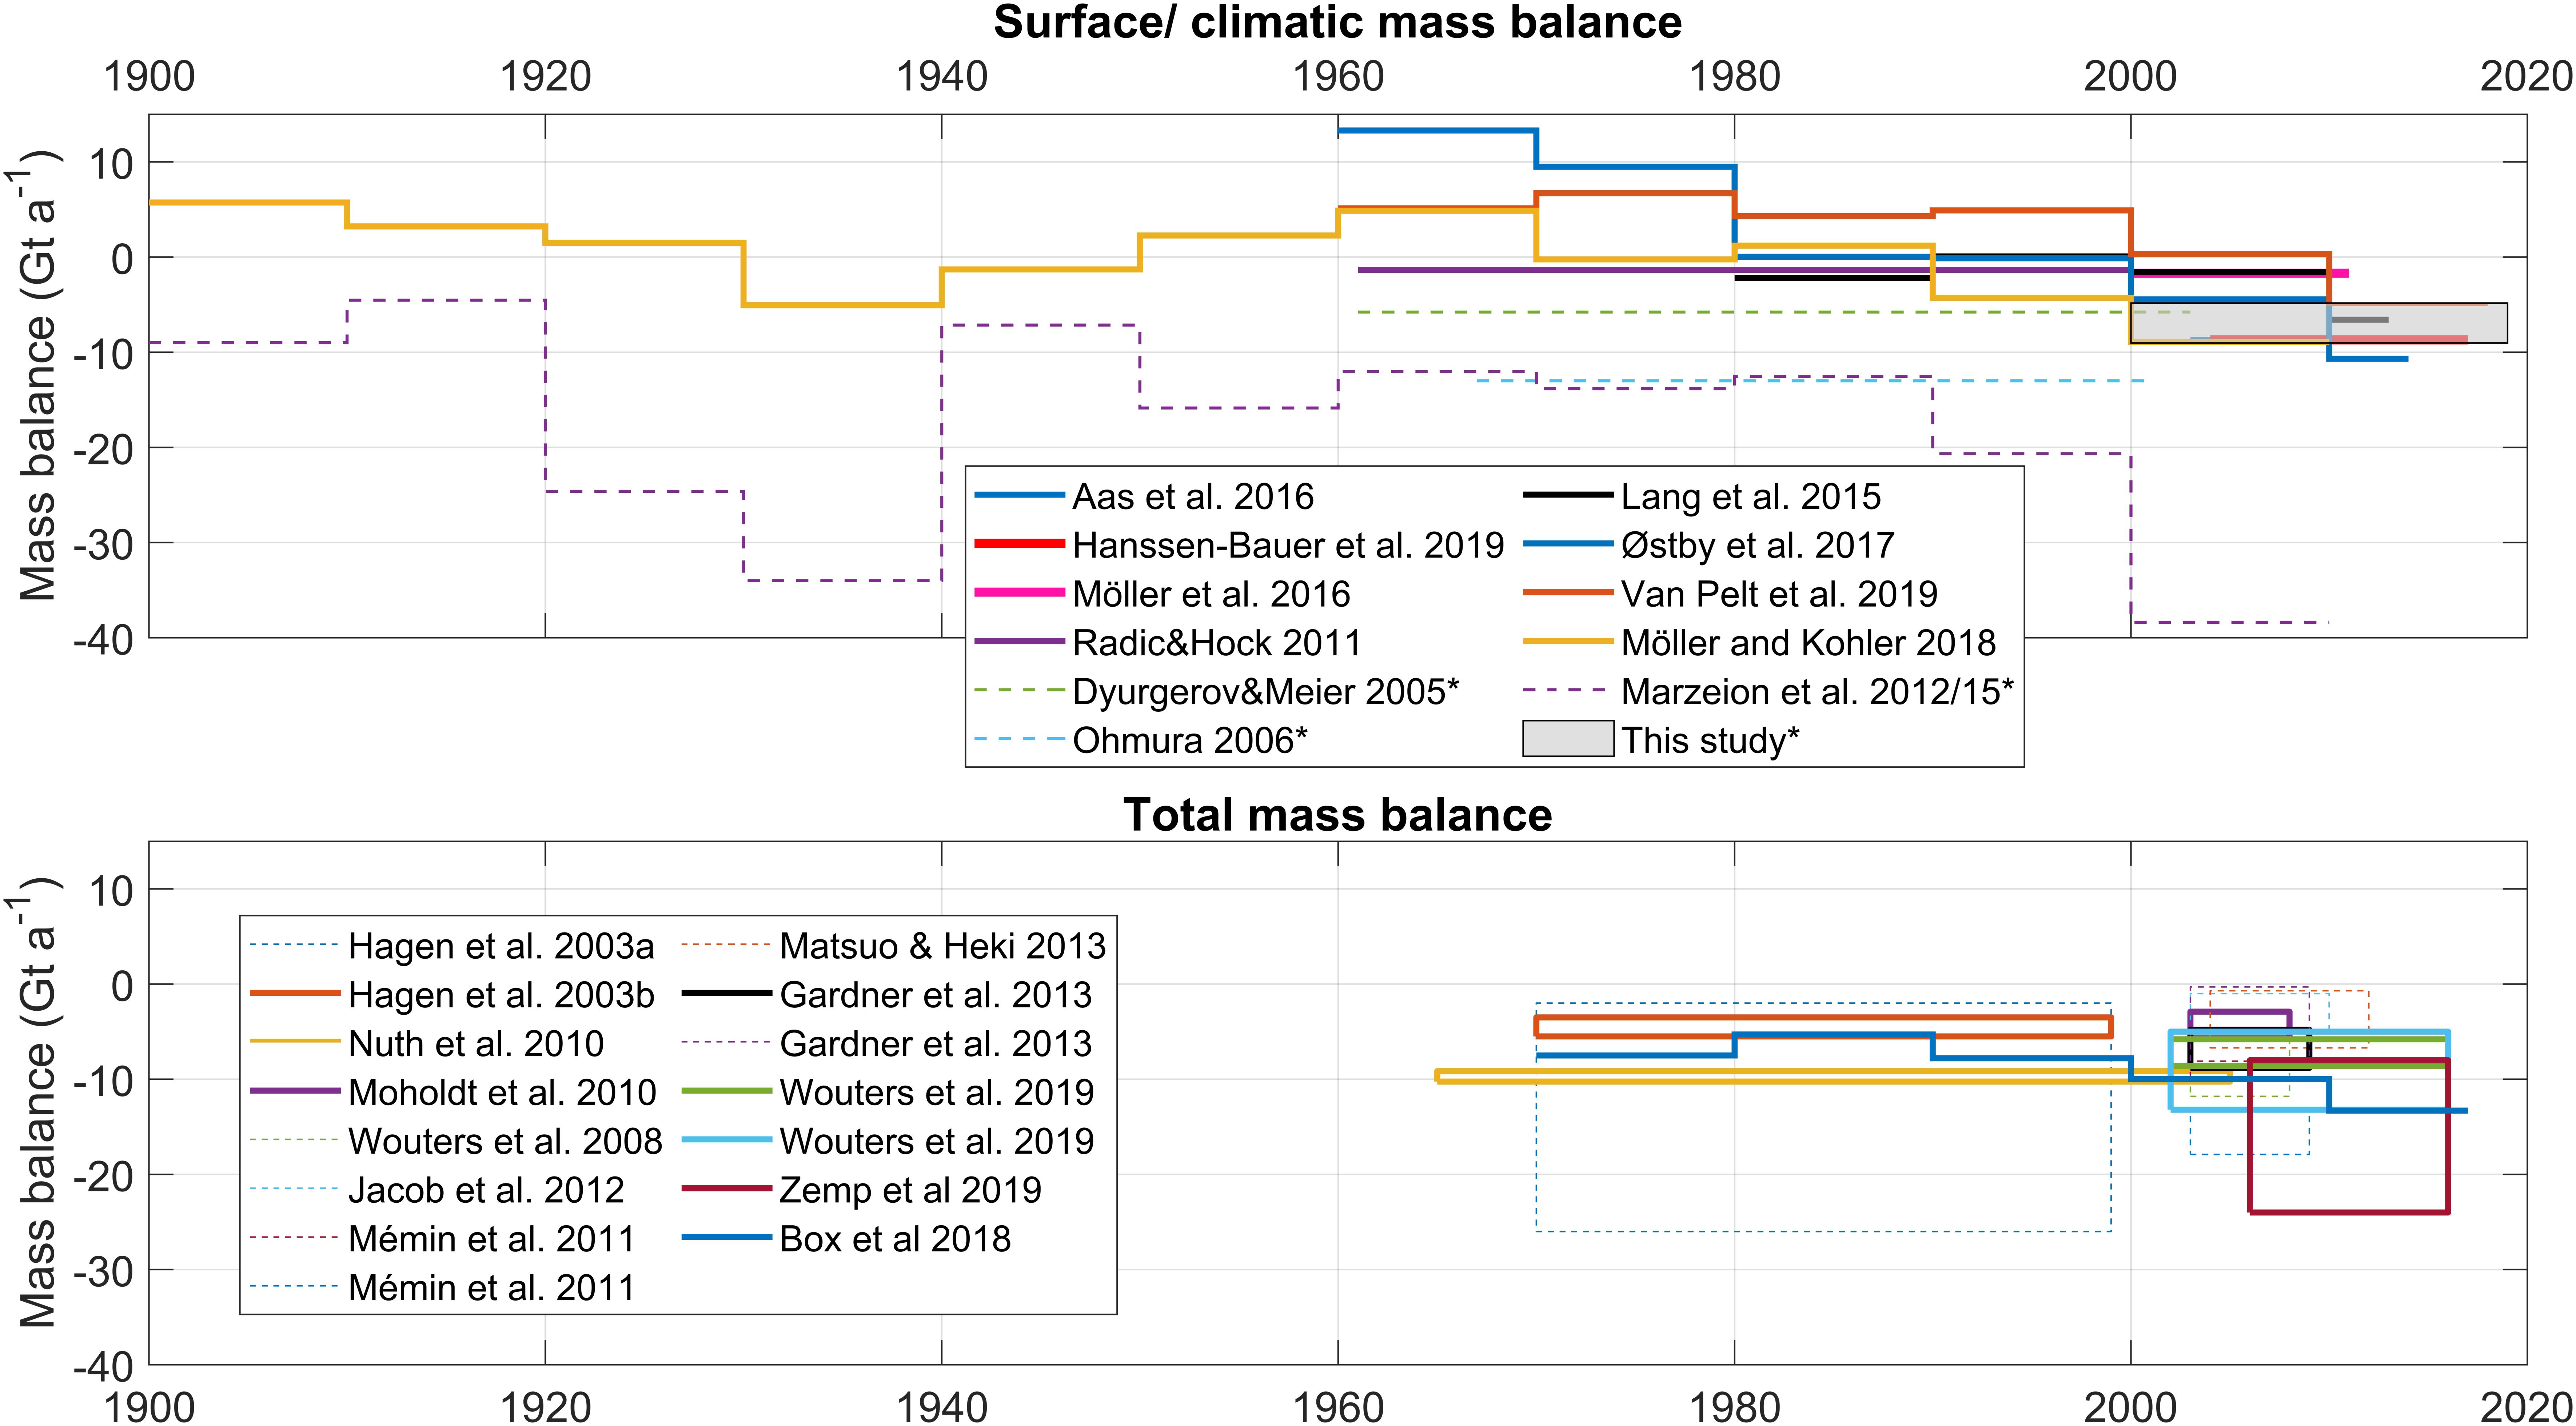
Figure 3. Overview over different estimates of Svalbard glacier mass balance illustrating the period of coverage and related uncertainties of individual studies. The top panel shows estimates of surface mass balance and climatic mass balance, derived from upscaling of available in situ records and model simulations, respectively. Our new SMB estimate based on size-specific upscaling of measurements is shown as a gray box. The asterisks in the legend mark those estimates that refer to SMB whereas the others refer to CMB. The bottom panel illustrates estimates of total mass balance, based on geodetic and gravimetric methods. Most GRACE studies published two different estimates based on different processing of the underlying gravimetry data. Line styles indicate agreement with criteria defined in the text (solid = included in reconciliation, dashed = not included).
For all of Svalbard glaciers, specific refreezing amounts to about 0.22 m w.e. a–1, i.e., corresponding to about 25% of the annual accumulation (Aas et al., 2016; Østby et al., 2017; Van Pelt et al., 2019). There is general agreement about the magnitude of refreezing in the different studies that quantify it, except for Lang et al. (2015), who come up with a considerably larger value of approximately 0.35 m w.e. a–1. This presumably compensates for the reduced precipitation due to their lower model resolution (10 km), such that the CMB agrees with other studies. Refreezing generally decreases with time (Østby et al., 2017; Van Pelt et al., 2019) due to general warming and associated decrease in firn volume. However, these latter two studies do not show an obvious tipping point when increased refreezing due to increased meltwater production changes over to reduced refreezing caused by the reduction of the firn volume. Although this presumably has happened on Svalbard glaciers, the transition may have been smoother than that observed at the peripheral glaciers surrounding the Greenland ice sheet (Noel et al., 2017), and in addition, it may be masked by large year-to-year variability.
Frontal Ablation
The Błaszczyk et al. (2009) calving estimate is the only available study quantifying frontal ablation of all Svalbard glaciers. It is based on glacier flow velocities and front position changes extracted from ASTER images acquired from 2000 to 2006. However, due to its close dependence on glacier dynamics and ocean temperature (Luckman et al., 2015), frontal ablation varies over many time scales: seasonal, annual and especially, from irregularly occurring surges. Thus, the Błaszczyk et al. (2009) estimate represents a composite of snapshots over the 7-year period, rather than a temporal mean. The variability imposed by glacier surging can be considerable. For example, Dunse et al. (2015) quantified the sea-level effect of a single surge in Austfonna over the period 2012–2013, and found that the surge contributed 7 Gt a–1, approximately matching the Błaszczyk et al. (2009) estimate, hence doubling the sea-level contribution per year of entire Svalbard during the surge period. When the only available estimate of frontal ablation from Svalbard glaciers (Błaszczyk et al., 2009) of nearly −7 Gt a–1 is added to the different CMB results, the overall Svalbard total mass balance becomes clearly negative (Table 2 and Figure 3).
In response to climatically induced mass loss, the flux of ice toward the glacier terminus decreases and marine termini can quickly retreat. Many areas around Svalbard are experiencing rapid ice cliff recessions (tens to hundreds of meters annually), which significantly affects the marine physical environment and ecosystem (Torsvik et al., 2019). A special case is in Hornsund: bed elevations for the Hornbreen – Hambergbreen glacier system are approximately 40 m below sea level, such that a new strait between the Greenland Sea and the Barents Sea is expected within the next two to three decades, once the glacier termini have retreated there (Grabiec et al., 2018).
Synthesis
The spatial coverage of available glaciological mass balance measurements has improved over the past 20 years, especially with the inclusion of data from Austfonna, Nordenskiöldbreen, and Svenbreen, filling gaps both in terms of glacier types and location. Therefore, the presently available data are more representative for Svalbard than the pre-2000 record that was biased toward smaller glaciers in the vicinity of settlements in western Spitsbergen. For a representative picture of Svalbard-wide SMB, it is therefore imperative to have adequate spatial sampling and include records from the logistically more challenging eastern parts of Svalbard. CMB modeling is a valuable tool to link these measurements and to provide a gap-free product with high spatial and temporal resolution.
Glaciologically determined SMB and CMB differ where internal accumulation takes place below the last summer horizon. Locally, this difference may be significant and amount up to one third of total refreezing (Van Pelt and Kohler, 2015; Østby et al., 2017), but very few studies have determined internal accumulation. Internal accumulation is largest in areas of deep firn and on a glacier-wide scale or even regional scale, its effects may be less significant. Østby et al. (2017) are the only to report internal accumulation for all of Svalbard; their estimate for the years after 2000 is about 0.05 m w.e. a–1, about the same magnitude as the uncertainty of our SMB estimate. Therefore, and as illustrated in Figure 3, SMB and CMB do not significantly differ, and for practical purposes, in the following synthesis, we treat both quantities in a single category (i.e., CMB).
Figure 4 shows some variation between the different estimates due to different periods covered and different methods employed. Nevertheless, the different results are consistent in that the CMB is negative in general and significantly more negative when frontal ablation at tidewater glaciers (Figure 1) is accounted for. The latter can cause drastic recession and thinning of marine terminating glaciers and extension of new branches of fjords. Analysis of time series indicates that there is a tendency toward increased mass loss over time.
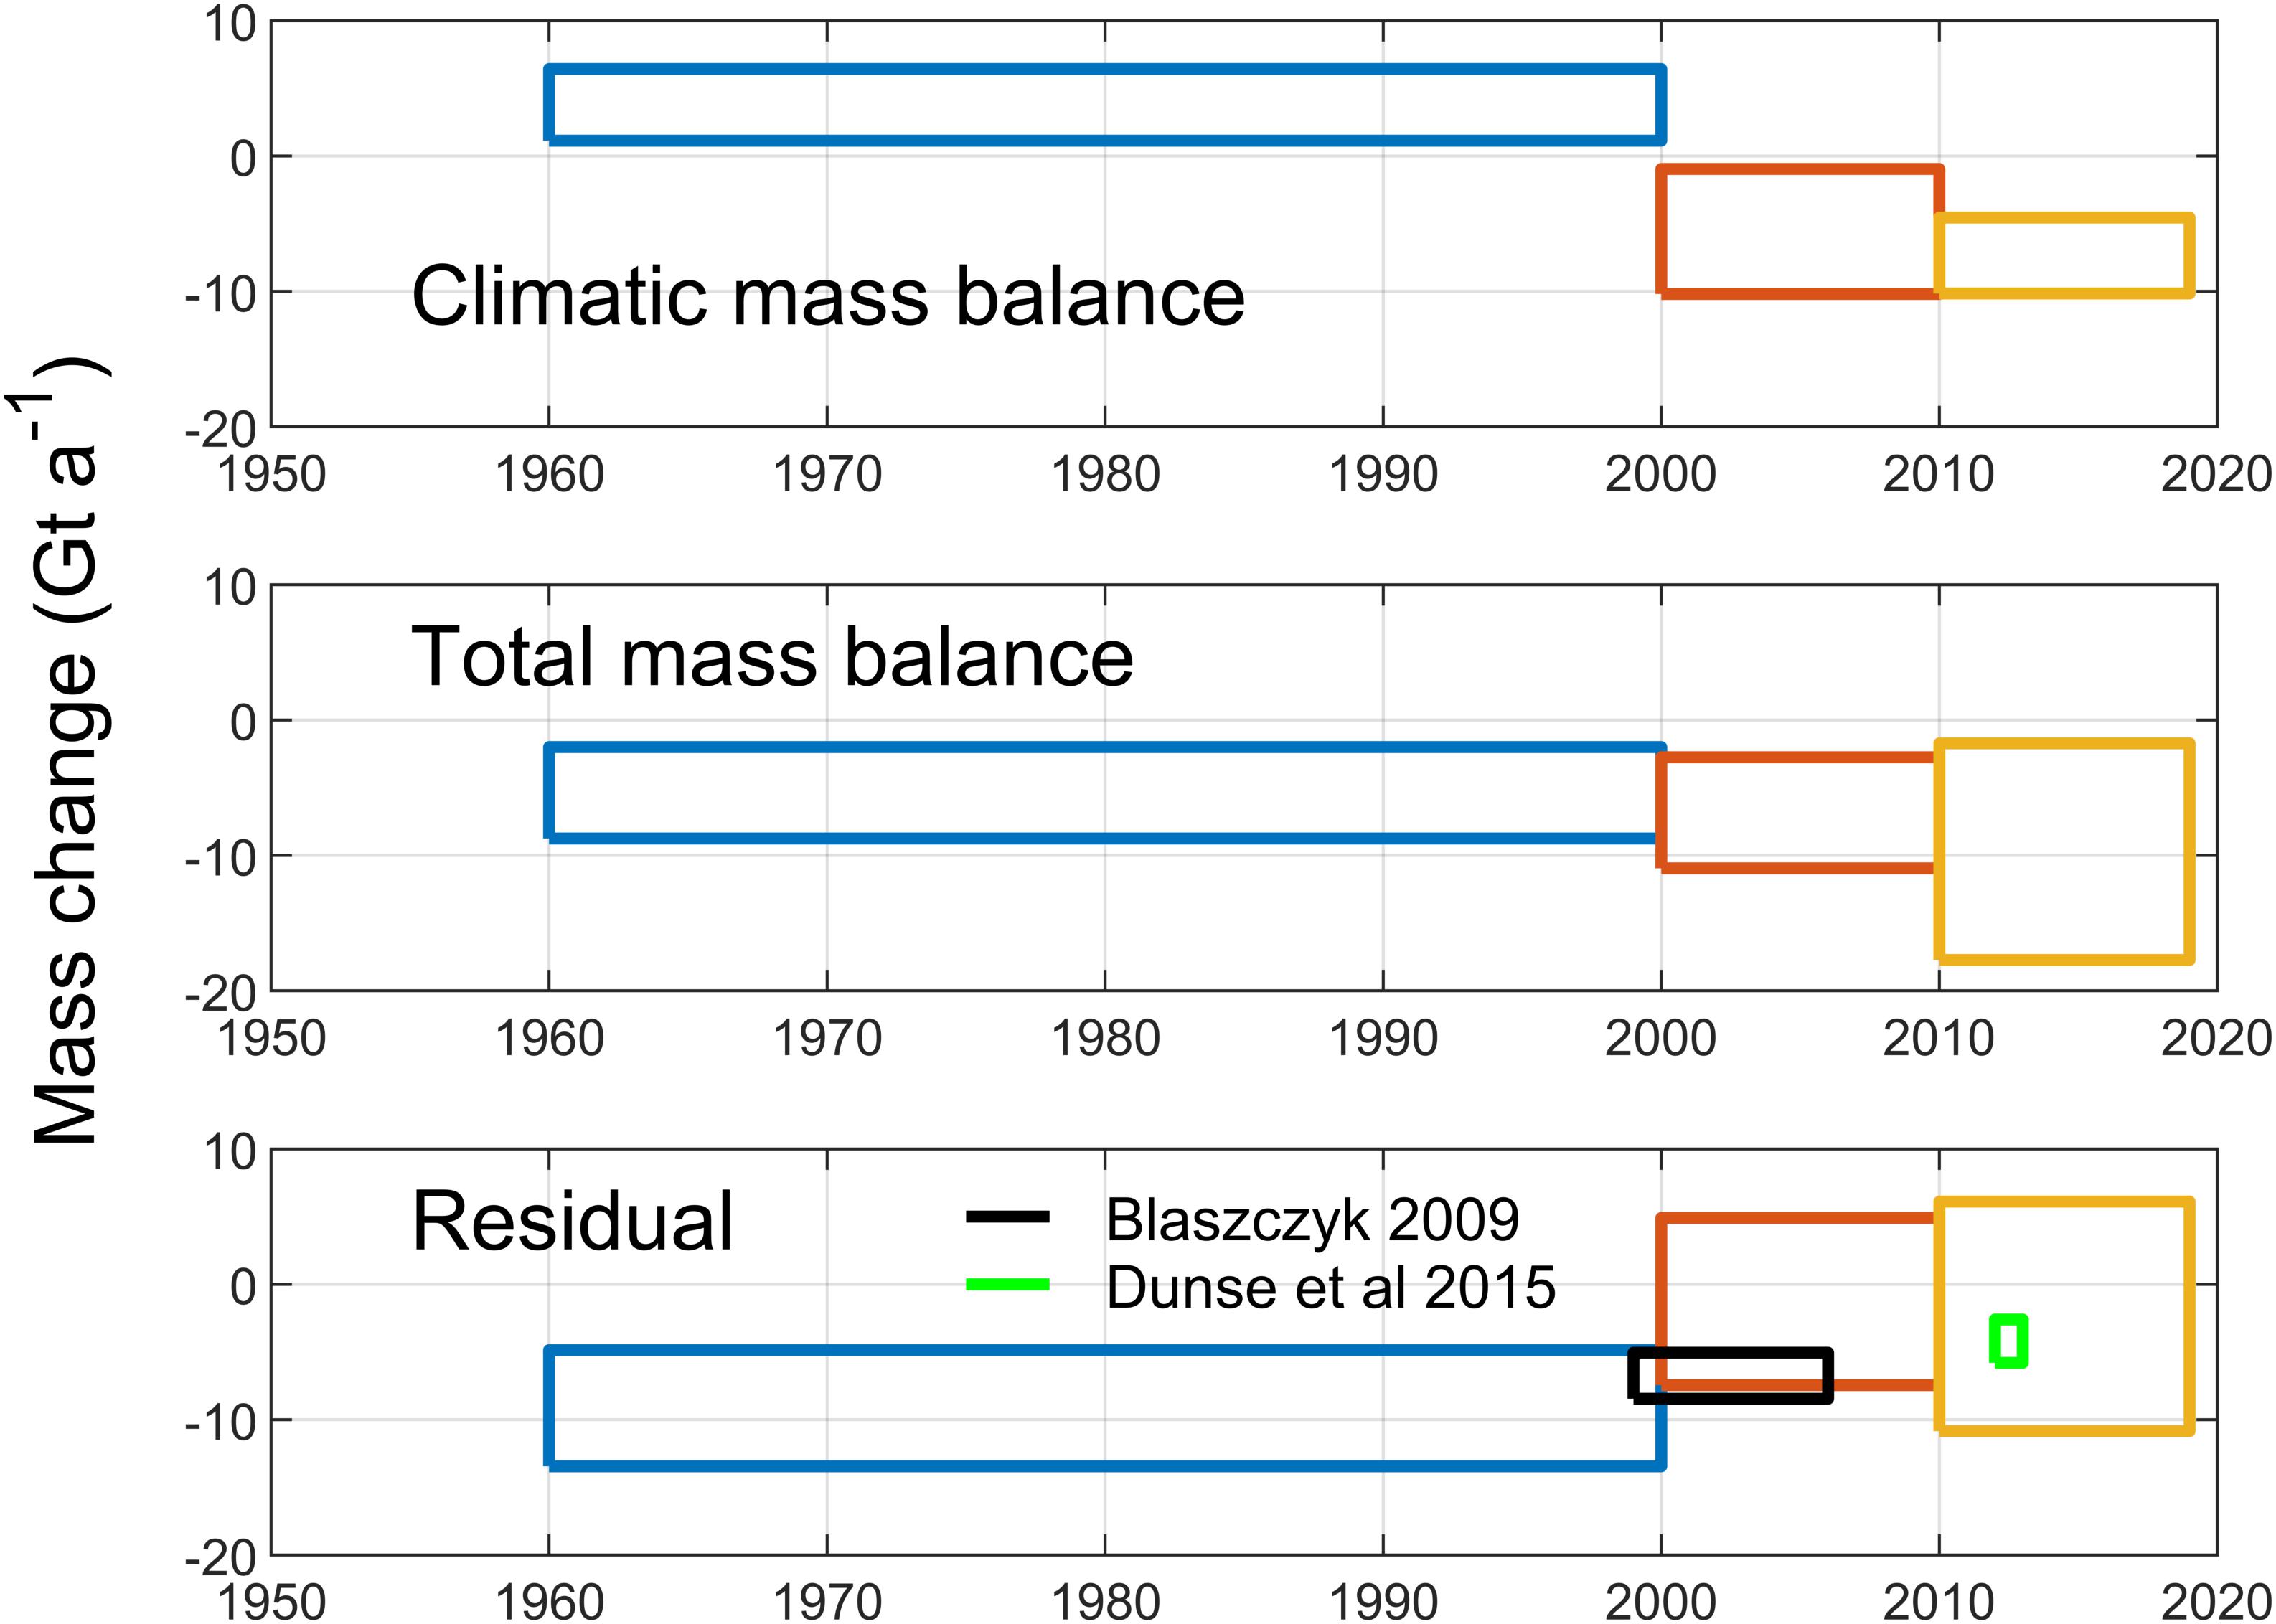
Figure 4. Reconciled estimates for climatic mass balance, total mass balance and residuals for the three epochs. The residual comprises frontal ablation and the related uncertainty. The estimates are represented by colored boxes, their width representing the period for which the estimate has been derived and the height representing the uncertainty of the mass change.
Our new estimate, which is based on glaciologically measured CMB (Figure 2), aligns well with model results (Figure 3). The modeled timeseries (Lang et al., 2015; Østby et al., 2017; Möller and Kohler, 2018; Van Pelt et al., 2019) show a similar evolution after 1980, but differ before 1980. These differences in a period of positive CMB are indicative of differences in the way in which the different models distribute precipitation.
Before reconciling the ensembles of climatic and total mass balance estimates, we define criteria to reflect degrees of representativeness and confidence. Specifically, we focus on records that have:
1. Complete coverage of all regions (to avoid spatial bias),
2. Coverage of all glacier size classes (to avoid bias toward small glaciers),
3. High spatial resolution (10 km or better for model more representative model forcing).
Application of these criteria effectively removed records that are based on simple upscaling of a few datasets with location and size biases, as well as those gravimetry records that do not fuse with other techniques to achieve higher spatial resolution. The estimates selected for reconciling are indicated by thick lines in Figure 4.
Furthermore, the temporal resolution of geodetic estimates allows tracking the evolution of total mass balance for three epochs: 1970–1999, 2000–2009, and 2010–2019. For each of these epochs, we simply average the available ensemble members, as well as derive a conservative error estimate, based on the spread of the ensemble. Figure 4 illustrates the obtained reconciled estimates for CMB and total mass balance, together with the residuals. We consider the estimates for climatic and total mass balance as statistically independent and use the root sum of squares (RSS) to represent the combined uncertainty. According to Nuth et al. (2012), this residual represents the frontal ablation plus all errors. The boxes indicate that long-term frontal ablation is somewhere between −5 and −10 Gt a–1, with considerable uncertainty. This estimate is supported by the independent Błaszczyk et al. (2009) estimate, which has some overlap with ours. The Dunse et al. (2015) value is only for Basin-3 of Austfonna, and demonstrates that surges can have a significant effect on the frontal ablation and add to variability over several years.
Concluding Discussion
In this study, we provide an overview over the different estimates of Svalbard-wide CMB and total mass balance, we describe the different methods that have been used and outline their fundamental differences and potentially associated problems. Several of the described techniques are new and have not been available for previous estimates (Hagen et al., 2003a, b). We further discuss new challenges for determining mass balance and highlight existing research gaps.
Increased activity, especially during the International Polar Year (Krupnik et al., 2011) paved the road to improving accuracy, spatial and temporal resolution and coverage as well as overall reliability of all the presented methods. Modeled values are the outcome of a chain of different process descriptions and should be evaluated at different stages along this chain.
New Challenges
As climate warms, glaciers experience more surface melting. However, because most Svalbard glaciers are polythermal, they have a considerable retention capacity, and large amounts of meltwater can refreeze in the porous snow and firn. Model estimates described above account for this process (in simplified ways), and all agree that this retention capacity has considerably decreased due to general warming and a reduction in firn areas (Østby et al., 2017; Van Pelt et al., 2019). Consequently, firn refreezing capacity has been reduced, and more surface meltwater will exit the glacier as runoff, although some of this water may be temporarily stored in surficial lakes or within perennial firn aquifers (Christianson et al., 2015). Due to their potential for releasing large amounts of water, for instance when intercepted by a crevasse, firn aquifers are of considerable interest for glacier dynamics and hydrology. Furthermore, these aquifers may promote microbial production (e.g., Anesio et al., 2017), and are the focus of ongoing research on glacier ecology (Hodson et al., 2015). In general, more sophisticated drainage system models have to be developed, to account for differences in spatially distributed or localized recharge (Gulley et al., 2012; Decaux et al., 2019). However, our understanding of processes that control the vertical percolation of surface meltwater and associated firn warming needs to be refined, and studies of horizontal water motion are largely absent.
Changes in the size and volume of temperate ice bodies in polythermal glaciers are important for understanding their hydrothermal regime, their potential dynamic instability, and therefore, their response to climate change. Analysis of ground-based radio-echo sounding data of 16 glaciers at Nordenskiöld Land in Spitsbergen shows that 11 of them are polythermal (Macheret et al., 2019), with temperate ice volume fractions varying from 1 to 74%. Repeated radar surveys on selected polythermal glaciers along the same tracks serve as a useful tool in long-term glacier observation projects.
As mentioned above, several major surges have been observed since 2000 (Sund et al., 2009, 2014; Dunse et al., 2015; Sevestre et al., 2018; Nuth et al., 2019), despite an earlier prognosis that there might be a decline with ongoing warming (Dowdeswell et al., 1995). Instead, there has been an apparent increase in the number of surges, although it is still unclear whether this is due to more frequent surging or to improved observation capabilities (cf. Farnsworth et al., 2016). A related issue is the seasonal dynamical adjustment of ice speed during the start of the ablation period, due to the decrease of basal friction. The use of continuous GPS on Svalbard glaciers (Vieli et al., 2004; Dunse et al., 2012; Vallot et al., 2017; Van Pelt et al., 2018) has confirmed the relation between water supply and ice speed-ups observed elsewhere (Iken et al., 1983; Iken and Bindschadler, 1986).
Measurements of surging glaciers on Svalbard (e.g., Nuth et al., 2019) have led to recent theoretical progress in understanding the mechanics of destabilization and surge propagation (Sevestre et al., 2018; Thøgersen et al., 2019) and climatic controls on the global distribution of surging glaciers (Sevestre and Benn, 2015; Benn et al., 2019). While frequent surging in Svalbard imposes a challenge in determining the mass flux to the ocean, it also represents an opportunity for improving our understanding of dynamic instabilities and potential links to climate change. Svalbard is an ideal field laboratory for advancing our understanding of these processes, given the relative ease of access and an already existing knowledge and research infrastructure. Better understanding of glacier flow instabilities may provide important insights into the stability of the larger ice sheets of Greenland and Antarctica in a warming climate. The underlying processes could be studied on Svalbard not only with considerably lower logistical effort but also under a strong ongoing warming trend that anticipates the conditions which the ice-sheets are expected to face.
The total mass balance of Svalbard glaciers consists of two main parts, the climatic mass balance and the frontal ablation (calving and submarine melting). The only available estimate of current frontal ablation from Svalbard glaciers (Błaszczyk et al., 2009) is a composite of snapshots in the period 2000–2006 and amounts to 5.0–8.4 Gt a–1 (mean 6.75 Gt a–1), hence, frontal ablation is roughly equivalent to the mass loss by climatic mass balance in the same period.
This work urgently needs to be updated, especially in light of several large glacier surges that discharged large volumes of ice into the ocean over short periods. In addition, surges transfer huge amounts of ice from the accumulation area to the lower receiving area, where it is exposed to intensified melting. There are some suggestions that increased melt hastens the triggering effect on surges (Dunse et al., 2015) and a number of other large-scale surges have been reported in Svalbard (Sund et al., 2014) as well as other Arctic regions (e.g., Willis et al., 2018). Surges affect frontal ablation and have the potential to considerably increase the sea-level contribution from land ice over short time periods.
Knowledge Gaps
We summarize the key questions that future research should address:
1. How large is the frontal ablation component? How much does it vary on different time scales (seasonal, interannual, and decadal)? How large are the relative contributions of calving and submarine melting? What are the governing processes?
2. What is the importance of surges for the total mass balance? What are the mechanisms that trigger instability and how does it propagate? Does climate change have an influence on surging?
3. How large is the retention capacity of Svalbard glaciers? How does it change and what is the partitioning between refreezing and liquid water storage? What are the implications of firn aquifers and supraglacial lakes for biogeochemistry and glacier dynamics?
Process understanding and quantification of these components is imperative for reliably assessing the future evolution:
1. How will glacier melt, refreezing and runoff evolve in the future?
2. How do dynamics and geometry of Svalbard glaciers respond to climate change?
3. What are the impacts on calving, surging and frontal ablation?
To adequately address the questions outlined above, the following research is needed:
1. Process studies of unstable glacier flow and its potential relationship to surface water meltwater.
2. Development of a coupled glacier mass balance-glacier dynamics model that can be applied to investigate the effects of different climate scenarios.
3. Detailed measurements (for instance of frontal ice thickness, subaqueous melt rates, meltwater plume dynamics) to quantify and understand frontal ablation and its drivers and to separate its components submarine melting and calving and their relative importance related to the climatic mass balance.
4. Geophysical characterization of firn aquifers and changes thereof, along with multi-disciplinary efforts to understand their implications for biogeochemistry.
Data Availability Statement
Glaciological and glacier-related data from Svalbard are available from different repositories and meta-data bases. The most important examples are:
1. A digital elevation model at https://doi.org/10.21334/npolar.2014.dce53a47.
2. Glacier outlines at https://doi.org/10.21334/npolar.2013.89f430f8 (König et al., 2014). These data are also included in the Randolph Glacier Inventory (Pfeffer et al., 2014).
3. Glacier-wide glaciological mass balances in the database of the World Glacier Monitoring Service (WGMS; https://wgms.ch/), at the Norwegian Polar Data Centre https://data.npolar.no/home/ and Environmental monitoring of Svalbard and Jan Mayen (MOSJ): http://www.mosj.no/en/climate/land/mass-balance-glaciers.html.
4. The Centre for Polar Studies, University of Silesia in Katowice provides glacier relevant data and metadata at http://ppdb.us.edu.pl/geonetwork/srv/eng/catalog.search#/home.
5. Unrestricted access to the point stake mass balance, and the remaining AWS time series is provided upon request by contacting the institutes that collected the data.
6. Meteorological records for Ny-Ålesund, Hornsund, and Longyearbyen are accessible through https://seklima.met.no/observations/; and Kongsvegen AWS data at https://doi.org/10.21334/npolar.2017.5dc31930.
7. Surface velocities shown in Figure 1 have been generated using auto-RIFT (Gardner et al., 2018) and provided by the NASA MEaSUREs ITS_LIVE project (Gardner et al., 2019).
Author Contributions
This study is a collaborative effort where all authors have contributed data, discussed the design of the analysis as well as contributed to the writing and reviewing of the manuscript. TS coordinated the work of the consortium and writing of the manuscript. JK and AH edited English language of the manuscript.
Funding
This work was supported by the Research Council of Norway, project number 251658, Svalbard Integrated Arctic Earth Observing System – Knowledge Centre (SIOS-KC).
Conflict of Interest
The authors declare that the research was conducted in the absence of any commercial or financial relationships that could be construed as a potential conflict of interest.
The handling Editor declared a past co-authorship with one of the authors JH.
Acknowledgments
We appreciate comments and contribution of data by B. Barzycka, M. Grabiec, and D. Ignatiuk (Centre for Polar Studies, University of Silesia in Katowice). Comments and suggestions of the Editor MZ and two reviewers helped to improve the quality of the manuscript and are highly appreciated.
Supplementary Material
The Supplementary Material for this article can be found online at: https://www.frontiersin.org/articles/10.3389/feart.2020.00156/full#supplementary-material
Footnotes
- ^ https://wgms.ch/
- ^ http://www.mosj.no/en/climate/land/mass-balance-glaciers.html
- ^ https://sios-svalbard.org/metadata_search
References
Aalstad, K., Westermann, S., Schuler, T. V., Boike, J., and Bertino, L. (2018). Ensemble-based assimilation of fractional snow-covered area satellite retrievals to estimate the snow distribution at Arctic sites. Cryosphere 12, 247–270. doi: 10.5194/tc-12-247-2018
Aas, K. S., Dunse, T., Collier, E., Schuler, T. V., Berntsen, T. K., Kohler, J., et al. (2016). The climatic mass balance of Svalbard glaciers. Cryosphere 10, 1089–1104. doi: 10.5194/tc-10-1089-2016
Abdalati, W., Zwally, H. J., Bindschadler, R., Csatho, B., Farrell, S. L., Fricker, H. A., et al. (2010). The ICES at-2 laser altimetry mission. Proc. IEEE 98, 735–751. doi: 10.1109/JPROC.2009.2034765
Ahlmann, H. W. S. (1933). Scientific results of the swedish-norwegian arctic expedition in the summer of 1931. Part VIII. Glaciology. Geogr. Ann. 15, 161–216. doi: 10.1080/20014422.1933.11880566
AMAP (2017). Snow, Water, Ice and Permafrost in the Arctic (SWIPA) 2017. Oslo: Arctic Monitoring and Assessment Programme (AMAP).
Anesio, A. M., Lutz, S., Chrismas, N. A. M., and Benning, L. G. (2017). The microbiome of glaciers and ice sheets. NPJ Biofilms Microb. 3:10. doi: 10.1038/s41522-017-0019-0
Benn, D. I., Fowler, A. C., Hewitt, I., and Sevestre, H. (2019). A general theory of glacier surges. J. Glaciol. 65, 701–716. doi: 10.1017/jog.2019.62
Błaszczyk, M., Ignatiuk, D., Grabiec, M., Kolondra, L., Laska, M., Decaux, L., et al. (2019). Quality assessment and glaciological applications of digital elevation models derived from space-borne and aerial images over two tidewater glaciers of southern spitsbergen. Remote Sens. 11:1121. doi: 10.3390/rs11091121
Błaszczyk, M., Jania, J. A., and Hagen, J. O. (2009). Tidewater glaciers of Svalbard: recent changes and estimates of calving fluxes. Pol. Polar Res. 30:85.
Błaszczyk, M., Jania, J. A., and Kolondra, L. (2013). Fluctuations of tidewater glaciers in Hornsund Fjord (Southern Svalbard) since the beginning of the 20th century. Pol. Polar Res. 34, 327–352.
Box, J. E., Colgan, W. T., Wouters, B., Burgess, D. O., O’Neel, S., Thomson, L. I., et al. (2018). Global sea-level contribution from Arctic land ice: 1971–2017. Environ. Res. Lett. 13:125012. doi: 10.1088/1748-9326/aaf2ed
Christianson, K., Kohler, J., Alley, R. B., Nuth, C., and van Pelt, W. J. J. (2015). Dynamic perennial firn aquifer on an Arctic glacier. Geophys. Res. Lett. 42, 1418–1426. doi: 10.1002/2014gl062806
Church, J. A., Clark, P. U., Cazenave, A., Gregory, J. M., Jevrejeva, S., Levermann, A., et al. (2014). “Sea Level Change,” in Climate Change 2013 – The Physical Science Basis: Working Group I Contribution to the Fifth Assessment Report of the Intergovernmental Panel on Climate Change, ed. Intergovernmental Panel on Climate (Cambridge: Cambridge University Press), 1137–1216.
Cogley, J. G., Hock, R., Rasmussen, L. A., Arendt, A. A., Bauder, A., Braithwaite, R. J., et al. (2011). “Glossary of Glacier mass balance and related terms,” in IHP-VII Technical Documents in Hydrology, ed. IACS (Paris: UNESCO-IHP).
Decaux, L., Grabiec, M., Ignatiuk, D., and Jania, J. (2019). Role of discrete water recharge from supraglacial drainage systems in modeling patterns of subglacial conduits in Svalbard glaciers. Cryosphere 13, 735–752. doi: 10.5194/tc-13-735-2019
Dee, D. P., Uppala, S. M., Simmons, A. J., Berrisford, P., Poli, P., Kobayashi, S., et al. (2011). The ERA-Interim reanalysis: configuration and performance of the data assimilation system. Q. J. R. Meteorol. Soc. 137, 553–597. doi: 10.1002/qj.828
Deschamps-Berger, C., Nuth, C., Van Pelt, W., Berthier, E., Kohler, J., and Altena, B. A. S. (2019). Closing the mass budget of a tidewater glacier: the example of Kronebreen. Svalbard. J. Glaciol. 65, 136–148. doi: 10.1017/jog.2018.98
Dowdeswell, J. A., Hodgkins, R., Nuttall, A.-M., Hagen, J. O., and Hamilton, G. S. (1995). Mass balance change as a control on the frequency and occurrence of glacier surges in Svalbard. Norwegian High Arctic. Geophys. Res. Lett. 22, 2909–2912. doi: 10.1029/95gl02821
Dunse, T., Greve, R., Schuler, T. V., and Hagen, J. O. (2011). Permanent fast flow versus cyclic surge behaviour: numerical simulations of the Austfonna ice cap and Svalbard. J. Glaciol. 57, 247–259.
Dunse, T., Schellenberger, T., Hagen, J. O., Kääb, A., Schuler, T. V., and Reijmer, C. H. (2015). Surge mechanisms by hydro-thermodynamic feedback. Cryosphere 9, 197–215. doi: 10.5194/tc-9-197-2015
Dunse, T., Schuler, T. V., Hagen, J. O., and Reijmer, C. H. (2012). Seasonal speed-up of two outlet glaciers of Austfonna. Svalbard, inferred from continuous GPS measurements. Cryosphere 6, 453–466. doi: 10.5194/tc-6-453-2012
Dyurgerov, M., and Meier, M. F. (2005). “Glaciers and the changing earth system: a 2004 snapshot,” in Occasional paper 58, (Boulder, CO: Institute of Arctic and Alpine Research).
Farnsworth, W. R., Ingólfsson, Ó, Retelle, M., and Schomacker, A. (2016). Over 400 previously undocumented Svalbard surge-type glaciers identified. Geomorphology 264, 52–60. doi: 10.1016/j.geomorph.2016.03.025
Foresta, L., Gourmelen, N., Pálsson, F., Nienow, P., Björnsson, H., and Shepherd, A. (2016). Surface elevation change and mass balance of Icelandic ice caps derived from swath mode CryoSat-2 altimetry. Geophys. Re. Lett. 43, 12,138–12,145. doi: 10.1002/2016GL071485
Foresta, L., Gourmelen, N., Weissgerber, F., Nienow, P., Williams, J. J., Shepherd, A., et al. (2018). Heterogeneous and rapid ice loss over the patagonian ice fields revealed by CryoSat-2 swath radar altimetry. Remote Sens. Environ. 211, 441–455. doi: 10.1016/j.rse.2018.03.041
Fürst, J. J., Navarro, F., Gillet-Chaulet, F., Huss, M., Moholdt, G., Fettweis, X., et al. (2018). The Ice-Free Topography of Svalbard. Geophys. Res. Lett. 45, 11760–11769. doi: 10.1029/2018gl079734
Gardner, A. S., Moholdt, G., Scambos, T., Fahnstock, M., Ligtenberg, S., and van den Broeke, M., et al. (2018). Increased West Antarctic and unchanged East Antarctic ice discharge over the last 7 years. Cryosphere. 12, 521–547. doi: 10.5194/tc-12-521-2018
Gardner, A. S., Fahnestock, M. A., and Scambos, T. A. (2019). ITS_LIVE Regional Glacier and Ice Sheet Surface Velocities. Boulder, CO: National Snow and Ice Data Center.
Gardner, A. S., Moholdt, G., Cogley, J. G., Wouters, B., Arendt, A. A., Wahr, J., et al. (2013). A reconciled estimate of glacier contributions to sea level rise: 2003 to 2009. Science 340, 852–857. doi: 10.1126/science.1234532
Girod, L., Nielsen, N. I., Couderette, F., Nuth, C., and Kääb, A. (2018). Precise DEM extraction from Svalbard using 1936 high oblique imagery. Geosci. Instrum. Method. Data Syst. 7, 277–288. doi: 10.5194/gi-7-277-2018
Girod, L., Nuth, C., Kääb, A., Etzelmüller, B., and Kohler, J. (2017). Terrain changes from images acquired on opportunistic flights by SfM photogrammetry. Cryosphere 11, 827–840. doi: 10.5194/tc-11-827-2017
Gladstone, R., Schäfer, M., Zwinger, T., Gong, Y., Strozzi, T., Mottram, R., et al. (2014). Importance of basal processes in simulations of a surging Svalbard outlet glacier. Cryosphere 8, 1393–1405. doi: 10.5194/tc-8-1393-2014
Gong, Y., Zwinger, T., Åström, J., Altena, B., Schellenberger, T., Gladstone, R., et al. (2018). Simulating the roles of crevasse routing of surface water and basal friction on the surge evolution of Basin 3. Austfonna ice cap. Cryosphere 12, 1563–1577. doi: 10.5194/tc-12-1563-2018
Gourmelen, N., Escorihuela, M. J., Shepherd, A., Foresta, L., Muir, A., Garcia-Mondéjar, A., et al. (2018). CryoSat-2 swath interferometric altimetry for mapping ice elevation and elevation change. Adv. Space Res. 62, 1226–1242. doi: 10.1016/j.asr.2017.11.014
Grabiec, M., Ignatiuk, D., Jania, J. A., Moskalik, M., Głowacki, P., Błaszczyk, M., et al. (2018). Coast formation in an Arctic area due to glacier surge and retreat: the Hornbreen–Hambergbreen case from Spistbergen. Earth Surf. Proc. Landforms 43, 387–400. doi: 10.1002/esp.4251
Gray, L., Burgess, D., Copland, L., Cullen, R., Galin, N., Hawley, R., et al. (2013). Interferometric swath processing of Cryosat data for glacial ice topography. Cryosphere 7, 1857–1867. doi: 10.5194/tc-7-1857-2013
Gray, L., Burgess, D., Copland, L., Demuth, M. N., Dunse, T., Langley, K., et al. (2015). CryoSat-2 delivers monthly and inter-annual surface elevation change for Arctic ice caps. Cryosphere 9, 1895–1913. doi: 10.5194/tc-9-1895-2015
Gulley, J. D., Grabiec, M., Martin, J. B., Jania, J., Catania, G., and Glowacki, P. (2012). The effect of discrete recharge by moulins and heterogeneity in flow-path efficiency at glacier beds on subglacial hydrology. J. Glaciol. 58, 926–940. doi: 10.3189/2012JoG11J189
Hagen, J. O., Kohler, J., Melvold, K., and Winther, J.-G. (2003a). Glaciers in Svalbard: mass balance, runoff and freshwater flux. Polar Res. 22, 145–159. doi: 10.1111/j.1751-8369.2003.tb00104.x
Hagen, J. O., Melvold, K., Pinglot, F., and Dowdeswell, J. A. (2003b). On the net mass balance of the glaciers and ice caps in Svalbard, Norwegian Arctic. Arctic Antarctic Alp. Res. 35, 264–270. doi: 10.1657/1523-0430
Hagen, J. O., and Liestøl, O. (1990). Long-term glacier mass-balance investigations in svalbard, 1950–88. Ann. Glaciol. 14, 102–106. doi: 10.3189/S0260305500008351
Hagen, J. O., Liestøl, O., Roland, E., and Jørgensen, T. (1993). Glacier Atlas of Svalbard and Jan Mayen. Oslo: Norwegian Polar Institute.
Hanssen-Bauer, I., Førland, E., Hisdal, H., Mayer, S., Sandø, A., Sorteberg, A., et al. (2019). “Climate in Svalbard 2100 - a knowledge base for climate adaptation,” in Norwegian Environment Agency (Miljødirektoratet). Oslo: Norwegian Centre for Climate Services).
Hock, R., Bliss, A., Marzeion, B. E. N., Giesen, R. H., Hirabayashi, Y., Huss, M., et al. (2019). GlacierMIP – A model intercomparison of global-scale glacier mass-balance models and projections. J. Glaciol. 65, 453–467. doi: 10.1017/jog.2019.22
Hodson, A., Brock, B., Pearce, D., Laybourn-Parry, J., and Tranter, M. (2015). Cryospheric ecosystems: a synthesis of snowpack and glacial research. Environ. Res. Lett. 10:110201. doi: 10.1088/1748-9326/10/11/110201
Huss, M. (2013). Density assumptions for converting geodetic glacier volume change to mass change. Cryosphere 7, 877–887. doi: 10.5194/tc-7-877-2013
IGRAS (2020). Mass Balance of Austre Grønfjordbreen. Moscow: Institute of Geography, Russian Academy of Sciences.
Iken, A., and Bindschadler, R. A. (1986). Combined measurements of subglacial water pressure and surface velocity of Findelengletscher, Switzerland: conclusions about drainage system and sliding mechanism. J. Glaciol. 32, 101–119. doi: 10.3189/S0022143000006936
Iken, A., Röthlisberger, H., Flotron, A., and Haeberli, W. (1983). The uplift of unteraargletscher at the beginning of the melt season—A Consequence of Water Storage at the Bed? J. Glaciol. 29, 28–47. doi: 10.3189/S0022143000005128
IPCC (2019). in IPCC Special Report on the Ocean and Cryosphere in a Changing Climate, eds H.-O. Pörtner, P. Masson-Delmotte, M. Zhai, E. Tignor, K. Poloczanska, A. Mintenbeck, et al. (Geneva: IPCC).
Isaksen, K., Nordli, Ø, Førland, E. J., Łupikasza, E., Eastwood, S., and Niedźwiedź, T. (2016). Recent warming on Spitsbergen—Influence of atmospheric circulation and sea ice cover. J. Geophys. Res. Atmosph. 121, 913–911. doi: 10.1002/2016JD025606
Jacob, T., Wahr, J., Pfeffer, W. T., and Swenson, S. (2012). Recent contributions of glaciers and ice caps to sea level rise. Nature 482, 514–518. doi: 10.1038/nature10847
James, T. D., Murray, T., Barrand, N. E., Sykes, H. J., Fox, A. J., and King, M. A. (2012). Observations of enhanced thinning in the upper reaches of Svalbard glaciers. Cryosphere 6, 1369–1381. doi: 10.5194/tc-6-1369-2012
Kaser, G., Cogley, J. G., Dyurgerov, M. B., Meier, M. F., and Ohmura, A. (2006). Mass balance of glaciers and ice caps: consensus estimates for 1961–2004. Geophys. Res. Lett. 33:L19501. doi: 10.1029/2006GL027511
Kohler, J. (2013). Mass Balance for Glaciers Near Ny-Ålesund. Tromsø: Norwegian Polar Institute., doi: 10.21334/npolar.2013.ad6c4c5a
Kohler, J., James, T. D., Murray, T., Nuth, C., Brandt, O., Barrand, N. E., et al. (2007). Acceleration in thinning rate on western Svalbard glaciers. Geophys. Res. Lett. 34:L18502. doi: 10.1029/2007GL030681
König, M., Nuth, C., Kohler, J., Moholdt, G., and Pettersen, R. (2014). “A digital glacier database for svalbard,” in Global Land Ice Measurements from Space, eds J. S. Kargel, G. J. Leonard, M. P. Bishop, A. Kääb, and B. H. Raup (Berlin: Springer Berlin Heidelberg), 229–239.
Krupnik, I., Allison, I., Bell, R., Cutler, P., Hik, D., López-Martínez, J., et al. (2011). Understanding Earth’s Polar Challenges:International Polar Year 2007-2008. Summary by the IPY Joint Committee. Rovaniemi: University of the Arctic.
Lang, C., Fettweis, X., and Erpicum, M. (2015). Stable climate and surface mass balance in Svalbard over 1979-2013 despite the Arctic warming. Cryosphere 9, 83–101. doi: 10.5194/tc-9-83-2015
Luckman, A., Benn, D. I., Cottier, F., Bevan, S., Nilsen, F., and Inall, M. (2015). Calving rates at tidewater glaciers vary strongly with ocean temperature. Nat. Commun. 6:8566. doi: 10.1038/ncomms9566
Macheret, Y., Glazovsky, A., Lavrentiev, I., and Marchuk, I. (2019). Distribution of cold and temperate ice in glaciers on the Nordenskiöld Land, Spitsbergen, from ground-based radio-echo sounding. Ice and Snow 59, 149–166. doi: 10.15356/20766734-2019-2-430
Małecki, J. (2013). Elevation and volume changes of seven Dickson Land glaciers. Svalbard, 1960-1990-2009. Polar Res. 32:18400. doi: 10.3402/polar.v32i0.18400
Małecki, J. (2016). Accelerating retreat and high-elevation thinning of glaciers in central Spitsbergen. Cryosphere 10, 1317–1329. doi: 10.5194/tc-10-1317-2016
Martin-Espanol, A., Navarro, F. J., Otero, J., Lapazaran, J. J., and Błaszczyk, M. (2015). Estimate of the total volume of Svalbard glaciers, and their potential contribution to sea-level rise, using new regionally based scaling relationships. J. Glaciol. 61, 29–41. doi: 10.3189/2015JoG14J159
Marzeion, B., Jarosch, A. H., and Hofer, M. (2012). Past and future sea-level change from the surface mass balance of glaciers. Cryosphere 6, 1295–1322. doi: 10.5194/tc-6-1295-2012
Marzeion, B., Leclercq, P. W., Cogley, J. G., and Jarosch, A. H. (2015). Brief Communication: Global reconstructions of glacier mass change during the 20th century are consistent. Cryosphere 9, 2399–2404. doi: 10.5194/tc-9-2399-2015
Matsuo, K., and Heki, K. (2013). Current ice loss in small glacier systems of the Arctic Islands (Iceland, Svalbard, and the Russian High Arctic) from satellite gravimetry. Terr. Atmos. Oceanic Sci. 24, 657–670. doi: 10.3319/TAO.2013.02.22.01(TibXS)
Maturilli, M., Herber, A., and König-Langlo, G. (2013). Climatology and time series of surface meteorology in Ny-Ålesund, Svalbard. Earth Syst. Sci. Data 5, 155–163.
McMillan, M., Shepherd, A., Gourmelen, N., Dehecq, A., Leeson, A., Ridout, A., et al. (2014). Rapid dynamic activation of a marine-based Arctic ice cap. Geophys. Res. Lett. 41, 8902–8909. doi: 10.1002/2014GL062255
McNabb, R., Nuth, C., Kääb, A., and Girod, L. (2019). Sensitivity of glacier volume change estimation to DEM void interpolation. Cryosphere 13, 895–910. doi: 10.5194/tc-13-895-2019
Meier, M. F., Dyurgerov, M. B., Rick, U. K., Neel, S., Pfeffer, W. T., Anderson, R. S., et al. (2007). Glaciers dominate eustatic sea-level rise in the 21st century. Science 317:1064. doi: 10.1126/science.1143906
Mémin, A., Rogister, Y., Hinderer, J., Omang, O. C., and Luck, B. (2011). Secular gravity variation at Svalbard (Norway) from ground observations and GRACE satellite data. Geophys. J. Int. 184, 1119–1130. doi: 10.1111/j.1365-246X.2010.04922.x
Moholdt, G., Nuth, C., Hagen, J. O., and Kohler, J. (2010). Recent elevation changes of Svalbard glaciers derived from ICES at laser altimetry. Remote Sens. Environ. 114, 2756–2767. doi: 10.1016/j.rse.2010.06.008
Möller, M., Finkelnburg, R., Braun, M., Hock, R., Jonsell, U., Pohjola, V. A., et al. (2011). Climatic mass balance of the ice cap vestfonna, svalbard: a spatially distributed assessment using ERA-Interim and MODIS data. J. Geophys.Res. : Earth Surf. 116:F03009. doi: 10.1029/2010JF001905
Möller, M., and Kohler, J. (2018). Differing climatic mass balance evolution across svalbard glacier regions over 1900-2010. Front. Earth Sci. 6:128. doi: 10.3389/feart.2018.00128
Möller, M., Navarro, F., and Martín-Español, A. (2016). Monte Carlo modelling projects the loss of most land-terminating glaciers on Svalbard in the 21st century under RCP 8.5 forcing. Environ. Re. Lett. 11:94006. doi: 10.1088/1748-9326
Noel, B., van de Berg, W. J., Lhermitte, S., Wouters, B., Machguth, H., Howat, I., et al. (2017). A tipping point in refreezing accelerates mass loss of Greenland’s glaciers and ice caps. Nat. Commun. 8:14730. doi: 10.1038/ncomms14730
Nordli, O., Przybylak, R., Ogilvie, A. E. J., and Isaksen, K. (2014). Long-term temperature trends and variability on Spitsbergen: the extended Svalbard Airport temperature series, 1898-2012. Polar Res. 33:21349. doi: 10.3402/polar.v33.21349
Norwegian Polar Institute, and University of Oslo (2020). “Cumulative mass balance for glaciers in Svalbard,” in Environmental monitoring of Svalbard and Jan Mayen. New Delhi: MOS
Nuth, C., Gilbert, A., Köhler, A., McNabb, R., Schellenberger, T., Sevestre, H., et al. (2019). Dynamic vulnerability of an Arctic tidewater glacier. Sci. Rep. 9:5541. doi: 10.1038/s41598-019-41117-0
Nuth, C., and Kääb, A. (2011). Co-registration and bias corrections of satellite elevation data sets for quantifying glacier thickness change. Cryosphere 5, 271–290. doi: 10.5194/tc-5-271-2011
Nuth, C., Kohler, J., Aas, H. F., Brandt, O., and Hagen, J. O. (2007). Glacier geometry and elevation changes on Svalbard (1936-90): a baseline dataset. Ann. Glaciol. 46, 106–116. doi: 10.3189/172756407782871440
Nuth, C., Kohler, J., Konig, M., von Deschwanden, A., Hagen, J. O., Kaab, A., et al. (2013). Decadal changes from a multi-temporal glacier inventory of Svalbard. Cryosphere 7, 1603–1621. doi: 10.5194/tc-7-1603-2013
Nuth, C., Moholdt, G., Kohler, J., Hagen, J. O., and Kaab, A. (2010). Svalbard glacier elevation changes and contribution to sea level rise. J. Geophys. Res. -Earth Surf. 115, F01008. doi: 10.1029/2008jf001223
Nuth, C., Schuler, T. V., Kohler, J., Altena, B., and Hagen, J. O. (2012). Estimating the long-term calving flux of Kronebreen, Svalbard, from geodetic elevation changes and mass-balance modelling. J. of Glaciol 58, 119–133.
Ohmura, A. (2006). Changes in mountain glaciers and ice caps during the 20th century. Ann. Glaciol. 43, 361–368. doi: 10.3189/172756406781812212
Østby, T. I., Schuler, T. V., Hagen, J. O., Hock, R., Kohler, J., and Reijmer, C. H. (2017). Diagnosing mass balance of glaciers in Svalbard. Cryosphere 11, 191–215. doi: 10.5194/tc-11-191-2017
Østby, T. I., Schuler, T. V., Hagen, J. O., Hock, R., and Reijmer, L. H. (2013). Parameter uncertainty, refreezing and surface energy balance modelling at Austfonna ice cap, Svalbard, 2004-08. Ann. Glaciol. 54, 229–240. doi: 10.3189/2013AoG63A280
Østby, T. I., Schuler, T. V., and Westermann, S. (2014). Severe cloud contamination of MODIS Land Surface Temperatures over an Arctic ice cap. Svalbard. Remote Sens. Environ. 142, 95–102. doi: 10.1016/j.rse.2013.11.005
Parkes, D., and Marzeion, B. (2018). Twentieth-century contribution to sea-level rise from uncharted glaciers. Nature 563, 551–554. doi: 10.1038/s41586-018-0687-9
Pfeffer, W. T., Arendt, A. A., Bliss, A., Bolch, T., Cogley, J. G., Gardner, A. S., et al. (2014). The randolph glacier inventory: a globally complete inventory of glaciers. J. Glaciol. 60, 537–552. doi: 10.3189/2014JoG13J176
Pinglot, J. F., Hagen, J. O., Melvold, K., Eiken, T., and Vincent, C. (2001). A mean net accumulation pattern derived from radioactive layers and radar soundings on Austfonna. Nordaustlandet, Svalbard. J. Glaciol. 47, 555–566. doi: 10.3189/172756501781831800
Poli, P., Hersbach, H., Dee, D. P., Berrisford, P., Simmons, A. J., Vitart, F., et al. (2016). ERA-20C: an atmospheric reanalysis of the Twentieth Century. J. Clim. 29, 4083–4097. doi: 10.1175/Jcli-D-15-0556.1
Radic, V., and Hock, R. (2011). Regionally differentiated contribution of mountain glaciers and ice caps to future sea-level rise. Nat. Geosci. 4, 91–94. doi: 10.1038/Ngeo1052
Rye, C. J., Willis, I. C., Arnold, N. S., and Kohler, J. (2012). On the need for automated multiobjective optimization and uncertainty estimation of glacier mass balance models. J. Geophys. Res. Earth Surf. 117:F02005. doi: 10.1029/2011JF002184
Schäfer, M., Gillet-Chaulet, F., Gladstone, R., Pettersson, R., Pohjola, V. A., Strozzi, T., et al. (2014). Assessment of heat sources on the control of fast flow of Vestfonna ice cap. Svalbard. Cryosphere 8, 1951–1973. doi: 10.5194/tc-8-1951-2014
Schellenberger, T., Dunse, T., Kääb, A., Kohler, J., and Reijmer, C. H. (2015). Surface speed and frontal ablation of Kronebreen and Kongsbreen. NW Svalbard, from SAR offset tracking. Cryosphere 9, 2339–2355. doi: 10.5194/tc-9-2339-2015
Schuler, T. V., Loe, E., Taurisano, A., Eiken, T., Hagen, J. O., and Kohler, J. (2007). Calibrating a surface mass-balance model for Austfonna ice cap. Svalbard. Ann. Glaciol. 46, 241–248. doi: 10.3189/172756407782871783
Schuler, T. V., and Østby, T. I. (2020). Sval_Imp: a gridded forcing dataset for climate change impact research on Svalbard. Earth Syst. Sci. Data 12, 875–885. doi: 10.5194/essd-12-875-2020
Schytt, V. (1964). Scientific results of the swedish glaciological expedition to Nordaustlandet, Spitsbergen, 1957 and 1958. Geogr. Ann. 46, 242–281. doi: 10.2307/520382
Sevestre, H., and Benn, D. I. (2015). Controls on the global distribution of surge-type glaciers. J. Glaciol. 228, 646–662. doi: 10.3189/2015JoG14J136
Sevestre, H., Benn, D. I., Luckman, A., Nuth, C., Kohler, J., Lindback, K., et al. (2018). Tidewater glacier surges initiated at the terminus. J. Geophys. Res. Earth Surf. 123, 1035–1051. doi: 10.1029/2017jf004358
Shuman, C. A., Zwally, H. J., Schutz, B. E., Brenner, A. C., DiMarzio, J. P., Suchdeo, V. P., et al. (2006). ICES at antarctic elevation data: preliminary precision and accuracy assessment. Geophys. Res. Lett. 33:L07501. doi: 10.1029/2005GL025227
Sobota, I., Nowak, M., and Weckwerth, P. (2016). Long-term changes of glaciers in north-western Spitsbergen. Global Planet. Change 144, 182–197. doi: 10.1016/j.gloplacha.2016.07.006
Sund, M., Eiken, T., Hagen, J. O., and Kaab, A. (2009). Svalbard surge dynamics derived from geometric changes. Ann. Glaciol. 50, 50–60. doi: 10.3189/172756409789624265
Sund, M., Lauknes, T. R., and Eiken, T. (2014). Surge dynamics in the Nathorstbreen glacier system. Svalbard. Cryosphere 8, 623–638. doi: 10.5194/tc-8-623-2014
Taurisano, A., Schuler, T. V., Hagen, J. O., Eiken, T., Loe, E., Melvold, K., et al. (2007). The distribution of snow accumulation across the Austfonna ice cap. Svalbard: direct measurements and modelling. Polar Res. 26, 7–13.
Thøgersen, K., Gilbert, A., Schuler, T. V., and Malthe-Sorenssen, A. (2019). Rate-and-state friction explains glacier surge propagation. Nat. Commun. 10:2823. doi: 10.1038/s41467-019-10506-4
Torsvik, T., Albretsen, J., Sundfjord, A., Kohler, J., Sandvik, A. D., Skarðhamar, J., et al. (2019). Impact of tidewater glacier retreat on the fjord system: modeling present and future circulation in Kongsfjorden. Svalbard. Estuar. Coast. Shelf Sci. 220, 152–165. doi: 10.1016/j.ecss.2019.02.005
Uppala, S. M., Kallberg, P. W., Simmons, A. J., Andrae, U., Bechtold, V. D., Fiorino, M., et al. (2005). The ERA-40 re-analysis. Q. J. R. Meteorol. Soc. 131, 2961–3012. doi: 10.1256/qj.04.176
Vallot, D., Pettersson, R., Luckman, A., Benn, D. I., Zwinger, T., Van Pelt, W. J. J., et al. (2017). Basal dynamics of Kronebreen, a fast-flowing tidewater glacier in Svalbard: non-local spatio-temporal response to water input. J. Glaciol. 63, 1012–1024. doi: 10.1017/jog.2017.69
Van Pelt, W., and Kohler, J. (2015). Modelling the long-term mass balance and firn evolution of glaciers around Kongsfjorden. Svalbard. J. Glaciol. 61, 731–744. doi: 10.3189/2015JoG14J223
Van Pelt, W. J. J., Pohjola, V., Pettersson, R., Marchenko, S., Kohler, J., Luks, B., et al. (2019). A long-term dataset of climatic mass balance, snow conditions, and runoff in Svalbard (1957-2018). Cryosphere 13, 2259–2280. doi: 10.5194/tc-13-2259-2019
Van Pelt, W. J. J., Pohjola, V. A., Pettersson, R., Ehwald, L. E., Reijmer, C. H., Boot, W., et al. (2018). Dynamic response of a high arctic glacier to melt and runoff variations. Geophys. Res. Lett. 45, 4917–4926. doi: 10.1029/2018gl077252
Vieli, A., Jania, J., Blatter, H., and Funk, M. (2004). Short-term velocity variations on Hansbreen, a tidewater glacier in Spitsbergen. J. Glaciol. 50, 389–398. doi: 10.3189/172756504781829963
Willis, M. J., Zheng, W., Durkin, W. J., Pritchard, M. E., Ramage, J. M., Dowdeswell, J. A., et al. (2018). Massive destabilization of an Arctic ice cap. Earth Planet. Sci. Lett. 502, 146–155. doi: 10.1016/j.epsl.2018.08.049
Wouters, B., Chambers, D., and Schrama, E. J. O. (2008). GRACE observes small-scale mass loss in Greenland. Geophys. Res. Lett. 35:L20501. doi: 10.1029/2008gl034816
Wouters, B., Gardner, A. S., and Moholdt, G. (2019). Global glacier mass loss during the GRACE satellite Mission (2002-2016). Front. Earth Sci. 7:96. doi: 10.3389/feart.2019.00096
Keywords: Svalbard, Arctic glaciers, glacier mass balance, mass balance modeling, glaciological mass balance, geodetic mass balance, glacier gravimetry
Citation: Schuler TV, Kohler J, Elagina N, Hagen JOM, Hodson AJ, Jania JA, Kääb AM, Luks B, Małecki J, Moholdt G, Pohjola VA, Sobota I and Van Pelt WJJ (2020) Reconciling Svalbard Glacier Mass Balance. Front. Earth Sci. 8:156. doi: 10.3389/feart.2020.00156
Received: 23 January 2020; Accepted: 27 April 2020;
Published: 27 May 2020.
Edited by:
Michael Zemp, University of Zürich, SwitzerlandReviewed by:
Noel Gourmelen, The University of Edinburgh, United KingdomIngo Sasgen, Helmholtz Centre for Polar and Marine Research (AWI), Germany
Copyright © 2020 Schuler, Kohler, Elagina, Hagen, Hodson, Jania, Kääb, Luks, Małecki, Moholdt, Pohjola, Sobota and Van Pelt. This is an open-access article distributed under the terms of the Creative Commons Attribution License (CC BY). The use, distribution or reproduction in other forums is permitted, provided the original author(s) and the copyright owner(s) are credited and that the original publication in this journal is cited, in accordance with accepted academic practice. No use, distribution or reproduction is permitted which does not comply with these terms.
*Correspondence: Thomas V. Schuler, t.v.schuler@geo.uio.no