Association of Pericoronary Adipose Tissue Quality Determined by Dual-Layer Spectral Detector CT With Severity of Coronary Artery Disease: A Preliminary Study
 Yuxue Dang1
  Xujiao Chen1
  Shaowei Ma2
  Yue Ma1 Quanmei Ma1 Ke Zhou3 Ting Liu4 Kunhua Wang5*†
  Yang Hou1*†
- 1Department of Radiology, Shengjing Hospital of China Medical University, Shenyang, China
- 2Department of Cardiology, Shengjing Hospital of China Medical University, Shenyang, China
- 3Department of Cardiac Surgery, Shengjing Hospital of China Medical University, Shenyang, China
- 4Department of Radiology, The First Affiliated Hospital of China Medical University, Shenyang, China
- 5Department of Radiology, The People’s Hospital of Liaoning Province, Shenyang, China
Background: Pericoronary adipose tissue (PCAT) is considered as a source of inflammatory mediators, leading to the development of coronary atherosclerosis. The study aimed to investigate the correlation between PCAT quality derived from dual-layer spectral detector CT (SDCT) and the severity of coronary artery disease (CAD), and whether PCAT parameters were independently associated with the presence of CAD.
Materials and Methods: A total of 403 patients with symptoms of chest pain who underwent SDCT were included. PCAT quality including fat attenuation index (FAI) measured from conventional polychromatic CT images (FAI120kvp) and spectral virtual mono-energetic images at 40 keV (FAI40keV), slope of spectral HU curve (λHU), and effective atomic number (Eff-Z) were measured around the lesions representing the maximal degree of vascular stenosis in each patient. Meanwhile, overall epicardial adipose tissue (EAT) attenuation was acquired in the conventional polychromatic energy imaging.
Results: FAI40keV, λHU, Eff-Z, and FAI120kvp increased along with the degree of CAD in general and were superior to the overall EAT attenuation for detecting the presence of CAD. Multivariate logistic regression analysis indicated that FAI40keV was the most powerful independent indicator (odds ratio 1.058, 95% CI 1.044–1.073; p < 0.001) of CAD among these parameters. Using an optimal cut-off (−131.8 HU), FAI40keV showed higher diagnostic accuracy of 80.6% compared with the other parameters.
Conclusions: These preliminary findings suggest that FAI40keV on SDCT may be an appealing surrogate maker to allow monitoring of PCAT changes in the development of CAD.
Introduction
It is widely recognized that epicardial adipose tissue (EAT) plays a crucial role in the development of coronary artery disease (CAD) (1–3). Compared with EAT volume, EAT attenuation is more sensitive in showing the pathological changes of EAT, such as inhibition of adipocyte differentiation, interstitial fibrosis and microvascular proliferation (4, 5). Although EAT attenuation was associated with CAD risk factors and the presence of CAD, it was not associated with the presence of a significant coronary artery lesion (6). As an important component of EAT, pericoronary adipose tissue (PCAT) wrapping around coronary arteries secretes the inflammatory cytokines which may affect the adjacent vessel wall, and the resulting vascular inflammation leads to the formation and progress of coronary atherosclerosis (7–9). This complex interplay between vascular inflammation revealed by PCAT attenuation and coronary stenosis caused by atherosclerosis has been a focus of recent research. PCAT attenuation had been found to be associated with hemodynamically significant lesions, an increased risk of acute coronary syndrome, cardiac mortality and poor prognosis (10–13). Yu et al. found that perivascular fat attenuation index (FAI) provided incremental value to diameter stenosis for identifying hemodynamically significant lesions (11). However, this study included only patients with moderate to severe stenosis. The relationship between PCAT changes and the degree of coronary stenosis is still uncertain. Therefore, we conducted a preliminary study to investigate the association of PCAT attenuation and EAT attenuation with different stages of CAD in a large cohort of patients with chest pain.
Dual-layer spectral detector CT (SDCT) was introduced in recent years, which has shown to be highly suitable for coronary CTA in a clinical setting (14, 15). The use of spectral reconstructions such as virtual monochromatic imaging (VMI) at the low energy level of 40 keV can increase the contrast of soft tissue significantly (15–17). Effective atomic number (Eff-Z) and the slope of the spectral HU curve (λHU) are important energy spectrum parameters, which can help to differentiate the tissue characteristics (18, 19). Based on the knowledge learned above, we hypothesized that the index of PCAT on SDCT may be more sensitive and accurate than conventional CT to reflect the changes of PCAT.
To the best of our knowledge, there are no reports of relationship of PCAT quality derived from SDCT with different degrees of CAD. Therefore, the current study aimed to (i) investigate the association between PCAT index derived from SDCT and severity of CAD, and (ii) explore whether the PCAT index can be used as an independent risk factor for CAD.
Materials and Methods
Patients
This retrospective study was approved by the institutional review board of Shengjing Hospital of China Medical University (NO.2020PS231K). Because it was a retrospective study and the scans were performed as part of clinical routine, informed consent was exempted. Data from 468 patients with chest pain and suspected coronary artery disease who underwent coronary CT angiography (coronary CTA) on a spectral detector CT between April 2018 and July 2020 were reviewed in this study. The exclusion criteria were as follows: (1) patients with incomplete clinical records; (2) poor image quality; (3) previous history of percutaneous coronary intervention (PCI) or coronary artery bypass grafting (CABG); and (4) patients suffering from malignancy or cardiomyopathies. As a result, a total of 403 patients were included in this study (Figure 1). Among them, 121 patients were diagnosed with moderate or severe stenosis by coronary CTA, and catheter coronary angiography (CAG) was performed to further confirm the extent of lesions.
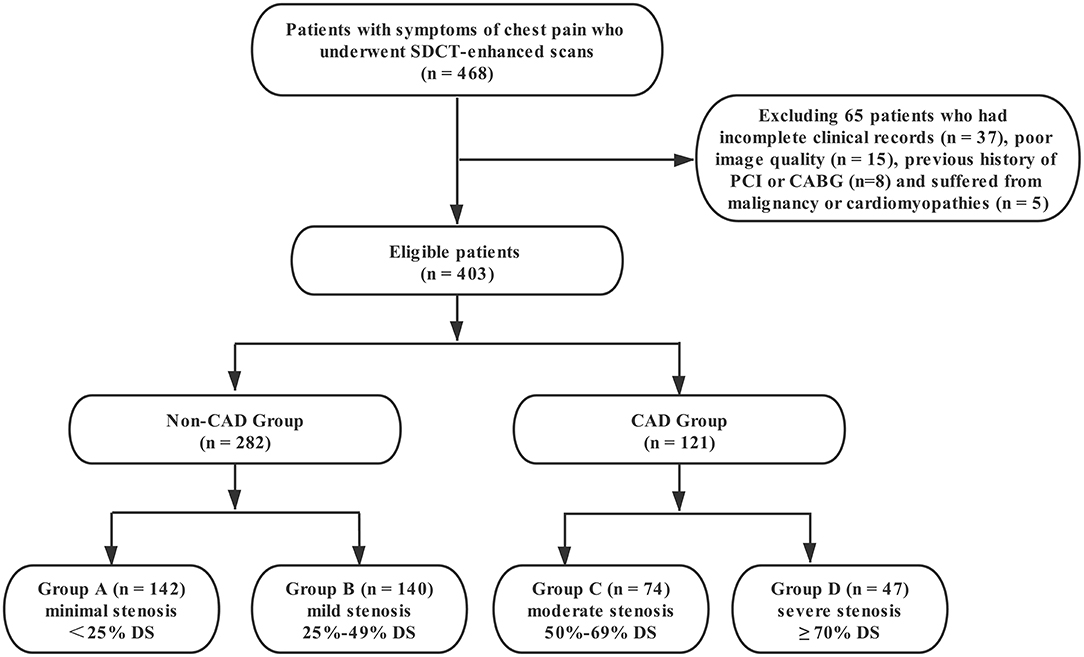
Figure 1. Flow diagram of patient recruitment and grouping. PCI, percutaneous coronary intervention; CABG, coronary artery bypass graft; DS, diameter stenosis.
The relevant clinical data of the patients was collected by reviewing the electronic medical database. Body mass index (BMI) was calculated as weight (kg)/height2 (m2). Patients on insulin therapy or oral anti-diabetic drugs, or showing HbA1c ≥ 6.5%, fasting glucose ≥ 126 mg/dL or non-fasting glucose ≥ 200 mg/dL were considered to have Diabetes Mellitus Type 2. Systolic blood pressure ≥ 140 mm Hg, or diastolic blood pressure ≥ 90 mm Hg, or use of antihypertensive drugs was considered as an indication of hypertension. Current and previous smoking and drinking histories were reviewed. Total cholesterol (TC), triglycerides (TG), high-density lipoprotein (HDL), and low-density lipoprotein (LDL) were collected.
CT Acquisition and Reconstruction
The coronary computed tomography angiography (coronary CTA) scans were performed on a spectral detector CT scanner (IQon, Philips Healthcare, Best, The Netherlands) using prospective electrocardiogram (ECG) gating (Step & Shoot Cardiac). The scans were performed with the following parameters: 120 kVp, 0.27s rotation time, 64 × 0.625 mm slice collimation, and the Dose Right Index set to 13. The scan trigger was centered around a physiologic cardiac phase of ventricular diastasis corresponding to 78% of the R–R interval, with a ±3% buffer used. Patients with a heart rate >70 bpm received intravenous ß-receptor blocker before the scan regularly (see Supplementary Material for detailed information).
Raw data were reconstructed using spectral iterative reconstruction algorithm with the spectral reconstruction level set to 4 (Philips Healthcare). Axial images were reconstructed at a slice thickness of 0.9 mm with an overlapping increment of 0.45 mm. The resulting spectral base image (SBI) datasets included the true conventional polychromatic (120 kVp) images along with a wide variety of spectral reconstructions. The SBI corresponding to the best cardiac phase was identified from which VMI were generated—for the purpose of image assessment, VMIs from 40 to 70 keV in steps of 10 keV were assessed.
According to the degree of coronary stenosis from CCTA and CAG, all patients were first divided into non-CAD group [< 50% luminal diameter stenosis (DS)] and CAD group (≥ 50% DS). In order to further explore the relationship of PCAT index on degrees of DS, the patients were then divided into four subgroups: Group A (minimal stenosis, < 25% DS), Group B (mild stenosis, 25%-49% DS), Group C (moderate stenosis, 50%-69% DS) and Group D (severe stenosis, ≥ 70% DS) according to the 2014 guidelines provided by the Society of Cardiovascular Computed Tomography (SCCT) (20). Furthermore, the coronary plaques of the maximal coronary stenosis were divided into calcified, non-calcified, and mixed plaques (21). The PCAT indices in the different plaque groups were further analyzed.
Quantification of EAT and PCAT Measures
The EAT attenuation was assessed using the semi-automated software (cardiac risk assessment version 1.2.0, Siemens Healthineer, Germany). Attenuation values within −190 HU to −30 HU were considered to represent adipose tissue (13). See Supplementary Material for details on EAT attenuation measurement.
PCAT was sampled in three-dimensional layers radially outwards from the outer vessel wall and measured (7, 13). Adipose tissue was identified as all voxels with attenuation thresholds of −190 to −30 HU in conventional polychromatic energy imaging, −280 to −40 HU in VMI at 40 keV, and −220 to −30 HU in VMI at 70 keV, respectively (22). PCAT analysis was performed in the adipose tissue around the plaque that caused the maximal degree of vascular stenosis in each patient (Figure 2). FAI was measured within the predefined volume of interest at the following energy levels: conventional 120 kVp, and at spectral VMI levels of 40 keV and 70 keV using the semi-automated software (Dr. Wise® Coronary Artery CT Aided Diagnosis Software V200831), reported as FAI120kvp, FAI40keV, FAI70keV, respectively and the slope of the spectral HU curve (λHU) was calculated using the formula: λHU = (FAI40keV-FAI70keV)/30. The effective atomic number (Eff-Z) was measured using the dedicated workstation (IntelliSpace Portal Version 6.5, Philips Healthcare).
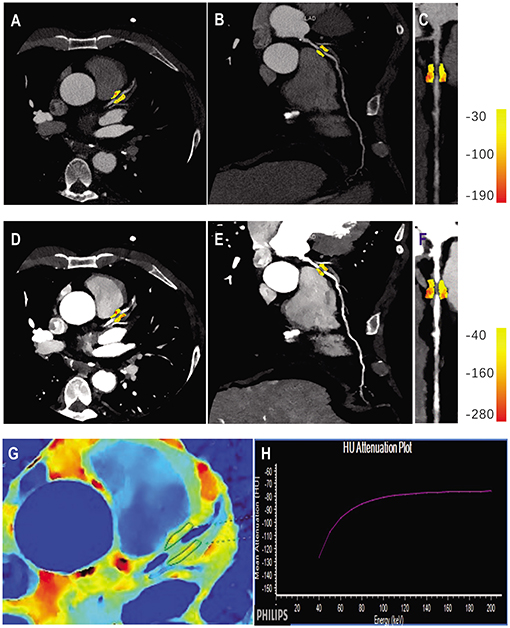
Figure 2. Quantitative PCAT analysis in a case example of a 56-years old male patient with significant coronary artery stenosis (severe stenosis in proximal LAD). Axial view and the corresponding curved multiplane and straightened view of PCAT of the proximal LAD in the conventional 120 kVp (A–C) and 40 keV VMI (D–F). (G,H) Represented the corresponding panels of Eff-Z imaging and spectral attenuation curve, respectively. LAD, left anterior descending artery; VMI, virtual monochromatic images.
All measurements were repeated three times by a radiologist with 8 years of experience in coronary CTA and averaged in order to ensure the accuracy of the data, and the investigator was blinded to clinical information and grouping situation. In order to verify the repeatability of the PCAT measures, 60 cases were randomly selected in a blinded manner and re-measured by the same investigator after 6 weeks.
Statistical Analysis
Datasets were analyzed using commercially available software (SPSS version 20.0, USA and MedCalc Statistical Software, version 15.2). Continuous variables were presented as means ± standard deviation. Inter-group comparisons were performed with independent–samples t-test or ANOVA. Welch’s t-test was used in data with heterogeneity of variance among multiple groups. And the LSD or Dunnett’s T3 test was used for paired comparison. Multivariate binary logistic regression was used to evaluate the association of EAT and PCAT measures with coronary stenosis. In order to compare the relative weight values of EAT and PCAT measures, each variable was standardized, and then performing multivariate logistic regression analysis to compare the standard partial regression coefficient of each variable. The receiver-operating characteristic (ROC) curve was drawn and the corresponding optimal cut-off value for predicting the presence of CAD was determined. The intra-class correlation coefficient (ICC) was used to evaluate intra-reader reliability of PCAT measurements. Generally, an ICC value ≥ 0.75 indicates excellent reliability, between 0.40 and 0.75 indicates fair to moderate reliability, and < 0.40 indicates poor reliability (23). A two-sided p < 0.05 was considered significant.
Results
Patients
There were 403 subjects included in this study. Clinical characteristics in different groups of the study cohort are shown in Table 1.
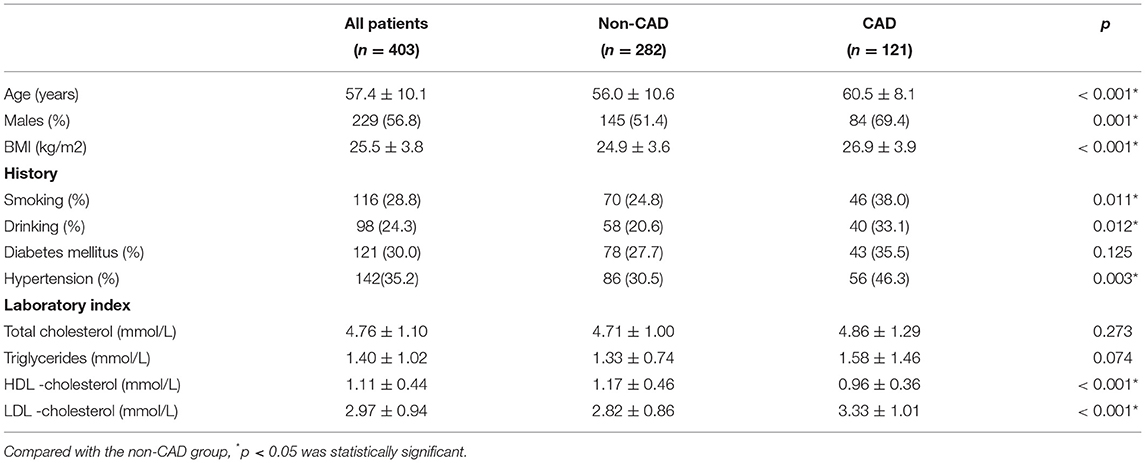
Table 1. Baseline characteristics of study cohort (n = 403).
Comparison of the EAT Attenuation and PCAT Parameters on SDCT in Patients With and Without CAD
All PCAT indices showed excellent reliability (ICC > 0.75) (Supplementary Table 1). The FAI40keV, λHU, Eff-z, and FAI120kvp were significantly larger in patients with CAD than those in non-CAD group (both p < 0.001). EAT attenuation in the two groups were also statistically different (p < 0.001) (Figure 3).
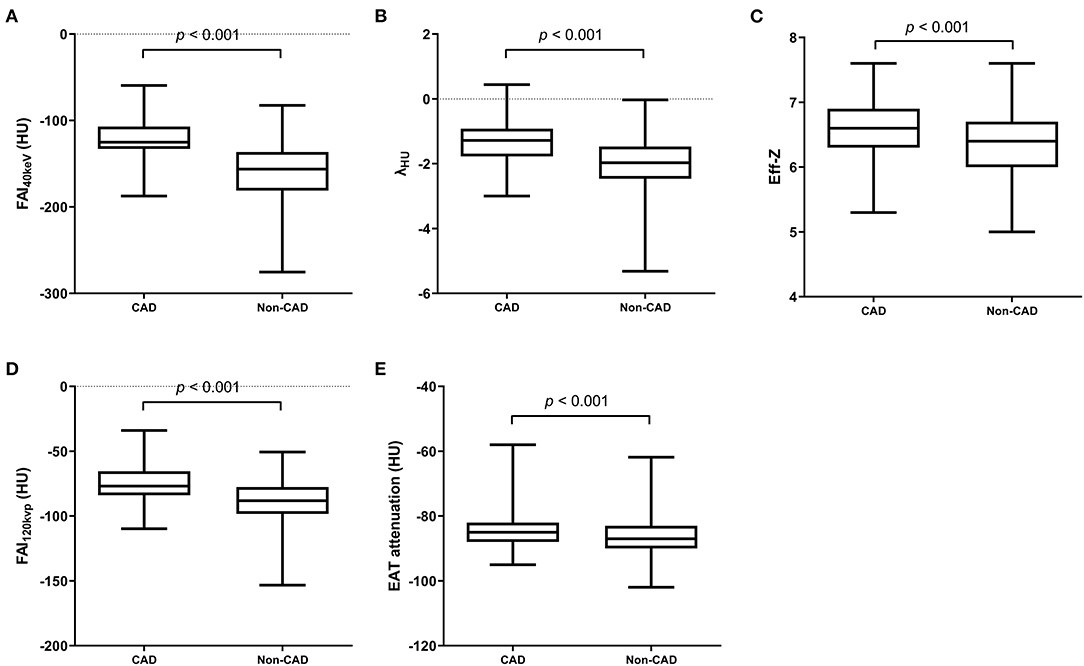
Figure 3. SDCT-related parameters of PCAT and EAT attenuation in CAD and non-CAD groups. FAI40keV (A), λHU (B), Eff-z (C) and FAI120kvp (D) and EAT attenuation (E) were significantly larger in patients with CAD than those in non-CAD group (both p < 0.001). A value of p < 0.05 indicated statistical significance.
PCAT Parameters and EAT Attenuation From SDCT With Relation to the Degree of Coronary Stenosis
Patients were further divided into four subgroups according to the degree of coronary stenosis, Group A (minimal), Group B (mild), Group C (moderate), and Group D (severe) (see Methods). Lesion characteristics are shown in Table 2. There were significant differences in PCAT index and EAT attenuation among the groups. In view of the overall situation, FAI40keV, λHU, Eff-Z, FAI120kvp, and EAT attenuation all showed an increasing trend along with an increased degree of vascular stenosis (Table 3). Additionally, significant differences were seen in FAI40keV and λHU between Groups C and D, with no significant differences seen in the other parameters of the two groups.
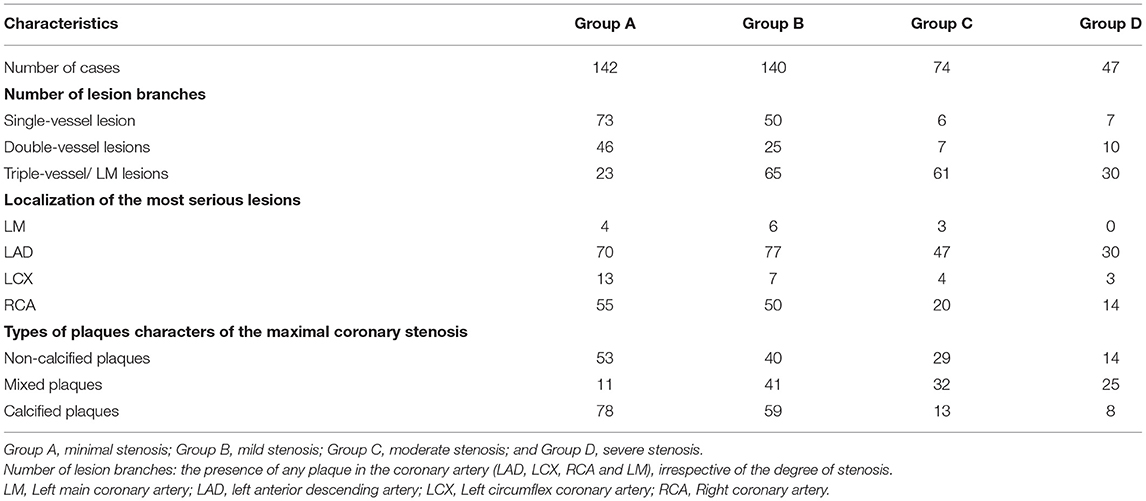
Table 2. Lesion characteristics of coronary CTA in the four subgroups.
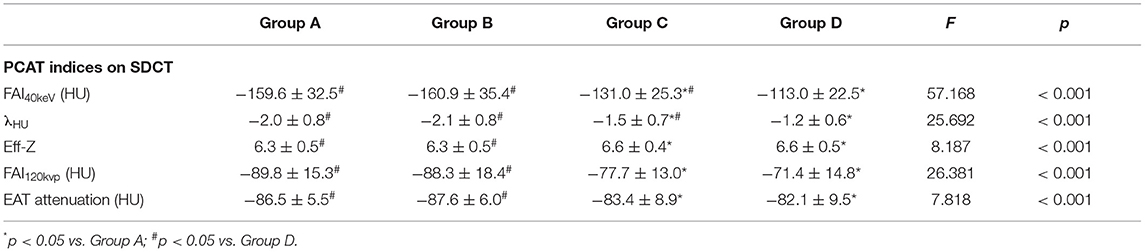
Table 3. SDCT-related parameters of PCAT and EAT attenuation in different degree of stenosis groups.
Furthermore, FAI40keV was larger in the maximal stenosis segments with the non-calcified or mixed plaques than those with the calcified plaques in CAD group (p < 0.05, Figure 4A). While no significant difference was observed between the patients with non-calcified and mixed plaques. Interestingly, the opposite results were obtained in non-CAD group, which showed that FAI40keV adjacent to non-calcified plaques was the lowest (Figure 4B). However, there were no significant differences in FAI40keV between patients with different type of plaques.
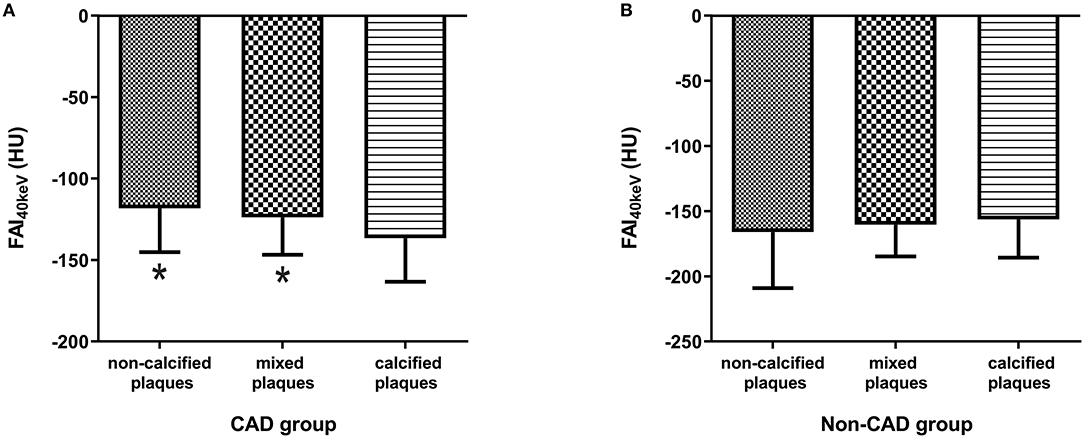
Figure 4. Comparison of FAI40keV (HU) based on plaque type in CAD group (A) and non-CAD group (B). *p < 0.05 compared to calcified plaques.
The Association of PCAT and EAT Measures With the Presence of CAD
On multivariate binary logistic analysis, after adjusting the conventional cardiovascular risk factors (age, gender, BMI, Diabetes Mellitus Type 2, hypertension, smoking, drinking, TC, TG, HDL, LDL) and type of plaques, FAI40keV, λHU, Eff-Z, FAI120kvp, and EAT attenuation were found to be significantly associated with the presence of CAD (Table 4). It should be noted that due to the collinearity between the above-mentioned PCAT-related parameters (FAI40keV, λHU, Eff-Z, FAI120kvp, and EAT attenuation), we, respectively, substituted these parameters into the regression equation for analysis. According to the standard partial regression coefficient, among these parameters, FAI40keV was the most powerful independent indicator.
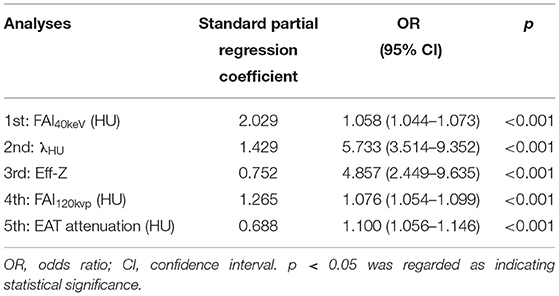
Table 4. The association of PCAT measures and EAT attenuation with the presence of CAD.
ROC Analysis for Prediction of CAD
The ROC curve for FAI40keV, λHU, Eff-Z, and FAI120kvp showed them as superior predictors of CAD with the corresponding areas under curve (AUC) 0.811, 0.756, 0.646, and 0.731, respectively, which were greater than AUC of EAT attenuation (0.614) (Figure 5 and Table 5). FAI40keV showed the highest AUC with the optimal cutoff value of −131.8 HU to predict CAD, with a diagnostic accuracy of 80.6% compared to the other parameters.
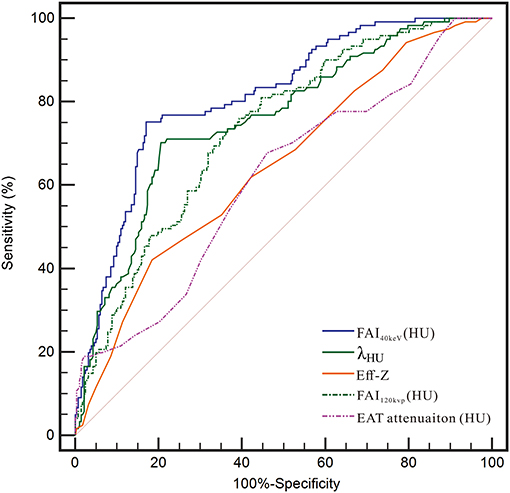
Figure 5. Receiver operating characteristic (ROC) curve analysis showed that compared with other parameters, the FAI40kev had the highest the area under curve (AUC).
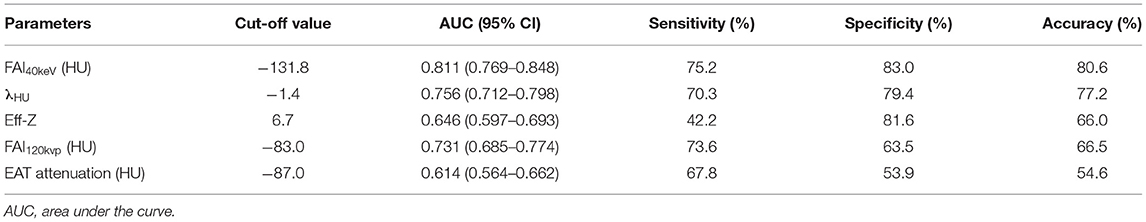
Table 5. Cut-off values of PCAT indices and EAT attenuation for the detection of CAD.
Discussion
Our preliminary findings demonstrated that FAI40keV and λHU obtained from SDCT were superior to conventional polychromatic CT for detecting the pathologic changes of PCAT during the development and progression of coronary atherosclerosis. Furthermore, PCAT index on SDCT was independently associated with the presence of CAD and FAI40keV was found to be the most powerful independent indictor for CAD.
To the best of our knowledge, this is the first study exploring the relationship between PCAT indicators derived from SDCT with coronary stenosis. The present study showed statistical differences in FAI40keV, FAI120kvp, and EAT attenuation between the non-CAD and CAD groups. The results are consistent with previous studies (6, 24), which found EAT attenuation was significantly higher in the CAD group than that in the non-CAD group. In the early stage of atherosclerosis, perhaps due to the expansion of adipose tissue and accumulation of lipid (25), FAI is relatively low. With the progression of coronary atherosclerosis, as there exists a complex, bidirectional interplay between the vascular wall and perivascular fat (26), pro-inflammatory cytokines released from the vessel wall diffuse directly into the surrounding peri-coronary fat the resulting perivascular inflammation promotes the adipose tissue remodeling and fibrosis (27, 28). Meanwhile, the maturity of the adipocytes and accumulation of intracellular lipids are inhibited (29–31), the adipocyte size get smaller, the lipid droplet content are reduced (10, 32), resulting in FAI increases. In the late stage of coronary atherosclerosis, fibrosis of adipose tissue could aggravate the increase in FAI. As a result, the more severe the coronary stenosis, the higher FAI level.
Furthermore, significant differences were seen in the values of FAI40keV and λHU between the moderate and severe stenosis groups, with no significant differences between the FAI120kvp and EAT attenuation between the two groups. Correspondingly, the AUCs for FAI40keV and λHU were higher than those of FAI120kvp and EAT attenuation. Based on the results, it is speculated that the spectral information from SDCT is superior to conventional polychromatic CT in detecting subtle changes in adipose tissue caused by PCAT remodeling during atherosclerosis progression. SDCT is an imaging technology introduced in recent years, which addresses the limitation of conventional polychromatic CT which assess coronary lesions only from a morphological point of view, by providing spectral results such as VMI at a wide range of energy levels (33). In addition, SDCT enables multiple quantitative results, including λHU and Eff-Z, which make it possible to perform tissue characterization (34, 35). With the capability of simultaneous, homologous and isotropic information, and not requiring any a priori scan decisions, the SDCT provides workflow benefits making it more convenient for routine clinical use. Compared with the values obtained from a polychromatic beam, the CT value under single energy can more accurately reflect the X-ray absorption characteristics of the materials (36). We suggest that the PCAT derived from single energy reconstructions at the low end of the spectrum (corresponding to 40 keV) can better differentiate the fat densities. This is consistent with prior work of Rodriguez-Granillo et al. that showed that VMI at low energy levels (40 keV) can detect differences of fat densities in different locations (22). In our work, we also observed a similar trend in λHU and Eff-Z. Since PCAT itself is a fat component, the energy spectrum curve is a curve with the back of the arch arched upwards, and the attenuation increased with higher keV. λHU in the energy range of 40 to 70 keV is negative, and it is significantly higher in the CAD group than that in the non-CAD group. λHU may be one of the markers reflecting the inflammatory state of PCAT. However, Eff-Z is not sensitive to FAI40keV and λHU in reflecting pathological changes of PCAT because of its insufficient resolution. These findings highlight the potential value of SDCT in displaying fine changes of PCAT adjacent to plaques that could not be observed using conventional polychromatic CT. Our preliminary results suggest that FAI40keV and λHU could be the novel surrogate image-markers reflecting the remodeling of PCAT.
Our findings also suggest that PCAT has a better ability to predict vascular stenosis than overall EAT. The possible reasons can be interpreted from the following aspects: Firstly, in terms of pathophysiology, PCAT could act adjacent coronary arteries directly contributing to the development of atherosclerosis through secretion of a large number of pro-inflammatory adipocytokines relating to energy metabolism and causing inflammation in a paracrine and vasocrine manner more than as a systemic inflammatory effect (3, 37), whereas EAT attenuation more reflects the effect of abnormal lipid metabolism on atherosclerosis, that is, it reflects its role as a visceral fat bank rather than local inflammatory effects. Additionally, when the lesion is mainly on a single coronary artery, the predictive value of global EAT attenuation for vascular stenosis may be weakened as the peri-coronary fat around normal or non-significantly stenosis vessels was relatively normal.
Marwan et al. (38) support a hypothesis of different types or activity of PCAT, the more metabolically active of which might exert local effects on the coronary vessels, thus contributing to atherogenesis. The current study showed that FAI40keV was significantly higher in the maximal stenosis segments with non-calcified or mixed plaques than those with the calcified plaques in CAD cases. This may suggest that PCAT surrounding the atherosclerotic plaques with non-calcified component has higher metabolically activity. This may be related to the characteristic of highly inflamed atherosclerotic plaque, which has been discussed in detail in another separate work of our research team (39). Interestingly, the opposite results were obtained in non-CAD cases, which showed that FAI40keV adjacent to non-calcified plaques was the lowest, although the differences between the groups were not statistically significant. The reason might be that low-stage inflammation causing more lipid droplets accumulated in adipocytes and an increase in cell size (40, 41) in the early stage of atherosclerotic plaque formation. Previous research (21, 42) has shown that EAT volume was significantly greater in coronary segments with non-calcified or mixed plaques compared than those with calcified plaques. This may lead to the low attenuation of PCAT adjacent non-calcified plaques. The results seemed to suggest that the effect of different types of plaque on the adjacent PCAT is not invariable with the progress of atherosclerosis.
Recent studies (10) show that FAI can non-invasively monitor the vascular inflammation and the development of CAD in vivo. Our results demonstrated that FAI40keV was the best predictor for CAD with the optimal cut-off value of −131.8 HU. FAI40keV achieved higher AUC, sensitivity and accuracy than other parameters because of its higher sensitivity in detecting adipose attenuation differences. And with the degree of atherosclerotic lesion, FAI40keV tended to increase as mentioned in the above discussion, which reflected that FAI40keV could detect the subtle changes of PCAT around the lesions in different stages of CAD. Monitoring changes in FAI40keV during at different phases of CAD may help to better understand the mechanism of PCAT promotes atherogenesis. This may make FAI40keV a new promising imaging marker to identify and monitor the course of coronary atherosclerosis. However, there are few studies on PCAT based on SDCT, and it is difficult for us to compare with other studies.
Several limitations should be noted. First, this study is only a single-center retrospective study with limited sample size. The results need to be verified in a large prospective cohort. Second, this was a cross-sectional study, with the initial state of the study subjects unknown, and a longitudinal study would be more helpful to reveal the relationship between progression of atherosclerosis and PCAT. And lastly, the optimal cut-offs of identified need further validation.
Conclusions
Our preliminary results support the superiority of the FAI derived from spectral CT images (FAI40keV) along with the slope of the spectral attenuation curve (λHU) over the corresponding index from conventional polychromatic CT reconstructions (FAI120kvp) and EAT attenuation for detecting the pathologic changes of PCAT during the development and progression of atherosclerosis. FAI40keV could be a novel dynamic surrogate imaging marker of vascular inflammation and if its potential value was further verified in larger clinical trials with outcomes data, this could be a powerful indicator of a potential occurrence, development and prognostic information of a coronary lesion.
Data Availability Statement
The original contributions presented in the study are included in the article/Supplementary Material, further inquiries can be directed to the corresponding authors.
Ethics Statement
The study was approved by institutional review board of Shengjing Hospital of China Medical University. Written informed consent for participation was not required for this study in accordance with the national legislation and the institutional requirements.
Author Contributions
YD, KW, and YH participated in conceiving and designing of the study. YD, XC, SM, YM, QM, KZ, and TL contributed to collecting and assembling of data. YD, XC, KW, and YH contributed to analyzing and interpreting of data. YD, XC, and YH contributed to drafting of the manuscript. All authors approved the final version of manuscript for publication.
Funding
This study has received funding by the National Natural Science Foundation of China (Grant Nos. 82071920 and 81901741), the Key Research and Development Plan of Liaoning Province (No. 2020JH2/10300037) and 345 Talent Project in Shengjing Hospital of China Medical University.
Conflict of Interest
The authors declare that the research was conducted in the absence of any commercial or financial relationships that could be construed as a potential conflict of interest.
Publisher's Note
All claims expressed in this article are solely those of the authors and do not necessarily represent those of their affiliated organizations, or those of the publisher, the editors and the reviewers. Any product that may be evaluated in this article, or claim that may be made by its manufacturer, is not guaranteed or endorsed by the publisher.
Acknowledgments
The authors would like to acknowledge Mani Vembar, Hui Yao, Zheng Jia, Xiaomei Lu and Xiaoliang Xiong for their assistance with CT technology and data measurement.
Supplementary Material
The Supplementary Material for this article can be found online at: https://www.frontiersin.org/articles/10.3389/fcvm.2021.720127/full#supplementary-material
References
1. Madonna R, Massaro M, Scoditti E, Pescetelli I, De Caterina R. The epicardial adipose tissue and the coronary arteries: dangerous liaisons. Cardiovasc Res. (2019) 115:1013–25. doi: 10.1093/cvr/cvz062
2. Hirata Y, Tabata M, Kurobe H, Motoki T, Akaike M, Nishio C, et al. Coronary atherosclerosis is associated with macrophage polarization in epicardial adipose tissue. J Am College Cardiol. (2011) 58:248–55. doi: 10.1016/j.jacc.2011.01.048
3. Wu Y, Zhang A, Hamilton DJ, Deng T. Epicardial fat in the maintenance of cardiovascular health. Methodist DeBakey Cardiovas J. (2017) 13:20–4. doi: 10.14797/mdcj-13-1-20
4. Franssens BT, Nathoe HM, Leiner T, van der Graaf Y, Visseren FL, group Ss. Relation between cardiovascular disease risk factors and epicardial adipose tissue density on cardiac computed tomography in patients at high risk of cardiovascular events. Eur J Prevent Cardiol. (2017) 24:660–70. doi: 10.1177/2047487316679524
5. Mahabadi AA, Balcer B, Dykun I, Forsting M, Schlosser T, Heusch G, et al. Cardiac computed tomography-derived epicardial fat volume and attenuation independently distinguish patients with and without myocardial infarction. PLoS ONE. (2017) 12:e0183514. doi: 10.1371/journal.pone.0183514
6. Liu Z, Wang S, Wang Y, Zhou N, Shu J, Stamm C, et al. Association of epicardial adipose tissue attenuation with coronary atherosclerosis in patients with a high risk of coronary artery disease. Atherosclerosis. (2019) 284:230–6. doi: 10.1016/j.atherosclerosis.2019.01.033
7. Goeller M, Tamarappoo BK, Kwan AC, Cadet S, Commandeur F, Razipour A, et al. Relationship between changes in pericoronary adipose tissue attenuation and coronary plaque burden quantified from coronary computed tomography angiography. Eur Heart J Cardiovasc Imaging. (2019) 20:636–43. doi: 10.1093/ehjci/jez013
8. Mancio J, Oikonomou EK, Antoniades C. Perivascular adipose tissue and coronary atherosclerosis. Heart. (2018) 104:1654–62. doi: 10.1136/heartjnl-2017-312324
9. Fernandez-Alfonso MS, Gil-Ortega M, Aranguez I, Souza D, Dreifaldt M, Somoza B, et al. Role of PVAT in coronary atherosclerosis and vein graft patency: friend or foe? Br J Pharmacol. (2017) 174:3561–72. doi: 10.1111/bph.13734
10. Antonopoulos AS, Sanna F, Sabharwal N, Thomas S, Oikonomou EK, Herdman L, et al. Detecting human coronary inflammation by imaging perivascular fat. Sci Transl Med. (2017) 9:398. doi: 10.1126/scitranslmed.aal2658
11. Yu M, Dai X, Deng J, Lu Z, Shen C, Zhang J. Diagnostic performance of perivascular fat attenuation index to predict hemodynamic significance of coronary stenosis: a preliminary coronary computed tomography angiography study. Eur Radiol. (2020) 30:673–81. doi: 10.1007/s00330-019-06400-8
12. Oikonomou EK, Marwan M, Desai MY, Mancio J, Alashi A, Hutt Centeno E, et al. Non-invasive detection of coronary inflammation using computed tomography and prediction of residual cardiovascular risk (the CRISP CT study): a post-hoc analysis of prospective outcome data. Lancet. (2018) 392:929–39. doi: 10.1016/S0140-6736(18)31114-0
13. Goeller M, Achenbach S, Cadet S, Kwan AC, Commandeur F, Slomka PJ, et al. Pericoronary adipose tissue computed tomography attenuation and high-risk plaque characteristics in acute coronary syndrome compared with stable coronary artery disease. JAMA Cardiol. (2018) 3:858–63. doi: 10.1001/jamacardio.2018.1997
14. Huang X, Gao S, Ma Y, Lu X, Jia Z, Hou Y. The optimal monoenergetic spectral image level of coronary computed tomography (CT) angiography on a dual-layer spectral detector CT with half-dose contrast media. Quant Imaging Med Surg. (2020) 10:592–603. doi: 10.21037/qims.2020.02.17
15. Yi Y, Zhao XM, Wu RZ, Wang Y, Vembar M, Jin ZY, et al. Low Dose and low contrast medium coronary CT angiography using dual-layer spectral detector CT. Int Heart J. (2019) 60:608–17. doi: 10.1536/ihj.18-340
16. Zopfs D, Lennartz S, Laukamp K, Grosse Hokamp N, Mpotsaris A, Maintz D, et al. Improved depiction of atherosclerotic carotid artery stenosis in virtual monoenergetic reconstructions of venous phase dual-layer computed tomography in comparison to polyenergetic reconstructions. Eur J Radiol. (2018) 100:36–42. doi: 10.1016/j.ejrad.2018.01.008
17. Neuhaus V, Abdullayev N, Grosse Hokamp N, Pahn G, Kabbasch C, Mpotsaris A, et al. Improvement of image quality in unenhanced dual-layer CT of the head using virtual monoenergetic images compared with polyenergetic single-energy CT. Invest Radiol. (2017) 52:470–6. doi: 10.1097/RLI.0000000000000367
18. Taguchi N, Oda S, Kobayashi T, Naoe H, Sasaki Y, Imuta M, et al. Advanced parametric imaging for evaluation of Crohn’s disease using dual-energy computed tomography enterography. Radiol Case Rep. (2018) 13:709–12. doi: 10.1016/j.radcr.2018.04.002
19. Ma Q, Hu J, Yang W, Hou Y. Dual-layer detector spectral CT versus magnetic resonance imaging for the assessment of iron overload in myelodysplastic syndromes and aplastic anemia. Jpn J Radiol. (2020) 38:374–81. doi: 10.1007/s11604-020-00921-9
20. Raff GL, Chinnaiyan KM, Cury RC, Garcia MT, Hecht HS, Hollander JE, et al. SCCT guidelines on the use of coronary computed tomographic angiography for patients presenting with acute chest pain to the emergency department: a report of the Society of Cardiovascular Computed Tomography Guidelines Committee. J Cardiovas Computed Tomogr. (2014) 8:254–71. doi: 10.1016/j.jcct.2014.06.002
21. Hassan M, Said K, Rizk H, ElMogy F, Donya M, Houseni M, et al. Segmental peri-coronary epicardial adipose tissue volume and coronary plaque characteristics. Eur Heart J Cardiovasc Imaging. (2016) 17:1169–77. doi: 10.1093/ehjci/jev298
22. Rodriguez-Granillo GA, Capunay C, Deviggiano A, De Zan M, Carrascosa P. Regional differences of fat depot attenuation using non-contrast, contrast-enhanced, and delayed-enhanced cardiac CT. Acta Radiol. (2019) 60:459–67. doi: 10.1177/0284185118787356
23. Sampat MP, Whitman GJ, Stephens TW, Broemeling LD, Heger NA, Bovik AC, et al. The reliability of measuring physical characteristics of spiculated masses on mammography. Br J Radiol. (2006) 79:S134–40. doi: 10.1259/bjr/96723280
24. Pracon R, Kruk M, Kepka C, Pregowski J, Opolski MP, Dzielinska Z, et al. Epicardial adipose tissue radiodensity is independently related to coronary atherosclerosis. A multidetector computed tomography study. Circulation J. (2011) 75:391–7. doi: 10.1253/circj.CJ-10-0441
25. Mahabadi AA, Lehmann N, Kalsch H, Robens T, Bauer M, Dykun I, et al. Association of epicardial adipose tissue with progression of coronary artery calcification is more pronounced in the early phase of atherosclerosis: results from the Heinz Nixdorf recall study. JACC Cardiovas Imaging. (2014) 7:909–16. doi: 10.1016/j.jcmg.2014.07.002
26. Lin A, Dey D, Wong DTL, Nerlekar N. Perivascular adipose tissue and coronary atherosclerosis: from biology to imaging phenotyping. Curr Atheroscler Rep. (2019) 21:47. doi: 10.1007/s11883-019-0817-3
27. Wernstedt Asterholm I, Tao C, Morley TS, Wang QA, Delgado-Lopez F, Wang ZV, et al. Adipocyte inflammation is essential for healthy adipose tissue expansion and remodeling. Cell Metabol. (2014) 20:103–18. doi: 10.1016/j.cmet.2014.05.005
28. Numaguchi R, Furuhashi M, Matsumoto M, Sato H, Yanase Y, Kuroda Y, et al. Differential phenotypes in perivascular adipose tissue surrounding the internal thoracic artery and diseased coronary artery. J Am Heart Assoc. (2019) 8:e011147. doi: 10.1161/JAHA.118.011147
29. Skiba DS, Nosalski R, Mikolajczyk TP, Siedlinski M, Rios FJ, Montezano AC, et al. Anti-atherosclerotic effect of the angiotensin 1-7 mimetic AVE0991 is mediated by inhibition of perivascular and plaque inflammation in early atherosclerosis. Br J Pharmacol. (2017) 174:4055–69. doi: 10.1111/bph.13685
30. Quesada I, Cejas J, Garcia R, Cannizzo B, Redondo A, Castro C. Vascular dysfunction elicited by a cross talk between periaortic adipose tissue and the vascular wall is reversed by pioglitazone. Cardiovas Therapeut. (2018) 36:e12322. doi: 10.1111/1755-5922.12322
31. Qi XY, Qu SL, Xiong WH, Rom O, Chang L, Jiang ZS. Perivascular adipose tissue (PVAT) in atherosclerosis: a double-edged sword. Cardiovasc Diabetol. (2018) 17:134. doi: 10.1186/s12933-018-0777-x
32. Back M, Yurdagul A Jr, Tabas I, Oorni K, Kovanen PT. Inflammation and its resolution in atherosclerosis: mediators and therapeutic opportunities. Nat Rev Cardiol. (2019) 16:389–406. doi: 10.1038/s41569-019-0169-2
33. Marin D, Fananapazir G, Mileto A, Choudhury KR, Wilson JM, Nelson RC. Dual-energy multi-detector row CT with virtual monochromatic imaging for improving patient-to-patient uniformity of aortic enhancement during CT angiography: an in vitro and in vivo study. Radiology. (2014) 272:895–902. doi: 10.1148/radiol.14132857
34. Jia Y, Xiao X, Sun Q, Jiang H. CT spectral parameters and serum tumour markers to differentiate histological types of cancer histology. Clin Radiol. (2018) 73:1033–40. doi: 10.1016/j.crad.2018.07.104
35. Goo HW, Goo JM. Dual-Energy CT: new Horizon in medical imaging. Korean J Radiol. (2017) 18:555–69. doi: 10.3348/kjr.2017.18.4.555
36. Matsumoto K, Jinzaki M, Tanami Y, Ueno A, Yamada M, Kuribayashi S. Virtual monochromatic spectral imaging with fast kilovoltage switching: improved image quality as compared with that obtained with conventional 120-kVp CT. Radiology. (2011) 259:257–62. doi: 10.1148/radiol.11100978
37. Noyes AM, Dua K, Devadoss R, Chhabra L. Cardiac adipose tissue and its relationship to diabetes mellitus and cardiovascular disease. World J Diabetes. (2014) 5:868–76. doi: 10.4239/wjd.v5.i6.868
38. Marwan M, Hell M, Schuhback A, Gauss S, Bittner D, Pflederer T, et al. CT Attenuation of pericoronary adipose tissue in normal versus atherosclerotic coronary segments as defined by intravascular ultrasound. J Computer Assisted Tomogr. (2017) 41:762–7. doi: 10.1097/RCT.0000000000000589
39. Chen X, Dang Y, Hu H, Ma S, Ma Y, Wang K, et al. Pericoronary adipose tissue attenuation assessed by dual-layer spectral detector computed tomography is a sensitive imaging marker of high-risk plaques. Quant Imaging Med Surgery. (2021) 11:2093–103. doi: 10.21037/qims-20-860
40. Aldiss P, Davies G, Woods R, Budge H, Sacks HS, Symonds ME. ’Browning’ the cardiac and peri-vascular adipose tissues to modulate cardiovascular risk. Int J Cardiol. (2017) 228:265–74. doi: 10.1016/j.ijcard.2016.11.074
41. Sun K, Kusminski CM, Scherer PE. Adipose tissue remodeling and obesity. J Clin Invest. (2011) 121:2094–101. doi: 10.1172/JCI45887
Keywords: pericoronary adipose tissue, dual-layer spectral detector CT, coronary artery disease, fat attenuation index, epicardial adipose tissue
Citation: Dang Y, Chen X, Ma S, Ma Y, Ma Q, Zhou K, Liu T, Wang K and Hou Y (2021) Association of Pericoronary Adipose Tissue Quality Determined by Dual-Layer Spectral Detector CT With Severity of Coronary Artery Disease: A Preliminary Study. Front. Cardiovasc. Med. 8:720127. doi: 10.3389/fcvm.2021.720127
Received: 03 June 2021; Accepted: 06 September 2021;
Published: 30 September 2021.
Edited by:
Zahra K. Motamed, McMaster University, CanadaReviewed by:
Mariana Vasconcelos, São João University Hospital Center, PortugalFilippo Cademartiri, Gabriele Monasterio Tuscany Foundation (CNR), Italy
Copyright © 2021 Dang, Chen, Ma, Ma, Ma, Zhou, Liu, Wang and Hou. This is an open-access article distributed under the terms of the Creative Commons Attribution License (CC BY). The use, distribution or reproduction in other forums is permitted, provided the original author(s) and the copyright owner(s) are credited and that the original publication in this journal is cited, in accordance with accepted academic practice. No use, distribution or reproduction is permitted which does not comply with these terms.
*Correspondence: Kunhua Wang, wang-christina@163.com; Yang Hou, houyang1973@163.com
†These authors have contributed equally to this work