Breathing In-Depth: A Parametrization Study on RGB-D Respiration Extraction Methods
 Jochen Kempfle
 Kristof Van Laerhoven
- Ubiquitous Computing, University of Siegen, Siegen, Germany
As depth cameras have gotten smaller, more affordable, and more precise, they have also emerged as a promising sensor in ubiquitous systems, particularly for detecting objects, scenes, and persons. This article sets out to systematically evaluate how suitable depth data can be for picking up users’ respiration, from small distance changes across the torso over time. We contribute a large public dataset of depth data over time from 19 persons taken in a large variety of circumstances. On this data, we evaluate and compare different state-of-the-art methods and show that their individual performance significantly depends on a range of conditions and parameters. We investigate the influence of the observed torso region (e.g., the chest), the user posture and activity, the distance to the depth camera, the respiratory rate, the gender, and user specific peculiarities. Best results hereby are obtained from the chest whereas the abdomen is least suited for detecting the user’s breathing. In terms of accuracy and signal quality, the largest differences are observed on different user postures and activities. All methods can maintain a mean accuracy of above 92% when users are sitting, but half of the observed methods only achieve a mean accuracy of 51% while standing. When users are standing and additionally move their arms in front of their upper body, mean accuracy values between the worst and best performing methods range from 21 to 87%. Increasing the distance to the depth camera furthermore results in lower signal quality and decreased accuracy on all methods. Optimal results can be obtained at distances of 1–2 m. Different users have been found to deliver varying qualities of breathing signals. Causes range from clothing, over long hair, to movement. Other parameters have shown to play a minor role in the detection of users’ breathing.
1 Introduction
Respiration is the physiological process of our body to exchange carbon dioxide with oxygen. Inhalation mainly happens through actively contracting the diaphragm and increasing the thoracic cavity, while exhalation typically occurs as a passive process due to the elasticity of the lungs. In contrast to most other vital body functions, respiration can be controlled consciously. Unconscious breathing on the other hand is controlled by the respiratory centers of the brainstem that regulate the respiratory rate mainly depending on the pH of the blood. Monitoring a subject’s respiration plays an important role in medical diagnosis and treatment Cretikos et al. (2008) as it tends to not only change with physical exercise, but also with a range of conditions like fever and illness Parkes (2011). Beyond medical applications like sleep assessment or asthma therapy, in sports and fitness applications as well as in mindfulness and meditation exercises the respiratory rate often is used to assess a subject’s performance. Likewise, in these scenarios the user often is required to maintain a specific breathing pattern and needs to rely on external feedback that might be improved given a suitable sensing device.
Conventional sensors like mask-like spirometers, respiration belts worn around the chest, or skin-based photoplethysmography, but also more recently proposed methods utilizing body-worn inertial sensors, like Haescher et al. (2015), require physical contact to the user’s body and, over longer time periods, tend to become uncomfortable or restraining for the person to wear. Especially in fitness applications, but also in scenarios where users perform breathing exercises for stress reduction, like for instance meditation, such devices should be easy to set up, comfortable to wear, non-obtrusive, and not cause distraction as these conditions might lower their acceptance.
Several methods have been proposed to estimate a person’s breathing through ambient sensing, eliminating the need of any body-worn devices. Methods based on a depth camera picking up the tiny changes in distance of the chest or abdomen during respiration hereby have shown promising results. Yet, most proposed methods are designed for certain, well-defined scenarios and lack a systematic evaluation of important parameters and conditions, such as distance to the camera, the observed body region, or the user introducing subtle body movements while for instance standing upright. Furthermore, user studies often are conducted with only a few participants and a quantitative comparison to different methods barely is available. It therefore remains widely unclear how the existing methods perform under various conditions and how they compete. In our previous work, Kempfle and Van Laerhoven (2020), we proposed a new method that overcomes many limitations of current state-of-the-art depth-based respiration estimation methods, which does not require the user to lie down or sit still and is robust against small body movements and the user occasionally occluding its upper body with its arms. An example of this method in action is presented in Figure 1. A feasibility study was presented that shows this approach outperforms existing methods in scenarios where users are standing or occluding themselves, but a more in-depth analysis of the impact of many important parameters and conditions and a discussion under which conditions which method is to be preferred still is missing.
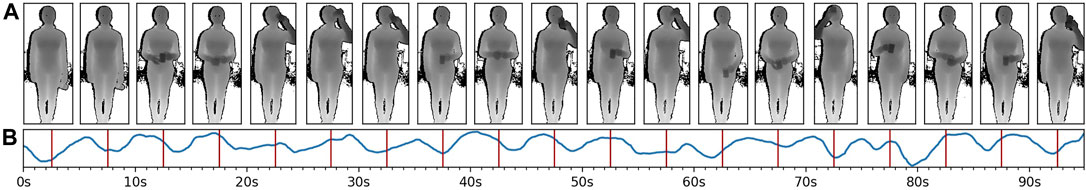
FIGURE 1. An example of depth-based respiration estimation, taken from a distance of 2 m. The different frames of a depth recording are drawn on the (A), starting at 2.5 s with an equal spacing of 5 s. The breathing signal as estimated from a model-based approach is drawn on the (B). Red markers indicate the time points at which the respective frame above the marker was captured. In general, the user can be anywhere in the frame, and the model-based approach allows the user to perform activities that self-occlude the torso. An overview of the model-based as well as various other types of state-of-the-art depth-based respiration estimation methods will be presented in Section 3.
This article provides a detailed and systematic analysis for the performance of the most common techniques, and discusses the circumstances under which any of these methods has the most advantages to be used. We test against key parameters, including the observed user’s body region, the user’s pose and activity level, the distance between user and the camera, and the user’s respiratory rate.
The contributions of this paper can be summarized as:
• A benchmark dataset comprising depth data of the torso from 19 participants (12 male, 7 female), each recorded at three different conditions, namely sitting, standing, and standing with self occlusion, taken from different distances, at two respiratory rates of 10 or 15 breaths per minute.
• An in-depth evaluation and comparison of six different state-of-the-art depth-based breathing estimation methods, covering estimation accuracy and error, and signal quality in terms of Pearson correlation coefficient and signal-to-noise ratio.
• Results on the influences on each method’s performance for key parameters: 1) the observed torso region, 2) whether the user is sitting, standing, or standing with self occlusions, 3) the distance to the depth camera, 4) the respiratory rate, 5) the gender, and 6) user-specific influences.
A repository of all depth estimation and evaluation code in this article, along with the benchmark dataset, is made public in order to support further research on this topic as well as the reproduction of our results.
2 Related Work
To date, several approaches exist to measure respiration from a distance, either optically or with the use of RF-antennas. Optical methods hereby initially used standard RGB and near-infrared cameras and, more recently, increasingly take advantage of depth cameras as sensing devices. While RF-based approaches for remote respiration estimation are an interesting research field on their own, in this section we will focus on optical and depth-sensing methods only. A good primer on RF-based methods for instance is given in Wang et al. (2016) where with the Fresnel model the underlying principle of these methods is presented. Recent literature reviews with a more detailed overview of contactless respiration measuring methods in general, and for depth-based methods in special can be found in Massaroni et al. (2020) and Addison et al. (2021), respectively.
2.1 Non-Depth Optical Methods
Non-depth optical methods most commonly compute optical flow to extract the respiration signal from a video stream, such as techniques presented in Nakajima et al. (1997), Nakajima et al. (2001), and Kuo et al. (2010), but also approaches using image subtraction techniques exist, such as Tan et al. (2010). In Bauer et al. (2012), the result of an optical flow based method is compared to that of a method using a depth sensor with surface registration from Bauer et al. (2011) with the finding that the respiration measurement based on optical flow delivers a more accurate respiratory rate estimate compared to mere Time of Flight (ToF) depth measurements. According to Keall et al. (2006), human breathing mainly occurs along the superior-inferior direction, supporting above finding and giving some advice for upcoming algorithms.
2.2 Depth-Based Methods
The measurement principle of depth-based respiration estimation relies on observing the change in distance of the chest or abdomen towards the depth sensor during respiratory cycles. Inhalation increases the torso volume and will bring these regions closer to the depth camera while exhalation will revert this effect. The change of distance for normal breathing typically is in the range of millimeters to a few centimeters, depending on the person and observed body area. Due to the small distance changes caused by breathing, depth-based methods are susceptible to even slight body movements, especially towards the camera. In most of the related work, the observed person therefore needs to keep still by for instance sitting on a chair with back support or by lying down.
Early versions of depth-based methods from Penne et al. (2008) and Schaller et al. (2008) fixed a plane on the chest and the abdomen each of a person lying on a horizontal surface and measured the Euclidean distance of the these planes to the supporting surface plane. Over time, the distance changes of the planes reflect the person’s breathing movements.
Instead of attaching a plane, Noonan et al. (2012) initially compute the mean orientation of a fixed 10 cm × 20 cm rectangular selection on the center of the person’s thorax over 10 successive image frames. The motion component along this surface normal then becomes the person’s respiration estimate.
To obtain more reliable estimates, previous work has also suggested to explicitly model respiration using principal component analysis (PCA). The PCA model is acquired from a certain number of successive depth images of a predefined area of the user’s torso. Wasza et al. (2012) for example computes a PCA model of the user’s torso and applies the varimax rotation such that the obtained model has more relevance to respiration than the model from the standard PCA. Its principal axes were found to feature local deformations that are highly correlated to thoracic and abdominal breathing. Martinez and Stiefelhagen (2012) track the dots of a Kinect v1 IR projector on nine sleeping study participants at an optimal view and distance (2 m) of the sensor and apply a PCA to the resulting trajectories. An average trajectory then is calculated from a subset of the 16 strongest components that match certain criteria, like passing the Durbin-Watson-test or comprising a frequency range of 0.02–1 Hz.
A common method is to place fiducial markers on the chest and abdomen to define the regions where to extract the depth measurements from Wijenayake and Park (2017) for instance used white markers visible in the RGB data in combination with an Asus Xtion PRO RGB-D camera to compute a PCA model from the first 100 depth frames using the depth readings inside the region defined by the markers only. The first three principal components of such a patient-specific model then are used to reconstruct a noise-free surface mesh. The change of volume of such a mesh has shown strong correlation to spirometer data.
Other works use the shoulder and hip joints as delivered by the Kinect SDK’s joint detection to define the region of interest. Aoki and Nakamura (2018) for instance uses the depth data within these Kinect joint positions to explicitly model a so called quasi-volume of the user’s chest by using Delaunay triangulation with linear interpolation. This so called quasi-volume is shown to be proportional to the air volume as measured by a spirometer of 6 male study participants. Soleimani et al. (2017) in addition to computing the respiration signal with a volume based approach also computes the signal by taking the mean of the respective depth values and compares both outcomes. It has been shown that the volume-based approach was less accurate while being computationally much more expensive. Since the depth camera does not see the back of the user, volume-based methods bound the volume at a certain constant distance threshold to the back. The volume is computed by integrating over the distances of the single surface vertices to the back boundary, with the integral basically being a weighted sum. As the surface vertices reflect the depth measurements, the mean of the respective depth pixel values therefore approximates a value that, apart from subtracting the distance threshold, is proportional to the volume. Due to their low computational complexity, the majority of the proposed respiration estimation methods are based on computing the mean, as will be shown below.
A early mean-based prototype for capturing a person’s respiration with a Kinect v1 sensor is presented by Xia and Siochi (2012). The mean of all depth values within a hand-annotated rectangular selection comprising the chest is computed to obtain the average distance of the chest to the depth camera for every received depth frame. The key idea is, that the chest elevation during breathing is expected to cause most depth pixels, and thus the average among all pixels, to correlate with the breathing motion. Benetazzo et al. (2014) use the shoulder and hip joints as delivered by the Kinect SDK to determine the region of interest. All depth values within that region are averaged per frame, followed by a weighted average of four successive mean values to reflect the respiration data over time. This work is the first to provide an evaluation of different parameters for a mean-based approach. It includes sampling rates being varied between 5, 7, and 9 Hz, different orientations (0° or 25°), three different light intensities, and variable clothing worn by the observed person (sweater, jacket, and T-Shirt). The evaluation however is approach-specific and results show that the parameters tested have in the end little effect on the proposed algorithm’s performance.
Centonze et al. (2015) and Schätz et al. (2015) use a depth camera to observe the respiration of sleeping persons and classify different sleep states (being awake, in REM, or non-REM) by using features that contain the frequency and the regularity of the breathing. The respiration signal is obtained from the average of the depth values within the hand-annotated chest region. Furthermore, in Schätz et al. (2015) also the averages of pixel-wise depth differences over two successive depth frames are computed, and Centonze et al. (2015) applies linear interpolation between two successive depth frames to by-pass non-equidistant sampling caused by the depth camera.
With the addition of the 2D RGB data component that is available in many depth cameras, extra biophysical information can be extracted. Procházka et al. (2016) in addition to the respiratory rate also estimates the heart rate by using a built-in RGB and infrared camera to detect the slight changes around the mouth caused by blood pressure changes for each heart beat. The respiratory rate is, as in previous work, obtained by averaging all depth pixels within a rectangular selection at the torso. Both signals are band-pass-filtered with the respective cut-off frequencies set in such a way that the frequency components that are not part of breathing or the heart rate are rejected.
In one of our earlier works, Kempfle and Van Laerhoven (2018), we evaluated a typical mean-based approach, i.e., averaging the depth values inside a certain window, in a small study comprising 7 participants sitting in a chair with back support. The evaluated parameters include the distance to the depth camera, the window location and size, the respiratory rate, and the sampling rate of the Kinect v2 used, with the outcome that all parameters have their specific influence on the signal quality.
All depth-based methods described above are only evaluated on study participants that are required to either lie down or to sit still. In a previous study, Kempfle and Van Laerhoven (2020), we proposed a new, difference based approach that does not need a user to lie down or remain sedentary, but can tackle interference with swaying movements introduced while staying. Furthermore, the method is capable of dealing with partial occlusion events that for instance may be caused by gesticulating with the arms in front of the body. Our method assumes in contrast to most of the above approaches that the depth camera is at an unknown distance to the user and that the user’s position is not known beforehand. Additionally, users are not limited to having to lie down or remain sedentary without moving, but instead can be standing upright and move their arms and hands in front of their chest and abdomen area.
From above mentioned depth-based methods, we selected the most used ones to compare them against our difference based method on a study dataset from 19 participants. The chosen methods first are detailed in the next section.
3 Methods Overview
From the related work we compiled three recent methods for depth-based remote respiration estimation. These are based on 1) performing a principal component analysis, 2) computing the mean of a certain area, and 3) taking the difference of a barely breathing correlated region from the mean of a highly affected region using a torso surface model. From these three distinct approaches, we derived overall six variants to be systematically compared in our study, using the performance measures described in Section 4.2. The methods under consideration are the PCA, Mean Raw, Median Raw, Diff Mean, Diff Median, and Diff Model. These methods and their particular details are described in the following, after a short introduction on how the region is selected that will be used to extract the breathing signal from and that will be common for all methods. We hereby focus on an indoors setting where a user is facing a depth camera, that also tracks the user’s body joints. These body joints, namely the neck, the hip, and both left and right shoulder joint positions as estimated by the Kinect v2 framework, are used to define the breathing relevant region of interest. The hip and shoulder joint positions hereby define the anchor points of the torso window which subsequently is subdivided into the chest and abdomen regions. All three regions will be examined for their suitability of extracting a respiration signal and thus are sampled from by all methods independently. The neck joint on the other hand only serves as the anchor point for a barely respiration affected reference area at the throat and thus will only be used by difference based methods that use this region to subtract the motion component from the breathing signal. With the distinct body regions being defined, we now step into the details of the six different methods. An overview of all methods can also be found in Figure 2.
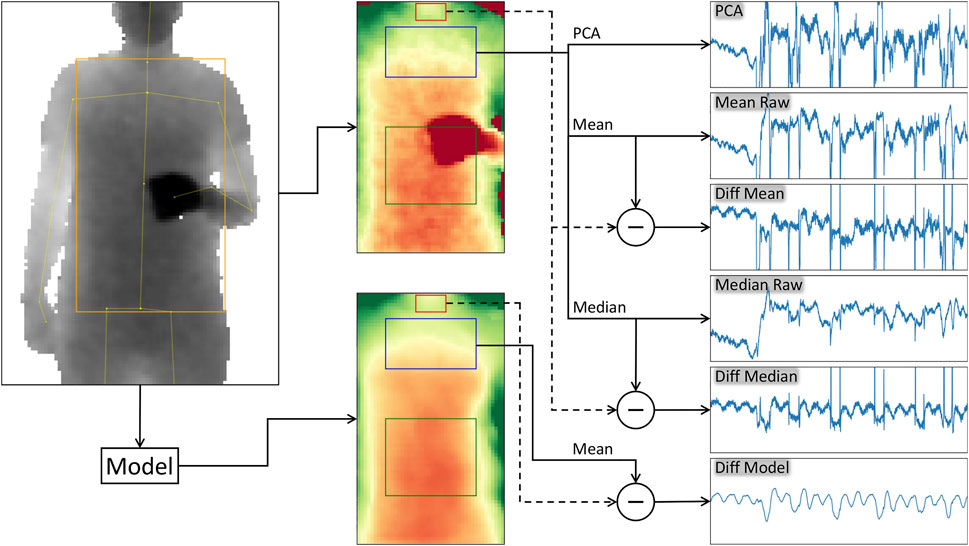
FIGURE 2. Overview of the methods used. The example is taken from a distance of 3 m, with the user standing upright and performing regular self occlusions with a cup in his hands. The process starts with the camera’s depth input frame and the estimated joint positions of the user (top left). Both are either forwarded to a model as proposed in Kempfle and Van Laerhoven (2020) (bottom left) to reconstruct the torso surface and find the regions of interest (bottom mid) or the joint positions are used directly to find the regions of interest (top mid). In the latter case, the torso surface is redrawn for comparison purposes to the model output (middle images). The model is able to filter out most of the noise and to recover occluded torso regions. The regions of interest are the throat (red), the chest (blue), the abdomen (green), and the torso (chest and abdomen windows combined, including the region in between both, not drawn in the images). The depth pixel values within the different regions, in this example the values of the chest and, depending on the method, the throat region, are used to compute a single respiration state value. The respiration signal then is given by the history of these values. On the right are the plots of the resulting breathing signals of the different methods. From top to bottom: The signal of the PCA, Mean Raw, Diff Mean, Median Raw, Diff Median, and the Diff Model. The PCA uses the first 180 input frames (6 s) to compute the principal components, the respiration signal then is computed from the first component of the PCA model. The Mean Raw and Median Raw methods compute the mean or the median of the depth values within the given torso region, for instance the chest as shown here. The Diff Mean and Diff Median methods on the other hand use the 90th percentile of the throat region depth values as reference for the user movement and subtract it from the respective values obtained by their Mean Raw or Median Raw counterparts. Their signals contain less distortions stemming from body movements, like swaying. The Diff Model method does the same, but computes the difference from the mean of the selected region of the model output. Its breathing signal is much smoother and barely contains distortions or spikes stemming from motion artifacts and occlusion events.
PCA
Methods based on performing a principal component analysis are a common approach to compute the respiration signal from depth images. As mentioned above, we use the hip and shoulder joint position estimates to find the respective region of interest. Due to the PCA computation requiring a predefined number of pixels, the window’s size needs to be fixed to certain extents. The size is given from the shoulder and hip joint positions of the very first frame. The fixed window, however, is free to move and will be anchored on the left shoulder joint position from the respective frame. Fitting the PCA model is done with the first 180 frames, or the first 6 s of the capture sequence. The respiration signal afterwards is given from the first component of the PCA model and, for the evaluation, will be computed from all frames, including the first 180 frames.
Mean Raw and Median Raw
Mean based methods form the majority of the current state of the art. The respiration signal is extracted by, for each frame, computing the mean of all depth values within a given region of interest as defined by the hip and shoulder joints. This region, for each frame, is free to change in size and position, which, in addition to the simple computation of the mean, is a big advantage of this method. The Median Raw method basically is the same as the Mean Raw, but instead of the mean, computes the median of the given region of interest. We argue that the median, especially in the case of surface deformation or occlusion, will be more robust than the mean. All three methods described so far are likely to be sensitive to motion, occlusion, and window misalignment.
Diff Mean and Diff Median
In our previous work, we found that motion artifacts caused by even small whole body movements, like swaying while standing, have a significant impact on the respiration signal quality. For the mean-based method, this condition decreases the accuracy of the respiratory rate estimation by up to 50%. To overcome such motion artifacts, our proposed difference based methods try to subtract the motion from the actual respiration movements of the body. They rely on subtracting the signal of a reference area that barely is affected by breathing from a signal of one of the highly breathing correlated regions at the chest, abdomen, or the entire torso. The region around the throat was found to be minimally affected by breathing while serving as a good reference for motion artifacts of the upper body. Both, the Diff Mean and the Diff Median therefore compute the mean or the median of the given region of interest and this far are identical to the Mean Raw or Median Raw, respectively. In a second step, the motion reference signal as given by the 90th percentile of the region around the throat, is subtracted from the previously computed respiration signal. The region at the throat is determined with the help of the neck and shoulder joints. Both methods are derived from the model-based method we proposed in our earlier work. Their advantage is that they do not need a model, are easy and fast to compute, comprise a mechanism to counteract motion artifacts, and that the window comprising the observed torso region is free to change in size and position from frame to frame.
Diff Model
To compensate for noise, window misalignment, and especially occlusion, in our previous research, we proposed a method that is able to counteract these issues by low-pass filtering the data, fitting the window to the most reasonable body area, and by detecting and recovering occluded regions with an image in-painting technique. This method computes an internal model of the torso surface area spanning from the throat to the hip and that is based on the currently and previously captured depth images and body joint positions. The model outputs an aligned, occlusion recovered, and noise reduced depth image of the torso that can be used for extracting the respiration signal as described by above methods. We go for the difference-based approach and subtract the 90th percentile of the throat region from the mean of the respective region of interest. The regions hereby again are computed from the joint positions. This method is more stable against noise, window misalignment, motion artifacts, and occlusion, but also has higher computational complexity and, in the current form, requires a fixed window size for the torso region that needs to be initialized in the beginning.
4 Study Design
The performance of the six different methods introduced in Section 3 and how they compare to each other under a series of variable settings, including changing the distance to the depth camera, different breathing rates, different user postures, and using a variety of study participants to date remains unknown. The goal of this study therefore is to evaluate all methods on a common dataset and with expressive performance measures. In this section, we first present the details and recording parameters of our dataset and after that, we introduce four different performance measures to yield quantitative results about the accuracy and signal quality of the different methods.
For the recordings, participants are asked to position themselves comfortably in front of a Kinect v2 depth camera at different distances as marked on the floor, facing the depth sensor, and to follow a paced breathing visualization. This visualization serves the purpose to make the recordings independent of user specific breathing behaviours, such that it does not interfere with the influence of the different other parameters. Participants did not wear any sensors to exclude effects on the breathing behaviour, for instance due to distraction. Ground truth is obtained from the respective settings in the paced breathing tool. The depth sensor is fixed to the height of 1.40 m for all recordings and recording was done in a well-lit indoors environment where two adjacent walls with large windows along the entire length of the walls cause challenging lighting conditions. The orientation of the camera was fixed at an angle of 25° towards the floor for the sessions while sitting and at an angle of 0° while standing, so that the participants’ entire torso was visible in all depth frames, especially at small distances. Our capturing tool records the raw depth frames and the respective body joint estimates as given from the Kinect SDK and stores the data of each session in a separate file. Figure 3 shows some examples of the depth data from a distance of 2 m for all participants while sitting, along with some examples while standing upright with occlusions (holding a cup in front of the torso and performing drinking gestures).
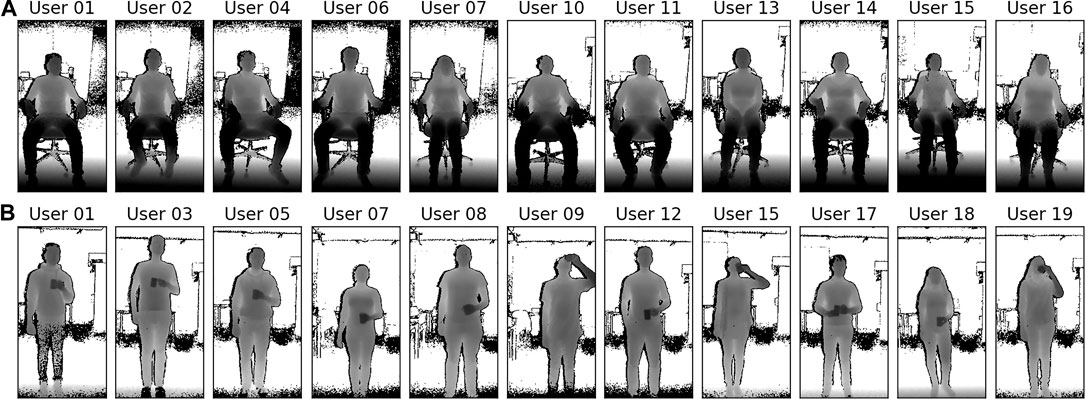
FIGURE 3. In our study, 19 study participants (12 male, 7 female, all participants aged between 22 and 57 years old) were asked to sit or stand in front of a depth sensor and follow a breathing visualization. All participants were recorded for 20 sessions, each at 4 different distances from the depth camera, two different paced breathing rates, and for the three conditions sitting, standing, and standing with occlusion. Shown are exemplary depth data taken at a distance of 2 m from some participants while sitting (A), and while holding a cup and performing drinking gestures (B), leading to regular occlusions of the torso.
4.1 Study Participants and Protocol
For the experiments, we have locally recruited 19 participants that were not diagnosed with respiratory illnesses, 12 of them male and 7 of them female. During the recordings, they were wearing their regular indoors clothing, ranging from tops, T-shirts, sleeved shirts, collared shirts, sweatshirts to woollen pullovers and hoodies. Each participant was beforehand shown the depth imaging equipment and was briefed on the study goals and the research questions.
The 19 participants were told to sit through 20 recording sessions for about 5 min each for a number of parameters, interspersed with short 5 min breaks:
1) In a first condition, participants were asked to sit in an adjustable office chair in front of the depth sensor. The height of the chair was fixed to 0.5 m, but its back support could be reclined and did not need to be used (i.e., participants could lean back or not, as they preferred). To fix the distances between chair and depth camera, markers were taped to the floor to define the exact positions where the chair had to be placed. Participant were asked to face the depth camera and to keep the arms away from the chest area (e.g., on the chair’s armrests) such that the participant’s upper body was fully visible to the depth sensor.
2) In a second condition, the participants were instructed to stand in an upright position following the same rule as in the first session, i.e., to keep their arms away from the torso region. The goal of this session is to observe the torso’s motion while the observed person is standing relatively still, but does not have the support of a chair’s seating and back surfaces. Having to stand upright for several minutes tends to introduce a range of motions that are unrelated to the breathing movements of the torso region; Some participants did move their arms in different positions during the recordings (for instance, switching between hands on the back and hands in the pockets) or repositioned themselves to a more comfortable posture, making it potentially challenging to extract a respiration signal from these data.
3) A third condition introduced frequent occlusions by instructing the participants to hold a cup of tea in front of their torso while standing upright. At the start of the session, participants were recorded for 20 s while holding their cup away from the torso. For the remainder of the session, participants were instructed to occlude their stomach and chest regions with the cup by performing drinking gestures. Such self-occlusions also occur when gesticulating, but the drinking gestures were found to be particularly challenging due to their relatively slower speeds of execution and the larger, additional occlusion of an in-hand object. Participants were not required to hold the cup in a particular hand and some participants moved the cup with both hands at the same time to the mouth.
For each participant, these conditions were recorded at distances of 1, 2, 3, and 4 m between participant and depth camera. For conditions 1) and 2) the recordings were repeated at two respiration rates, 0.17 and 0.25 Hz, obtained through paced breathing. Condition 3) was recorded at 0.17 Hz. For the paced breathing, participants were asked to adhere to a paced breathing visualization shown on the display. The intention is to guide participants’ respiration at a stable rate to make the recordings independent of user specific breathing behaviours and more comparable with respect to the different parameters. The recording was started after about 2 min, to give the respective participant a chance to adapt his or her respiration rate to the given target frequency. Overall our dataset comprises 380 unique recordings with over 9.5 h of such respiration data.
4.2 Performance Measures
Overall, we compute four different performance measures: The accuracy, the precision, the correlation to the ground truth, and the signal-to-noise ratio (SNR). The accuracy describes, how accurate the respiratory rate can be computed from the breathing signal as obtained from the respective method. The precision describes, how far the respiratory rate is off from the ground truth, the correlation describes how similar the signal is to the ground truth, and the SNR describes the quality of the signal, i.e., how well the breathing signal stands out of the noise and thus how well it can correctly be extracted.
For the computation of the accuracy, the breathing signal is shifted to frequency domain with the Fast Fourier Transform (FFT) using a moving window approach. The moving window has the length l and is moved over the signal with the step size s, splitting the signal up into different equally sized segments. These segments will have a certain overlap that can be defined by both windowing parameters l and s. If the dominant frequency within the range of 0.1 Hz (6 breaths/min)–1.5 Hz (90 breaths/min) of such a segment is equal to the ground truth frequency, this segment is considered a correct estimate. The number of correct estimates divided by the overall number of segments of a single session’s respiration signal for a given algorithm is the average accuracy for this session (user, distance, etc.) and algorithm. Its computation formally is stated in Equations 1, 2.
Due to the frequency binning of the FFT, the window length is a crucial parameter for the accuracy computation. A narrow window length yields a good time resolution, providing many segments to test the signal against the ground truth, but can not provide a fine frequency resolution as a broad spectrum of frequencies will fall into the same frequency bin. This effectively lowers the precision of the accuracy measure since this whole spectrum will be considered a correct estimate. To yield a precision of one breath per minute, a window covering 60 s of data would be required. A wide window length on the other hand generates fewer signal segments, effectively reducing the resolution of the accuracy measure. Furthermore, due to their length, signal distortions or short periods of frequency deviations may be shadowed or cause the entire segment to fail the test against the ground truth.
To make the accuracy measure more expressive, we introduce a measure for the frequency estimation error that tells how far the estimated respiratory rate is off from the ground truth frequency. For this, in a first step the frequency resolution locally is increased by interpolating the dominant frequencies using Quinn’s second estimator. The difference of the refined, more precise dominant frequency and the ground truth frequency then becomes the estimation error as again formally defined in Equation 3. The error first is computed for each window used in the accuracy computation separately and the different windows’ errors are averaged afterwards to yield the mean error of the whole sequence of a single recording.
The similarity of our method’s estimated breathing time series to a given ground truth signal is assessed by computing their Pearson correlation coefficient (PCC) as given in Eq. 4:
To ensure a high confidence of the PCC, it is computed on the whole, fixed length of the signal. With its several thousand samples, even the 99% confidence intervals are narrow and only a small fraction apart from the computed PCC value. Also, we are interested in an expressive quality measure of the overall signal, even if the signal locally may show a higher PCC. The ground truth is given as a sine signal obtained from the frequency settings of our paced respiration setup.
The signal quality is measured in terms of the signal-to-noise ratio (SNR) as defined in Equation 5. A higher SNR value means that the respiratory signal more significantly stands out from the noise and therefore is easier to extract from the data. The SNR also is computed on the signal as a whole.
5 Evaluation
In this section, the influence of various parameters on the six different methods (also see Section 3) are investigated. The parameters under consideration are the region of interest (chest, abdomen, or the entire torso), the condition (sitting, standing, or standing with occlusions), the distance of the participant to the depth camera (1–4 m), the user’s breathing rate (10 or 15 breaths per minute), and the gender. Additionally, we summarize some user dependent observations we made during the evaluation at the end of this section. In all following accuracy and error evaluations, a fixed FFT window length of 48 s is used. It has the advantage that both, the 0.17 and 0.25 Hz frequencies from our paced breathing setup can accurately be resolved by a simple rectangular windowing function such that no frequency leakage occurs at the target frequencies. The window is moved over the signal with a step size of one breathing cycle, i.e., with 6 s at 0.17 Hz (10 bpm) and 4 s at 0.25 Hz (15 bpm). Overall, the windowing yields a frequency resolution of about 0.02 Hz or 1.2 breaths per minute and 7 or 10 distinct windows to test for the accuracy. The signals furthermore are evaluated on the raw output of the algorithms, i.e., there is no filtering applied to the signals in the following results. An example of the output signals will be given in Figure 4 and is discussed in Section 5.1. The following sections then, beginning with an examination of the three different torso regions, will each separate out a single parameter and, using the previously proposed performance measures, show its influence on the results of all methods when applied to our dataset (also see Section 4).
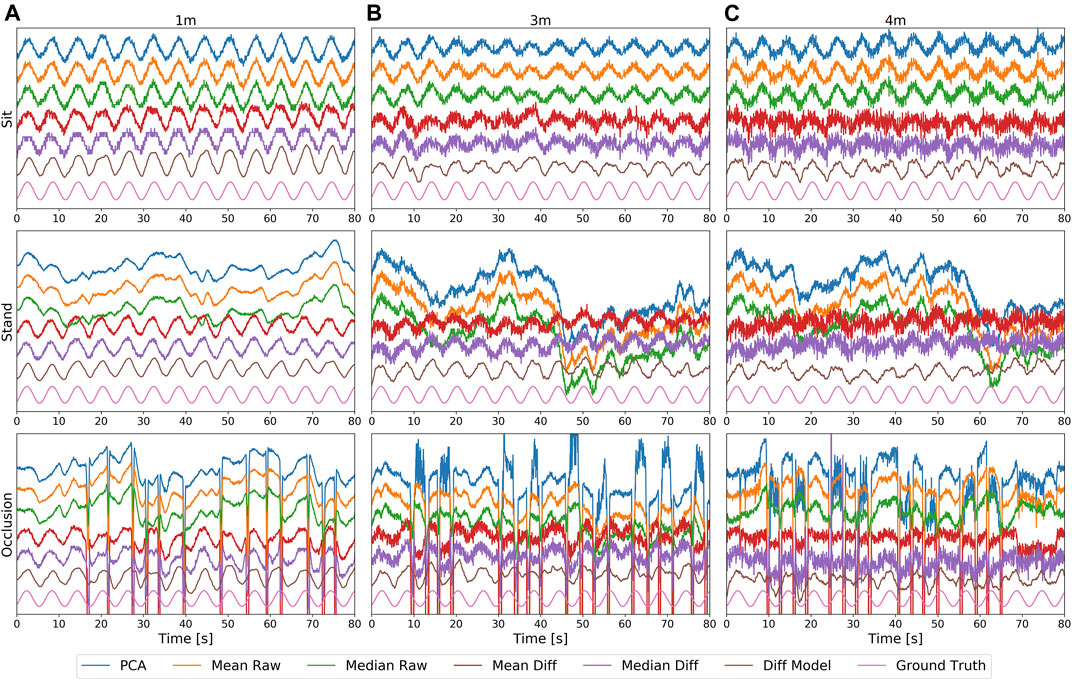
FIGURE 4. The respiration signals from the methods PCA, Mean Raw, Median Raw, Mean Diff, Median Diff, and Diff Model, as well as the ground truth, obtained from the chest at a distance of 1 m (A), 3 m (B), and 4 m (C) for the conditions sitting (top), standing (middle), and standing with occlusion (bottom). All signals are zero centered and normalized with respect to the mean and standard deviation of their first 240 frames (8 s) and, for better visibility, are stacked vertically in the order as mentioned above. With increasing distance, the noise level of all methods increases. The Diff Model hereby is the least affected method and the other difference based methods are affected the most. Standing introduces significant signal distortions for non-difference based methods. Occlusion events, visible as large spikes in the bottom plots, can only be handled by the Diff Model method.
5.1 Visual Inspection
Figure 4 depicts an example of the signals obtained from the various methods, with the different distances at 1, 3, and 4 m in the columns, and with the conditions sitting, standing, and standing with occlusion in the rows. For all conditions and methods, with increasing distance an increase of the overall noise level can be observed. Especially the difference based mean and median methods are strongly affected by noise, since both methods rely on subtracting two noisy signals, which increases their overall noise level. The Diff Model method has a built-in low-pass filter to prevent this effect from happening. For this reason, it has the cleanest output signal among all methods, but still shows some smaller distortions at higher distances. The PCA method, although only using the strongest component, was not able to separate out the noise from the signal.
While the sitting condition can be managed by all methods, standing introduces small swaying movements, typically in the range of a few centimeters or less, which may introduce severe signal distortions for all non-difference based methods, as shown in this example. The breathing cycles, to some extent, are still visible in the distorted signals, but other frequency components clearly dominate. The difference based methods are able to reduce the motion components and are barely affected by them.
The large spikes caused by occlusion events, as seen in the bottom plots, cause even more severe signal distortions and make it difficult to obtain a good signal. The Diff Model can internally detect and recover occluded body parts and is the only method that is not or barely affected by occlusion. The median based methods can partially deal with occlusion or at least can limit the spikes to a certain extent.
5.2 The Influence of the Torso Region
From our previous work in Kempfle and Van Laerhoven (2018), we know that the choice of the torso region to be observed plays a crucial role for the Mean Raw method in the detection of the respiration signal. For other methods, this influence yet is unknown, so in the following we will investigate the role of the torso region for all methods mentioned above and compare their performance to each other. Figure 5 depicts the accuracies, errors, Pearson correlation coefficients (PCC), and signal-to-noise ratios of the different methods when applied to the chest, abdomen, or the entire torso. All 380 recordings, comprising different users, distances, respiratory rates, and conditions (sitting, standing, and standing with occlusion), are combined in these plots. The observations made here thus show each method’s overall performance on the respective region. Furthermore, we did not find a single parameter combination that is more beneficial on a different body region other than suggested by these plots. The choice of the window position affects the performance of all other parameter settings in the same or in a similar way. The condition, to some extent, has an influence on the choice of the window position as for instance in the occlusion scenario the abdomen was occluded for longer time periods and more often than the chest. This, however, does not change the observed trend and we refer to Sec. 5.3 for more details on the influence of the condition. In this section, we will focus on the overall performance of the different methods at the different body regions.
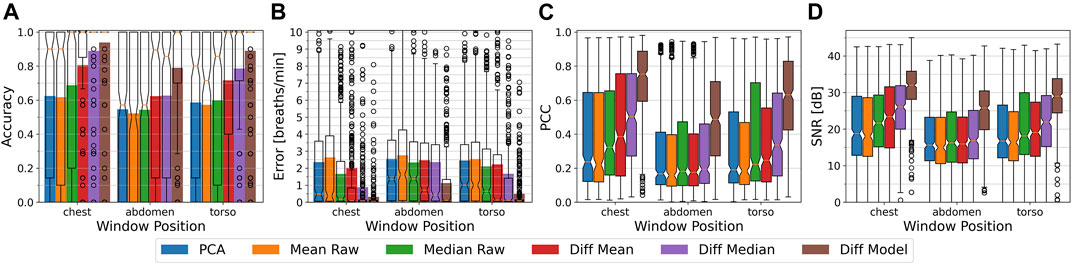
FIGURE 5. From (A–D): The respiratory rate accuracy, errors in breath per minute, Pearson Correlation Coefficient w.r.t. the ground truth signal, and signal to noise ratio of the different methods. Plots are separated by the chest, abdomen, and torso region with all conditions (sitting, standing upright, and occlusion), distances (1–4 m), and respiratory rates (10 and 15 bpm) combined. Accuracy and error metrics use a Fast Fourier Transform window with a length of 48 s. The colored bars show the averages, while overlay box plots show median (middle parts) and whiskers marking data within 1.5 IQR. All algorithms perform best on the chest region, while the abdomen especially for the difference based methods causes high performance drops.
Chest
At the chest, the PCA and Mean Raw methods show with a mean accuracy of about 62% (median 90%) and a mean error of above 2.3 bpm (median about 0.4 bpm) the lowest performance values, but with the PCA performing a little bit better than the Mean Raw. The Median Raw achieves with a mean accuracy of 69% (median 100%) and a mean error of 1.66 bpm (median 0.17 bpm) slightly better performance values and seems to be more robust than both previous methods (also see Sec. 5.3). The Diff Mean likewise is with an average accuracy of 80% (median 100%) and a mean error of 2.0 bpm (median 0.08 bpm) outperformed by its Diff Median counterpart, which has an average accuracy of 89% (median 100%) and a mean error of 0.87 bpm (median 0.06 bpm). Both methods clearly benefit from subtracting the motion component obtained from the throat, since without the subtraction, both are identical to the Mean Raw or Median Raw respectively. The highest performance is achieved by the Diff Model method. At the chest, it has a mean accuracy of 94% (median 100%) and a mean error of 0.3 bpm (median 0.06 bpm). The box-plot overlays of the accuracy plots furthermore reveal that the Diff Median and the Diff Model are able to correctly estimate the respiratory rate of the majority of the 380 samples, except for the outliers marked as circles. There are some differences, however. While the Diff Model’s accuracy is only about 5% above that of the Diff Median, its mean error is almost three times lower.
In terms of signal quality, the PCA and the Mean Raw show a median Pearson Correlation Coefficient (PCC) of about 0.22, and a median signal-to-noise ratio (SNR) of about 18 dB. The Median Raw achieves with a median PCC of 0.32 and a median SNR of 21.5 dB slightly better values. The Diff Mean likewise is with a median PCC of 0.39 and a median SNR of 23 dB outperformed by the Diff Median with its median PCC of 0.5 and median SNR of 26 dB. The Diff Model achieves with a median PCC of 0.75 and a median SNR of 32 dB a notably higher PCC and SNR than all other methods.
Abdomen
At the abdomen, the PCA, Mean Raw, and Median Raw show with a mean and median accuracy of about 53% and a mean error of about 2.3–2.8 bpm (median 1.4–1.6 bpm) a similar performance. Compared to the chest, the Median Raw thus has a higher performance loss than the other two methods. The Diff Mean and the Diff Median also show a similar performance. Their mean accuracy lies at about 62% (median 85–89%) and their mean error at about 2.4 bpm (median 0.4–0.7 bpm). Both methods, but especially the Diff Median, show the highest loss in performance as compared to the chest. The Diff Model’s performance also significantly lowers at the abdomen, but with a mean accuracy of 79% (median 100%) and a mean error of 1.1 bpm (median 0.1 bpm) it still outperforms all other methods. In terms of signal quality, all methods, except for the Diff Model, show a median PCC in the range of 0.16–0.19 and a median SNR in the range of 15–17 dB. The Diff Model on the other hand has a median PCC of 0.49, and a median SNR of 26 dB.
Torso
The torso region includes both, the chest and the abdomen, and likewise yields intermediate results between both other regions. The difference based methods hereby again outperform the other methods and end up more favourably than at the abdomen. The Diff Model furthermore with a mean accuracy of about 89% only loses about 5% as compared to the chest, while both other difference based methods lose about 10% in accuracy. Also it’s mean error of about 0.5 breaths per minute is considerably lower and closer to the error at the chest than that of the other methods.
Summary
Overall, the chest region is the optimal choice, since it yields, regardless of the method used, the highest accuracy, lowest errors, highest PCCs, and highest SNRs. The abdomen has shown to be the least suitable region for detecting the respiration signal and, in relation to the other regions, marks the lower bound on all performance metrics.
We argue that all methods benefit from a larger signal amplitude that, during breathing, stems from a greater expansion of the chest than of the abdomen. Another aspect that needs to be considered is that during the occlusion condition, the abdomen was the body region that was occluded most of the time which further lowers the detectability of the respiration signal.
Comparing the different methods among themselves shows that the Diff Model method, regardless of the observed body region, overall is superior to all other methods, followed by the Diff Median and the Diff Mean. The accuracy box plots furthermore suggest that, except for some outliers, the Diff Model as well as the Diff Median methods can at the chest optimally estimate the respiratory rate. The weakest methods are the PCA and the Mean Raw. The difference based methods, however, comprise larger performance drops at the abdomen or torso than the other methods, which means they are more susceptible to the choice of the body region. We argue that the difference based methods perform comparably worse on the abdomen due to the spatial distance of the abdomen to the throat, where the reference region for subtracting the motion components is located. A swaying motion has a larger amplitude at the throat than on the abdomen and additionally the upper body can, to a certain extent, move independently from the lower body, whereas the chest motion can be assumed to be similar to the throat motion.
On all body regions, the Diff model has a notably better signal quality than all other methods. One reason for the Diff Model’s higher PCC and SNR is, as suggested by its accuracy and error values, that the true breathing signal can better be estimated by this method, but this alone does not explain the relatively big difference to the Diff Median. The main reason is that the Diff Model method uses a low-pass filtering technique and thus is able to model the torso surface with a significantly reduced noise level. From the improved torso surface reconstruction it then can extract a much cleaner respiration signal.
Since the chest has been shown to be the most suited region for extracting the respiration signal, we will focus on this region in the following sections. Beginning with the influence of the condition, we will step by step provide a deeper insight into the specific influence of each single parameter on the overall performance of the different methods.
5.3 The Influence of the Condition (Sit, Stand, Occlusion)
The methods proposed in previous works primarily have been evaluated in scenarios where the study participants were lying down or sitting still. We argue that in a more realistic scenario the observed person should also be allowed to stand in front of the camera, possibly performing regular self-occlusion gestures. For this reason, we assess in this section the performance of the different methods for the three conditions sitting, standing, and standing with self-occlusions by performing drinking gestures with a cup. Figure 6 plots the accuracies, errors, PCC values, and signal-to-noise ratios of the different methods against the three mentioned conditions. As stated above, we will primarily focus on the chest, but for completeness, in Figure 6 we also append the evaluation data of the abdomen and the torso. Where appropriate, we will point to specific findings that in our view are strongly influenced by the condition as well as by the observed torso region and thus could not be considered in full detail in the previous section.
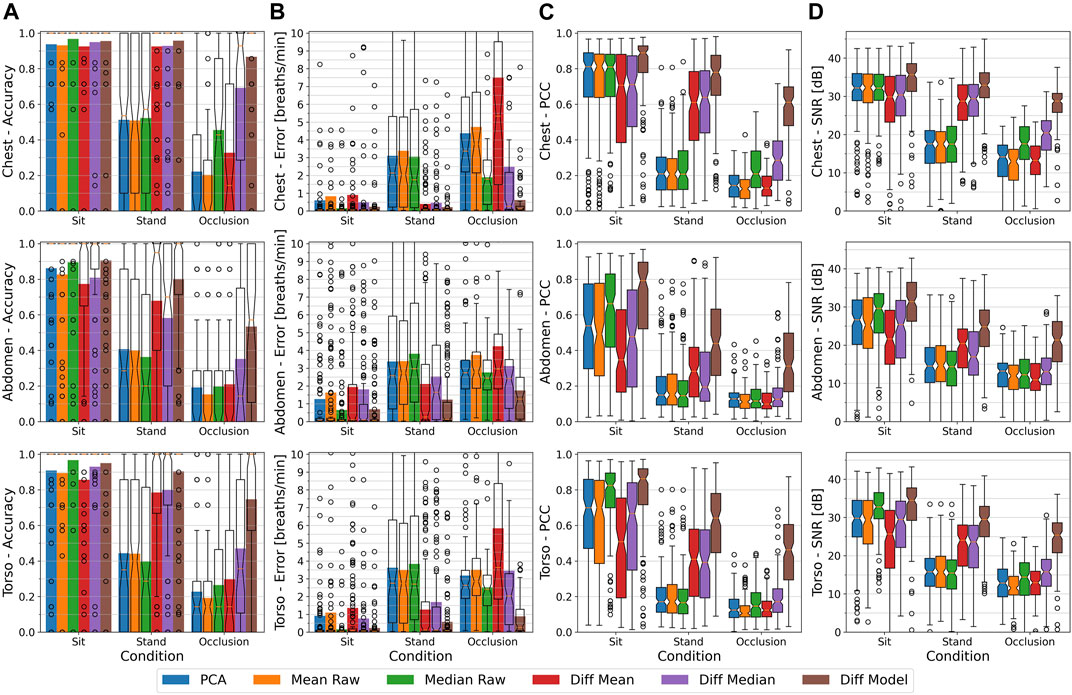
FIGURE 6. From (A–D): The respiratory rate accuracy, errors in breath per minute, Pearson Correlation Coefficient w.r.t. the ground truth signal, and signal to noise ratio of the different methods. Plots are separated from top to bottom by the chest, abdomen, and torso region and by the sitting, standing, and occlusion condition, with all distances (1–4 m) and respiratory rates (10 and 15 bpm) combined. Accuracy and error metrics use a Fast Fourier Transform window with a length of 48 s. The colored bars show the averages, while overlay box plots show median (middle parts) and whiskers marking data within 1.5 IQR. Sitting results for all methods in a much clearer signal than standing upright, with standing and occlusion (holding a cup and performing drinking gestures, right measures) performing worse than just standing upright.
Sitting (Chest)
Sitting still (or lying down) barely introduces motion artifacts and all methods in previous work have been evaluated for a static scenario like sitting or lying down. So, as expected, all methods can deal with the sitting condition without problems. The mean accuracy stays above 92% for all methods and the box plots fully remain at 100% with only a few outliers spread across the plot. The Median Raw performs with a mean accuracy of 96.5% and a mean error of 0.15 bpm better than all other methods, closely followed by the Diff Model and the Diff Median with a mean accuracy of 95.5 and 95%, and a mean error of 0.24 and 0.49 bpm respectively. In terms of signal quality, the Diff Model outperforms the other methods with a median PCC of 0.88 and a SNR of 35 dB. The PCA, Mean Raw, and Median Raw all comprise a median PCC of 0.81 and a SNR of 32 dB, while the remaining difference based methods form the lower bound with a median PCC of 0.7 and a median SNR of about 30 dB, both with wide spread box plots. We argue that the latter two methods suffer from subtracting two noisy signals, hence increasing the overall noise level. The Diff Model with its built-in low-pass filter behaviour can reduce the noise sufficiently well and, moreover, also has a better signal quality than the non-difference based methods.
Standing (Chest)
Standing introduces slight motion artifacts that mainly are caused by small, unconscious swaying movements while keeping balance, but sometimes they also stem from the user relieving a leg, moving an arm by for instance taking the hands out of the pockets, or by changing its posture in general. The non-difference based methods, i.e., the PCA, Mean Raw, and Median Raw, can not compensate for these motion artifacts which leads to a mean accuracy of about 51% (median in the same range) and a mean error of about 3.1–3.8 bpm (median 1.8–2.1 bpm). The Diff Mean and Diff Median are able to subtract the motion components and thus can better deal with the standing condition. Their mean accuracy lies at about 93% (median 100%), and their mean error ranges from 0.4 to 0.46 bpm. The Diff Model outperforms all other methods with a mean accuracy of 96% (median 100%) and a mean error of 0.22 bpm. In terms of signal quality, the non-difference based methods show a median PCC of 0.21 and a median SNR of 17 dB. The Diff Mean and Diff Median have a median PCC of about 0.6 and a median SNR of about 29 dB, and the Diff Model finally has a median PCC of 0.78 and a median SNR of 33 dB.
Occlusion (Chest)
The drinking gestures cause even more body movements than standing alone and furthermore introduce regular self-occlusions through the arms and the cup held in the hands. The PCA and Mean Raw can not compensate for any of these events and therefore only have a mean accuracy of about 21% (median 0%) with relatively large mean errors of 4.4–4.7 bpm (median 3.4–3.8 bpm). Their median PCC is at about 0.13 and their median SNR at about 13–14 dB. The Median Raw, to some extent, is more robust against deviating occlusion pixels and shows a mean accuracy of 45% (median 43%), a mean error of 1.9 bpm (median 1.8 bpm), a median PCC of 0.21, and a median SNR of 17.5 dB. The difference between using the mean or the median to extract the respiration signal in the presence of occlusion gets even more apparent when the body movement gets suppressed as by the Diff Mean and Diff Median methods. The Diff Mean performs even worse than the Median Raw. It has a mean accuracy of 33% (median 14%), a mean error of 7.5 bpm (median 5.3 bpm), a median PCC of 0.13, and a median SNR of 13 db. Its median counterpart on the other hand has a mean accuracy of 69% (median 93%), a mean error of 2.5 bpm (median 0.26 bpm), a median PCC of 0.28, and a median SNR of 20 dB. This finding strongly encourages the use of the median instead of the mean to estimate the breathing signal in the presence of occlusions. The Diff Model can detect and recover occluded body regions and therefore again outperforms all other methods. It has a mean accuracy of 87% (median 100%), a mean error of 0.62 bpm (median 0.12 bpm), a median PCC of 0.61, and a SNR of 29 dB.
Dependency on Body Region
The overall influence of the body region already was explained in Sec. 5.2, so in this section we will focus on the interdependency of the condition and the body region. We will try to provide the most important information about this interdependency on a higher level, without going through all different performance values in detail. For reference, all performance measures can be found in Figure 6. At the abdomen and at the entire torso, but especially at the abdomen, all performance measures drop when compared to the chest. The decrease in performance, however, is less marked during the sitting condition. Here, the Median Raw and the Diff Model can deal with the different body regions the best, while the Diff Mean shows the largest performance losses. During standing, the PCA, Mean Raw, and Median Raw show a weak performance on all regions. The Diff Mean and the Diff Median, while comprising a high performance at the chest, are strongly affected at the other body regions, mostly at the abdomen. The Diff Model can deal with the standing condition well when looking at the chest or the entire torso, but struggles at the abdomen. The difference based method’s decrease in performance during the standing condition is likely caused by the spatial distance of the reference region at the throat to the respective body region, like the abdomen. For the occlusion condition, we will only look at the Diff Median and the Diff model. While the Diff Median gets severely affected at the torso and even more at the abdomen, the Diff Model can maintain an acceptable performance at the torso, but also struggles at the abdomen. During the occlusion condition, the methods do not only have to deal with the participants standing upright, as before, but also with a mug being held in one or both hands and being moved in front of the torso. Since the hand by most participants and most of the time was held in front of the abdomen and only occasionally was moved over the chest while performing a drinking gesture, the abdomen, but also the torso are prone to comprise a lot more motion artifacts than the chest.
Summary
While all methods are able to achieve high performance values during the sitting condition, a completely different picture is drawn at the other conditions. Standing introduces small motion artifacts which the PCA, Mean Raw, and Median Raw methods can not compensate for. These motion artifacts thus interfere with the respiration signal and consequently their performance decreases significantly. The Diff Mean, Diff Median, and Diff Model are able to subtract the motion components from the signal and can, at least at the chest, maintain a comparably high performance as compared to the sitting condition. During the occlusion condition, the PCA and Mean Raw, as well as the Diff Mean again experience a significant drop in performance as compared to standing alone, while the Median Raw does not show such a high decrease in performance. As the median typically is more robust against outliers, the methods using the median have a higher chance of not seeing an occlusion or of only suffering from it at a fraction of the time. Consequently, the Diff Median is able to deal with the occlusions better than all methods mentioned above, but still it is heavily affected by the hand movements. The Diff Model on the other hand can handle the occlusions much better, but, to some extent, also experiences a drop in performance.
5.4 The Influence of Distance to the User
There are two important factors that influence the breathing estimation when changing the distance of the user to the depth camera. First, with increasing distance the body region appears smaller on the image frame and fewer depth pixels are available for extracting the respiration signal. Secondly, the noise level of the depth camera’s pixel readings increases with distance. Consequently, with increasing distance of the user, a lower signal quality can be expected due to the decreasing amount of breathing related depth pixels available for averaging out the increasing noise. Another aspect is that in close proximity not all body joints may be visible, and on far distances the body joint estimation may not work due to too few body features being distinguishable on the smaller body appearance. For the Kinect SDK, the highest distance is at about 4–4.5 m, and a minimum distance of 1 m has been shown to be sufficiently far away during our experiments.
In this section, we will evaluate the influence of an increasing distance on the breathing estimation. Figure 7 depicts the accuracies, errors, PCC, and SNR values at the chest of the different methods at distances ranging from 1 to 4 m. The plots are separated into the three conditions sitting, standing, and occlusion. This ensures to not confuse the influence of the distance with a performance dependency on the condition and enables us to show the particular differences among conditions.
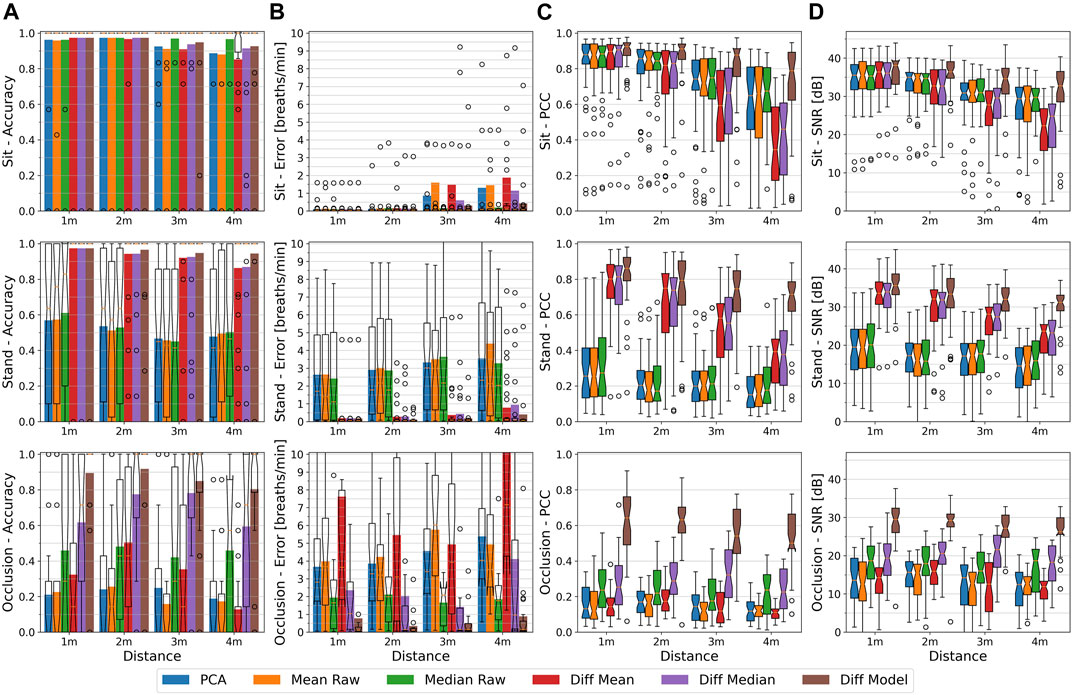
FIGURE 7. From (A–D): The respiratory rate accuracy, errors in breath per minute, Pearson Correlation Coefficient w.r.t. the ground truth signal, and signal to noise ratio of the different methods at the chest. Plots are separated from top to bottom by the sitting, standing, and occlusion condition and by the distance between 1 and 4 m, with all respiratory rates (10 and 15 bpm) combined. Accuracy and error metrics use a Fast Fourier Transform window with a length of 48 s. The colored bars show the averages, while overlay box plots show median (middle parts) and whiskers marking data within 1.5 IQR. The breathing rate is detected slightly less accurately and the PCC and SNR values decrease when the user is further away from the camera. The Diff Model method remains robust for different distances and conditions.
Sitting
While sitting, all methods can maintain a median accuracy of 100% at all distances and except for the Diff Mean at 4 m, also all method’s box plots fully remain at an accuracy of 100% with only a few more outliers at higher distances. Their mean accuracy likewise is highest at close distances, but decreases in varying amounts towards higher distances. At distances of 1 and 2 m, all methods show a mean accuracy of about 96–97%. Their mean error at 1 m lies between 0.09 and 0.12 bpm (medians at about 0.04 bpm) and increases at 2 m to about 0.12–0.15 bpm (medians at about 0.05 bpm). From 3 m onwards, in terms of accuracy and error, a small but noticeable performance drop can be observed for most methods. The Median Raw hereby is minimally affected by the distance and is able to maintain a mean accuracy of about 97% and a maximum mean error of about 0.19 bpm at 4 m. The PCA, Mean Raw, and Diff Mean are affected the most and show at 3 m a mean accuracy of about 91–92% with a mean error between 0.86 bpm for the PCA to 1.6 bpm for the Mean Raw (all medians at about 0.06 bpm). At 4 m, their performance values lower to a mean accuracy of about 85% (Diff Mean) to 88% and a mean error of 1.3 bpm for the PCA to 1.9 bpm for the Diff Mean (all medians at about 0.09 bpm). The Diff Median shows a mean accuracy and error of 94% and 0.6 bpm at 3 m, and 91% and 1.1 bpm at 4 m, and the Diff Model achieves 95% and 0.3 bpm at 3 m, and 93% and 0.4 bpm at 4 m, respectively.
In terms of signal quality, the PCC and SNR values also drop with increasing distance, but on a much larger scale than the accuracy, and with extending box plots towards higher distances. The median PCC of the PCA, Mean Raw, and Median Raw drop from a value of about 0.87 at 1 m to about 0.66 at 4 m, and their SNR drops from 35 db to about 29 db. The Diff Mean performs worst on higher distances with a median PCC ranging from 0.89 at 1 m to 0.34 at 4 m, and a median SNR from 36 to 22 db. It is closely followed by the Diff Median with a median PCC range from 0.89 at 1 m to 0.45 at 4 m and a median SNR range from 36 to 25 db. The Diff Model is least affected by the distance and spans from a median PCC of 0.92 at 1 m to 0.78 at 4 m and a median SNR from 38 to 33 db.
Overall, the influence of the depth camera’s increasing noise level at higher distances can best be observed in a seated position where the respiration signal is not disturbed by motion artifacts. When looking at the unfiltered PCA, Mean Raw, or Median Raw methods, their PCC and SNR values get worse on higher distances whereas the Diff Model method with its inherent low-pass filtering remains more stable over all distances. The Diff Mean and Diff Median methods on the other hand decrease the most in signal quality due to computing the difference of two noisy signals, hence amplifying the overall noise. Both methods show the importance of low-pass filtering the depth values when using a difference-based approach for computing the respiration signal.
Standing
The standing condition introduces random body movements, for instance swaying while keeping balance, which have a dominating influence on all non-difference based methods. Since the influence of the standing condition is not predictable and may vary in between different distances, the results of these methods have to be taken with caution. For this reason and because the non-difference based PCA, Mean Raw, and Median Raw show similar performances on all measures, we refrain from listing them separately, but instead summarize their general trend. Their mean accuracy is with about 59% highest at 1 m, drops to about 45% at 3 m, and interestingly increases again at 4 m to about 49%. This increase likely is caused by some participants moving less at 4 m, which also is supported by the other methods that do not show such an increase. Their mean error increases from about 2.5 bpm (median 1.1–1.7 bpm) at 1 m to about 3.5 bpm (median 2.2–3.0 bpm) at 3 m. At 4 m, the PCA and Median Raw have a mean error of about 3.5 and 3.3 bpm, and the Mean Raw of about 4.4 bpm (all medians at about 2.2 bpm). The Diff Mean and Diff Median show a similar mean accuracy on all distances that decreases from 97% at 1 m to 86% at 4 m. Their mean error increases from 0.18 bpm (median 0.06 bpm) at 1 m to 0.78 bpm for the Diff Mean and to 0.95 bpm for the Diff Median (all medians 0.08 bpm) at 4 m. The Diff Model also starts with a mean accuracy of 97% and a mean error of 0.18 bpm (median 0.06 bpm) at 1 m, but it only lowers to 95% and 0.4 bpm (median 0.07 bpm) at 4 m. The difference based methods’ accuracy box plots furthermore fully remain at 100% at all distances.
The median PCC and SNR values of the PCA, Mean Raw, and Median Raw methods lie between about 0.25 and 20 dB at 1 m and 0.16 and 15 dB at 4 m, all indicating a poor signal quality. The Diff Mean and Diff Median start with a median PCC and SNR of 0.81 and 34 dB at 1 m and drop to about 0.38 and 23 dB at 4 m, which is a similar trend as for the sitting condition. With increasing distance, the Diff Model also loses in signal quality, but with a median PCC and SNR between 0.86 and 36 dB at 1 m, and 0.72 and 31 dB at 4 m, it performs significantly better than the other methods. Being able to maintain a better signal quality especially at higher distances also explains its higher accuracy as compared to the other difference based methods.
Occlusion
With the introduction of self-occlusion events, it is barely possible to draw any conclusions about the influence of the distance on methods that are not able to deal with those. The reason is that random amounts, extents, and times of the occlusions on top of random movements caused by staying enter the breathing signal in an unpredictable way. Recordings at higher distances might comprise less motion artifacts and thus are likely to yield better performance values than recordings from close distances, or vice versa. These random signal distortions therefore are likely to shadow any effects of the distance when not counteracted.
The PCA and Mean Raw have a mean accuracy below 25% at all distances and the Median Raw shows values between 42 and 48% randomly distributed between 1 and 4 m. The Diff Mean has a maximum mean accuracy of about 51% at 2 m which to both sides degrades to below 35% down to about 13% at 4 m. Except for the Median Raw, all these methods have a mean error above 3.7 bpm, a median PCC below 0.17, and a median SNR below 16 dB. The Median Raw performs better than above methods and shows a mean error of between 1.7 bpm (3 m) to 2.1 bpm (2 m), a median PCC of about 0.21, and a median SNR of about 18 dB across all distances. The Diff Median, as already described in Sec. 5.3, can deal with the occlusion scenario much better. Starting with a mean accuracy of 62% (median 71%) at 1 m, it achieves up to 78% (median 100%) at distances from 2 to 3 m, and falls down to 60% (median 71%) at 4 m. Its mean error decreases from 2.4 bpm (median 1.0 bpm) at 1 m to 14 bpm (0.15 bpm) at 3 m and increases to 4.1 bpm (median 0.93 bpm) at 4 m. Its median PCC and SNR likewise increase in between 1 and 3 m from 0.25 to 0.32 or from 19 to 22 dB and have a reduced value of 0.22 or 18 dB at 4 m. The Diff Model, in contrast to the other methods, is able to detect and recover occluded areas. It has a mean accuracy of about 90% at 1 m, 92% at 2 m and drops to about 80% at 4 m, with all median accuracies at 100%. Its mean error at 1 m is 0.77 bpm (median 0.1 bpm) and gradually increases from 0.33 bpm (median 0.1 bpm) at 2 m to 0.88 bpm (median 0.15 bpm) at 4 m. Its median PCC and SNR drop from 0.64 to 29 dB at 1 m to 0.5 and 26 dB at 4 m. All methods show a decreased performance at 1 m as compared to a distance of 2 m, which to some extent is likely to be caused by the randomness of the occlusion gestures. Another explanation may be that the occluding hand and mug block at a closer distance more infrared rays emitted by the depth sensor and cast a shadow on nearby pixels. An additional reflection of the emitted infrared rays from the mug towards the body furthermore influences a certain non-occluded area on the body surface.
Summary
The optimal distance to measure the breathing signal has been shown to be in the range from 1 to 2 m, with a tendency towards 2 m in case of occlusion events. A greater distance hereby mainly affects the signal quality as can best be observed for all methods when looking at the PCC and SNR values of the sitting condition. While sitting, the respiration signal is not disturbed by motion artifacts and thus only competes against the increasing noise level of the depth camera at higher distances. The reduced signal quality due to the increasing noise then in return has an effect on the accuracy and error rate. The type of the condition, however, has a much stronger influence than the distance. All methods that are not designed to deal with motion artifacts or occlusion show on all distances a significantly reduced performance by means of accuracy, error, and signal quality (also see Section 5.3). Due to the randomness of these signal distortions, for these methods it furthermore is barely possible to draw any conclusions about the influence of the distance, while the methods that can deal with the respective condition show a similar trend as observed for the sitting condition. In the occlusion scenario, a distance of 1 m has shown to be less optimal as compared to a distance of 2 m, which we assume is due to increased shadowing and reflection effects caused by the occluding hand and mug from the depth camera’s infrared emitter upon the body surface.
5.5 The Influence of Respiratory Rate
We recorded the sitting and standing sessions at two different respiratory rates of 10 breaths per minute (0.17 Hz) and 15 breaths per minute (0.25 Hz), both obtained from our paced breathing setup. In this section, we try to asses and quantize the influence of the respiratory rate on the different methods’ performances, namely the accuracy, error, PCC, and SNR. The performance values are taken from the chest region, include all distances, and are separated into the conditions sitting and standing. The results for the two different respiratory rates are depicted in Figure 8.
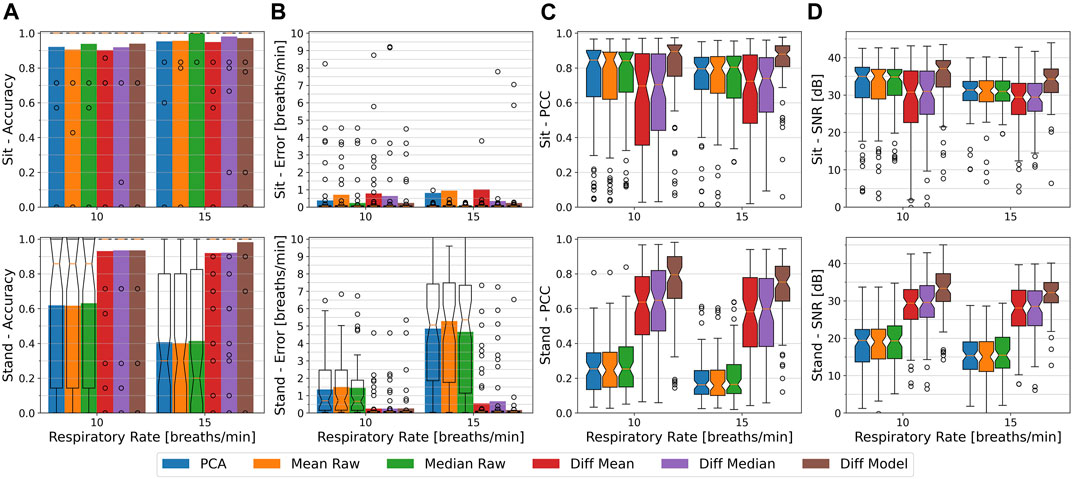
FIGURE 8. From (A–D): The respiratory rate accuracy, errors in breath per minute, Pearson Correlation Coefficient w.r.t. the ground truth signal, and signal to noise ratio of the different methods at the chest. Plots are separated from top to bottom by the sitting and standing condition and by the respiratory rate of 10 bpm or 15 bpm, with all distances (1–4 m) combined. Accuracy and error metrics use a Fast Fourier Transform window with a length of 48 s. The colored bars show the averages, while overlay box plots show median (middle parts) and whiskers marking data within 1.5 IQR. The higher respiratory rate show a slightly better accuracy over all methods when sedentary, but a lower signal quality (PCC and SNR values) on both conditions.
Sitting
While sitting, and at a respiratory rate of 10 bpm, the Median Raw and the Diff Model achieve the highest performance with a mean accuracy of about 94% and a mean error of 0.25 bpm. They are followed by the PCA and Diff Median with a mean accuracy of 92% each, and a mean error of 0.39 and 0.63 bpm respectively. The Mean Raw and Diff Mean show the lowest performance with a mean accuracy of about 91 and 90%, and a mean error of about 0.72 and 0.78 bpm, respectively. At 15 bpm, the highest mean accuracy and lowest mean error of about 100% and 0.06 bpm is achieved by the Median Raw, closely followed by the Diff Median with 98% and 0.35 bpm, and the Diff Model with 97% and 0.24 bpm. The remaining methods have a mean accuracy of about 95%, with the mean error of the PCA being at 0.82 bpm, of the Mean Raw at 0.95 bpm, and of the Diff Mean being at 1.0 bpm. Furthermore, at both respiratory rates, all methods’ accuracy box plots fully remain at 100% and all methods show a median error of about 0.05 bpm. At 10 bpm, however, much more outliers can be observed in the error plot, with most of them falling in the range of up to an error of about 4.5 bpm, hence decreasing the respective methods’ mean accuracy at the 10 bpm breathing rate.
In terms of signal quality, the PCA, Mean Raw, and Median Raw have a median PCC and SNR of about 0.85 and 35 dB at 10 bpm, and 0.8 and 30 dB at 15 bpm. The Diff Mean and Diff Median show a lower signal quality with values of 0.7 and 31 dB at 10 bpm, and 0.73 and 29 dB at 15 bpm. The Diff Model has on both respiratory rates the highest median PCC and SNR with values of 0.89 and 37 dB at 10 bpm, and 0.88 and 34 dB at 15 bpm.
Standing
While standing, the non-difference based methods, as explained in Sec. 5.3, are heavily influenced by that condition and show a low performance, but a strong influence of the respiratory rate can be observed. The mean accuracy of the PCA, Mean Raw, and Median Raw at 10 bpm is with about 62% (median 86%) much higher than at 15 bpm where it only is at about 41% (median 20% for Median Raw, 30% others). The mean error likewise is for these methods with about 1.4–1.5 bpm (median 0.7 bpm) lower at 10 bpm than at 15 bpm where it is above 4.7 bpm (median above 5.0 bpm). Likewise, their median PCC and SNR at 10 bpm indicate with values of 0.25 and 19 dB a better signal quality than at 15 bpm which in contrast shows lower PCC and SNR values of 0.15 and 15 dB.
The difference based methods are not or only barely affected by the standing condition. The Diff Mean, Diff Median, and Diff Model methods show a mean accuracy of about 93% and a mean error of 0.25 bpm at 10 bpm. At 15 bpm, the Diff Mean and Diff Median have a slightly lower mean accuracy of about 92% and a higher mean error of 0.55 and 0.67 bpm, respectively. The Diff Model on the other hand achieves at 15 bpm a higher mean accuracy of 98% and a lower mean error of 0.17 bpm. On both respiratory rates, the difference based methods furthermore show a median error of 0.06 bpm and have their accuracy box plots being fully at 100%. The median PCC and SNR values of the Diff Mean and Diff Median are at about 0.64 and 29 dB for the 10 bpm and at about 0.59 and 28 dB for the 15 bpm rate. The Diff model has the highest PCC and SNR values of 0.8 and 33 dB at 10 bpm, and 0.75 and 32 dB at 15 bpm.
Summary
All methods appear to have a lower signal quality at 15 bpm as compared to 10 bpm as indicated by both, the Pearson correlation coefficient and the signal to noise ratio. All methods’ mean accuracy values on the other hand are higher at 15 bpm during the sitting condition and for the Diff Model during the standing condition. A likely reason for this is that more signal periods fall within the 48 s FFT window at 15 bpm than at 10 bpm, making the 15 bpm signal component stronger and easier to detect in frequency domain, at least during the sitting condition with weak frequency components stemming from motion artifacts. Since the differences in accuracy are not that big, they might, however, also be caused by one or a few users. For the other cases, we argue that the higher respiration frequency interferes stronger with other body movement and thus can not be detected that easily, but it also is likely that the relatively relaxed low respiration frequency of 10 bpm (0.17 Hz) did not introduce as many motion artifacts as the faster one or was easier to maintain during the recording.
5.6 The Influence of Gender
We consider the gender an important distinguishing feature between different users. Male and female users do not only differ in body shape, but also typically show distinct differences in their clothing styles. Both these characteristics influence the torso appearance on the depth data and thus can be assumed to also have an influence on the respiration estimation. To assess gender-specific differences on all methods’ performance, we split the participants into a male and a female group, each containing 12 male or 7 female participants, respectively. Figure 9 depicts the accuracy, error, PCC, and SNR of the different methods for both groups, again divided into the three conditions sitting, standing, and occlusion.
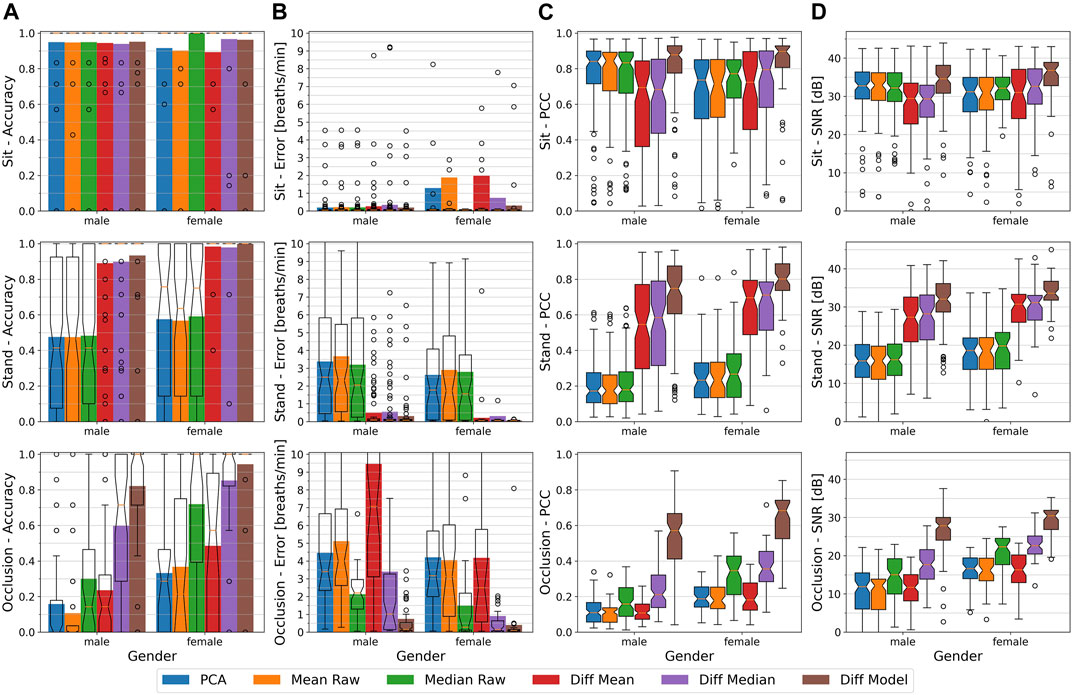
FIGURE 9. From (A–D): The respiratory rate accuracy, errors in breath per minute, Pearson Correlation Coefficient w.r.t. the ground truth signal, and signal to noise ratio of the different methods at the chest. Plots are separated from top to bottom by the sitting, standing, and occlusion condition and by the gender of the participants, with all distances (1–4 m) and all respiratory rates (10 and 15 bpm) combined. Accuracy and error metrics use a Fast Fourier Transform window with a length of 48 s. The colored bars show the averages, while overlay box plots show median (middle parts) and whiskers marking data within 1.5 IQR. Except for the sitting condition, all considered methods perform significantly better on the female participants, mostly due to unbalanced group sizes (12 male, 7 female) and highly variable results for the male participants (user 9, male, had problems in adhering to the breathing visualization, also see Sec. 5.7).
Sitting
While sitting, the male users show a mean accuracy of about 95% (box plots fully at 100%) and a mean error of 0.19–0.34 bpm (median 0.05 bpm) for all methods. In the female group, the PCA, Mean Raw, and Diff Mean achieve the lowest mean accuracy of about 90–92% and mean errors between 1.29 and 2.0 bpm (medians at 0.07 bpm), whereas the Median Raw achieves with values of 100% and 0.06 bpm (median 0.05 bpm) the highest performance. The Diff Median and Diff Model show a mean accuracy of about 96% and a mean error of 0.74 bpm (median 0.06 bpm) and 0.31 bpm (median 0.05 bpm), respectively. The accuracy box plots for all methods, like on the male group, nonetheless fully remains at 100%. When zooming out of the female’s error plot, we see a few outliers, probably from a single person, with values of up to 30 bpm that, in combination with their smaller group size, cause the mean error of the PCA, Mean Raw, Diff Mean, Diff Median to be much higher as compared to the male group.
In terms of signal quality, the PCC and SNR of the non-difference based methods are with values of 0.84 and 33 dB higher for the male group than compared to the female group with PCC values of 0.71–0.77 and a SNR of about 31–32 dB. The difference based methods on the other hand show a lower signal quality on the male group. Here, the PCC of the Diff Mean and the Diff Median have a value of 0.68 and a SNR of 29 dB as compared to a PCC of 0.72 or 0.8 and a SNR of 31 dB or 32 dB. The Diff Model achieves the highest signal quality with PCC and SNR values of 0.88 and 35 dB for the male, and 0.9 and 37 dB for female group.
Standing
The standing condition, as already mentioned in Sec. 5.3, is challenging for the non-difference based methods. All of them show a mean accuracy of about 48% (medians slightly below) and mean errors between 3.2 and 3.7 bpm (median 2–2.5 bpm) for the male, and about 58% (median 63–74%) and 2.6–2.9 bpm (median 1.5–1.7 bpm) for the female users. Their median PCC and SNR values are slightly higher for the female users, but are all below 0.27 and 20 dB. In contrast to that, all difference based methods have accuracy box plots that fully remain at 100% and median errors below 0.07 bpm. The Diff Mean and Diff Median methods show similar values per group. Their mean accuracy and mean error values lie at about 90% and at 0.51–0.55 bpm (medians 0.07 bpm) for the male, and at about 98% and at 0.21–0.30 bpm (medians 0.05 bpm) for the female group. The Diff Model has a mean accuracy of 93% and a mean error of 0.31 bpm for the male, and 100% and 0.06 bpm for the female group.
In terms of signal quality, the Diff Mean and the Diff Median show PCC and SNR values below 0.58 and of about 28 dB for the male, and below 0.7 and about 31 dB for the female users. The Diff Model has a median PCC and SNR of 0.74 and 32 dB for the male, and 0.8 and 33 dB for the female group.
Occlusion
As a general trend during the occlusion condition, we see that all methods show a higher performance on the female users than on the male group. The PCA, Mean Raw, and Diff Mean methods hereby perform worse than the other methods and can be considered to be more susceptible to occlusions than the Diff Model or both median based methods. Due to the randomness of the occlusion gestures and considering the different group sizes (12 male, 7 female), it furthermore is hard to derive an influence of the gender for all methods that are susceptible to occlusion events. For this reason, we refrain from drawing any conclusions about the influence of the gender on the PCA, Mean Raw, and Diff Mean methods. Also the median based methods have to be taken with care, but since they show reasonable results and big differences on both groups, we will examine both methods more closely. The Median Raw jumps from a mean accuracy of 30% (median 14%) and a mean error of 2.1 bpm (median 2.2 bpm) on the male group to 72% (median 100%) and 1.5 bpm (median 0.26 bpm) on the female group. Its accuracy and error for the female group are even better than its performance during the standing condition, but the occlusion condition also only was recorded at a respiratory rate of 10 bpm, which we know from Sec. 5.5 to yield higher performance values. The Diff Median similarly performs better on the female group where it shows a mean accuracy of 85% (median 100%) and a mean error of 0.9 bpm (median 0.15 bpm) as compared to values of 60% (median 71%) and 3.4 bpm (median 1.0 bpm) on the male group. In terms of accuracy, the Diff Median performs on the female group even better than all other methods on the male group. The Diff Model achieves for the female participants with a mean accuracy of 94% (median 100%) and a mean error of 0.41 bpm (median 0.08 bpm) the highest performance among all methods and groups, whereas for the male participants it yields values of 82% and 0.75 bpm (median 0.15 bpm).
When looking at the signal quality measures, it can be observed that for the female users also a higher signal quality can be obtained by all methods. On the female group, the Median Raw’s PCC and SNR median values are at 0.34 and 22 dB, and on the male group they are at 0.15 and 15 dB. Similarly, the Diff Median has median PCC and SNR values of 0.35 and 22 dB on the female, and 0.21 and 17 dB on the male group. Despite the relatively good accuracy and error performance, these PCC and SNR values suggest a rather low signal quality. In terms of signal quality, the Diff Model stands out from the rest. It has median PCC and SNR values of 0.68 and 30 dB for the female, and 0.56 and 28 dB for the male users.
Summary
On first sight, it seems like all methods work better on the female participants than on the male ones, especially in the standing and the occlusion scenarios. The male group, however, is with 12 participants almost twice as big as the female group. With only 7 female participants in our dataset, it is consequently hard to pinpoint whether the user’s gender could play a role in the performance of breathing rate estimation. Due to the relatively small and unbalanced group sizes, it is likely that the performance is biased towards the female group. Also, in our dataset, in contrast to some male participants, all females had clothing that did not cover the throat. So at least in our dataset the gender-specific differences might not be caused by the gender itself but by gender specific clothing styles (also see Sec. 5.7). Furthermore, we found a single male user that had difficulties in adhering to our paced breathing setup and, due to the small group size, lowers the overall performance of the whole male group. The influence of single users and specific properties like their clothing styles will be elaborated in the next section.
5.7 The Influence of the User
In this section, we try to assess the influence of the single users on the performance of the various respiration estimation methods. The results of this section are meant to give some context to the different evaluation outcomes from previous sections and should not be seen as definitive results, but rather as an indicator for future research questions.
There is a whole set of user-specific parameters that may directly or indirectly influence the measurements. These include size and weight, age, gender, clothing, up to long hair reaching to the chest area, but also the preferred breathing rhythm and style, e.g., abdominal breathing, or simply the ability to stand still for a while. Since our dataset focuses on having a high user variance in order to achieve meaningful results in above parameter evaluations, we did not explicitly categorize our participants by these parameters. Furthermore, we did not pursue a systematic evaluation by for instance asking the users to wear a specific set of different clothing styles. Consequently, each participant shows a rather unique subset of user-specific parameters. Due to the big parameter space and the limited number of participants, it therefore is difficult to draw final conclusions about user-specific influences, as mentioned at the beginning of this section.
Our attempt to nevertheless gain an insight into user specific parameters thus is as follows: If we can identify a user that, regardless of the method used, performs worse than other users, this user may exhibit a specific reason for why he or she influences the respiration estimation. Furthermore, previous evaluations hide the contributions of single participants to the average values and box plots. By inspecting the data on a per user basis, we can obtain more detailed information about the composition of these plots, like if a lower performance is caused by all participants similarly, or if one or a few participants with exceptionally low performance values cause a significant decrease on the averages.
Figure 10 depicts for each participant the accuracy against the error, split up into the three conditions and averaged over all distances and respiratory rates. The single users are color-coded and marked with a dot for male, and with a plus for female users. Ideally, all user markings are at the upper left corner of the plots, where they indicate a high accuracy and low error on average.
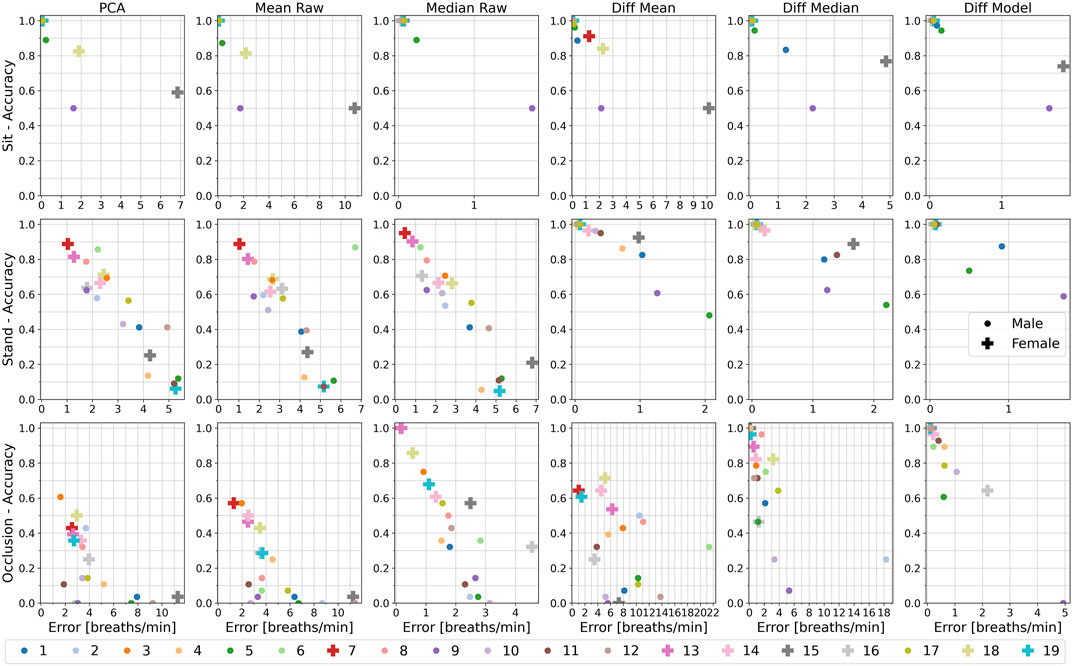
FIGURE 10. The mean accuracy (y-axis) over the mean error (x-axis) for all individual users, captured from the chest using a Fast Fourier Transform window with a length of 48 s. Accuracy and errors are averaged over all distances (1–4 m) and all respiratory rates (10 and 15 bpm) for the methods (from left to right): PCA, Mean Raw, Median Raw, Diff Mean, Diff Median, and Diff Model, each divided into the conditions sitting, standing, and occlusion. Each user is associated with a unique color where circles mark male and plus signs mark female users. Please note the different scales on the x-axis (errors). Ideally, all users are located at the top left corner, indicating a high accuracy and low error. This is for most participants achieved by all methods during the sitting condition. On other conditions, the Diff Model method achieves the best performance. The accuracy and errors can be seen to vary widely for certain participants, with especially user 9 standing out on all conditions and methods due to poorly adhering to the breathing visualization.
Sitting
While sitting, almost all users show for all methods on average a high accuracy and a low error close to 100% or 0 bpm, respectively. Most notably, users 9 and 15 stand out on all methods. User 9 hereby shows a constant accuracy of 50% and an error of about 1.5–2 bpm for all methods. After inspecting this user’s depth videos, we figured out that user 9 did not or did only poorly maintain the respiratory rate given by our breathing visualization on all almost recordings, as will also be seen on the other conditions. User 15 shows varying accuracies between 50% and about 80% and high errors of up to 10 bpm on all methods, except for the Median Raw where she achieves 100% and close to 0 bpm error. The decreased performance is caused by poor infrared reflection properties of her clothing and her long hair partly covering her chest at distances from 3 m upwards as depicted in Figure 11. The Median Raw is able to achieve a high performance due to the median being more robust against this kind of noise where less than half the pixels are affected.
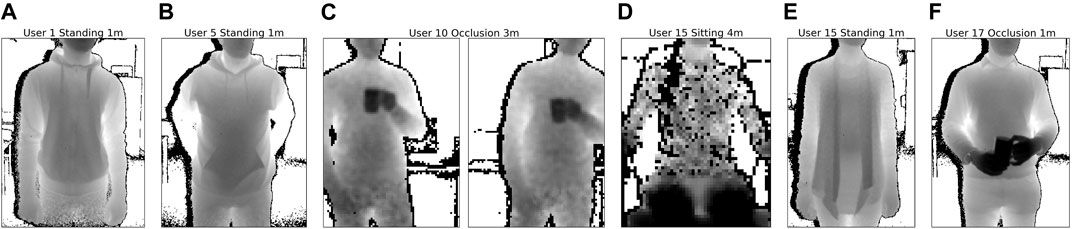
FIGURE 11. Example images from the recordings of (A–F) user 1, user 5, user 10, and user 17. Their clothing is particularly challenging for different types of methods. Difference based methods have difficulties when the throat is partially covered by a collar (user 1, user 5, and user 17), resulting in a poor motion reference signal obtained from the throat region. Clothing with bad infrared reflection properties (user 15, left) and garments loosely hanging from the chest or the shoulders (user 15, right) or similar clothing that causes many surface deformations over time, like ribbons reaching to the chest area (users 1 and 5), are likely to interfere with the respiration signal obtained from all methods. Also hair covering the body surface (user 15, left) or users moving a lot or bending to either side (user 10) are likely to cause signal distortions.
Standing
While standing, the PCA, Mean Raw, and Median Raw have difficulties in estimating the respiration as discussed in Sec. 5.3. The additional motion artifacts cause a wide, diagonally distributed spread of the user’s performances towards low accuracy and high errors. We therefore focus on the difference-based methods where most participants again show a high accuracy of almost 100% and low error close to 0 bpm, especially for the Diff Model. On this condition, most notably users 1, 5, 9, and 15 stand out from the rest. User 9 again did only poorly maintain the given respiratory rate, and user 15 was recorded on a different day with a different, but nevertheless challenging dress: a cardigan with an open front hanging loosely from the shoulders as depicted in Figure 11. The Diff Model can compensate for the garment’s movement during breathing due to its capability of detecting and recovering such occlusion events. Users 1 and 5 both have in common that they are wearing a hooded sweater that partly covers the throat region (see Figure 11) where the motion reference signal is extracted from. Especially at higher distances, this region resolves to only a few pixels and a moving collar (due to chest expansion while breathing) is likely to interfere.
Occlusion
During the occlusion condition, except for the Diff Model, all methods show a wide spread of the users’ accuracy and error averages, with the PCA, Mean Raw, and Diff Mean only achieving a maximum accuracy of about 60% or 75% on a few participants. The Diff Median performs significantly better with most users above 70% up to 100%. Compared to the Diff Model that is able to shadow occlusion events, it however can not compete, so we will focus on the Diff Model only. Here we see users 5, 9, 10, 16, and 17 deviate most significantly from the other users which in contrast to those all lie in the range from 90 to 100% and below 1 bpm. User 5 again is likely to only achieve an average accuracy of about 60% due to the hooded pullover with the collar covering the throat region, and user 9 again had difficulties to adhere to the breathing visualization. User 10, in contrast to other users, occasionally shows strong movements to either of both sides while relieving a leg. These movements directly affect the respiration signal and lower the performance, most likely due to window misalignment caused by bending the upper body to the side or by the quickness of the leaning movement. For user 16, we found that the drinking gestures were not fully executed with the cup often remaining for longer time periods in front or close to the throat region which decreases the performance at distances of 3 and 4 m where this region is only a few pixels wide. User 17 is wearing a shirt with a collar that also partly covers the throat (see Figure 11) and we found that the decreased performance solely stems from the distance at 4 m, again likely due to the lower resolution at higher distances with only a few pixels available to sample the motion signal from the throat region.
Accuracy Distribution
While Figure 10 depicts the average accuracy of individual users, in Figure 12 a histogram of each user’s contribution is drawn. The users again are color-coded and their number of recordings that fall within a certain accuracy range with 10% steps are stacked on top of each other such that each user’s individual contribution as well as the overall amount of recordings with an accuracy that falls inside that bin is visualized.
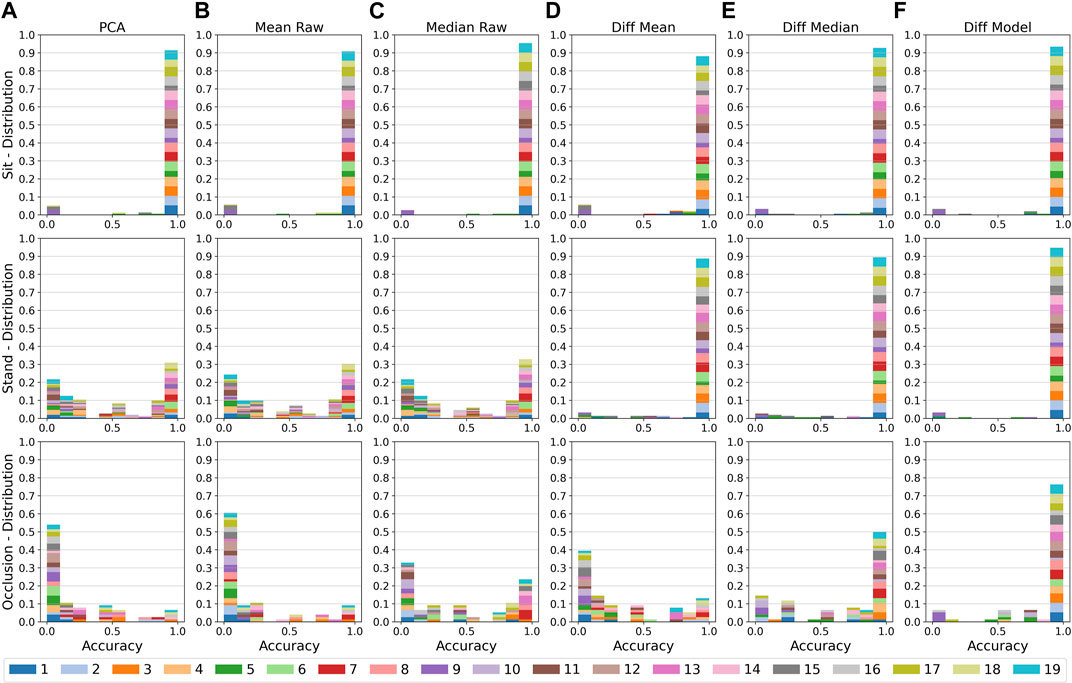
FIGURE 12. Histogram of the accuracy distribution of the single participants, with the breathing signal captured from the chest and using a Fast Fourier Transform window with a length of 48 s. Histograms are divided into the different methods (A–F) PCA, Mean Raw, Median Raw, Diff Mean, Diff Median, and Diff Model, and into the conditions (top to bottom) sitting, standing, and occlusion. The x-axis indicates the accuracy value divided into 10 bins and the y-axis indicates the percentage of recordings that achieve this accuracy. The contributions of the individual participants are color-coded and stacked on top of each other. Ideally, all individual accuracy contributions are located in the rightmost bin, indicating that the respiratory rate can correctly be estimated on all recordings. A high bar in the 90–100% accuracy bin can be achieved by all methods during the sitting condition and by the difference based methods during the standing condition. During the occlusion condition, the 0–10% accuracy bin is dominant for all methods, except for the Diff Median and the Diff Model, which have 50% or 76% of the recordings in the 90–100% bin.
During the sitting condition, the majority of the users are within the 90–100% accuracy range for all methods, with only user 9 constantly having a significant part in the 0–10% range due to him not properly adhering to the breathing visualization. The same applies to the difference-based methods during the standing condition, but with a few participants’ partly showing up in lower accuracy ranges. For the other methods, only a few participants and only a fraction of their recordings (about 30% of the recordings) reach the 90–100% range, and a significant part (about 20–25% of the recordings) is located in the 0–10% range or close to that. During the occlusion condition, the 0–10% accuracy range becomes the dominant region for the PCA, the Mean Raw, the Median Raw, and the Diff Mean methods. Only the Median Raw shows a significantly higher peak (about 25% of the recordings) in the 90–100% bin as compared to its intermediate accuracy ranges that mostly stem from users 7 and 13. For the Diff Median, about 50% of the recordings and most of the users are located in the 90–100% accuracy range with no significant peak in other ranges. The Diff Model outperforms all other methods, with about 76% of the recordings and almost all users being in the 90–100% range. Moreover, the 0–10% accuracy bin almost completely is covered by user 9, the user that did not adhere to our breathing visualization, and the next peak with a comparably high impact (about 6–7% of the recordings) is in the 50–60% accuracy bin.
Summary
In conclusion, it could be seen that in the cases where the method in use is suited for the condition, like the difference-based methods during standing or the Diff Model in the occlusion scenario, a decreased performance on any method mostly stems from a few individual users. Most notably, user 9 stands out from the rest on all methods and all conditions. This user did not or did only poorly maintain the respiratory rate given by our breathing visualization and thus decreases the performance measures of all methods by a certain amount, especially when comparing the male to the female group.
For other users we mainly found the clothing style to be the most likely reason for a decreased performance. Examples are clothing with poor IR reflection properties, or loose garment or ribbons hanging from the chest or shoulders. A collar that partly covers the throat region is likely to affect the difference-based methods because it tends to move during breathing and interferes with the motion reference signal extracted from the throat region. Apart from our observations, there might also be more clothing-related factors, like strong surface deformations, that affect the estimation of the respiratory rate. For a full understanding of the influence of clothing, however, a separate, systematic study where the same participants are recorded with a set of different cloths needs to be conducted. Other user-specific influences that possibly affect the breathing estimation are long hair reaching to the chest (see Figure 11, fifth from the left) and movements such as changing the leaning angle to either side (see Figure 11, second and third from the left).
A detailed and systematic evaluation of user-dependent influences, for instance evaluating different clothing styles, is required in the future to fully understand the particular influences. This will enable the implementation of an adaptive method that for instance considers multiple body regions and rejects strongly influenced parts.
6 Discussion
In light of the above results, this section will discuss the limitations, assumptions and requirements for the methods, the data, and the evaluations.
Comparison of State-of-the-art Depth-Based Respiration Estimation Methods
With the PCA, Mean Raw, and Diff Model (see Sec. 5), we evaluated and compared the majority of current state-of-the-art methods under a variety of different settings. Additionally, we proposed using the median instead of the mean, and we leveraged the model based approach to a more lightweight version where only the difference based approach is used instead of computing a whole torso model. These modifications yield three more methods, namely the Median Raw, the Diff Mean, and the Diff Median.
One approach we left out is to first create a mesh model of the torso surface and use that mesh to compute the change of volume. Since the back of the torso is not visible to the depth camera, in related works a certain, constant depth threshold is used to form a plane that bounds the mesh to the back. This means that any torso movement also will change the mesh volume. Bounding the mesh to the back thus basically is equivalent to computing a weighted sum of the depth values. With this restriction, and from the findings that the volume-based approach is less accurate while being computationally much more expensive as conducted by Soleimani et al. (2017), we omit explicitly computing a mesh. Instead, we rely on computing the mean or the median of the torso depth pixels to approximate the change in torso elevation that, when multiplied by the torso width and height, would give us a torso volume approximation, too. With the difference based approaches, furthermore a dynamic threshold to the back is modelled that is able to leverage most of the motion artifacts entering the mean or median approximations. Although we consider the state-of-the-art volume based approaches’ performance to be in the range of the Mean Raw, explicitly modelling a 3D torso surface and fitting it to the depth data may have great potential for depth-based respiration estimation. A systematic evaluation of the volume-based methods thus would be beneficial for extending these methods and for further research in this direction.
In our work, some limitations apply to the PCA method. As suggested from the related work, and to achieve a run-time respiration estimation, the first 180 frames are used to build the PCA model. Since it is unclear which principal component to select algorithmically, only the one with the highest eigenvalue is used, making the PCA method susceptible to motion artifacts that happen within the first 180 frames. A solution could be to perform an offline PCA on the whole signal and to manually select the most reasonable component, but motion artifacts are likely to enter the estimated breathing signal anyway. Furthermore, Wasza et al. (2012) suggest to apply a varimax rotation to the PCA components to feature local deformations that differentiate between thoracic or abdominal breathing. Their study, as well as all other studies on PCA based methods, however, was performed on participants lying still in supine position and wearing tight clothing with no folds, thus letting the method only deal with the two breathing styles and noise. We do not apply a varimax rotation in our method since we additionally have to deal with motion artifacts, clothing-related surface deformations, and occlusions which we believe do pose the major limitation to all PCA based methods in more realistic scenarios, at least when we can not carefully inspect and select the correct principal components manually.
While purely mean or median based methods are computationally the most efficient, these methods perform poorly in the presence of any body movements. Using the median instead of the mean, however, allows to shadow occlusion events to a certain extent. The susceptibility to movement and occlusion also applies to the PCA method. According to related work on PCA based methods, participants are required to wear tight clothing with no folds and to keep still by for instance lying in supine position. We argue that the reason for these restrictions are that movement, surface deformations, and occlusion will dominate the principal components. This will hinder an otherwise valid PCA model to be used for a correct estimation of the respiration signal. It also has to be mentioned that this method is computationally expensive and furthermore requires a certain amount of reliable training data at the beginning and for each user individually.
Limitations of our Dataset and Evaluations
Our dataset was recorded with the intention to be as realistic as possible, yet it should be applicable to existing respiration estimation methods and it should allow a comparison of those among each other, independent of user-specific or external influences. Thus it was recorded under certain assumptions and with certain study design decisions that limit the applicability of our results to more general scenarios. The assumptions and decisions being made are:
• The user generally faces the depth camera and only is rotated by a small amount to either side. Only a single user is recorded at the same time.
• The user is sitting or standing upright at a fixed position with a distance of 1, 2, 3, or 4 m to the depth camera. The user does not lean excessively to either side, bend the upper body forwards or backwards, or moves towards the camera or to any other location.
• Upper body motion is restricted to a small amount, like swaying while keeping balance, repositioning movements to either side, e.g., when switching from one leg to another, or small body rotations. Rotating the body actively away from the depth camera is not allowed and fast body movements are not present, except for moving the arms during the occlusion scenario.
• The user may occlude its upper body with one or both hands and with an in-hand object (a mug) arbitrarily during the occlusion condition.
• Users are adhering their respiratory rate to a breathing visualisation with fixed frequency. This is not a realistic setup, but eliminates the influence of user-specific breathing styles and paces. Also a fixed respiratory rate makes the benchmarking of the different methods easier and better comparable, even across different users.
• The users are wearing a big variety of regular indoor clothing. To reflect more realistic indoor scenarios, users were not asked to wear specific cloths nor were the recordings repeated on a set of different clothing types. Some users, however, are wearing different clothing on different recordings. Also, yet there is no systematic classification of the clothing styles.
Our datset, with 7 female and 12 male participants, is not balanced, so a comparison of both groups likely contains bias. User 9 had difficulties in adhering to the paced breathing setup and other users might occasionally also show deviations. Ground truth was not recorded explicitly, but is obtained from the paced breathing. Accuracy, error, and signal-to-noise evaluations are obtained by comparing the measured respiratory rate to the ground truth frequency as given by the setup of the paced breathing visualisation. The FFT window length is fixed to 48 s and the window moves with a step size of one breathing cycle (4 s or 6 s) as given by the respective breathing rate setup. The performance values are likely to change with different FFT parameters. The Pearson correlation coefficient is obtained by comparing the measured breathing signal to a sine wave of the respective frequency.
7 Conclusion
How well can ubiquitous devices monitor the breathing of their users through built-in depth cameras? This article has investigated key conditions we can expect applications to work in, using an extensive dataset from 19 users. Our key findings can be summarized as:
• The observed torso region influences both performance and signal quality for all methods: Under all circumstances, our results confirm that the chest is the ideal region for capturing the respiration signal. The abdomen region yields the lowest performance and signal quality, especially in the standing and occlusion scenarios.
• User condition (sitting, standing, or occluding their torso) affect performance and signal quality significantly for all methods. Non-difference based methods tend to fail when persons are standing or move their arms in front of their torso. When users are standing, all difference-based methods show good performance values. In the presence of occlusions, the Diff Model and the median methods are recommendable.
• Different users deliver varying qualities of breathing signals, with few users performing significantly worse than most other users. Some users move a lot, longer hair can be a problem, and clothing can play a role: Some clothing poorly reflects infrared light, some garments have ribbons in front of the chest that interfere with the breathing detection. Difference based methods have difficulties when the throat area is covered by a collar that moves while breathing.
Other parameters were found to play a minor role. The distance between user and depth camera has less influence on performance, but a strong influence on the signal quality. Optimal distances are in the range of 1–2 m, with higher distances causing more noise in the respiration signals. During occlusions, 2 m led to the better results. The respiratory rate has only little effect: Higher rates are easier to detect, likely due to more breathing periods falling within a fixed-length FFT window. The signal quality for the higher respiratory rates was over all methods slightly reduced, though. Gender-dependent differences in the respiration estimation are due to unbalanced and the rather small group sizes hard to interpret.
The Diff Model showed best accuracy and signal quality results across all scenarios. In some use cases, however, other methods do have their benefits: If users are sitting, the non-difference based methods perform equally well and only show a slightly decreased signal quality. The Mean Raw and the Median Raw hereby benefit from being computationally much less expensive and do not require a fixed size of the torso window. When the user moves closer or further away from the depth camera, these methods do not need to reinitialize a model. The same applies to the Diff Mean and Diff Median when users are standing. Using the median hereby has been shown to be superior to using the mean for extracting the breathing signal. PCA does not yield better performance values than the Median Raw and is about in the range of the Mean Raw, but requires an expensive training phase that is susceptible to any deformation or movement larger than or in the range of the breathing related chest or torso expansion. Using PCA thus should only be considered for use cases with tight clothing and no body movements, and where for instance a detailed torso surface model needs to be reconstructed. In use cases with negligible body motion and no occlusion, like in a sitting condition, and especially when computation time is limited like on an embedded system, the use of the Median Raw is recommended. The same applies to the Diff Median in the case of a scenario with motion artifacts, like when persons are standing. The breathing signal in this case should be low-pass filtered, especially on higher distances. Using the Diff Model during standing as well as in the presence of occlusions, however, yields better results.
This paper’s anonymized dataset with depth data and respective body joints locations, as well as our method’s source code and the python experiment scripts that were used for validating our proposed method are available to support the reproduction of our method and results, and can be obtained by contacting the first paper author or visiting https://ubicomp.eti.uni-siegen.de/home/datasets.
All subjects gave their informed consent for inclusion before they participated in the study. The study was conducted in accordance with the Declaration of Helsinki, and was approved by the Ethics Committee of the University of Siegen (ethics vote #ER_12_2019).
Data Availability Statement
The raw data supporting the conclusions of this article is available at the following link: https://ubicomp.eti.uni-siegen.de/home/datasets/fcs21.
Ethics Statement
The studies involving human participants were reviewed and approved by Ethics Committee of the University of Siegen (ethics vote #ER_12_2019). The patients/participants provided their written informed consent to participate in this study.
Author Contributions
JK has performed the implementation and implemented all studies and visualizations, KVL has guided this work and assisted in the methodologies. Both authors have contributed substantially to the writing of this manuscript.
Funding
This project is funded by the Deutsche Forschungsgemeinschaft (DFG, German Research Foundation) – 425868829 and is part of Priority Program SPP2199 Scalable Interaction Paradigms for Pervasive Computing Environments.
Conflict of Interest
The authors declare that the research was conducted in the absence of any commercial or financial relationships that could be construed as a potential conflict of interest.
Publisher’s Note
All claims expressed in this article are solely those of the authors and do not necessarily represent those of their affiliated organizations, or those of the publisher, the editors and the reviewers. Any product that may be evaluated in this article, or claim that may be made by its manufacturer, is not guaranteed or endorsed by the publisher.
References
Addison, A. P., Addison, P. S., Smit, P., Jacquel, D., and Borg, U. R. (2021). Noncontact Respiratory Monitoring Using Depth Sensing Cameras: A Review of Current Literature. Sensors 21, 1135. doi:10.3390/s21041135
Aoki, H., and Nakamura, H. (2018). Non-contact Respiration Measurement during Exercise Tolerance Test by Using Kinect Sensor. Sports 6, 23. doi:10.3390/sports6010023
Bauer, S., Berkels, B., Hornegger, J., and Rumpf, M. (2011). “Joint ToF Image Denoising and Registration with a CT Surface in Radiation Therapy,” in International Conference on Scale Space and Variational Methods in Computer Vision, Ein-Gedi, Israel, May 29–June 2, 2011 (Berlin, Heidelberg: Springer), 98–109.
Bauer, S., Wasza, J., and Hornegger, J. (2012). “Photometric Estimation of 3d Surface Motion fields for Respiration Management,” in Bildverarbeitung für die Medizin 2012 (Berlin, Heidelberg: Springer), 105–110. doi:10.1007/978-3-642-28502-8_20
Benetazzo, F., Freddi, A., Monteriù, A., and Longhi, S. (2014). Respiratory Rate Detection Algorithm Based on RGB‐D Camera: Theoretical Background and Experimental Results. Healthc. Technol. Lett. 1, 81–86. doi:10.1049/htl.2014.0063
Centonze, F., Schätz, M., Procházka, A., Kuchyňka, J., Vyšata, O., Cejnar, P., et al. (2015). “Feature Extraction Using Ms Kinect and Data Fusion in Analysis of Sleep Disorders,” in International Workshop on Computational Intelligence for Multimedia Understanding (IWCIM), 2015, Prague, Czech Republic, October 29–30, 2015 (IEEE), 1–5. doi:10.1109/iwcim.2015.7347069
Cretikos, M. A., Bellomo, R., Hillman, K., Chen, J., Finfer, S., and Flabouris, A. (2008). Respiratory Rate: the Neglected Vital Sign. Med. J. Aust. 188, 657–659. doi:10.5694/j.1326-5377.2008.tb01825.x
Haescher, M., Matthies, D. J., Trimpop, J., and Urban, B. (2015). “A Study on Measuring Heart-And Respiration-Rate via Wrist-Worn Accelerometer-Based Seismocardiography (Scg) in Comparison to Commonly Applied Technologies,” in Proceedings of the 2nd international Workshop on Sensor-based Activity Recognition and Interaction, Rostock, Germany, June 25–26, 2015, 1–6. doi:10.1145/2790044.2790054
Keall, P. J., Mageras, G. S., Balter, J. M., Emery, R. S., Forster, K. M., Jiang, S. B., et al. (2006). The Management of Respiratory Motion in Radiation Oncology Report of AAPM Task Group 76a). Med. Phys. 33, 3874–3900. doi:10.1118/1.2349696
Kempfle, J., and Van Laerhoven, K. (2018). “Respiration Rate Estimation with Depth Cameras,” in Proceedings of the 5th international Workshop on Sensor-based Activity Recognition and Interaction - iWOAR ’18, Berlin, Germany, September 20–21, 2018 (ACM Press). doi:10.1145/3266157.3266208
Kempfle, J., and Van Laerhoven, K. (2020). Towards Breathing as a Sensing Modality in Depth-Based Activity Recognition. Sensors 20, 3884. doi:10.3390/s20143884
Kuo, Y.-M., Jiann-Shu Lee, J.-S., and Pau-Choo Chung, P.-C. (2010). A Visual Context-Awareness-Based Sleeping-Respiration Measurement System. IEEE Trans. Inform. Technol. Biomed. 14, 255–265. doi:10.1109/titb.2009.2036168
Martinez, M., and Stiefelhagen, R. (2012). “Breath Rate Monitoring during Sleep Using Near-IR Imagery and PCA,” in 21st International Conference on Pattern Recognition (ICPR), 2012, Tsukuba, Japan, November 11–15, 2012 (IEEE), 3472–3475.
Massaroni, C., Nicolò, A., Sacchetti, M., and Schena, E. (2020). Contactless Methods for Measuring Respiratory Rate: A Review. IEEE Sensors J. 21 (11), 12821–12839. doi:10.1109/JSEN.2020.3023486
Nakajima, K., Matsumoto, Y., and Tamura, T. (2001). Development of Real-Time Image Sequence Analysis for Evaluating Posture Change and Respiratory Rate of a Subject in Bed. Physiol. Meas. 22, N21–N28. doi:10.1088/0967-3334/22/3/401
Nakajima, K., Osa, A., and Miike, H. (1997). “A Method for Measuring Respiration and Physical Activity in Bed by Optical Flow Analysis,” in Proceedings of the 19th Annual International Conference of the IEEE (IEEE) Engineering in Medicine and Biology Society, 1997, Chicago, IL, October 30–November 2, 1997, 2054–2057.5
Noonan, P. J., Howard, J., Tout, D., Armstrong, I., Williams, H. A., Cootes, T. F., et al. (2012). “Accurate Markerless Respiratory Tracking for Gated Whole Body Pet Using the Microsoft Kinect,” in 2012 IEEE Nuclear Science Symposium and Medical Imaging Conference (NSS/MIC), Anaheim, CA, October 27–November 3, 2012 (IEEE), 3973–3974. doi:10.1109/nssmic.2012.6551910
Parkes, R. (2011). Rate of Respiration: the Forgotten Vital Sign. Emerg. Nurse. 19, 12–17. doi:10.7748/en2011.05.19.2.12.c8504
Penne, J., Schaller, C., Hornegger, J., and Kuwert, T. (2008). Robust Real-Time 3d Respiratory Motion Detection Using Time-Of-Flight Cameras. Int. J. CARS 3, 427–431. doi:10.1007/s11548-008-0245-2
Procházka, A., Schätz, M., Vyšata, O., and Vališ, M. (2016). Microsoft Kinect Visual and Depth Sensors for Breathing and Heart Rate Analysis. Sensors 16, 996. doi:10.3390/s16070996
Schaller, C., Penne, J., and Hornegger, J. (2008). Time-of-flight Sensor for Respiratory Motion Gating. Med. Phys. 35, 3090–3093. doi:10.1118/1.2938521
Schätz, M., Centonze, F., Kuchyňka, J., Ťupa, O., Vyšata, O., Geman, O., et al. (2015). “Statistical Recognition of Breathing by Ms Kinect Depth Sensor,” in Computational Intelligence for Multimedia Understanding (IWCIM), 2015 International Workshop on (IEEE), Prague, Czech Republic, October 29–30, 2015, 1–4.
Soleimani, V., Mirmehdi, M., Damen, D., Dodd, J., Hannuna, S., Sharp, C., et al. (2017). Remote, Depth-Based Lung Function Assessment. IEEE Trans. Biomed. Eng. 64, 1943–1958. doi:10.1109/TBME.2016.2618918
Tan, K. S., Saatchi, R., Elphick, H., and Burke, D. (2010). “Real-time Vision Based Respiration Monitoring System,” in 2010 7th International Symposium on Communication Systems Networks and Digital Signal Processing (CSNDSP), Newcastle upon Tyne, UK, July 21–23, 2010 (IEEE), 770–774. doi:10.1109/csndsp16145.2010.5580316
Wang, H., Zhang, D., Ma, J., Wang, Y., Wang, Y., Wu, D., et al. (2016). “Human Respiration Detection with Commodity Wifi Devices: Do User Location and Body Orientation Matter?,” in UbiComp ’16:Proceedings of the 2016 ACM International Joint Conference on Pervasive and Ubiquitous Computing, Heidelberg, Germany, September 12–16, 2016 (New York, NY, USA: Association for Computing Machinery), 25–36. doi:10.1145/2971648.2971744
Wasza, J., Bauer, S., Haase, S., and Hornegger, J. (2012). “Sparse Principal Axes Statistical Surface Deformation Models for Respiration Analysis and Classification,” in Bildverarbeitung für die Medizin 2012 (Berlin, Heidelberg: Springer), 316–321. doi:10.1007/978-3-642-28502-8_55
Wijenayake, U., and Park, S.-Y. (2017). Real-time External Respiratory Motion Measuring Technique Using an RGB-D Camera and Principal Component Analysis. Sensors 17, 1840. doi:10.3390/s17081840
Keywords: respiration sensing, depth imaging, rgb-d, depth-based breathing estimation, remote respiration measurement
Citation: Kempfle J and Van Laerhoven K (2021) Breathing In-Depth: A Parametrization Study on RGB-D Respiration Extraction Methods. Front. Comput. Sci. 3:757277. doi: 10.3389/fcomp.2021.757277
Received: 11 August 2021; Accepted: 29 October 2021;
Published: 01 December 2021.
Edited by:
Yu Guan, Newcastle University, United KingdomReviewed by:
Mingzhong Wang, University of the Sunshine Coast, AustraliaDanny Hughes, KU Leuven, Belgium
Copyright © 2021 Kempfle and Van Laerhoven. This is an open-access article distributed under the terms of the Creative Commons Attribution License (CC BY). The use, distribution or reproduction in other forums is permitted, provided the original author(s) and the copyright owner(s) are credited and that the original publication in this journal is cited, in accordance with accepted academic practice. No use, distribution or reproduction is permitted which does not comply with these terms.
*Correspondence: Jochen Kempfle, jochen.kempfle@uni-siegen.de