Communicating Science With YouTube Videos: How Nine Factors Relate to and Affect Video Views
 Raphaela Martins Velho
 Amanda Merian Freitas Mendes2
 - 1Laboratory of Advanced Studies in Journalism, State University of Campinas, Campinas, Brazil
- 2Department of Statistics, Institute of Mathematics and Statistics, State University of Campinas, Campinas, Brazil
Recent works about science communication through online videos on YouTube have focused mostly on categorization, content description, and the video's approach to scientific themes. However, still little is known about factors affecting science video popularity on the platform. This study aims to describe the relationship between nine content-related and content-agnostic factors, and the popularity of science videos on YouTube, defined as the number of views per days since the video posting. We collected a sample of 441 semi-randomly selected videos produced by the ScienceVlogs Brasil project – a Brazilian alliance of science channels hosted by independent science communicators on YouTube. Content-related factors were video theme, video format and video editing features, while content-agnostic factors were video length, video age, channel productivity, number of likes, number of comments and channel to which the video belongs. Descriptive and inferential analyses were performed with the R software to assess the correlation of each factor with the popularity of each video. Descriptive results show that the most popular science videos are those with interdisciplinary themes, styled either as vlog, animation or group conversation, and those belonging to the channels “Ciência Todo Dia,” “Minuto da Terra,” “Canal do Pirula” e “Papo de Biólogo.” The inferential analysis shows that the most relevant factors to predict popularity, according to our model, are number of likes per video, channel productivity, video age and video format.
Introduction
The internet has been increasingly relevant as a popular source of information about science (Brossard and Scheufele, 2013). Every day, regular citizens go online to obtain information from immediate issues, such as food safety (Ma et al., 2017) to big picture ones, such as climate change (Fletcher, 2016); from new technologies (Anderson et al., 2010) to health issues (Fox and Duggan, 2013). However, not all information is trustworthy: misinformation of all kinds abound in the cyberspace (Wardle and Derakhshan, 2017). Misinformation associated with science includes conspiracy theories, anti-science propaganda, rumors and straight-up fabricated news about science and scientists (Scheufele and Krause, 2019). In this context, social platforms have a paradoxical role: they both allow for engaging public science communication and are also hotspots for the spread of misinformation. Recently, YouTube has also been flagged as a hotbed of misinformation: until not long ago, videos with conspiratory, racist and pornographic content were being monetized (Mostrous, 2017), and in 2019 investigations reported that YouTube's recommendation mechanism, responsible for 70% of all the watch time the website receives (Solsman, 2018), tended to exhibit videos that were increasingly more right-wing, conspiratory and radicalized in tone (Roose, 2018).
YouTube is a particularly relevant platform because of its enormous reach: it is the second most accessed website worldwide (Alexa, 2020), where 2 billion registered users watch videos monthly (Cooper, 2019). Nonetheless, research on public science communication (and on misinformation about science) on YouTube is still in its infancy (Allgaier, 2019). Some studies have tried to compose a typology of science videos on the platform, focusing, for example, on editing and narrative techniques (Morcillo et al., 2016) and on the difference between online videos produced either television or for the internet (De Lara et al., 2017). Other relevant research themes are the accuracy of the scientific content of the video and its relationship with video engagement and popularity (Keelan et al., 2007; Garg et al., 2015) and what answers people get when they query about politically charged keywords on science (Allgaier, 2016; Shapiro and Park, 2018). However, with the exception of Welbourne and Grant's (2015) work, it seems there are so far no other studies detailing which and how video features and video metrics affect and correlate to the popularity of science videos on the platform. Welbourne and Grant (2015) were mostly worried about pointing out differences in popularity measures (views, comments, subscriptions, number of shares and total rating) and content factors (gender and number of presenters, video pacing and length) between user-generated and professionally-generated science videos.
In this study, which we see as complementary to theirs and also inspired by it, we try to fill this gap in the literature by focusing on another set of video features and platform metrics. In other words, we analyzed to what extent a selection of factors (video theme, video format, number of editing features, video length, number of likes, number of comments, video age, channel productivity and channel) are correlated to the popularity of UGC (User-generated content) science videos on YouTube. To accomplish that, we sampled 441 videos from the ScienceVlogs Brasil project – a group of Brazilian science communication channels on YouTube –, collected data on each video or channel regarding nine factors (see Design and Methods) and performed descriptive and inferential analyses on this dataset, in order to verify the correlation of each factor with the dependent variable “popularity,” measured as the number of views per days since publication (views/day). Additionally, we strive to find which of those factors were causally related to video popularity.
In this article, we first introduce readers to the ScienceVlogs Brasil project; then, we briskly review the literature on the popularity of videos on the platform, focusing on user-generated videos. In “Design and Methods” we give more detail about the data collection, the sampling method, and the variables of interest. In the “Results” section we describe the most important findings and outline the construction of the regression model, and in the following section “Discussion” we interpret the main findings of this work, highlighting key conclusions. Finally, we point to some flaws of this research and promising paths forward in the section “Limitations and directions for future research.”
ScienceVlogs Brasil
All the science videos were sampled from the ScienceVlogs Brasil project – an alliance of independent YouTube channels committed to communicating science to the general public, founded in May of 2016. The project, launched with 18 channels focusing mostly on Biological and Exact Sciences, quickly evolved to presently incorporate around 60 channels with a broad variety of themes. The videos were all produced in Portuguese, Brazil's official language. For a list of the channels that participated in this research and other project-relevant information, see Supplementary Material.
Literature Review
Research on YouTube video popularity is still recent, not only because of YouTube's young age but also for the lack of information released by the platform on its algorithmic decision-making. While the platform executes hundreds of small adjustments in its algorithms every year (Lewis, 2018), recommendation algorithms have undergone some major shifts. The weight given to each factor used to recommend videos has reportedly changed: until 2012, the dominant benchmark was video views, which eventually led to the proliferation of clickbait content on the platform; from 2012 to 2016, viewer watch time (amount of time that viewers spend watching a certain channel) and session watch time (amount of time that viewers spend watching YouTube in a single seating or session) were favored over video views (Cooper, 2020).
In 2016, Google started using deep-learning on many of its companies as a general solution for learning problems (Metz, 2016). Also in this year, the only detailed official manuscript reporting how machine learning and neural networks operated in the recommendation system was released. The white paper, authored by Covington et al. (2016) describes a two-step approach: first, video candidates are selected as a response to a query; second, such videos are ranked and displayed to the user. In the steps, user history (views, watch time, user engagement and satisfaction behaviors) and video context are used in the models, besides other unnamed factors. In 2017, when the scandal of forbidden extreme content on the platform exploded (Mostrous, 2017), YouTube made new adjustments to promote video quality (Lewis, 2018), and in 2019 it reportedly made changes in its recommendation algorithm to ban “borderline content,” so far with unclear results (Alexander, 2020).
Meanwhile, a great part of the independent research on video popularity on YouTube has tried to assess which video metrics and features promote video popularity. Figueiredo et al. (2014) investigated whether content alone could predict the popularity of a YouTube video. After showing pairs of YouTube videos with the same theme and without metadata to participants, they found that there was little agreement on the most popular video of the pair, but whenever there was consensus, the most popular video chosen by the participants was also the most popular video on the platform in most cases. This suggests that the same videos tend to be preferred by broader audiences, which indicates that certain content features are able to attract more audiences. Borghol et al. (2012) took the opposite path, and investigated the impact of content-agnostic factors in videos with the same content (“clones”). Results showed that, controlling for content, videos with the most views were the most prone to obtain more views, in a “rich get richer” effect. The size of the social network of video uploaders and the number of keywords used to describe the video were also shown to positively affect video popularity, particularly if the video was uploaded recently.
The “rich get richer effect” is common in social network platforms, and had already been identified and discussed in other works (Napoli, 2018). Concerning YouTube, Bärtl (2018) observed that a small number of channels (3% of them) concentrate around 85% of the video views on the entire platform. He attributed this phenomenon to two processes: first, videos and channels that already have more views have a greater sharing base; and second, there is a mismatch in the demand and supply of YouTube genres: there are too many channels belonging to low-demand genres (like People and Blogs) and too few channels that interest a broader audience. Thus, the channel category is a predictor of video popularity. Szabo and Huberman (2010) also showed that early video performance can predict future popularity, particularly when the initial audience is not wide.
Many studies have focused on the description of the popularity dynamics of YouTube videos in general. Results have shown that, although the popularity of individual YouTube videos varies a lot (Borghol et al., 2012; Figueiredo et al., 2014; Rieder et al., 2018), peaks of attention in most videos are garnered in the first days after their publication (Cha et al., 2007) – precisely in the day they are posted, when 64% of all views, 79% of the likes and 80% of the comments are gathered (Kessel et al., 2019). Additionally, research in digital marketing shows that marketers have around 10 s to grab enough of the ad viewer's attention so that he doesn't click away (Pedersen, 2015), a finding presumably related with the shrinkage of people's average attention span from 12 to 8 s, as indicated by a study from Microsoft Corp (Microsoft Corp, 2015). Together, these findings suggest that, for a video to be clicked on and watched, it must be engaging and interesting from the very beginning, so that it will be watched in its entirety, engaged with and become recommended, generating yet more views. In other words, it is important that the format and presentation of the videos provoke interest to bolster greater engagement of the audiences.
Some descriptive work has been done to characterize qualitatively science videos on YouTube. Morcillo et al. (2016) investigated video editing and narrative features of 190 academic, professionally-generated, and user-generated science videos from 95 science and education-themed channels. The aggregate results show that the most popular subgenres were monologs, animations, documentaries, and Q&A. The videos had a moderate complexity of production, a high level of video montage, and feature sophisticated storytelling techniques. In the context of the Videonline research, that sampled and analyzed 826 YouTube videos on the topics climate change, vaccines and nanotechnology, Ervitti (2018) verified that user-generated science videos were mainly monologs (25.5%), animations (14.4%) and experiments (11.1%), video genres she considered “easier to produce, simpler and closer to the audience” (p. 35). None of these works, though, attempted to relate video features and popularity.
The fight for users' attention also influences video length, which varies widely between and within video genres. Gaming videos tend to be the longest, with 24.7 min, while entertainment videos average around half of that (12.9 min) and music videos appear as the shortest, averaging 6.8 min (Statista, 2019). A study with data from 2019 revealed that the average length of videos from the most popular channels was 12 min, with a great deal of variation: 3% of the videos were longer than 60 min (Kessel et al., 2019).
It is a common assumption that longer videos tend to be less popular, because of their assumed inability to hold the viewer's attention and the widespread consumption of YouTube videos in smartphones, which encourages videos to be short (García-Avilés and de Lara, 2018). However, a reverse trend has been spotted: the platform's recommendation algorithms are pushing viewers to watch increasingly longer and more popular videos, regardless of the starting video (Smith et al., 2018). This suggests that the platform itself, and not only viewers, promote both virality and longer content. This trend goes hand in hand with YouTube's newly implemented policy of monetizing only channels with at least 4,000 h of overall watch time in the previous 12 months (Mohan and Kyncl, 2018). By demanding more watched time from all channels, YouTube implicitly supports the making of more and longer videos, that can bring the channel closer to the 4,000 h mark. Thus, video length and channel productivity are two factors that can potentially affect video popularity. Channel productivity has also shown to be strongly and positively correlated with number of channel subscribers and the number of views received by the ten Spanish news channels with the highest web traffic (Lopezosa et al., 2020). Although the channel and video samples of this study were small (n = 10), results suggest that channel productivity may be an important factor in accounting for video popularity.
Design and Methods
At the time of data collection (May to July of 2018), 36 channels belonged to the ScienceVlogs Brasil project. We decided to exclude channels that produced videos that did not correspond to our definition of science communication: the communication of science-related topics to non-specialized audiences using in a simple and non-academic language. We rejected three channels: one that was focused on explaining math exercises to students; another identified as an entertainment channel, focused on recording situations using slow-motion effects, and another that was the channel of the ScienceVlogs group, whose communicators used to send messages to the audiences of the project. We considered the remaining 33 channels for our analysis. All of them are user-generated, except one (channel Zoa), which posts both content produced informally by the host, but also snippets of footage of a tv show about science, presented by the same host for a local tv channel in the Northeast of Brazil. We chose to keep videos from Zoa in our sample because they are presented in a very colloquial and relaxed manner, and the editing is not sophisticated, which makes this channel not unlike the other user-generated channels. We selected an average of 10 videos from each channel, which is proportional to the number of original videos in each channel (i.e., we considered a stratified random sampling with proportional allocation. Our final sample could not exceed a certain number of videos since the analysis would be performed manually by only one researcher and within a restricted deadline. The datasets generated by the aforementioned process can be obtained upon request to the corresponding author.
To perform the video sampling, we assigned a number for each of them the oldest to the newest, and we applied the function random. Sample from the Python software (v.3). We selected the video corresponding to the number given by the function; then we recounted the videos excluding the selected videos and performed the function again. If the selected video was not directly related to science communication – e.g., if it was a social or political commentary without a research background, or if it was a video about the presenter's personal life, or if the video was not authored by the presenter, we excluded it from the counting process and begin again. Using this method, we sampled 441 videos from the 33 channels. For budgetary reasons and time constraints, only one researcher was responsible for coding and reviewing the data of all videos.
We manually collected data from each video according to the variables:
1. video theme, according to the classification used by the Brazilian research funding agency Fapesp: Earth and Exact Sciences (being Exact Sciences those which require the use of rigorous quantitative expressions and methods to test hypotheses, such as Astronomy and Physics), Biological Sciences, Engineering, Health Sciences, Agricultural Sciences, Applied Social Sciences, Humanities and “Linguistics, Languages & Arts.” We added the “Interdisciplinary” category for the videos that did not clearly fit into a specific theme. We attributed only one theme to each video.
2. video format, such as vlog (a format in which the host talks directly to the camera, usually alone and appearing from the chest up), interview (in which the host interviews someone), short documentary or reportage (similar to a tv documentary, in which the host presents the topic using a variety of footage and voice-over effects), hangout (online conversation in which host(s) and guests discuss certain topics), video animation (such as live-drawings or 3D animations), live conversations (in which the video host talks with a guest about a certain theme in a free-dynamics, non-interview style), commented video (in which a video from a different author is commented through voice-over effects) and talk (such as a TED presentation). We chose these formats after doing a pre-analysis of some videos made by the project. We attributed only one format to each video.
3. number of editing features: sound effects (soundtrack or others), image effects (any use of still images and text, except legends), video effects (use of another footage in the video), the exhibition of a logo or vignette at some point in the video, use of filters, use of the fast-forward technique, use of the jump-cut technique, use of stop-motion technique, and use of green-screen. Each one of these nine editing features corresponded to a point, that were summed up for each video. Thus, each video could amount from zero to nine points in this category.
4. video length, in number of minutes,
5. number of likes per video,
6. number of comments per video,
7. video age, in number of days from the date the data retrieval took place,
8. channel productivity, calculated from the number of videos that channel had produced until the day of the retrieval divided by the number of months since the channel began posting videos regularly,
9. channel that produced the video.
As discussed in the literature review, all of these factors could potentially affect video popularity on YouTube. Many other such factors (number of keywords, initial number of views, number of channel subscribers, thumbnail attractiveness) could also be important; however, time constraints and practicality guided our decision for this selection.
These nine variables served as covariates to the dependent variable “popularity of the video,” measured in the number of views of the video divided by the number of days since it was posted (views/day). We chose this index for popularity since the number of views alone can be highly influenced by the video publishing date (older videos have time to accumulate views), and we wished to minimize this effect. In this work, we considered popularity as a function of the video alone, and thus we did not consider the number of people subscribed to the video's channel, for example (it also would not be possible for us to track the number of channel subscriptions at the time of the video release).
The descriptive and inferential analyses were performed using the software R and went from September 2018 to February 2019. We interpreted the strength of the correlation index according to the parameters stated in Mukaka (2012). We performed a logarithmic transformation in the response variable in all analyses to obtain a normal and homoscedastic model. We then built a multiple linear regression model for the relationship between ln(Yi) and the dependable variables:
in which Yi is the number of views in the i-th video. We established the variable β0, which is the expected value of the natural logarithm for a “benchmark video” (β0) – a video in vlog format, with zero likes and comments, minimal size, minimal channel productivity and minimal video age and length, zero editing features and Biological Sciences as the theme. This is a base value for the model, to which the effects of all the other variables will be added. This is a base value for the model, to which the effects of all the other variables will be added. The coefficient β1 represents the increment (positive or negative) on the expected value of the natural log of the dependent variable for the increase in one unit in the number of likes; β2 represents the increment (positive or negative) on the expected value of the natural log of the number of views for the increase in one unit in the productivity variable; β3 represents the increment (positive or negative) on the expected value of the natural log of the number of views for the increase in one unit in the age variable; β4 represents the increment (positive or negative) on the expected value of the natural log of the number of views for the increase in one unit in the length variable. The coefficients λl, l = 1.0.0.10 represent the increments (positives or negatives), associated to the number of editing features of the video, on the expected value of the natural log of the number of views. The coefficients αj, j = 1.7 represent the increments (positives or negatives), according to the video format associated, on the expected value of the natural logarithm of the number of views with vlog format. The coefficients δk, k = 1.7 represent the increments (positives or negatives), according to the video theme associated, on the expected value of the natural logarithm of the number of views with Biological Sciences theme. Finally, we assumed that ϵi ~ Normal (0, σ2) are mutually interdependent errors.
The variable comments was not part of this model to avoid collinearity issues with the variable likes (ρ = 0.70). After the model was fitted, a residual analysis, to check the goodness of the model fit, was performed. We also did not add the variable channel to the inferential analysis, since it did not match the type of multiple linear regression model that we regarded as best for this context. Subcategories within each factor that did not have a big enough sample size (N ≥ 10 videos) were excluded from the descriptive analysis.
Results
Descriptive Analysis
We performed descriptive analyses to assess the correlation of each dependent variable and the popularity of the science videos. In total, data from 441 videos from 33 Brazilian channels belonging to the ScienceVlogs Brasil project was analyzed. Here, we present only the most significant results of this study.
As Figure 1 shows, videos that were interdisciplinary in nature or had themes regarding Exact and Earth Sciences and Biological Sciences were the ones in which popularity varied the most. The average number of views of videos with these themes were 105.9 (N = 112), 128.6 (N = 89) and 58.2 (N = 116) views/day, respectively. The most popular video of the sample, that gathered an average of 3,749.54 views/day, was a very young video belonging to the CET category and produced by an Astronomy-specialized channel. Engineering videos (N = 14) and Health Science videos (N = 13) were found only in small quantities and had averages of 26.87 and 44 views/day, respectively. Videos with the themes “Applied Social Sciences” and “Linguistics, Languages and Arts,” were insufficient to produce statistically significant results, and hence were excluded from the graph. Using the determination coefficient (R2) of a one-way ANOVA, we found that the video theme was not correlated with the popularity of the video (R2 = 0.017).
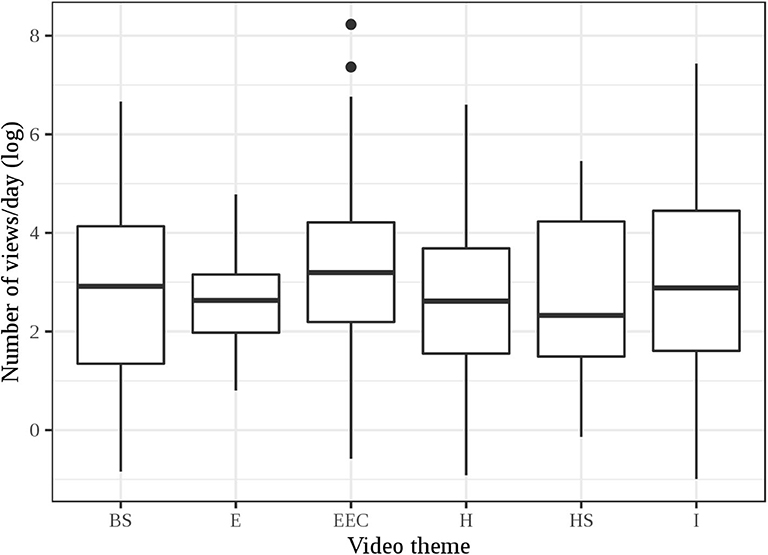
Figure 1. Number of views per day (log) x video theme (dots refer to outliers).
Figure 2 shows that the format vlog (N = 276) presents the highest variability in popularity of all formats, with an average of 94.3 views/day. It is followed by videos depicting group conversations (N = 23), which includes podcast video recordings and collaborative videos presented by two or more channel hosts from the ScienceVlogs Brazil project. Videos in this format had an average of 94 views/day. Animation videos (N = 39), which were short (between 2 and 7 min), presented a higher median than the rest, and an average of 131 views/day. Videos depicting interviews (N = 12) and hangouts (N = 18), or recorded group conversations, were remarkably less popular than the rest, with an average of fewer than 35 views/day. Kendall's rank-order correlation (τ) showed that the video format was not significantly correlated with the popularity of the video (τ = −0.032, p = 0.382).
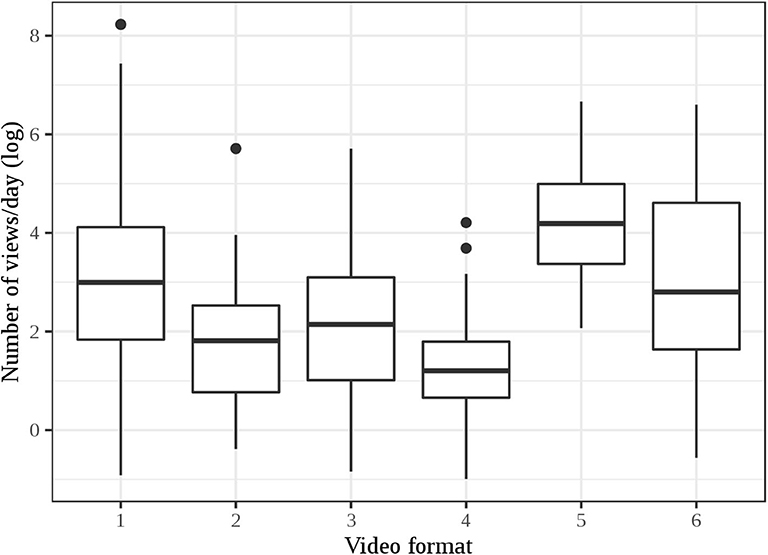
Figure 2. Number of views per day (log) x video format (dots refer to outliers).
Although we previewed a total of nine editing features, no video used more than seven of them at once. As Figure 3 shows, the number of types of editing features does not appear to have a clear relationship to video popularity. Kendall's rank-order correlation between editing features and video popularity was negligible (τ = 0.097, p = 0.005).
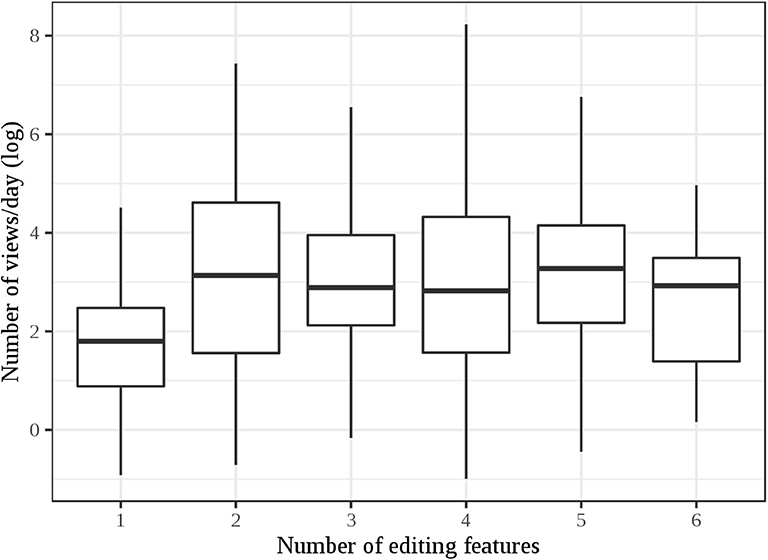
Figure 3. Number of views per day (log) x editing features.
Figure 4 shows that most videos have up to 25 min of total length, a bracket that also concentrates most video views. Most videos that venture longer than that get fewer views (except some videos in the upper right part of the graph, which represent video footage of a famous podcast on History and international politics).
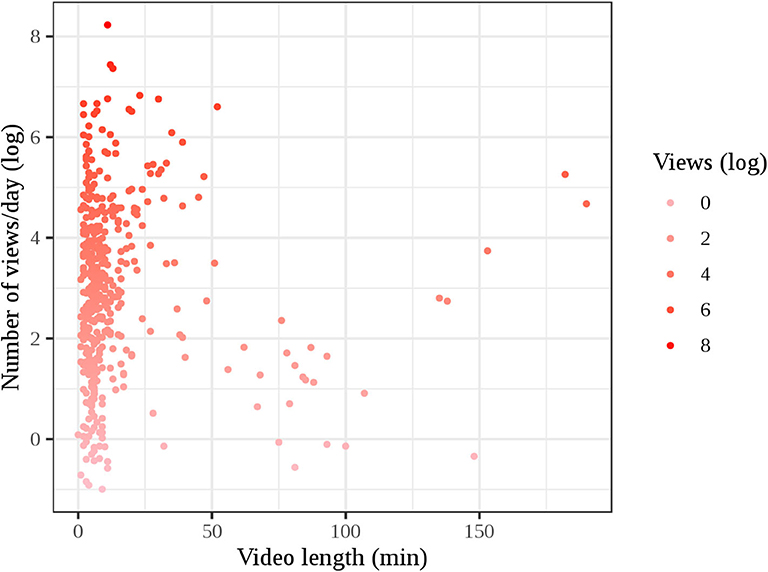
Figure 4. Number of views per day (log) x video length (min).
We observed that the length of each format varied substantially. Vlogs have an average of 10′24″, while animation videos were 3′51″ long. Hangouts and live group conversations were the longest formats, with averages 68′ and 60′, respectively. Short documentaries were on average 6′46″ long, while interviews lasted an average of 12′15″. Pearson's correlation (r) was used to examine the relationship between popularity of the video and video length, and indicated that the correlation was not statistically significant (r = 0.005, p = 0.923).
Most videos did not receive a large number either of likes or comments. As seen in Figures 5, 6, there was a moderate positive correlation between number of views and likes (r = 0.430, p < 0.001) and a negligible positive correlation between views and comments (r = 0.254, p < 0.001).
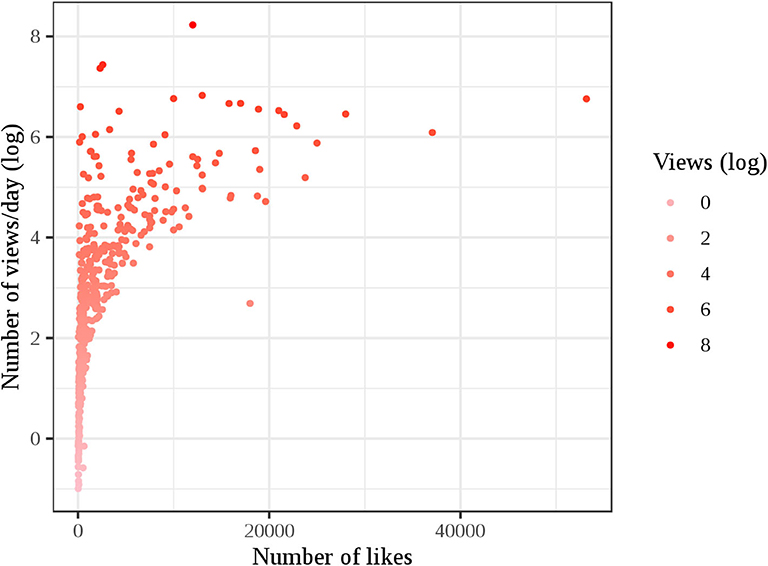
Figure 5. Number of views (log) x number of likes.
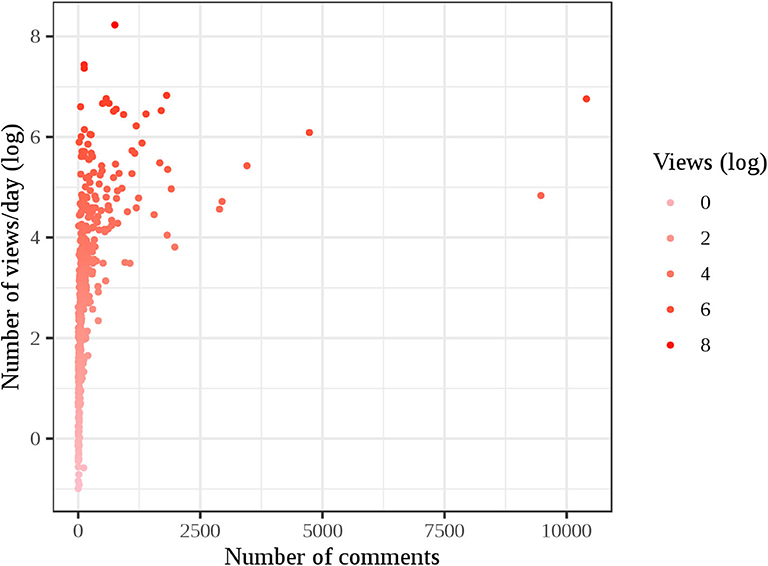
Figure 6. Number of views (log) x number of comments.
According to Figure 7, most video views appear concentrated in videos that were recently released, while older videos tend to have slightly fewer views. The video views were negligible negative correlated with the video age (r = −0.208, p < 0.001).
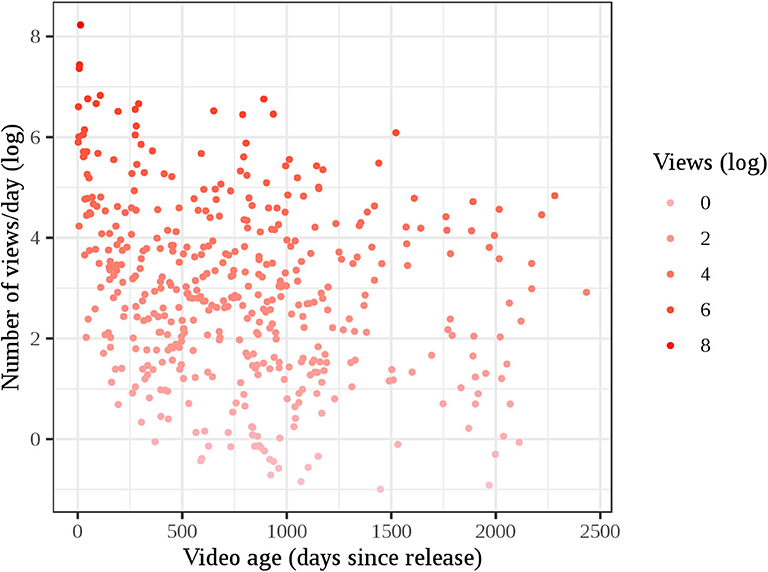
Figure 7. Number of views per day (log) x video age (days).
Most views/day are concentrated in channels that do not produce more than five videos per month, as Figure 8 shows. The video views were negligible positive correlated with the channel productivity (r = 0.102, p = 0.032). It is worth noticing that this variable does not reflect the variations in productivity of each channel throughout time.
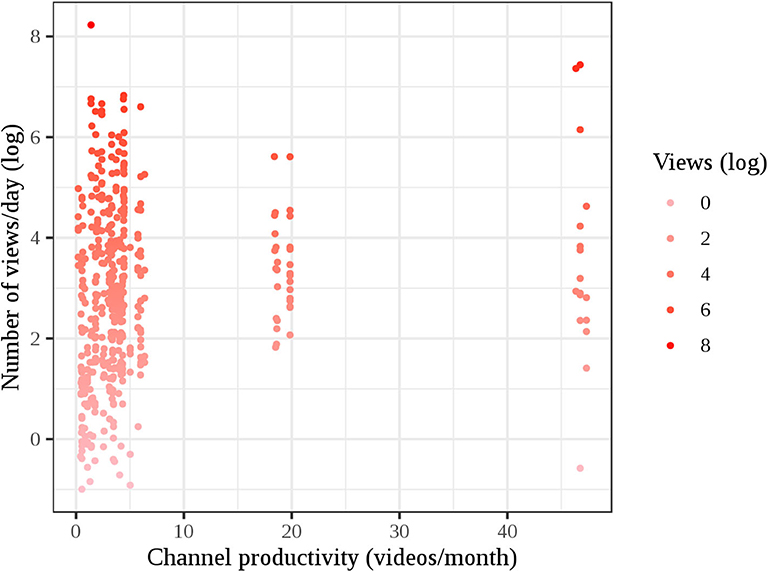
Figure 8. Number of views per day (log) x channel productivity.
The highest correlation registered in this study was the one regarding video views and the channels to which they belong (0.746). As seen in Figure 9, there is a big variability in average video views among the channels. The four channels that concentrate most of the views are Ciência Todo Dia (CT), Canal do Pirula (CP), Papo de Biólogo (PB) and Minuto da Terra (MT). Channels with the least popular videos were Boteco Behaviorista, (BB), Jornal Ciensacional (JC) and Canal Zoa (CZ). The complete list with all the channel names can be found in the Supplementary Material.
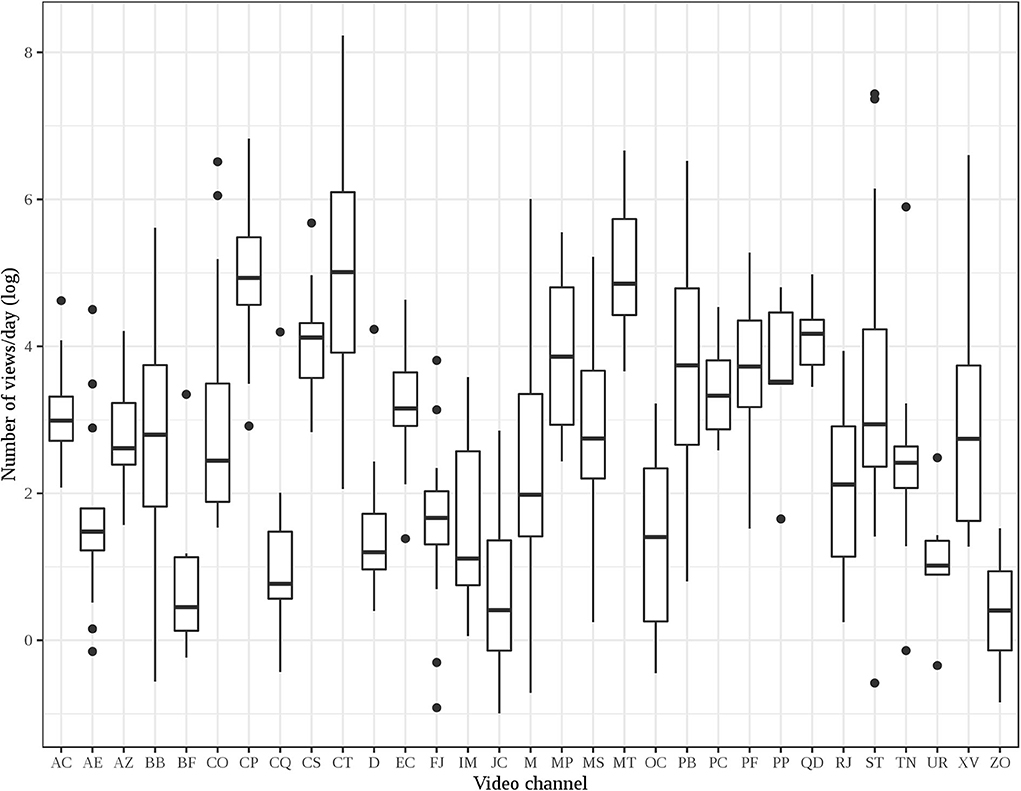
Figure 9. Number of views per day (log) x channel (dots refer to outliers).
Inferential Analysis
We performed a logarithmic transformation in the response variable in all analyses to obtain a normal and homoscedastic model. We then built a multiple linear regression model for the relationship between ln(Yi) and the independent variables:
in which all the elements mean the same as given in the section Design and Methods.
After fitted the complete model, a study of variable selection was performed using the Stepwise method (Hocking, 1976), in order to obtain a reduced model with the significant variables to explain the variables of interest. The reduced model reads as follows:
where “format2” represents the recategorized format variable, in which the observations of categories 3 (short documentary or reportage), 6 (live conversations) and 7 (commented video) were joined to category 1 (vlog). Since the behavior of these formats was not statistically different from the behavior of vlogs regarding popularity.
Table 1 shows that the intercept and the variables number of likes (β1), productivity (β2), video age (β3), and video format (αj) were significant to describe the independent variable. The average number of views per day expected of our “benchmark video” (β0) – a video in vlog format, with zero likes and minimal channel productivity and minimal video age and length – is of exp(2.978) = 19.65 views. For each extra like in the video, keeping all other variables stable, the multiplicative factor in the number of views/day is of exp(0.000) = 1. Likewise, for each additional unit added to the variables productivity and video age there is a multiplicative impact in the number of views/day of exp(0.015) = 1. 15 and exp(−0.001) = 0.999, respectively. As for the variable video format, and noting that all the formats here must be read in comparison with format α0 (the vlog format), so that α1 = interview, α3 = hangouts, α4 = animations and α7 = talk, we observed that all these formats had some effect over popularity. Videos featuring interviews, hangouts and talk had a negative impact over video popularity, as comparing them with the popularity of vlogs, while animations had a positive impact, exp(0.992) = 2.697, over popularity.
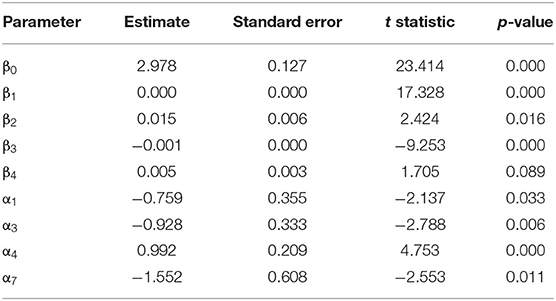
Table 1. Results of the final normal model.
Discussion and Conclusions
When examined individually, some factors seem to have more influence on video popularity than others. Only three correlation indexes were somewhat strong in the descriptive analysis: number of comments (0.363), number of likes (0.604), and channel (0.746). The inferential analysis showed that only the number of likes, channel productivity, video age and some video formats had predictive effect over video popularity. This difference of relevant factors happens because, in the descriptive analyses, the relationship of each factor with video popularity is analyzed individually and undisturbed by other factors; in the inferential analysis, however, the effects of different variables can potentialize or mask the effect of other factors, and so the effects change. In this section, we briefly discuss the most important results of the study, starting by the ones that could predict video popularity.
Likes and comments showed a strong correlation with popularity. This makes sense, since engagement rates, partially composed by engagement metrics as likes and comments, are directly used by YouTube's searching and ranking algorithms (Covington et al., 2016). This likes-views dependence generates the rich-get-richer effect, that boosts videos with an initial high number of likes. Next in order is the strong correlation of popularity and channel productivity. Channel productivity may be important for beginner channels to reach the 4,000 h of watch time and become profitable; and for all channels to increase watch time stats and become more relevant on the platform. YouTube's official blog recommends that users only post quality content as a way of increasing views and watch time (Woicicki, 2019), but it seems logical that the bigger the amount of videos in a channel the audience can choose from, the bigger the channel's chances to obtain watch time. There is also the novelty factor: novel videos are more guaranteed to obtain attention than older videos (even more so if they are also topical), and channels that are constantly generating novel and topical content can become a recognized source of information or entertainment, a go-to source when the viewer wants information of some sort.
Regarding video age, the third predictive variable, it seems that newer science videos received slightly more attention – were more popular – than old videos. For this, we have two possible explanations. Firstly, some older channels favored unpopular formats and stopped producing videos long ago. Jornal Ciensacional, for example, started producing interview and science news videos in 2012 and posted at an uneven pace until 2017, when the last video was released. Quer que desenhe produced animations about science for 2 years and stopped all production in 2015. Universo Racionalista, launched in 2015, posted hangouts irregularly (one gap in posting lasted about a year) and produced very few videos. Older videos from these channels were not attractive because of the format, and these channels' low productivity probably hindered YouTube's algorithms from recommending them. Another possible explanation is that the newest videos of our sample were produced by long-running channels that posted regularly and had time to build an audience and experience with video popularity to obtain more views, such as Space Today (launched in 2015), Xadrez Verbal (launched in 2013), Ciência Todo Dia (launched in 2012) and Papo de Biólogo (launched in 2014).
We found some video formats to be significant to the general popularity. Videos featuring interviews and hangouts were shown as tending to be to be less popular than vlogs, while animations tended to be more popular. The most often observed formats in this work – vlogs, short documentaries and animations – were also identified as dominant in other works, such as Morcillo et al. (2016) and Ervitti (2018). The vlog is considered a YouTube-native genre, and is by far one of the most used formats in user-generated videos, requiring (but not restricted to) very little editing.
We could also identify trends about factors that did not seem to affect video popularity. For example, it is not difficult to imagine why interdisciplinary videos exhibited more views/day: they have a broader audience than specialized videos; besides, they are also topical, frequently touching on political themes and current affairs. Interdisciplinary videos also presented the biggest variation in popularity. This probably relates to the fact that almost all channels have produced interdisciplinary videos, with more or less success. This means that the variations in popularity do not depend on a specific group of channels that always produces such videos, but on some videos of all channels. We also noted that videos on Earth and Exact Sciences were very popular (second place in general popularity, right after interdisciplinary videos), although they were the fourth most observed videos after the categories Interdisciplinary, Biological Sciences and Humanities. This could reflect a popular preference, but also the fact that most of such videos come from a small group of broadly successful channels that are good either at producing most watched videos (Ciência Todo Dia), or that have a high productivity rate (Space Today). Coincidentally, these channels produce either a good amount or all or all of their videos about Astronomy and space exploration. Health Sciences and Engineering were themes observed in <15 videos each. Various channels did produce videos on Health Sciences, but Engineering videos came mostly from the channel Peixe Babel, hosted by two women. The little popularity of Engineering videos could be an effect of the small number of videos in the sample, but also to the fact that female science video hosts generally receive less views on YouTube, a phenomenon already referenced elsewhere (Thelwall and Mas-Bleda, 2018).
The four channels that concentrate most of the views – Ciência Todo Dia (CT), Canal do Pirulla (CP), Papo de Biólogo (PB) and Minuto da Terra (MT) – are good representatives of science channel with well-defined characteristics, that concentrate videos with patterns of theme, length, format, and productivity that were shown to be correlated to popularity. Ciência Todo Dia, for example, is a channel mostly about Astronomy, concepts in physics and space exploration. Almost all videos produced by CT are vlogs and are 7′38″ in length, and video productivity between 1.39 and 1.46 videos per month. Papo de Biólogo, on the other hand, is a channel that produces between 2.08 and 2.38 videos per month and is dedicated to presenting the habits and anatomy of wild and exotic animals in vlogs and small documentaries that are 6′41″ in length. Minute Earth is an interdisciplinary channel by design, producing an average of 2.83 videos per month that answer a variety of questions from a scientific standpoint using animation. The videos are 2′4″ long on average. Canal do Pirulla's host produces vlogs that are a mix of pure Biology videos and (a majority of) well-researched content about current affairs. His videos are fairly long, averaging 22′32″, and he produces between 4.4 and 4.6 videos per month. Taken together, all of these channels produce videos in mostly in successful formats (vlogs, animations and short documentaries) about the most popular themes in the length gap where most views/day are located. The variable productivity showed a big variation here, but it must be mentioned that it was made to reflect the average productivity of the entire productive life of the channel, not necessarily indicating how productive the channel was, say, in the last 3 or 6 months.
On the other hand, channels with the least popular videos (Boteco Behaviorista, Jornal Ciensacional and Canal Zoa) concentrated features that attracted fewer viewers. Boteco Behaviorista is a channel that features hangouts (online conversations) between several psychology researchers and guests both about current events and within the psychology field. The videos are 79′36″ long in average, and the channel produces an average of 1 video per month. Jornal Ciensacional was mostly dedicated to reporting news about science in interviews and short documentaries in videos about 7′02″ long. It has stopped producing videos in 2017, but until then it had produced <1 video per month. Zoa is a special case: as mentioned before, it reposted video footage of a TV show about science, presented by the channel's host, while also producing homemade videos. The videos were 3′04″ on average, and the channel produced around 1.35 videos per month. These channels produced mostly videos on the formats interviews, hangouts and late night TV show (channel Zoa), had low overall productivity, with long gaps in production, and concentrated on producing news. Videos on news become old very quickly, and if the channel does not keep a high productivity rate, they do not fare well. Lastly, video length may also have been an obstacle for popularity: hangouts, if not edited enough, tend to be tiresome to watch, as is the case of BB's videos. The same can be said about medium-sized little edited interviews (as in JS).
Limitations and Directions for Future Research
This study contains some limitations. Among them are:
* Bias in video categorization – since only one researcher carried out the video categorization in themes and formats, it is possible that such labeling is biased.
* Variable construction – variables, such as video theme and video editing techniques, could be constructed in ways that allowed for more information. For example, it could be valuable for a descriptive work to note also the video's specific subject and how often it used certain editing features.
* Incompleteness of the model – we considered only a small group of factors that could potentially influence video popularity, and we knowingly left out many that would also be relevant. We did so by time constraints and practicality. By no means we regard this study as exhaustive work on the possible factors affecting video popularity.
* Distortion in the view count – in the study, we considered videos that were produced at any moment in time, including very recent ones. View counts for such videos could be distorted, since there was not enough days for their views to be divided by. This means they could be regarded as more popular than they really are, and channels that produced them more popular as well. On the other hand, this distortion could be compensated by the fact that videos were selected semi-randomly, which reduces the effect of this potential distortion.
Although the scholarship on online science videos has grown in the last few years, many questions regarding video popularity on YouTube are still unanswered (and some, that touch on the functioning of algorithms, will probably remain so). For example, it is not yet entirely clear how the interplay between elements such as number of views, likes and comments functions on YouTube. To which measure is the number of views also causing the numbers of likes and comments to rise? Some other interesting research topics regard the audiences: who are the people who consume science videos? What type of science videos each profile prefers to watch? Also, how much do science videos contribute to different types of science education and to the change of attitudes on scientific issues? These and many other questions will occupy researchers' minds in the years to come.
Data Availability Statement
The raw data can be obtained upon request to the corresponding author.
Author Contributions
RV reviewed and selected the factors according to the literature, collected and cleaned the data, and wrote the manuscript and the references. AM performed the inferential and descriptive analysis in consultation with CA, produced all the figures and tables, and reviewed the manuscript. CA offered expertise in the sampling, analysing processes, and also reviewed the manuscript. All authors contributed to the article and approved the submitted version.
Funding
This article is the result of a masters thesis that was funded by the agency CAPES (Coordination for the Improvement of Higher Education Personnel). Grant number 1686032.
Conflict of Interest
The authors declare that the research was conducted in the absence of any commercial or financial relationships that could be construed as a potential conflict of interest.
Supplementary Material
The Supplementary Material for this article can be found online at: https://www.frontiersin.org/articles/10.3389/fcomm.2020.567606/full#supplementary-material
References
Alexa (2020). The Top 500 Sites on the Web. Available online at: https://www.alexa.com/topsites (accessed March 20, 2020).
Alexander, J. (2020). YouTube Videos Keep Getting Longer. Available online at: https://www.theverge.com/2019/7/26/8888003/youtube-video-length-contrapoints-lindsay-ellis-shelby-church-ad-revenue (accessed March 20, 2020).
Allgaier, J. (2016). “Science on YouTube: what do people find when they are searching for climate science and climate manipulation?” in 14th International Conference on Public Communication of Science and Technology (PCST) (Istanbul). Available online at: https://pcst.co/archive/ (accessed March 12, 2020).
Allgaier, J. (2019.) “Science and medicine on youtube,” in Second International Handbook of Internet Research Hunsinger, eds J. Allen and L. Klastrup (Dordrecht: Springer).
Anderson, A., Brossard, D., and Scheufele, D. (2010). The changing information environment for nanotechnology: online audiences and content. J. Nanopart. Res. 12, 1083–94. doi: 10.1007/s11051-010-9860-2
Bärtl, M. (2018). YouTube channels, uploads and views: A statistical analysis of the past 10 years. Convergence 24:1. doi: 10.1177/1354856517736979
Borghol, Y., Ardon, S., Carlsson, N., Eager, D., and Mahanti, A. (2012). “The untold story of the clones: content-agnostic factors that impact youtube video popularity,” in 18th ACM SIGKDD International Conference on Knowledge Discovery and Data Mining. Available online at: https://arxiv.org/abs/1311.6526 (accessed March 15, 2020).
Brossard, D., and Scheufele, D. (2013). Science, new media and the public. Science 339, 40–41. doi: 10.1126/science.1232329
Cha, M., Kwak, H., Rodriguez, P., Ahnt, Y., and Moon, S. (2007). “I tube,youtube, everybody tubes: analyzing the world's largest user generated content video system,” in Proc. ACM Internet Measurement Conference IMC (San Diego, CA).
Cooper, P. (2019). 23 YouTube Statistics that Matter to Marketers in 2020. Hootsuite blog. Available online at: https://blog.hootsuite.com/youtube-stats-marketers/ (accessed September 11, 2020).
Cooper, P. (2020). How does the YouTube algorithm work? A guide to getting more views. Hootsuite blog. Available online at: https://blog.hootsuite.com/how-the-youtube-algorithm-works/ (accessed September 11, 2020).
Covington, P., Adams, J., and Sargin, E. (2016). “Deep neural networks for youtube recommendations,” in 10th ACM Conference on Recommender Systems, ACM (Boston, MA). Available online at: https://ai.google/research/pubs/pub45530 (accessed March 11, 2020).
De Lara, A., García-Avilés, J., and Revuelta, G. (2017). Online video on climate change: a comparison between television and web formats. JCOM 16:1. doi: 10.22323/2.16010204
Ervitti, M. (2018). “Producing science online video,” in Communicating Science and Technology through Online Video, eds B. León and M. Bourk (New York, NY: Routledge).
Figueiredo, F., Almeida, J., Benevenuto, F., and Gummadi, J. (2014). “Does content determine information popularity in social media? A case study of youtube videos' content and their popularity,” in SIGCHI Conference on Human Factors in Computing Systems (Toronto, ON). Available online at https://dl.acm.org/citation.cfm?id=2557285&dl=ACM&coll=DL (accessed March 12, 2020).
Fletcher, R. (2016). The Public and News about the Environment. Reuters Institute/University of Oxford. Available online at: http://www.digitalnewsreport.org/essays/2016/public-news-environment/ (accessed March 13, 2020).
Fox, S., and Duggan, M. (2013) Health Online 2013. Pew Research Center. Available online at: https://www.pewresearch.org/internet/2013/01/15/health-online-2013/ (accessed March 20, 2020).
García-Avilés, A., and de Lara, A. (2018). “An investigation of science online video: designing a classification of formats,” in Communicating Science and Technology Through Online Video, eds B. León and M. Bourk (New York, NY; London: Routledge Focus).
Garg, N., Venkatraman, A, Pandey, A, and Kumar, N. (2015). YouTube as a source of information on dialysis: a content analysis. Nephrology. 20:315–320. doi: 10.1111/nep.12397
Hocking, R. R. (1976). A Biometrics invited paper. The analysis and selection of variables in linear regression. Biometrics 32, 1–49.
Keelan, J, Pavri-Garcia, V, Tomlinson, G, and Wilson, K. (2007). YouTube as a source of information on immunization: acontent analysis. JAMA 298, 2482–2484. doi: 10.1001/jama.298.21.2482
Kessel, P., Toor, S., and Smith, A. (2019). A Week in the Life of Popular YouTube Channels. Available online at https://www.pewresearch.org/internet/wp-content/uploads/sites/9/2019/07/DL_2019.07.25_YouTube-Channels_FINAL.pdf (accessed March 20, 2020).
Lewis, P. (2018). Fiction is Outperforming Reality: How YouTube's Algorithm Distorts the Truth. Available online at: https://www.theguardian.com/technology/2018/feb/02/how-youtubes-algorithm-distorts-truth (accessed March 12, 2020).
Lopezosa, C., Orduna-Malea, E., and Pérez-Montoro, M. (2020). Making video news visible: identifying the optimization strategies of the cybermedia on youtube using web metrics. J. Pract. 14:4. doi: 10.1080/17512786.2019.1628657
Ma, J., Almanza, B., Ghiselli, R., Vorvonearu, M., and Sydnor, S. (2017). Food safety information on the internet: Consumer media preferences. Food Protect. Trends 37, 247–255.
Metz, C. (2016). The Year that Deep Learning Took Over the Internet. Available online at: https://www.wired.com/2016/12/2016-year-deep-learning-took-internet/ (accessed March 20, 2020).
Microsoft Corp (2015). Attention Spans: Consumer Insights, Microsoft Canada. Available online at: https://dl.motamem.org/microsoft-attention-spans-research-report.pdf (accessed september 11, 2020).
Mohan, N., and Kyncl, R. (2018). Additional Changes to the YouTube Partner Program (YPP) to Better Protect Creators. Available online at: https://youtube-creators.googleblog.com/2018/01/additional-changes-to-youtube-partner.html (accessed March 20, 2020).
Morcillo, J, Czurda, K., and Trotha, R. (2016) Typologies of the popular science web video. J. Sci. Commun. 15:4. doi: 10.22323/2.15040202
Mostrous, A. (2017). Big Brands Fund Terror Through Online Adverts. Available online at: https://www.thetimes.co.uk/article/big-brands-fund-terror-knnxfgb98 (accessed March 17, 2020).
Mukaka, M. (2012). Statistics corner: a guide to appropriate use of correlation coefficient in medical research. Malawi Med. J. 3, 69–71. doi: 10.4314/mmj.v24i3
Pedersen, M. (2015). Best Practice: What is the Optimal Length for Video Content? AdAge. Available online at https://adage.com/article/digitalnext/optimal-length-video-content/299386 (accessed March 12, 2020).
Rieder, B., Matamoros-Fernández, A., and Coromina, Ò. (2018). From ranking algorithms to ‘ranking cultures': Investigating the modulation of visibility in YouTube search results. Convergence 24, 50–68. doi: 10.1177/1354856517736982
Roose, K. (2018) YouTube's Product Chief on Online Radicalization and Algorithmic Rabbit Holes. The New York Times. Available online at: https://www.nytimes.com/2019/03/29/technology/youtube-online-extremism.html (accessed March 12, 2020).
Scheufele, D., and Krause, N. (2019). Science audiences, misinformation, and fake news. PNAS 116, 7662–7669. doi: 10.1073/pnas.1805871115
Shapiro, M., and Park, H. (2018). Climate change and youtube: deliberation potential in post-video discussions. Environ. Commun. 12, 115–131. doi: 10.1080/17524032.2017.1289108
Smith, A., Toor, S., and van Kessel, P. (2018). Many Turn to YouTube for Children's Content, News, How-To Lessons. Available online at: https://www.pewresearch.org/internet/2018/11/07/many-turn-to-youtube-for-childrens-content-newshow-to-lessons/ (accessed March 20, 2020).
Solsman, J. (2018) YouTube's AI is the Puppet Master Over Most of What You Watch. Available online at: https://www.cnet.com/news/youtube-ces-2018-neal-mohan/ (accessed March 20, 2020).
Statista (2019). Average YouTube Video Length as of December 2018, by Category. Available online at: https://www.statista.com/statistics/1026923/youtube-video-category-average-length/ (accessed March 20, 2020).
Szabo, G., and Huberman, B. (2010). Predicting the popularity of online content. Commun. ACM 53:8. doi: 10.1145/1787234.1787254
Thelwall, M., and Mas-Bleda, A. (2018), YouTube science channel video presenters comments: female friendly or vestiges of sexism? Aslib J. Inform. Manage. 70, 28–46. doi: 10.1108/AJIM-09-2017-0204
Wardle, C., and Derakhshan, H. (2017). Information Disorder: Toward an Interdisciplinary Framework for Research and Policy Making. Council of Europe Report. Strasbourg: Council of Europe.
Welbourne, D., and Grant, W. (2015). Science communication on YouTube: factors that affect channel and video popularity. Pub. Understanding Sci. 25:6. doi: 10.1177/0963662515572068
Woicicki, S. (2019). Susan Wojcicki: Preserving Openness Through Responsibility. Available online at: https://youtube-creators.googleblog.com/2019/08/preserving-openness-through-responsibility.html (accessed March 15, 2020).
Keywords: youtube, video popularity, science communication, content analysis, statistical analysis, science videos, ScienceVlogs Brasil
Citation: Velho RM, Mendes AMF and Azevedo CLN (2020) Communicating Science With YouTube Videos: How Nine Factors Relate to and Affect Video Views. Front. Commun. 5:567606. doi: 10.3389/fcomm.2020.567606
Received: 30 May 2020; Accepted: 12 August 2020;
Published: 25 September 2020.
Edited by:
Asheley R. Landrum, Texas Tech University, United StatesReviewed by:
Bienvenido León, University of Navarra, SpainAndrew Maynard, Arizona State University, United States
Copyright © 2020 Velho, Mendes and Azevedo. This is an open-access article distributed under the terms of the Creative Commons Attribution License (CC BY). The use, distribution or reproduction in other forums is permitted, provided the original author(s) and the copyright owner(s) are credited and that the original publication in this journal is cited, in accordance with accepted academic practice. No use, distribution or reproduction is permitted which does not comply with these terms.
*Correspondence: Raphaela Martins Velho, raphaelavelho91@gmail.com